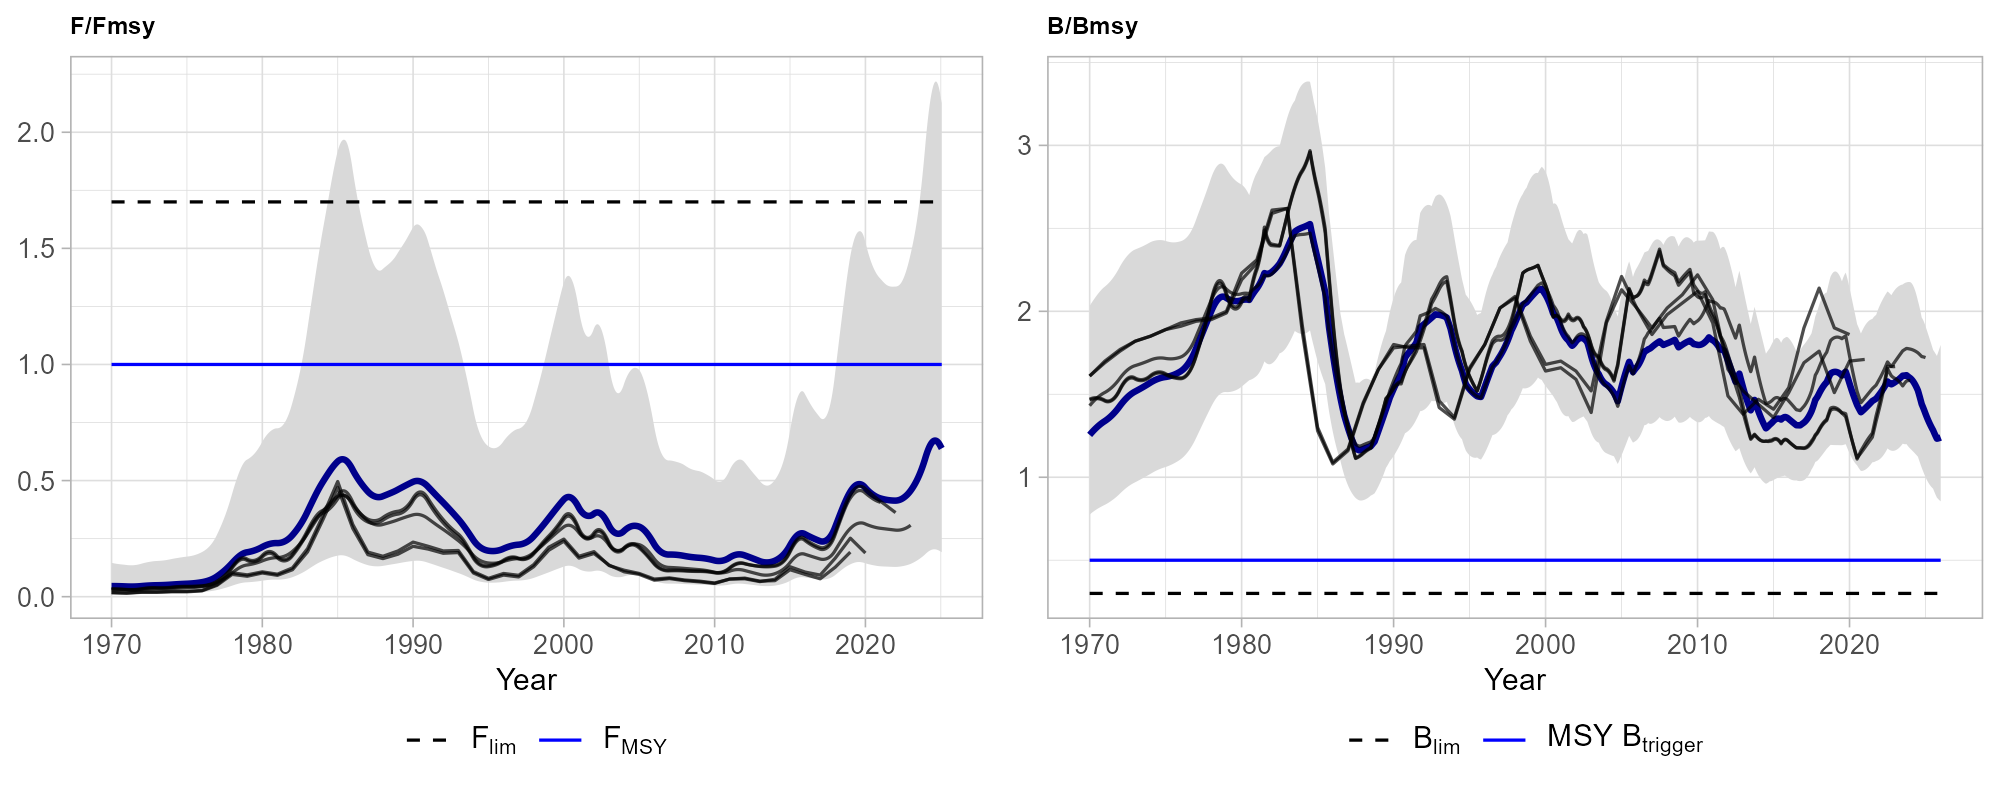
Figure 2: Historical assessment results for northern shrimp in ICES subareas 1 and 2. Trends of F/FMSY and B/BMSY as estimated in the past stock assessments in 2020 to 2024 (black lines show estimated mean) are compared with the current assessment (blue lines and shaded areas show estimated mean and 95% confidence intervals, respectively).