1 - Advice on fishing opportunities
The Institute of Marine Research (IMR) advises that when the MSY approach is applied, catches of northern shrimp in the Barents Sea in 2026 should not exceed 83 000 tonnes.
2 - Stock development over time
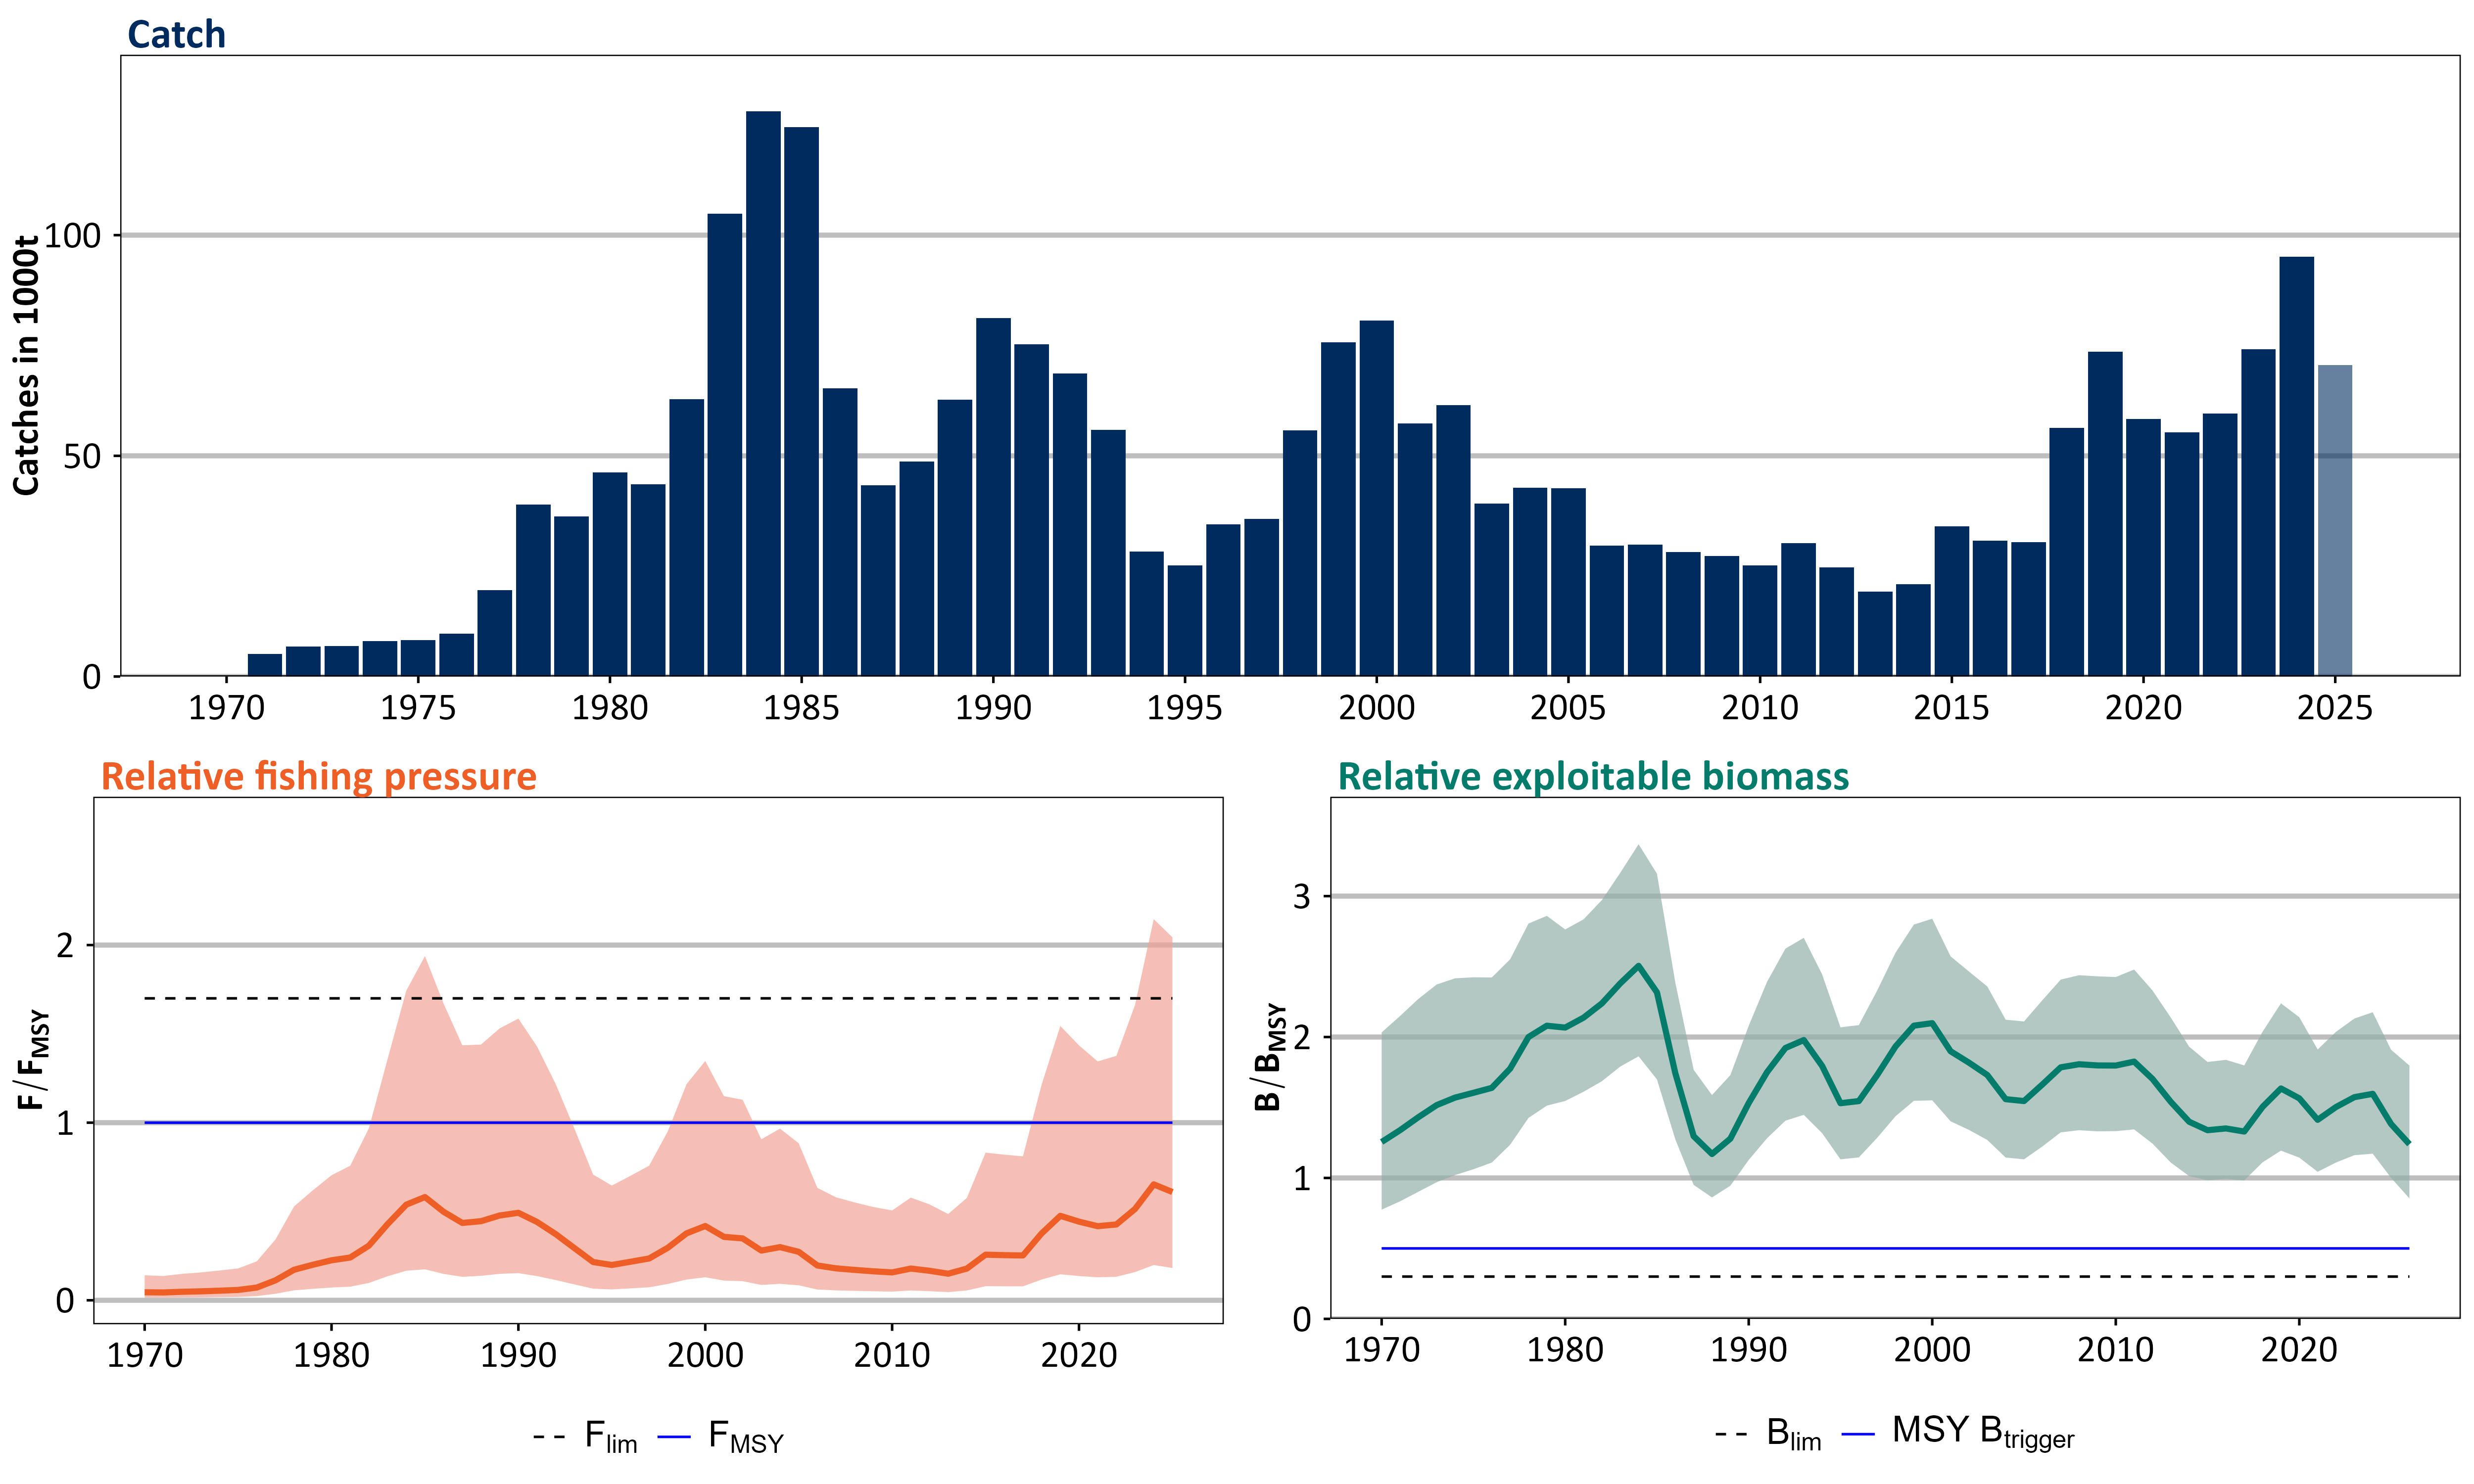
Exploitable stock biomass has remained above MSY Btrigger and Blim throughout the entire time series (Figure 1). Fishing pressure on the stock has been estimated below FMSY and Flim, with a low probability of exceeding FMSY in 2025.
3 - Catch scenarios
| Variable | Value | Notes |
|---|---|---|
| F2025 /FMSY | 0.61 | Corresponds to the predicted catch in 2025 |
| B2026 /BMSY | 1.24 | Short-term forecast (STF) |
| Catch 2025 | 71 | Catch in thousand tonnes. Based on preliminary catch data (Norway) + average catches from other fleets in 2022-2024 |
| Scenario | Catch (2026) | B2027 /BMSY | F2026 /FMSY | % risk of B2027 < MSY Btrigger | % risk of F2026 > BMSY | % risk of F2026 > Flim |
|---|---|---|---|---|---|---|
| MSY approach* | 83 | 1.25 | 0.71 | <0.1 | 30 | 9.2 |
| F2026 = FMSY | 113 | 1.20 | 1.00 | <0.1 | 50 | 21 |
| F2026 = F2025 | 68 | 1.28 | 0.58 | <0.1 | 20 | 5 |
| F2026 = 0 | 0 | 1.39 | 0.00 | <0.1 | <0.1 | <0.1 |
| *Using the fractile rule with 35th percentiles of F/FMSY and B/BMSY distributions and the catch distribution under F=FMSY | ||||||
The substantial decrease in catch advice was caused by strong negative signals of both stock indices after a peak in catches in 2024. Following high catch advice in previous years that reflected the perceived large stock biomass, the current catch advice is more in line with long-term catches expected under a precautionary MSY approach.
4 - Basis of the advice
| Advice basis | MSY approach using 35th percentiles of fishing mortality, exploitable biomass and catch. |
| Management plan | No agreed precautionary management plan for northern shrimp in this area. |
5 - Quality of assessment
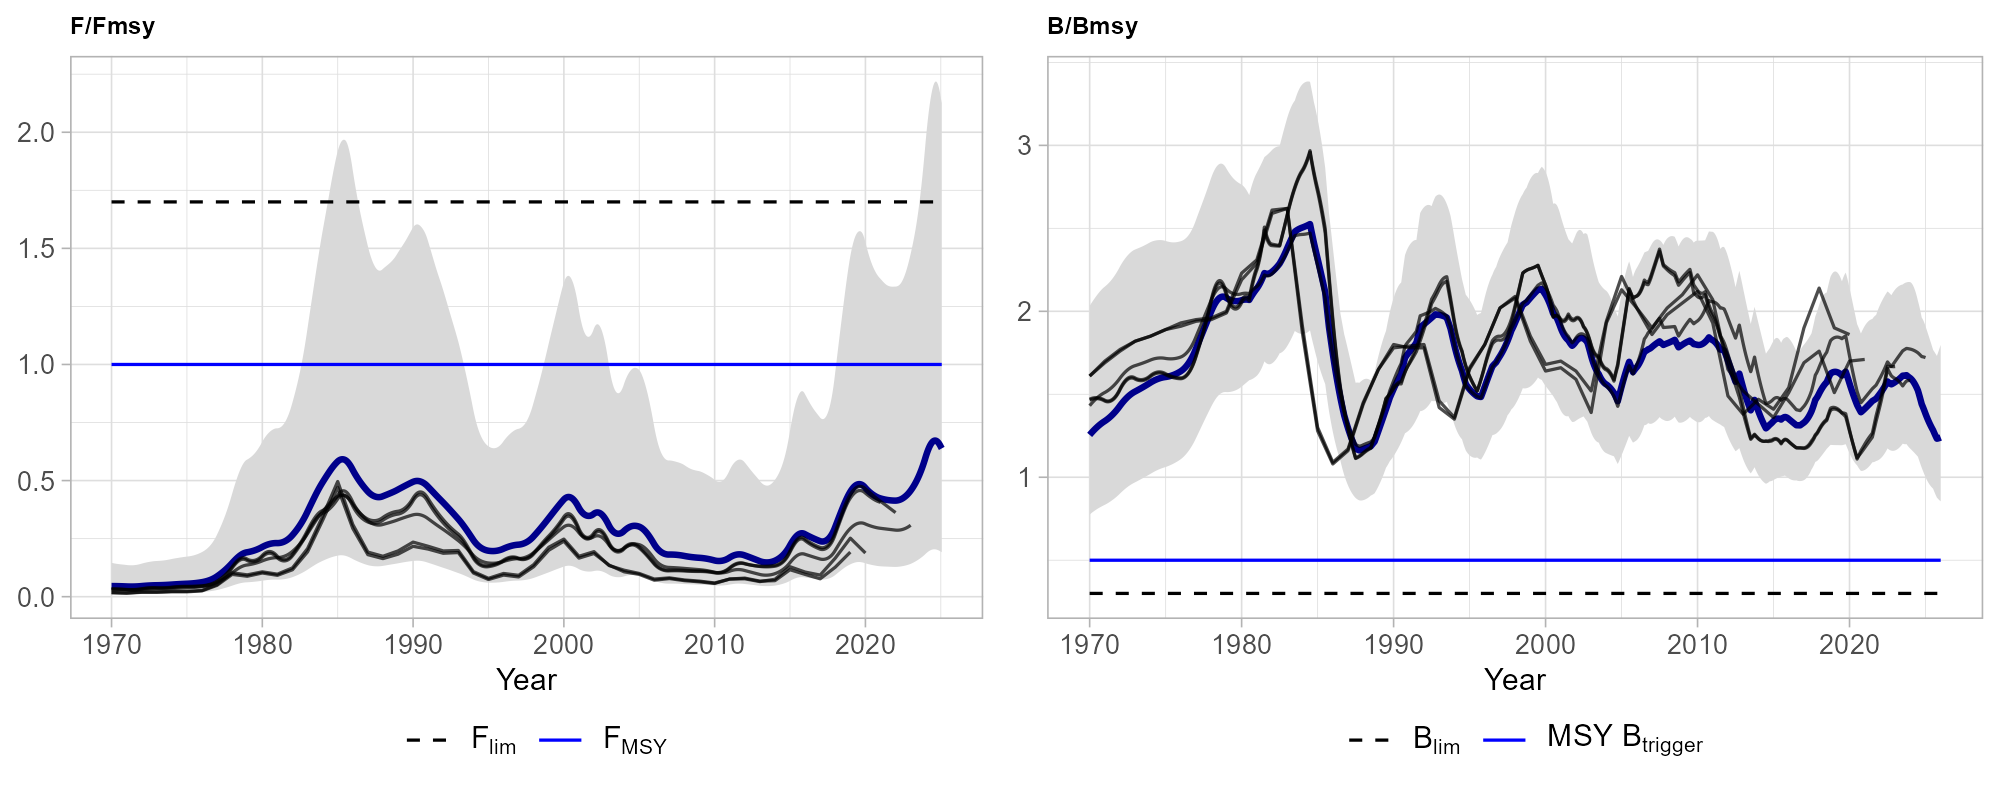
In the 2024 assessment, the issue of negligible weight of the survey indices (ICES, 2022) on the stock estimates was addressed by incorporating the estimated uncertainty of the stock indices as observation error priors (Zimmermann et al., 2024). This caused the stock trends to follow the survey indices more closely, resulting in shifted and slightly less pronounced fluctuations compared to previous assessments (Figure 2). However, compared to previous assessments the change did not affect the perception of the state of the stock or catch advice. The current assessment is in line with last year’s revised assessment.
The strong dependency on the commercial CPUE index was considered a major remaining issue after the benchmark. The revision in 2024 was therefore considered an improvement that likely reflects the development of the stock better by linking it more closely to the ecosystem survey in the Barents Sea that covers the entire stock area. The standardization of the CPUE index remains a concern, specifically whether technological creep and spatial contractions of the fishery over more than 40 years are sufficiently accounted for. Preliminary analysis with a revised standardization model that includes spatio-temporal correlation indicated significant sensitivity of the CPUE index and its effect on the assessment estimate to spatial model assumptions, calling for a method evaluation in 2026.
Sensitivity analysis showed that the priors have little impact on the perception of stock state and advice. However, the current configuration with informative priors results in some sensitivity to the underlying assumptions, especially on carrying capacity. The validity of these assumptions should be re-evaluated regularly. More contrast in the input time series might help to decrease the dependency on priors in the future.
6 - Issues relevant for the advice
There is currently no total allowable catch for the stock and catches are therefore largely unrestricted. Changes in catches over time are assumed to follow mostly economic drivers (Lancker et al., 2023), including decreases in other major fisheries such as Atlantic cod in the Barents Sea. A harvest control rule for a common management strategy was presented in 2024 (Trochta et al., 2024) but so far not implemented.
Surplus production models assess only the exploitable biomass and therefore lack information on recruitment and other drivers of stock fluctuations. Information on size composition and recruitment should be considered as auxiliary indicators of the stock development.
7 - Reference points
Table 4: Northern shrimp in ICES subareas 1 and 2. Reference points, values, and their technical basis.
|
Framework |
Reference points |
Value* |
Technical basis |
|
MSY approach |
MSY Btrigger |
B/BMSY = 0.5 |
Relative value from the SPiCT model. Reference points are estimated directly from the SPiCT assessment model and change when the assessment is updated. |
|
FMSY |
F/FMSY = 1 |
||
|
Precautionary approach |
Blim |
B/BMSY = 0.3 |
|
|
Flim |
F/FMSY = 1.7 |
||
|
*No reference points are defined for this stock in terms of absolute values. The SPiCT-estimated values of the ratios F/FMSY and B/BMSY are used to estimate stock status relative to the MSY reference points. |
|||
8 - Basis of the assessment
| Assessment type | Surplus production in continuous time (SPiCT) |
| Input data | Fishery catches (1970—2025); two survey indices: the combined Norwegian and Russian shrimp surveys (1984—2002) and the Norwegian/Russian ecosystem survey (2004—2025); one fishery-based index (standardized CPUE from Norwegian logbooks) (1980—2025). |
| Discards and bycatch | Discarding is considered to be negligible. |
| Indicators | Standardized CPUE index from the Russian fleet; recruitment and length indices from the Norwegian/Russian ecosystem survey (2004—2025). |
| Other information | None |
9 - History of the advice, catch, and management
| Year | Advice | Catch corresponding to advice | Agreed TAC | Total catch |
|---|---|---|---|---|
| 2005 | No increase compared to 2004 | 43 600 | - | 42618 |
| 2006 | No increase in catch above recent level | 40 000 | - | 29627 |
| 2007 | Catch that will prevent exceeding Flim in the long term | 50 000 | - | 29931 |
| 2008 | Catch that will prevent exceeding Flim in the long term | 50 000 | - | 28188 |
| 2009 | Catch that will prevent exceeding Flim in the long term | 50 000 | - | 27272 |
| 2010 | Catch that will prevent exceeding Flim in the long term | 50 000 | - | 25198 |
| 2011 | Catch that will prevent exceeding FMSY in the long term | 60 000 | - | 30226 |
| 2012 | Catch that will prevent exceeding FMSY in the long term | 60 000 | - | 24756 |
| 2013 | Catch that will maintain stock at current high biomass | 60 000 | - | 19249 |
| 2014 | No new advice, same as for 2013 | 60 000 | - | 20964 |
| 2015 | Move exploitation towards FMSY | < 70 000 | - | 34022 |
| 2016 | Move exploitation towards FMSY | < 70 000 | - | 30749 |
| 2017 | Move exploitation towards FMSY | ≤ 70 000 | - | 30442 |
| 2018 | Move exploitation towards FMSY | ≤ 70 000 | - | 56341 |
| 2019 | Move exploitation towards FMSY | ≤ 70 000 | - | 73582 |
| 2020 | MSY approach: mode of the FMSY distribution as basis of advice | ≤ 150 000 | - | 58380 |
| 2021 | MSY approach: mode of the FMSY distribution as basis of advice | ≤ 140 000 | - | 55355 |
| 2022 | MSY approach: mode of the FMSY distribution as basis of advice | ≤ 140 000 | - | 59580 |
| 2023 | MSY approach: mode of the FMSY distribution as basis of advice | ≤ 156 000 | - | 74185 |
| 2024 | MSY approach: mode of the FMSY distribution as basis of advice | ≤ 143 000 | - | 95164 |
| 2025 | MSY approach: 35th fractiles of B/BMSY, F/FMSY and catch distributions as basis of advice | ≤ 150 000 | - | |
| 2026 | MSY approach: 35th fractiles of B/BMSY, F/FMSY and catch distributions as basis of advice | ≤ 83 000 | - |
10 - History of the catch and landings
| Year | Norway | Russia | EU | Greenland | Faroes | Iceland | United Kingdom | Others/unknown |
|---|---|---|---|---|---|---|---|---|
| 1970 | 5508 | 0 | ||||||
| 1971 | 5116 | 26 | ||||||
| 1972 | 6772 | 0 | ||||||
| 1973 | 6921 | 0 | ||||||
| 1974 | 8008 | 0 | ||||||
| 1975 | 8197 | 2 | ||||||
| 1976 | 9752 | 0 | ||||||
| 1977 | 14700 | 4854 | ||||||
| 1978 | 20484 | 18270 | 189 | |||||
| 1979 | 25435 | 10474 | 390 | |||||
| 1980 | 35061 | 11219 | 0 | |||||
| 1981 | 32713 | 9886 | 1011 | |||||
| 1982 | 43451 | 15552 | 3835 | |||||
| 1983 | 70798 | 29105 | 4903 | |||||
| 1984 | 76636 | 43180 | 8246 | |||||
| 1985 | 82123 | 32104 | 10262 | |||||
| 1986 | 48569 | 10216 | 6538 | |||||
| 1987 | 31353 | 6690 | 5324 | |||||
| 1988 | 32021 | 12320 | 4348 | |||||
| 1989 | 47064 | 12252 | 3432 | |||||
| 1990 | 54182 | 20295 | 6687 | |||||
| 1991 | 39663 | 29434 | 6156 | |||||
| 1992 | 39657 | 20944 | 8021 | |||||
| 1993 | 32663 | 22397 | 806 | |||||
| 1994 | 20162 | 7108 | 1063 | |||||
| 1995 | 19337 | 3564 | 2319 | |||||
| 1996 | 25445 | 5747 | 3320 | |||||
| 1997 | 29079 | 1493 | 5163 | |||||
| 1998 | 44792 | 4895 | 6103 | |||||
| 1999 | 52612 | 10765 | 12293 | |||||
| 2000 | 55333 | 19596 | 5768 | |||||
| 2001 | 43031 | 5846 | 8408 | |||||
| 2002 | 48799 | 3790 | 8899 | |||||
| 2003 | 34172 | 2776 | 2277 | |||||
| 2004 | 35918 | 2410 | 4406 | |||||
| 2005 | 37253 | 435 | 4930 | |||||
| 2006 | 27352 | 4 | 1365 | 0 | 906 | 0 | 0 | |
| 2007 | 25558 | 192 | 1729 | 0 | 2451 | 0 | 0 | |
| 2008 | 20662 | 417 | 2207 | 0 | 4902 | 0 | 0 | |
| 2009 | 19784 | 0 | 4903 | 0 | 2586 | 0 | 0 | |
| 2010 | 16776 | 0 | 6309 | 0 | 2110 | 0 | 0 | |
| 2011 | 19928 | 0 | 5292 | 0 | 4432 | 574 | 0 | |
| 2012 | 14159 | 5 | 5073 | 0 | 4205 | 41 | 1280 | |
| 2013 | 8846 | 1067 | 5416 | 95 | 3660 | 164 | 0 | |
| 2014 | 10234 | 741 | 5667 | 149 | 4171 | 2 | 0 | |
| 2015 | 16618 | 1151 | 8665 | 2774 | 4665 | 148 | 0 | |
| 2016 | 10898 | 2491 | 9275 | 2821 | 4920 | 344 | 0 | |
| 2017 | 7010 | 3849 | 11406 | 3487 | 4689 | 0 | 0 | |
| 2018 | 23126 | 12561 | 13394 | 803 | 5173 | 0 | 1283 | |
| 2019 | 23925 | 28081 | 15342 | 1566 | 4325 | 0 | 344 | |
| 2020 | 19116 | 21265 | 14489 | 633 | 2750 | 0 | 128 | |
| 2021 | 29890 | 12379 | 10638 | 0 | 2311 | 0 | 136 | |
| 2022 | 35290 | 3809 | 17662 | 0 | 2819 | 0 | 0 | |
| 2023 | 34782 | 12288 | 22019 | 0 | 2482 | 2613 | 0 | |
| 2024 | 49799 | 16570 | 18052 | 2926 | 7816 | 0 | 0 |
11 - Summary of the assessment
| Relative exploitable biomass | Relative fishing mortality | |||||||
|---|---|---|---|---|---|---|---|---|
| Year | B/BMSY (low) | B/BMSY | B/BMSY (high) | Catch | Predicted catch | F/FMSY (low) | F/FMSY | F/FMSY (high) |
| 1970 | 0.87 | 1.42 | 2.29 | 6 | 5 | 0.01 | 0.04 | 0.12 |
| 1971 | 0.93 | 1.48 | 2.34 | 5 | 6 | 0.01 | 0.04 | 0.12 |
| 1972 | 1.00 | 1.55 | 2.42 | 7 | 6 | 0.01 | 0.04 | 0.13 |
| 1973 | 1.06 | 1.62 | 2.48 | 7 | 7 | 0.02 | 0.05 | 0.14 |
| 1974 | 1.10 | 1.66 | 2.50 | 8 | 8 | 0.02 | 0.05 | 0.15 |
| 1975 | 1.13 | 1.67 | 2.48 | 8 | 9 | 0.02 | 0.06 | 0.17 |
| 1976 | 1.16 | 1.69 | 2.47 | 10 | 11 | 0.02 | 0.07 | 0.21 |
| 1977 | 1.28 | 1.82 | 2.58 | 20 | 19 | 0.04 | 0.11 | 0.33 |
| 1978 | 1.46 | 2.03 | 2.83 | 39 | 33 | 0.06 | 0.17 | 0.51 |
| 1979 | 1.54 | 2.10 | 2.87 | 36 | 38 | 0.06 | 0.20 | 0.60 |
| 1980 | 1.56 | 2.08 | 2.77 | 46 | 43 | 0.07 | 0.22 | 0.69 |
| 1981 | 1.63 | 2.15 | 2.84 | 44 | 49 | 0.08 | 0.24 | 0.74 |
| 1982 | 1.70 | 2.25 | 2.97 | 63 | 65 | 0.10 | 0.30 | 0.95 |
| 1983 | 1.80 | 2.39 | 3.16 | 105 | 97 | 0.13 | 0.42 | 1.33 |
| 1984 | 1.87 | 2.51 | 3.36 | 128 | 122 | 0.17 | 0.53 | 1.71 |
| 1985 | 1.71 | 2.32 | 3.15 | 124 | 111 | 0.17 | 0.57 | 1.90 |
| 1986 | 1.28 | 1.75 | 2.38 | 65 | 69 | 0.15 | 0.49 | 1.64 |
| 1987 | 0.96 | 1.30 | 1.77 | 43 | 48 | 0.13 | 0.43 | 1.41 |
| 1988 | 0.87 | 1.17 | 1.59 | 49 | 49 | 0.14 | 0.44 | 1.41 |
| 1989 | 0.95 | 1.28 | 1.73 | 63 | 61 | 0.15 | 0.47 | 1.50 |
| 1990 | 1.14 | 1.54 | 2.08 | 81 | 74 | 0.15 | 0.49 | 1.56 |
| 1991 | 1.29 | 1.76 | 2.39 | 75 | 74 | 0.14 | 0.44 | 1.40 |
| 1992 | 1.42 | 1.93 | 2.62 | 69 | 67 | 0.11 | 0.37 | 1.19 |
| 1993 | 1.46 | 1.98 | 2.70 | 56 | 52 | 0.09 | 0.29 | 0.95 |
| 1994 | 1.33 | 1.80 | 2.44 | 28 | 33 | 0.06 | 0.21 | 0.69 |
| 1995 | 1.14 | 1.54 | 2.07 | 25 | 27 | 0.06 | 0.20 | 0.63 |
| 1996 | 1.15 | 1.55 | 2.08 | 35 | 33 | 0.07 | 0.21 | 0.69 |
| 1997 | 1.29 | 1.74 | 2.33 | 36 | 39 | 0.07 | 0.23 | 0.74 |
| 1998 | 1.45 | 1.94 | 2.60 | 56 | 55 | 0.09 | 0.29 | 0.93 |
| 1999 | 1.56 | 2.09 | 2.79 | 76 | 73 | 0.12 | 0.37 | 1.19 |
| 2000 | 1.56 | 2.10 | 2.84 | 81 | 77 | 0.13 | 0.41 | 1.32 |
| 2001 | 1.41 | 1.90 | 2.57 | 57 | 60 | 0.11 | 0.35 | 1.13 |
| 2002 | 1.35 | 1.82 | 2.46 | 61 | 58 | 0.11 | 0.34 | 1.11 |
| 2003 | 1.28 | 1.74 | 2.36 | 39 | 42 | 0.09 | 0.28 | 0.89 |
| 2004 | 1.15 | 1.56 | 2.12 | 43 | 42 | 0.09 | 0.30 | 0.95 |
| 2005 | 1.14 | 1.55 | 2.11 | 43 | 41 | 0.08 | 0.27 | 0.87 |
| 2006 | 1.23 | 1.67 | 2.26 | 30 | 31 | 0.06 | 0.19 | 0.62 |
| 2007 | 1.33 | 1.79 | 2.40 | 30 | 30 | 0.06 | 0.18 | 0.57 |
| 2008 | 1.35 | 1.81 | 2.44 | 28 | 28 | 0.05 | 0.17 | 0.54 |
| 2009 | 1.34 | 1.80 | 2.43 | 27 | 27 | 0.05 | 0.16 | 0.51 |
| 2010 | 1.34 | 1.80 | 2.42 | 25 | 26 | 0.05 | 0.15 | 0.50 |
| 2011 | 1.35 | 1.83 | 2.48 | 30 | 29 | 0.05 | 0.18 | 0.57 |
| 2012 | 1.25 | 1.71 | 2.33 | 25 | 25 | 0.05 | 0.16 | 0.53 |
| 2013 | 1.12 | 1.55 | 2.14 | 19 | 20 | 0.05 | 0.15 | 0.48 |
| 2014 | 1.02 | 1.40 | 1.93 | 21 | 22 | 0.05 | 0.18 | 0.56 |
| 2015 | 0.99 | 1.34 | 1.82 | 34 | 32 | 0.08 | 0.25 | 0.82 |
| 2016 | 1.00 | 1.36 | 1.84 | 31 | 31 | 0.08 | 0.25 | 0.80 |
| 2017 | 0.99 | 1.33 | 1.80 | 30 | 32 | 0.08 | 0.25 | 0.79 |
| 2018 | 1.12 | 1.51 | 2.04 | 56 | 55 | 0.12 | 0.37 | 1.19 |
| 2019 | 1.20 | 1.64 | 2.24 | 74 | 71 | 0.15 | 0.47 | 1.52 |
| 2020 | 1.15 | 1.57 | 2.14 | 58 | 59 | 0.14 | 0.44 | 1.41 |
| 2021 | 1.05 | 1.42 | 1.91 | 55 | 56 | 0.13 | 0.41 | 1.32 |
| 2022 | 1.12 | 1.51 | 2.04 | 60 | 61 | 0.13 | 0.42 | 1.35 |
| 2023 | 1.17 | 1.58 | 2.13 | 74 | 75 | 0.16 | 0.51 | 1.63 |
| 2024 | 1.18 | 1.60 | 2.17 | 95 | 90 | 0.20 | 0.64 | 2.10 |
| 2025 | 1.01 | 1.39 | 1.91 | 71 | 72 | 0.18 | 0.60 | 2.00 |
| 2026 | 0.86 | 1.24 | 1.80 | |||||
12 - Sources and references
ICES. 2022. Benchmark workshop on pandalus stocks (WKPRAWN). Report. ICES Scientific Reports. https://ices-library.figshare.com/articles/report/Benchmark_workshop_on_Pandalus_stocks_WKPRAWN_/19714204.
Lancker, K., Voss, R., Zimmermann, F., and Quaas, M. F. 2023. Using the best of two worlds: A bio-economic stock assessment (BESA) method using catch and price data. Fish and Fisheries. https://onlinelibrary.wiley.com/doi/abs/10.1111/faf.12759.
Trochta, J. T., Stekso, A., Olssøn, R., Danielsen, H. E., Jenssen, M., and Zimmermann, F. 2024. Management strategy evaluation for northern shrimp in the Barents Sea (ICES subareas 1 and 2).
Zimmermann, F., Danielsen, H. E. H., Marcussen, J. B., Trochta, J. T., Vickery, G., Olsen, S. A., Berg Erik, et al. 2024. Barents Sea shrimp - stock assessment report 2024.