Gå til hovedinnhold
Havforskningsinstituttet
HI
English
<- Tilbake
Søk
Søk
Søk
View page in English
Figur
Fra rapporten:
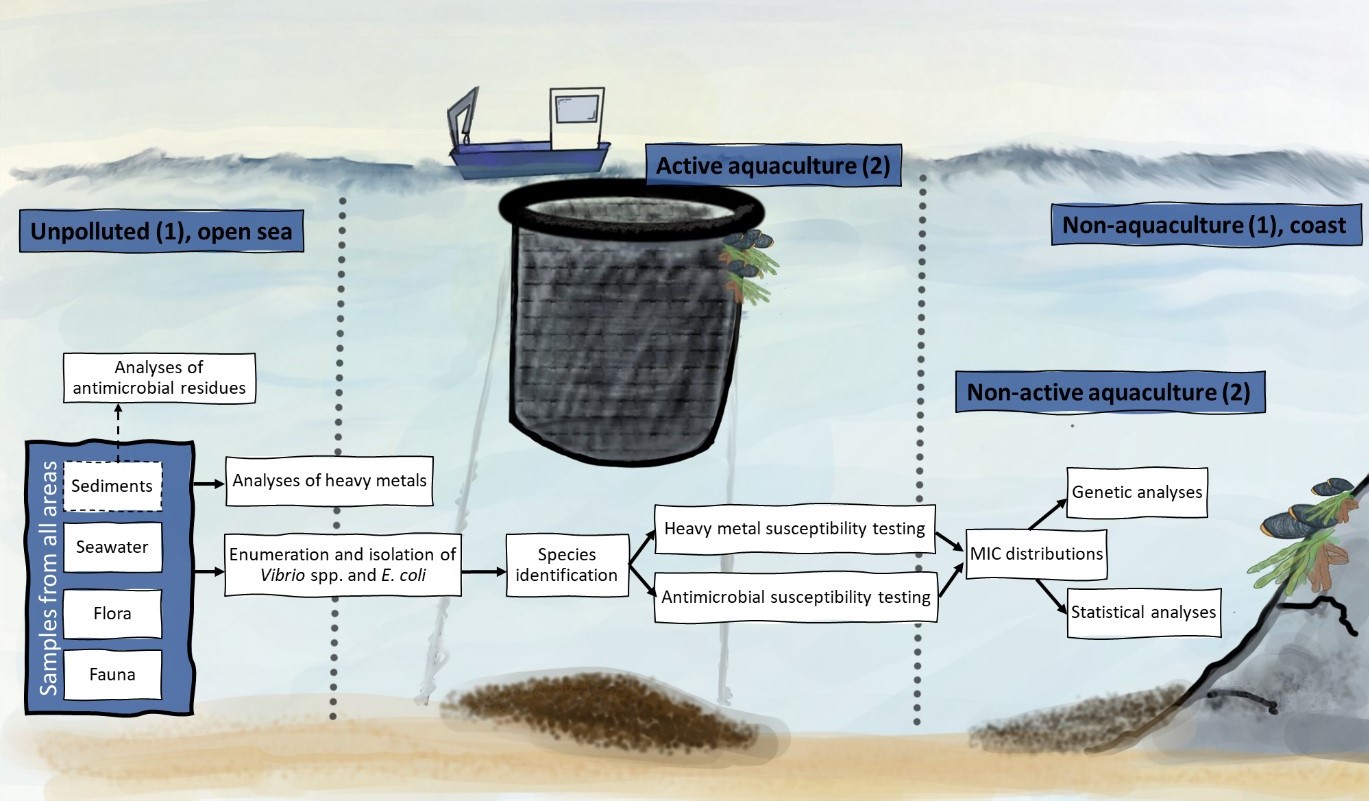
Screening for antimicrobial- and heavy metal resistant bacteria in copper contaminated areas
Figure 1. Flow chart of the presented project. The blue boxes show the four examined areas; Active aquaculture, Non-active aquaculture, Non-aquaculture and Unpolluted with number of locations in brackets. Key analyses are presented in white boxes.