Gå til hovedinnhold
Havforskningsinstituttet
HI
English
<- Tilbake
Søk
Søk
Søk
View page in English
Figur
Fra rapporten:
Screening for antimicrobial- and heavy metal resistant bacteria in copper contaminated areas
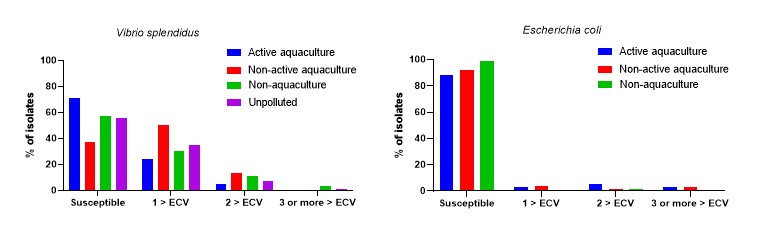
Figure 12. Proportion (%) of V. splendidus (n= 350) and E. coli (n=336) isolates with MIC values above the Epidemiological cut-off values for antimicrobial classes shown according to areas of origin.