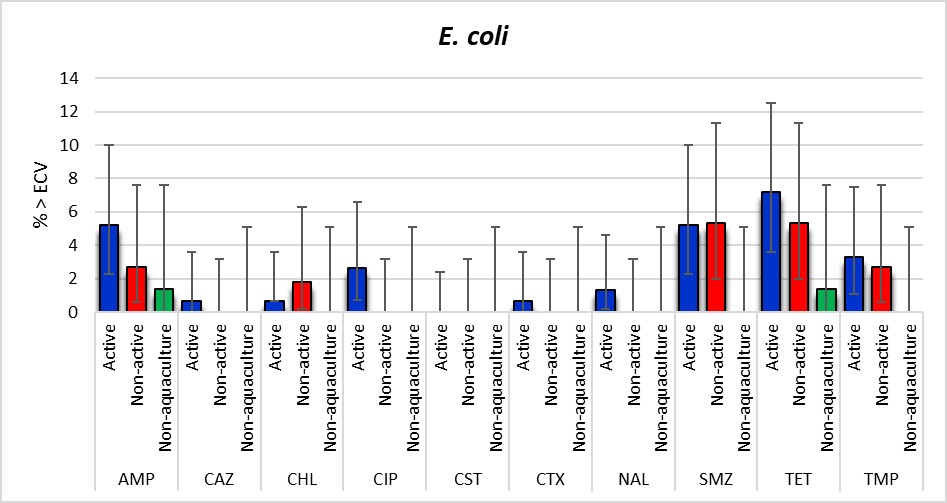
Figure 14. Proportion (%) of E. coli isolates with MIC values above the epidemiological cut-offs (ECV) with 95% confidence intervals. Proportions are shown according to isolates belonging to Active aquaculture (n=153), Non-active aquaculture (n=112), and Non-aquaculture (n= 71) areas. No isolates were found in the Unpolluted areas. AMP=ampicillin, CAZ=ceftazidime, CHL=chloramphenicol, CIP=ciprofloxacin, CST=colistin, CTX=cefotaxime, NAL=nalidixic acid, SMZ=sulfamethoxazole, TET=tetracycline, TMP=trimethoprim.