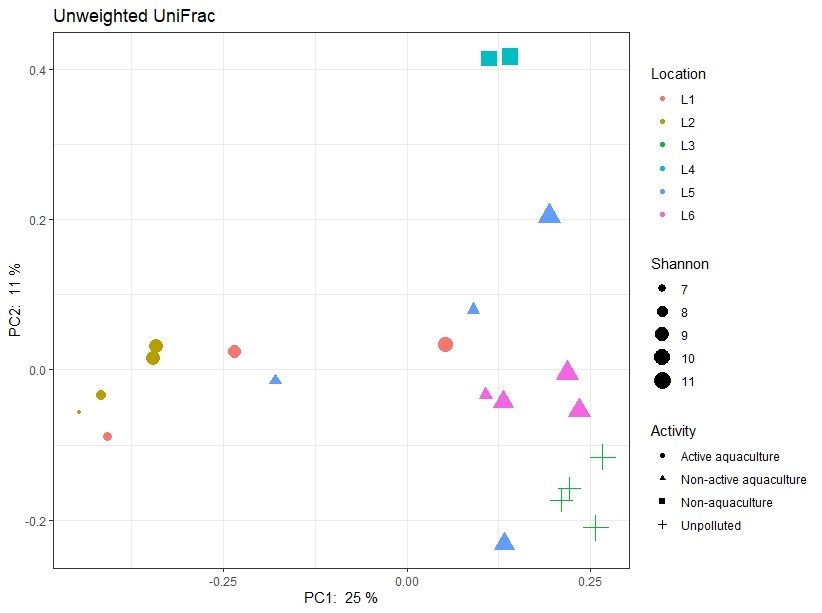
Figure 7. Principal component analyses indicating similarity in bacterial composition of samples regarding the activity of the sampling site (shape of symbols) and Shannon values (size of symbols) indicating the diversity of 16S sequences observed in the samples. The closer two points are on the plot, the more similar they are in microbial community composition. L1-L6 refers to the locations described in Table 1.