Gå til hovedinnhold
Havforskningsinstituttet
HI
English
<- Tilbake
Søk
Søk
Søk
View page in English
Figur
Fra rapporten:
Screening for antimicrobial- and heavy metal resistant bacteria in copper contaminated areas
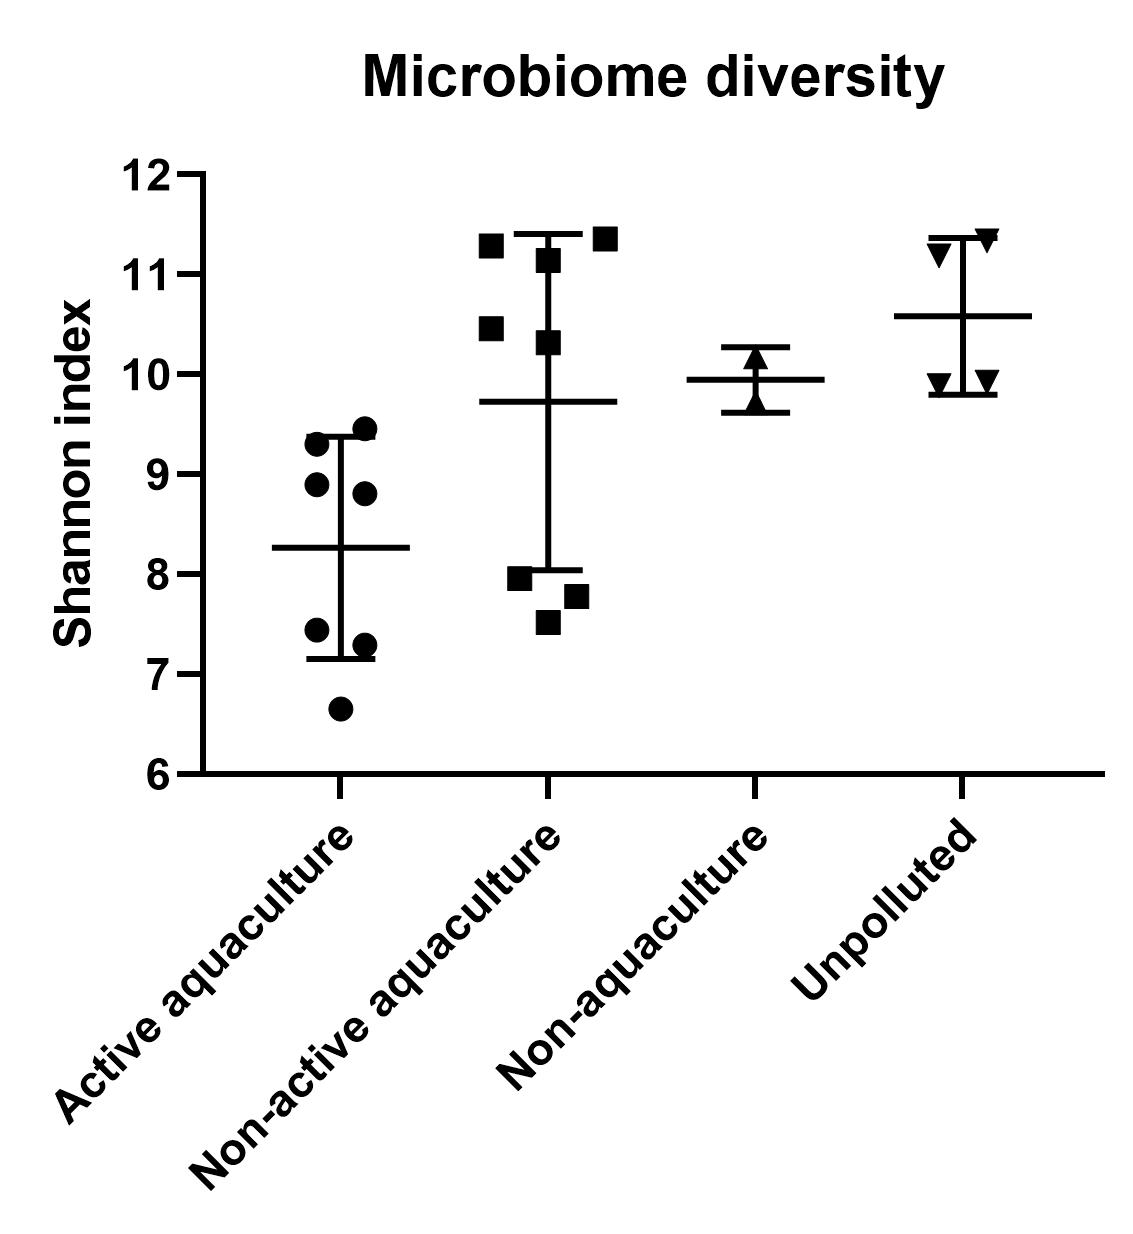
Figure 6: Mean ± SD and individual values of calculated Shannon index, as a measure of bacterial diversity at the different examined areas, Active aquaculture (n=7), Non-active aquaculture (n=8), Non-aquaculture (n=4) and Unpolluted (n=4).