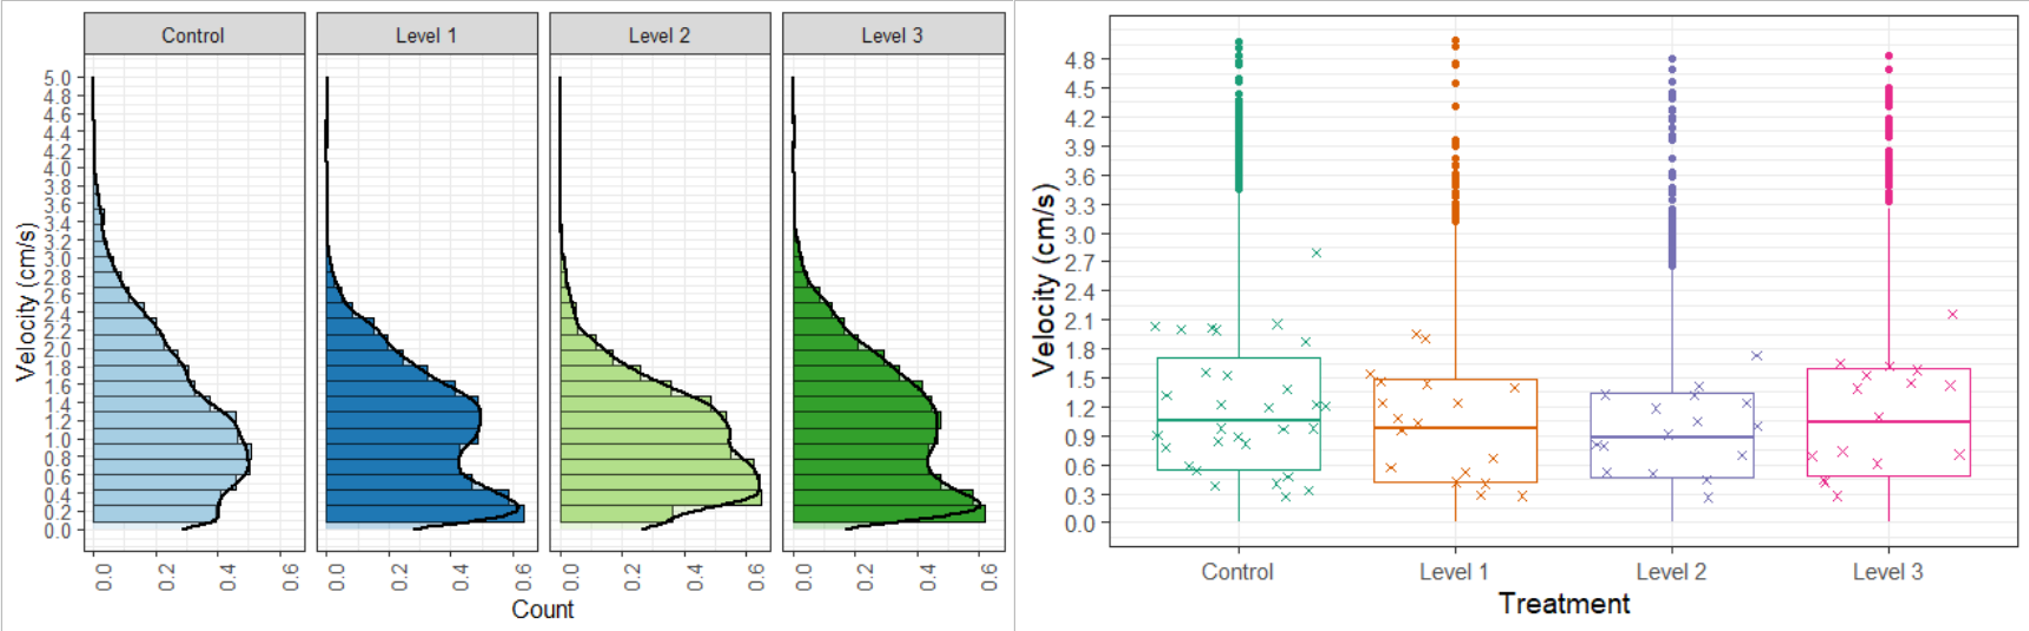
Figure 8. Instantaneous swimming velocities of haddock (Melanogramus aeglefinus) juvenile exposed to three levels of electromagnetic fields simulating different distances from the source. Control: ambient field, Level 1: 1000 m, Level 2: 100 m, Level 3: 30 m. Left: velocities are represented as histograms; Right: Boxplot calculated on all the individual velocities. Aggregated values (mean) per fish (n=80) are represented as crosses.