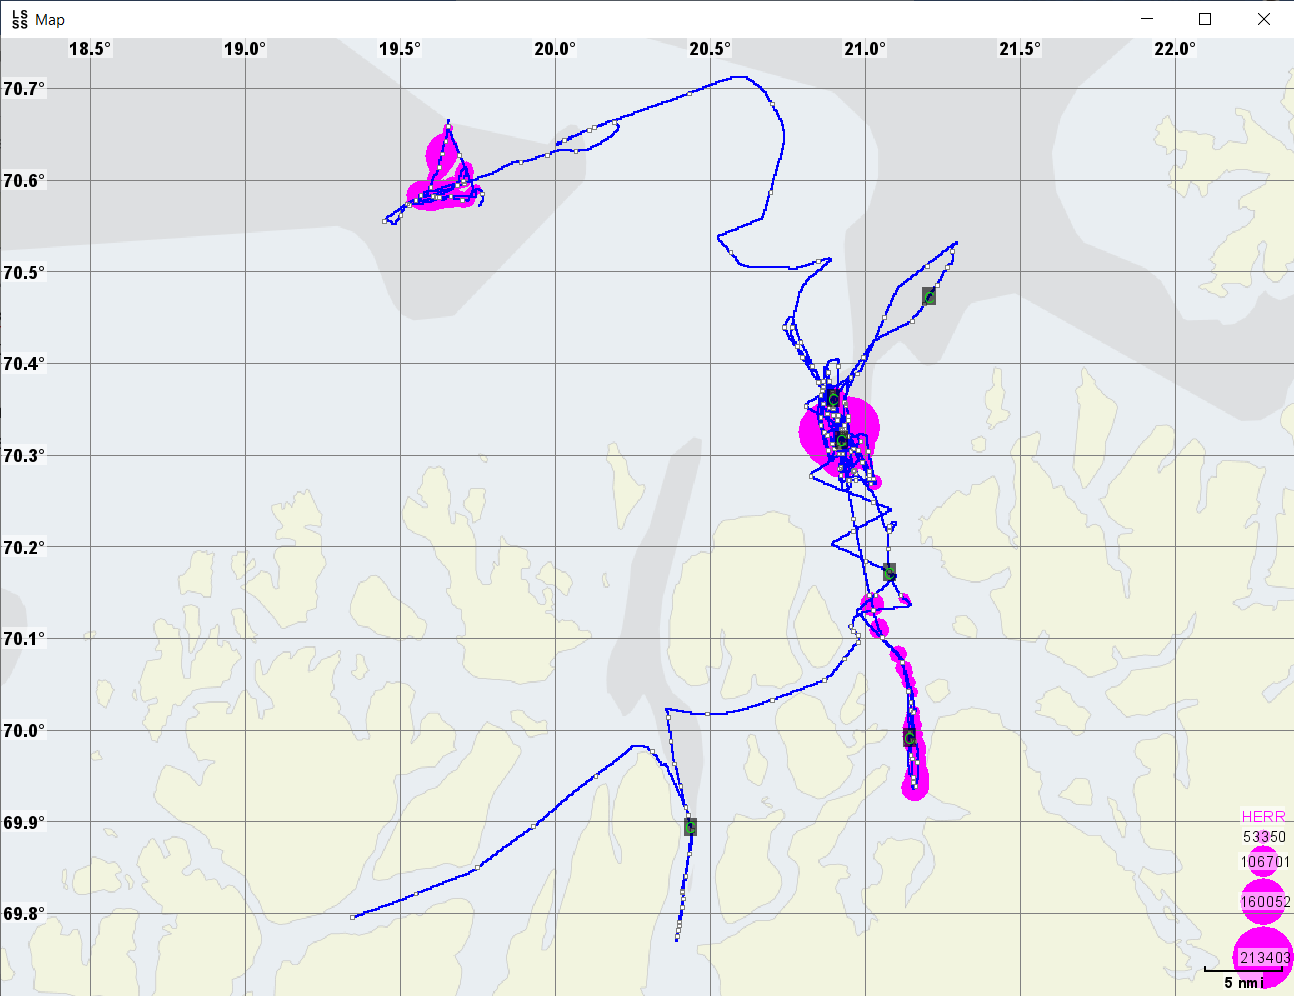
Figure 4. Overview of the survey area in leg 1 (blue line). We covered the Lyngen and Reisafjords and outer parts of Kvænangen and further off the coast at the 12 nm border. Herring detections are marked as pink bubbles (size reflecting the amount of fish).