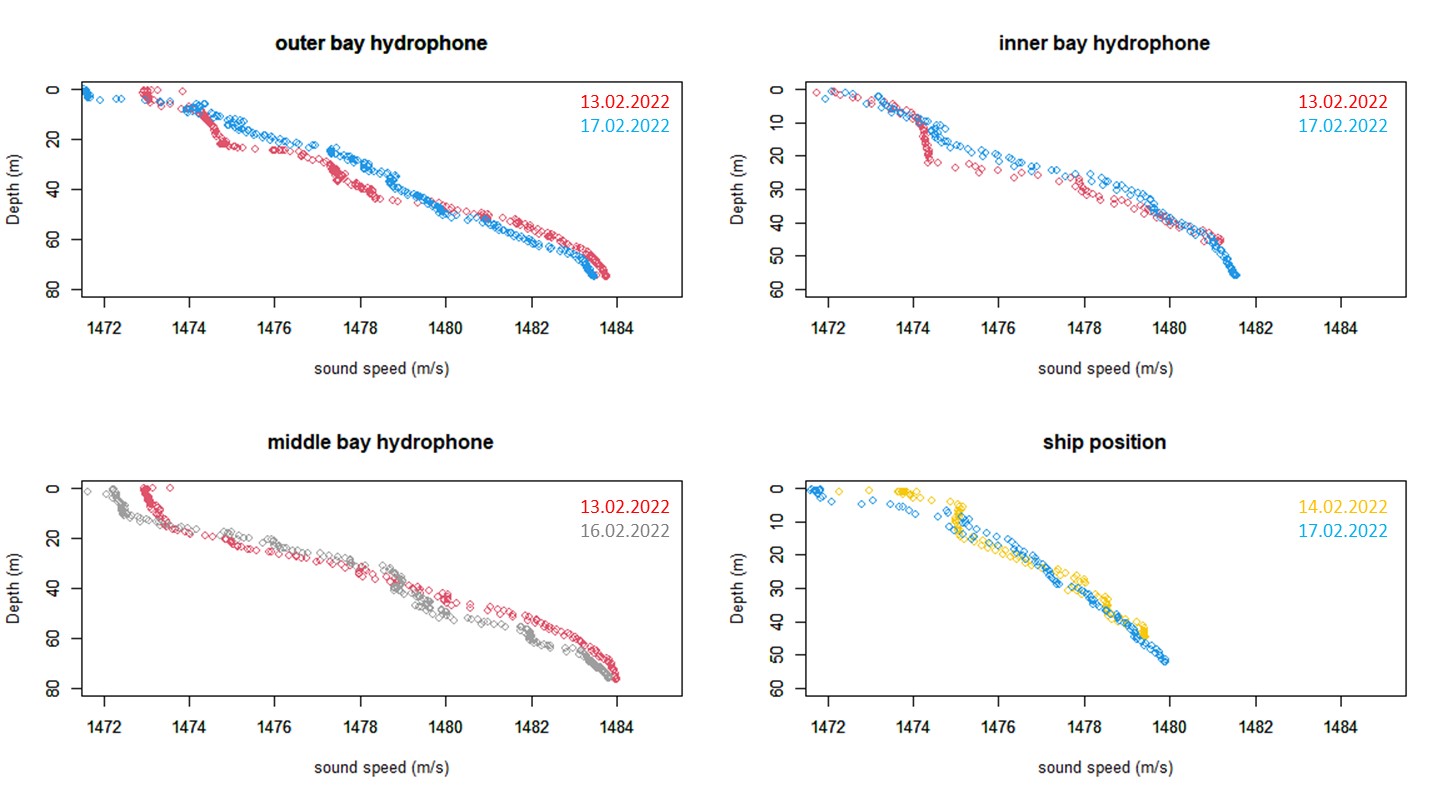
Figure 19. Sound speed profiles for the 4 different measurement stations; 3 at the hydrophone positions and one at the ships (source) position. All stations have two profiles form different dates, indicated in different colors. Dates of the samples are given in the colors they represent.