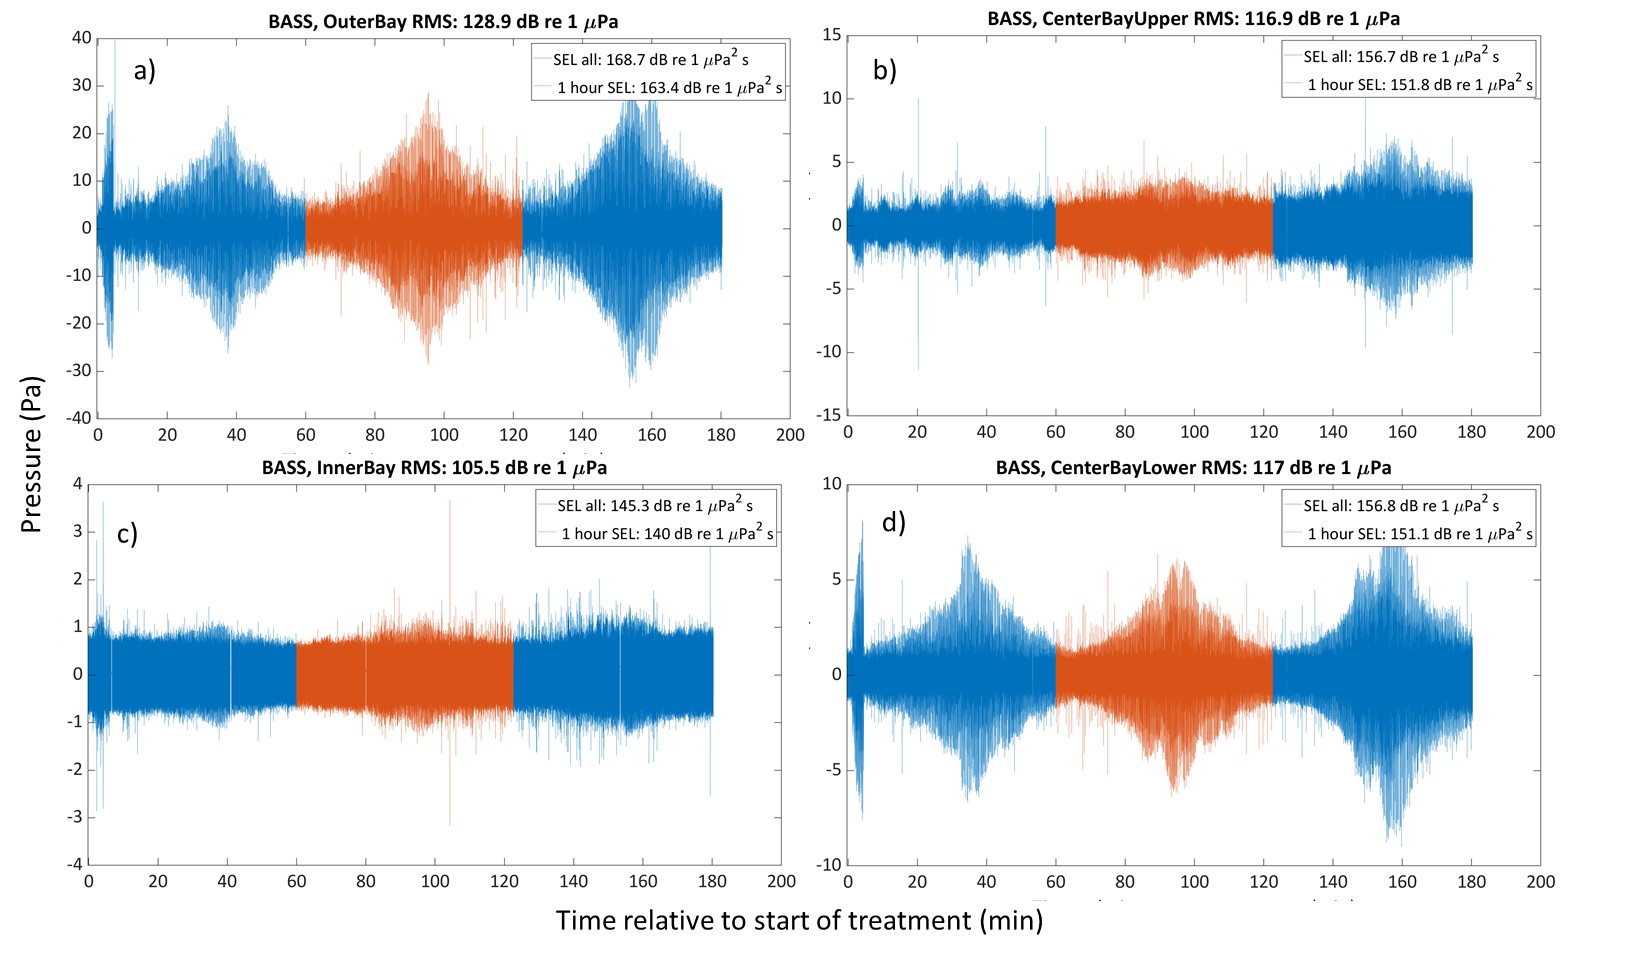
Figure 11. Raw data for the three hours of BASS exposure at the different hydrophones; outer (a), inner (c) and center (b,d) part of the bay. Note that the scale on the y-axs differ between the plots. In the legend “SEL all” describes the sound exposure level within the entire 3 h period without compensating for gaps between recorded files, while “1-hour SEL” is for 1 hour compensated for gap between the recorded files (period defined in orange color). The RMS – value in the title is estimated for the 3 hour period (this is similar to an average SEL for 1 second period).