Gå til hovedinnhold
Havforskningsinstituttet
HI
English
<- Tilbake
Søk
Søk
Søk
View page in English
Figur
Fra rapporten:
SpawnSeis MV exposure experiment - Survey Report
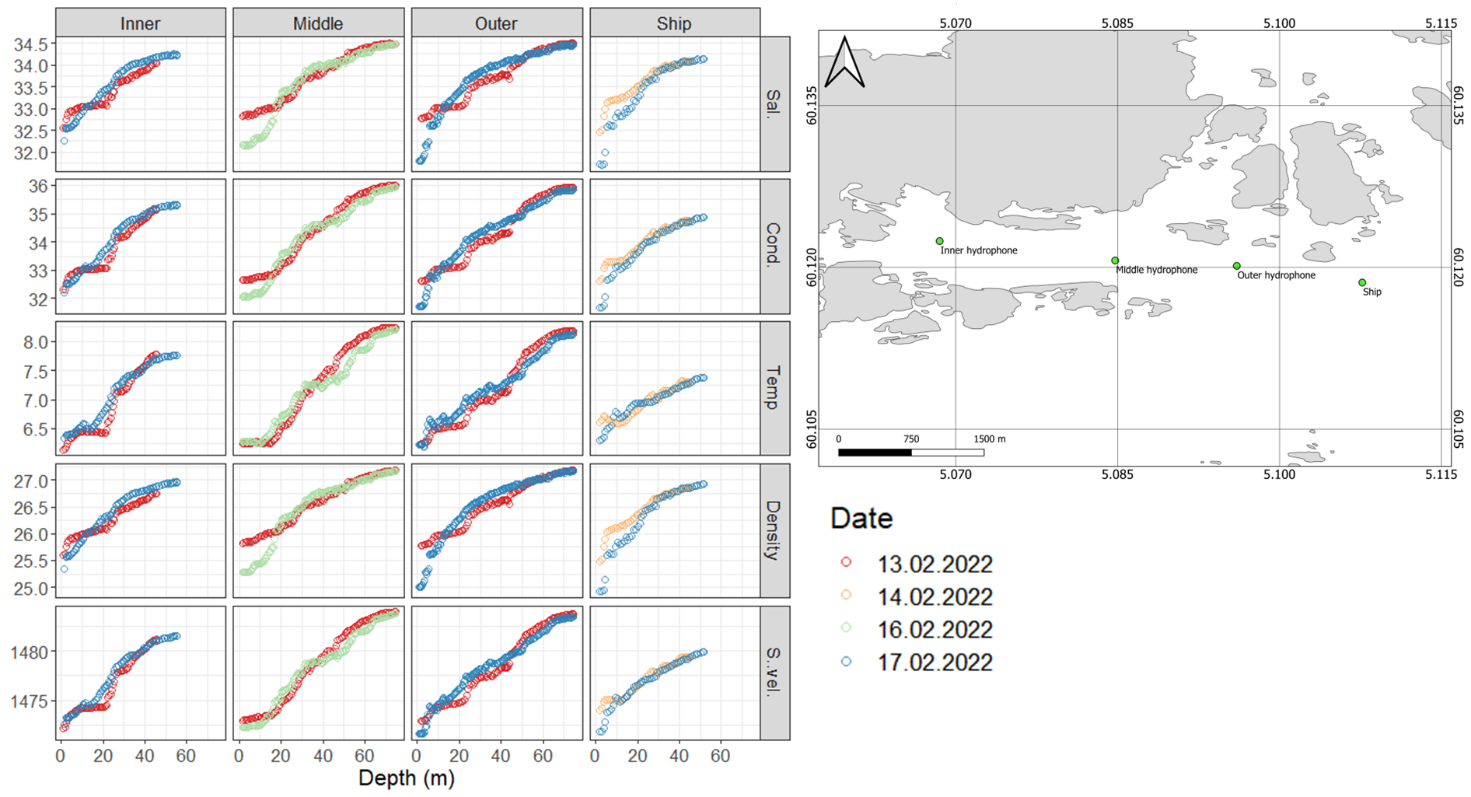
Figure 17. Left: Recordings from the CTD upcasts; salinity, conductivity, density and sound velocity as a function of depth. Right: map of the 4 CTD stations.