Gå til hovedinnhold
Havforskningsinstituttet
HI
English
<- Tilbake
Søk
Søk
Søk
View page in English
Figur
Fra rapporten:
Testing of trawl-acoustic stock estimation of spawning capelin 2023
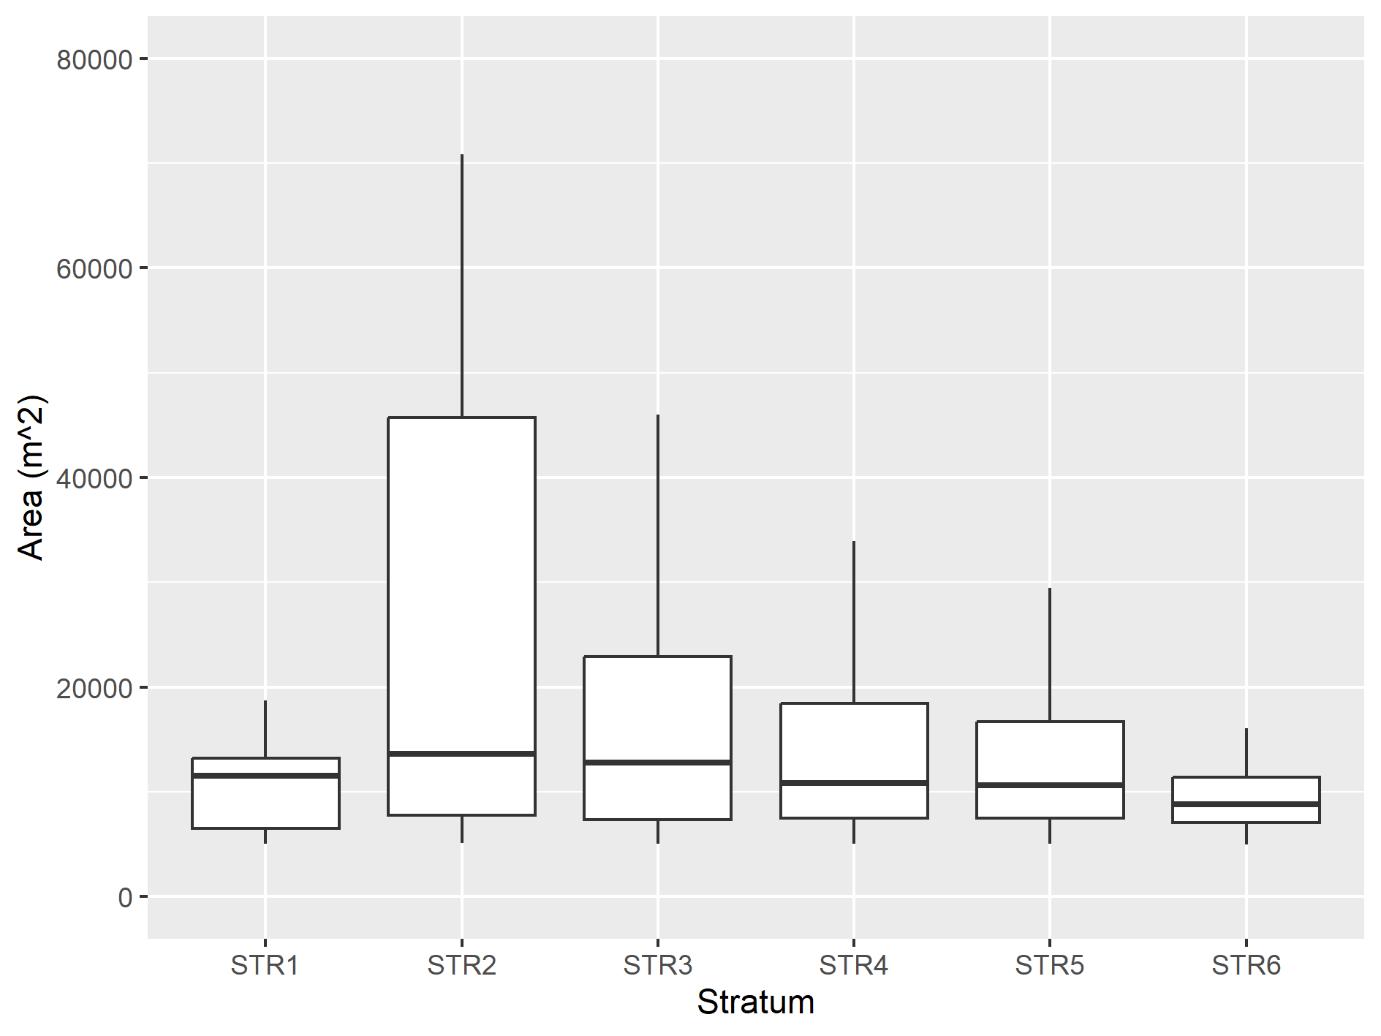
Figure A4. School area (m2) by stratum. The boxes present the median and 25 th and 75 th quantile values.