Gå til hovedinnhold
Havforskningsinstituttet
HI
English
<- Tilbake
Søk
Søk
Søk
View page in English
Figur
Fra rapporten:
Testing of trawl-acoustic stock estimation of spawning capelin 2023
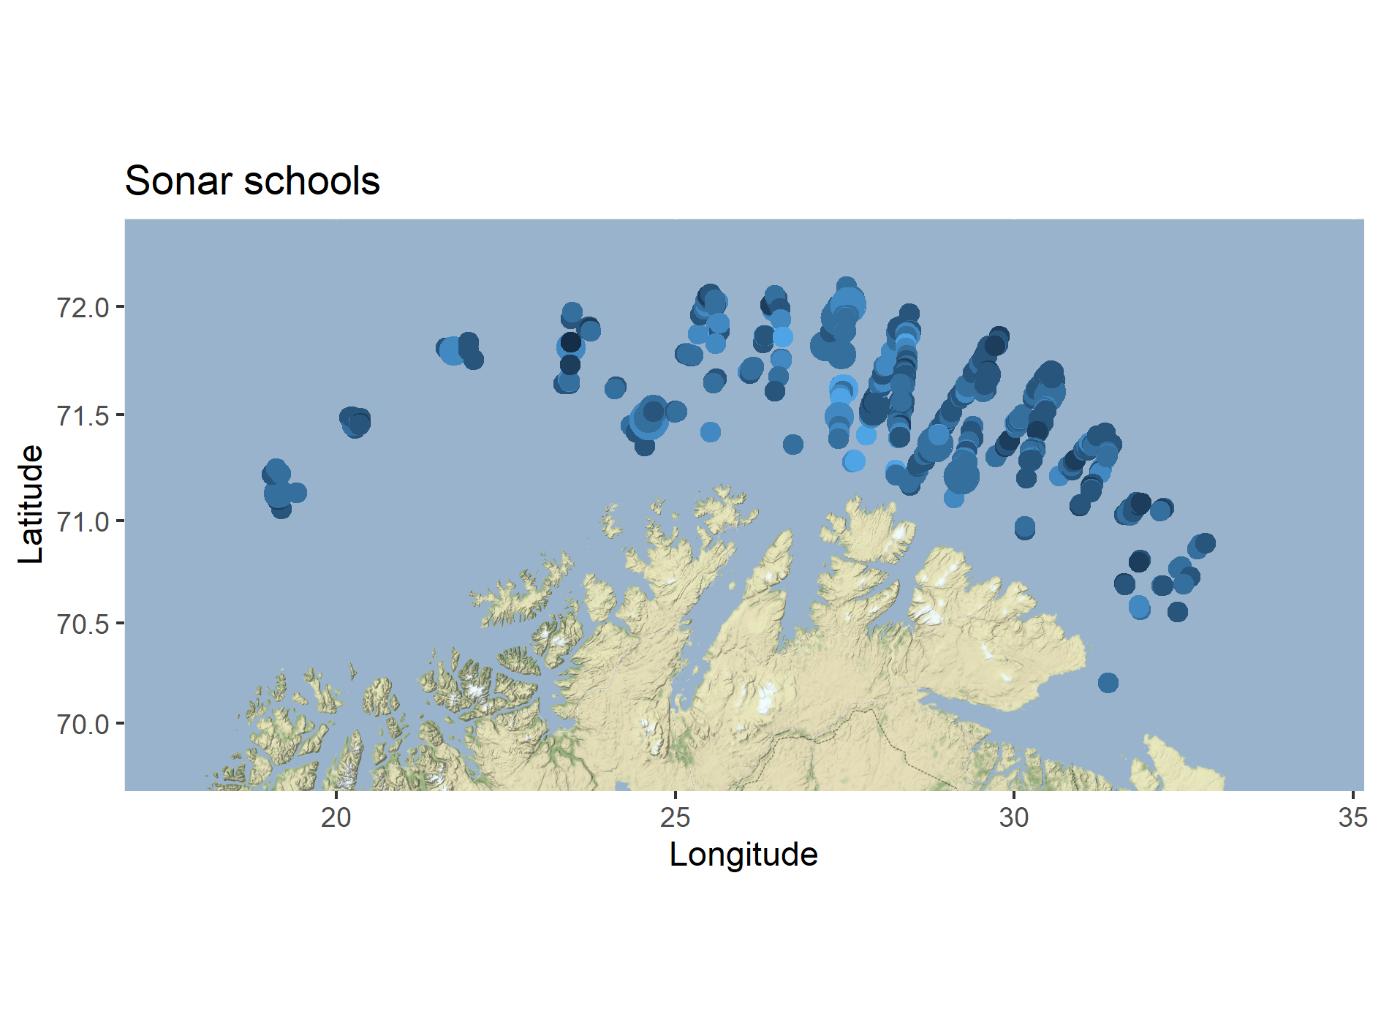
Figure 4. All schools detected with sonar. Bubble sizes represent school area and blue colour strength the acoustic density (Sv in dB re 1m -1).