Gå til hovedinnhold
Havforskningsinstituttet
HI
English
<- Tilbake
Søk
Søk
Søk
View page in English
Figur
Fra rapporten:
Testing of trawl-acoustic stock estimation of spawning capelin 2023
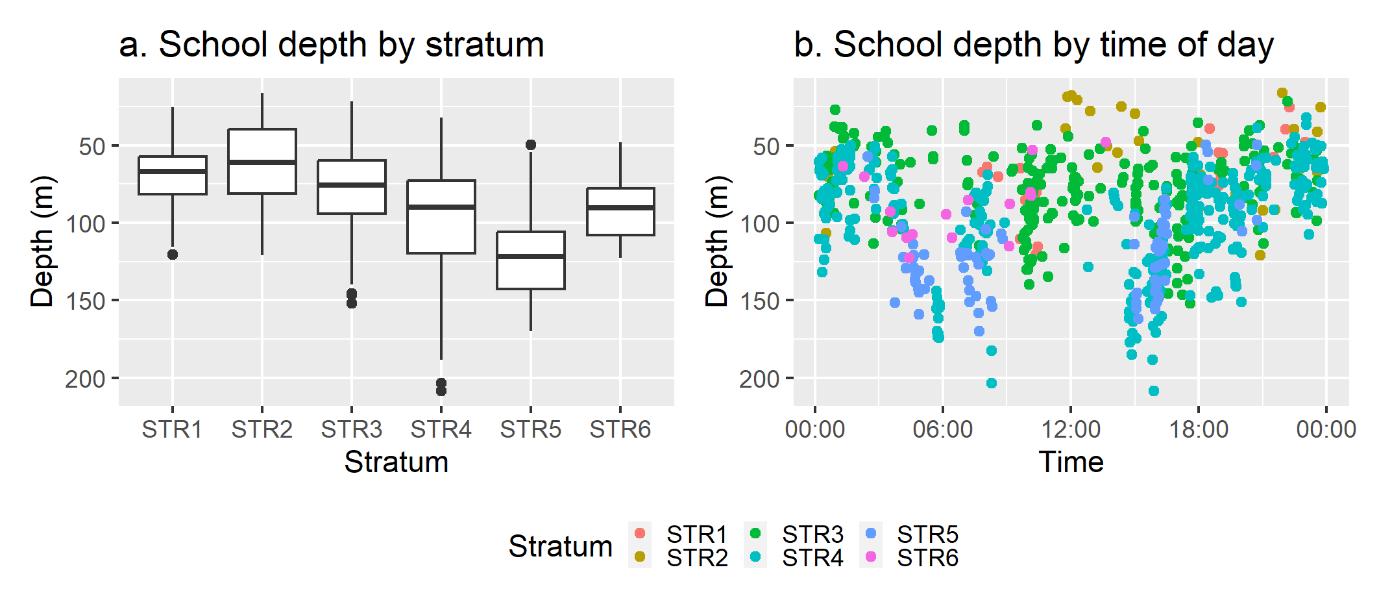
Figure 5. Average school depth by stratum. The boxes represent the median and 25 th and 75 th quantile values. In plot b) school depth as a function of the time of day is presented and different colors represent strata.