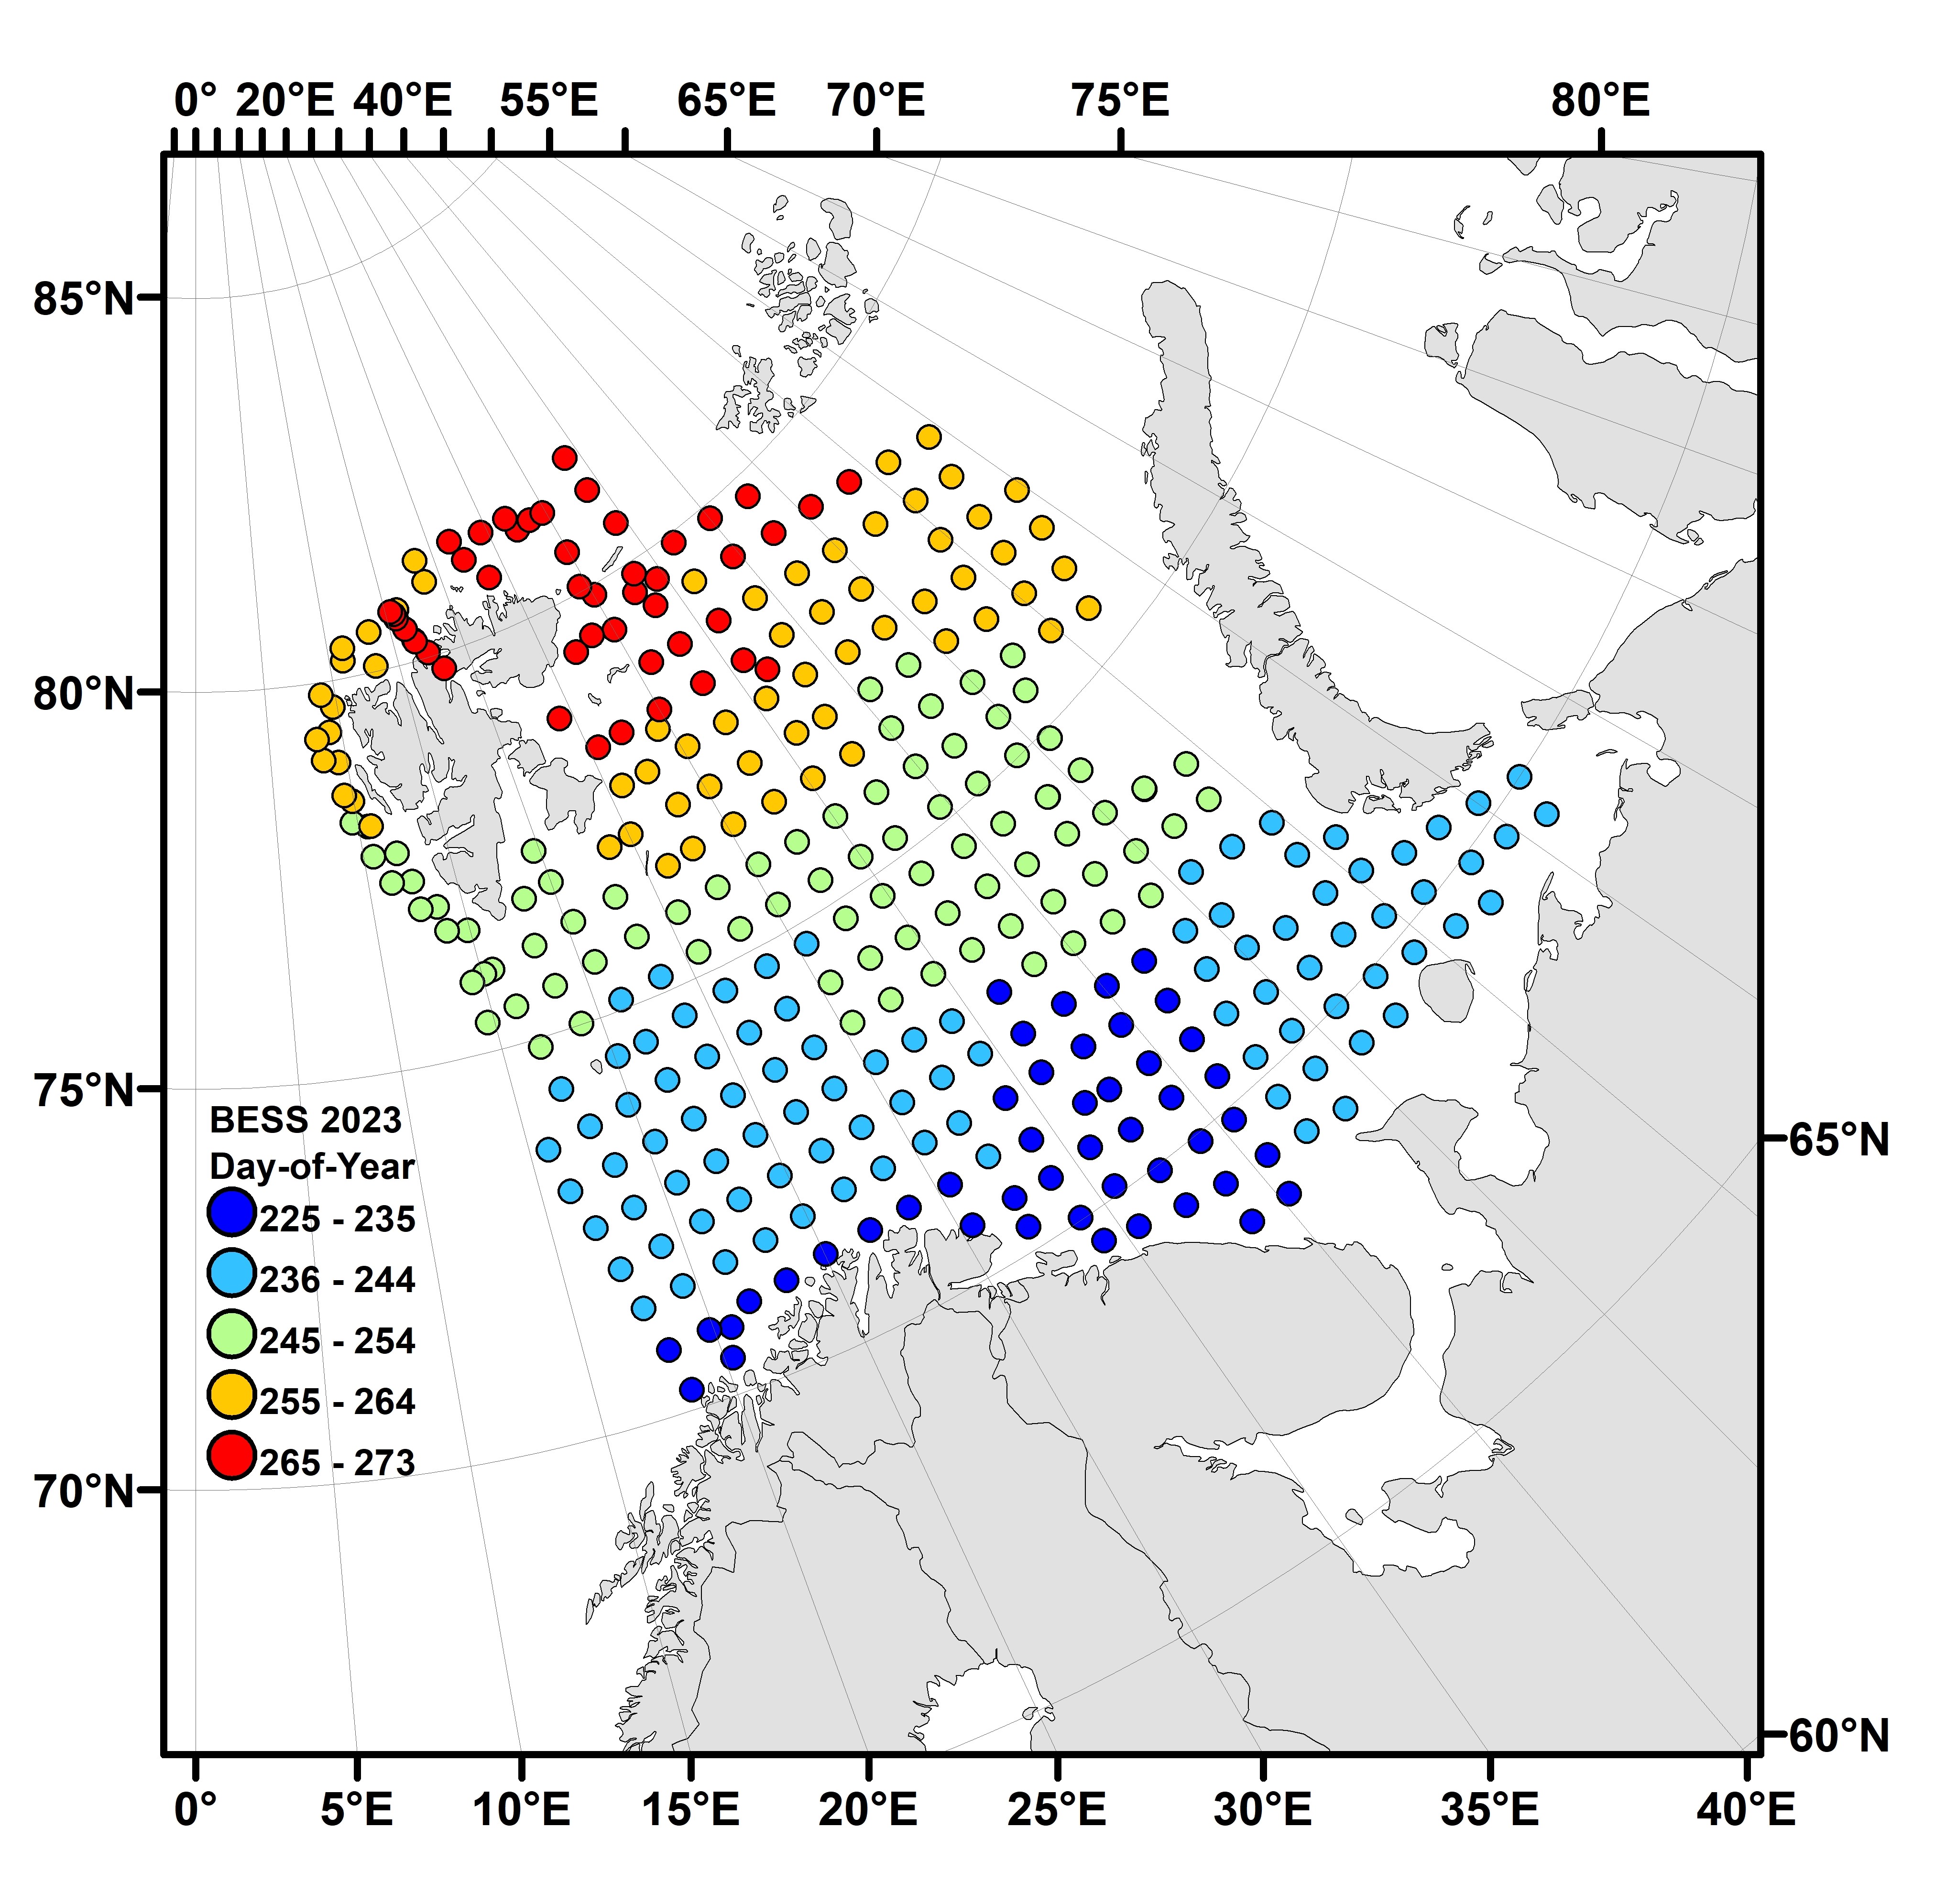
Figure 2.4. Progression of BESS 2023 in space and time. Points represent samples taken at ecosystem stations during the survey. The point’s colour indicates the number of Julian days between the first and last day of the survey. The colours scale from blue (early in the survey) to red (late in the survey).