Gå til hovedinnhold
Havforskningsinstituttet
HI
English
<- Tilbake
Søk
Søk
Søk
View page in English
Figur
Fra rapporten:
Survey report (Part 1) from the joint Norwegian/Russian Ecosystem Survey in the Barents Sea and the adjacent waters August-October 2023
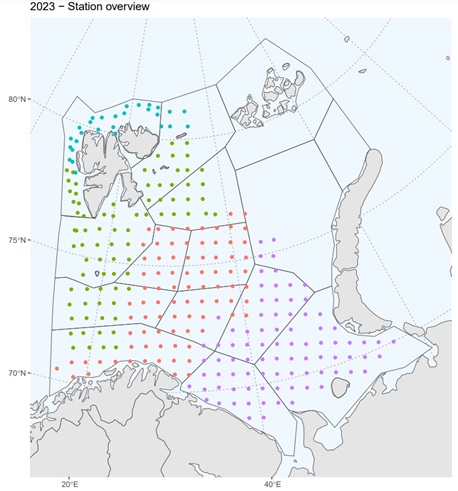
Figure 6.1. Map showing spatial coverage of the 0-group fish in the Barents Sea in 2023. Dots indicate sampling stations colored according to research vessel, while grey lines denote the 15 subareas (polygons) used in the estimations.