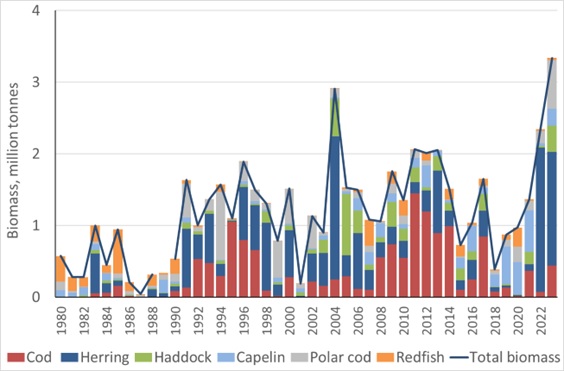
Figure 6.3. Biomass of 0-group fish species in the Barents Sea, August–October 1980–2023. The biomass of 0-group fish for the period 1980-1992 was estimated based on indices of total abundance and overall mean fish weight, and since then it has been estimated directly. Indices were calculated in SAS for the period 1980-2017 and in R since that. Biomass estimates for 2018, 2020 and 2022 were adjusted due to lack of survey coverage.