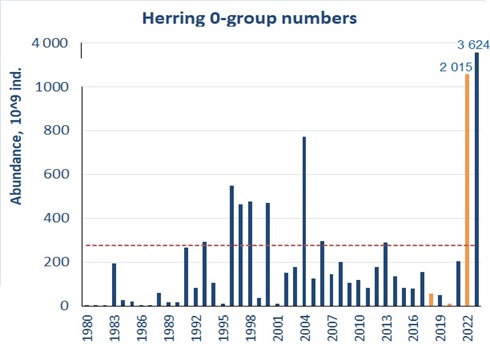
Figure 6.4.2. Estimated abundance of 0-group herring corrected for capture efficiency (Keff) for the period 1980-2023. Red dotted line shows the long-term average. Abundance indices for 2018, 2020 and 2022 were adjusted due to lack of survey coverage and are shown in orange colour.