Gå til hovedinnhold
Havforskningsinstituttet
HI
English
<- Tilbake
Søk
Søk
Søk
View page in English
Figur
Fra rapporten:
Survey report (Part 1) from the joint Norwegian/Russian Ecosystem Survey in the Barents Sea and the adjacent waters August-October 2023
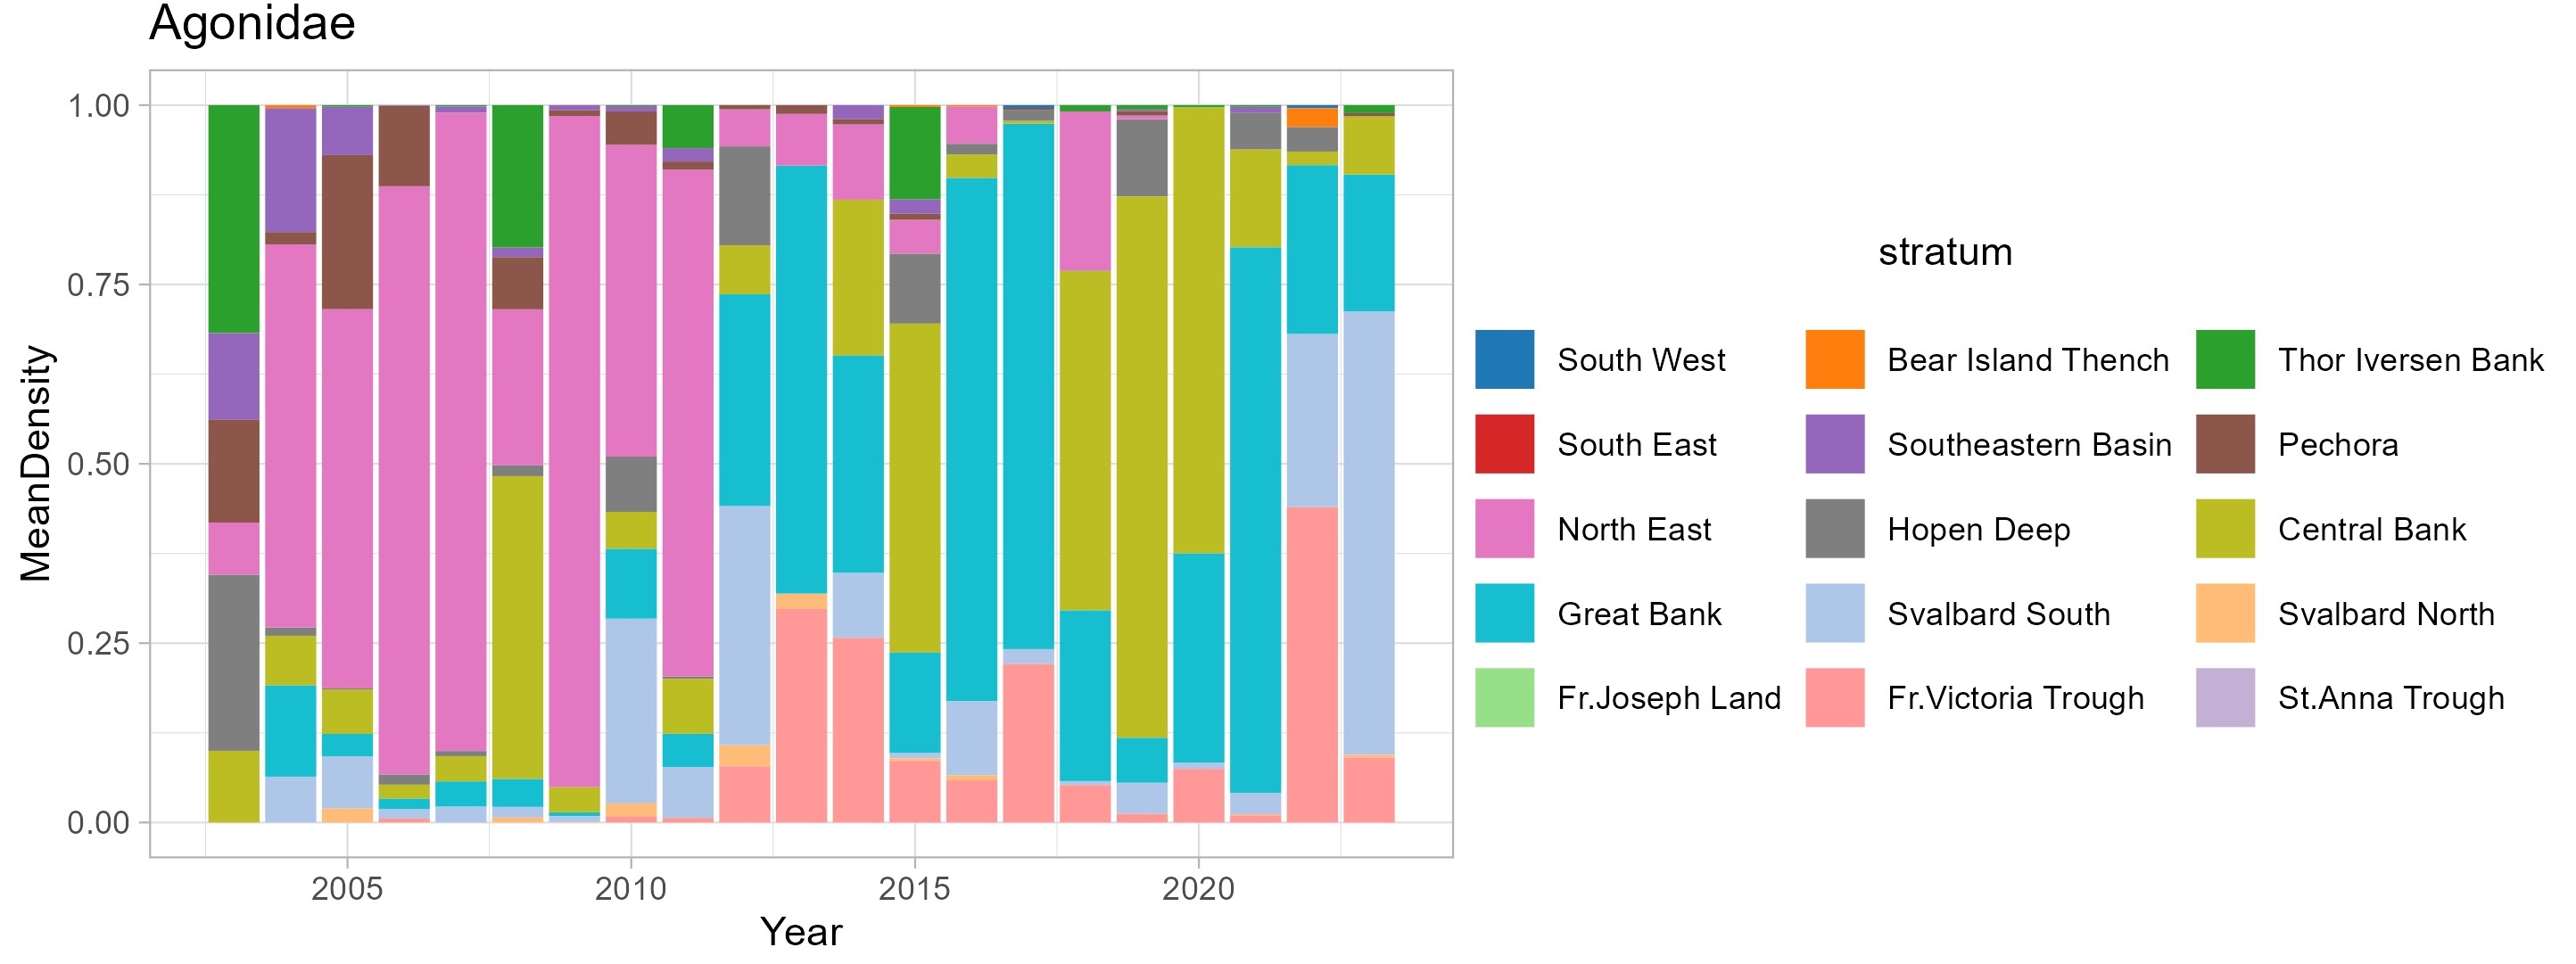
Figure 9.1.3. Spatial distribution of mean Agonidae densities by polygons in August-September 2003-2023.