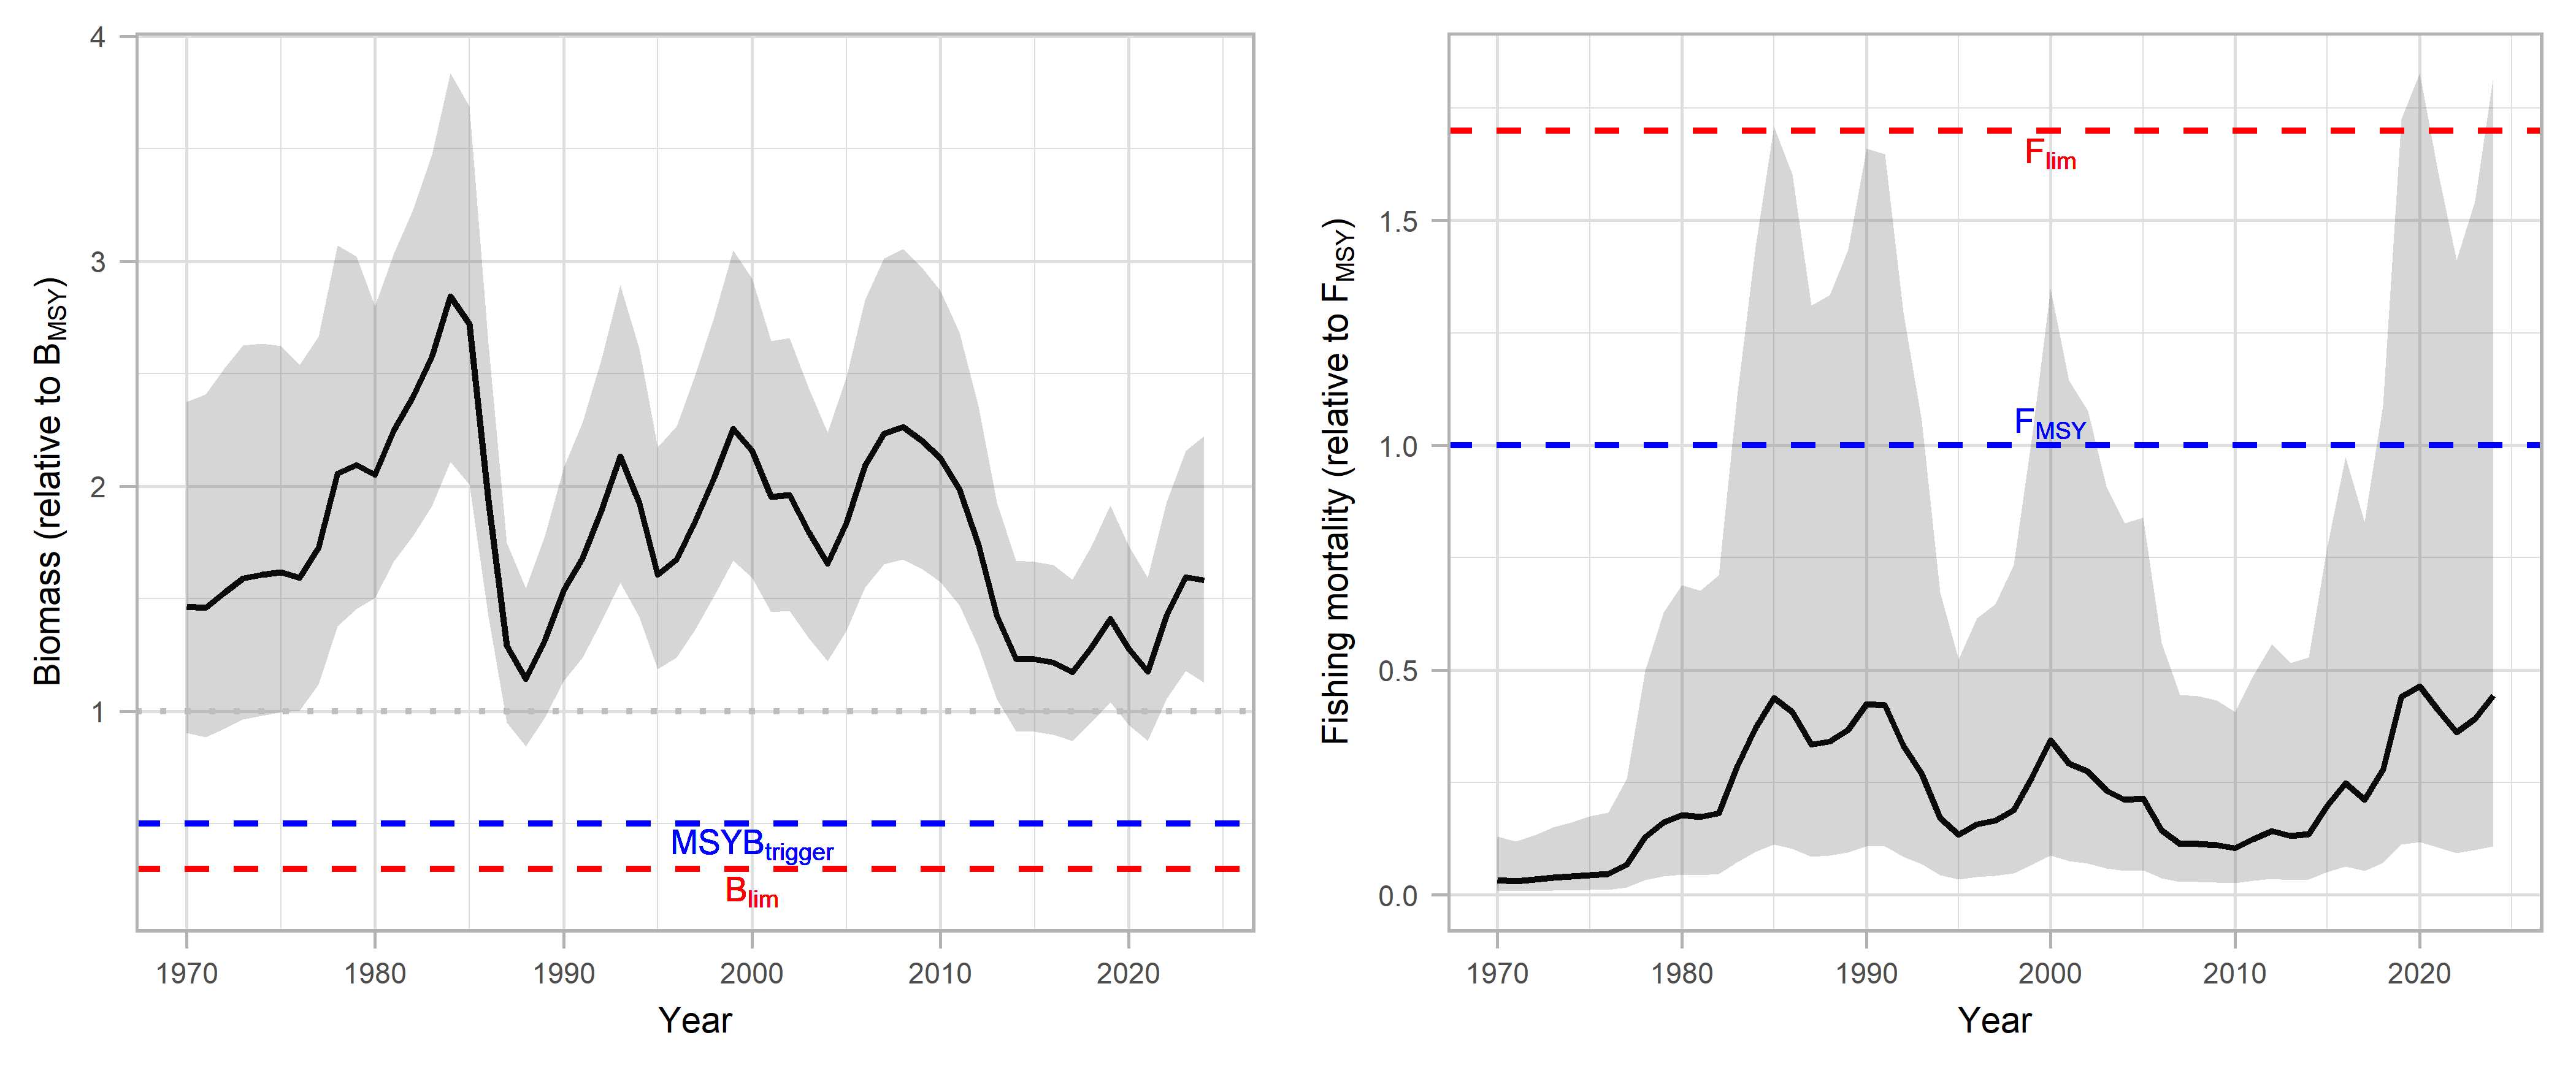
Figure 8: Estimated relative biomass (B/Bmsy) and fishing mortality (F/Fmsy) since 1970. Solid lines represent the mean estimates, shaded surfaces the 95% confidence intervals. MSY and precautionary approach reference points are indicated with blue and red dashed lines, respectively.