Northern shrimp ( Pandalus borealis ) in the Barents Sea and in the Svalbard fishery protection zone (ICES Subareas 1 and 2) is considered as one stock. Norwegian and Russian vessels exploit the stock in the entire area, while vessels from other nations are restricted to the Svalbard fishery zone and the “Loophole” area.
Norwegian vessels initiated the fishery in 1970. As the fishery developed, vessels from several nations joined and landings increased rapidly 1). Vessels from Norway, Russia, Iceland, Greenland, Faroes, United Kingdom and the EU participate in this fishery on a regular basis. There is no overall TAC established for this stock. The fishery is partly regulated by effort control (Norwegian and Svalbard zone), and a TAC in the Russian zone only. Licenses are required for the Russian and Norwegian vessels. In the Norwegian and Svalbard zones, the fishing activity of these license holders is constrained only by bycatch regulations whereas the activity of third country fleets operating in the Svalbard zone is also restricted by the number of effective fishing days and the number of vessels by country. The minimum stretched mesh size is 35 mm. Bycatch is limited by mandatory sorting grids and by the temporary closing of areas where excessive bycatch of juvenile cod, haddock, Greenland halibut, redfish or shrimp <15 mm CL is registered.
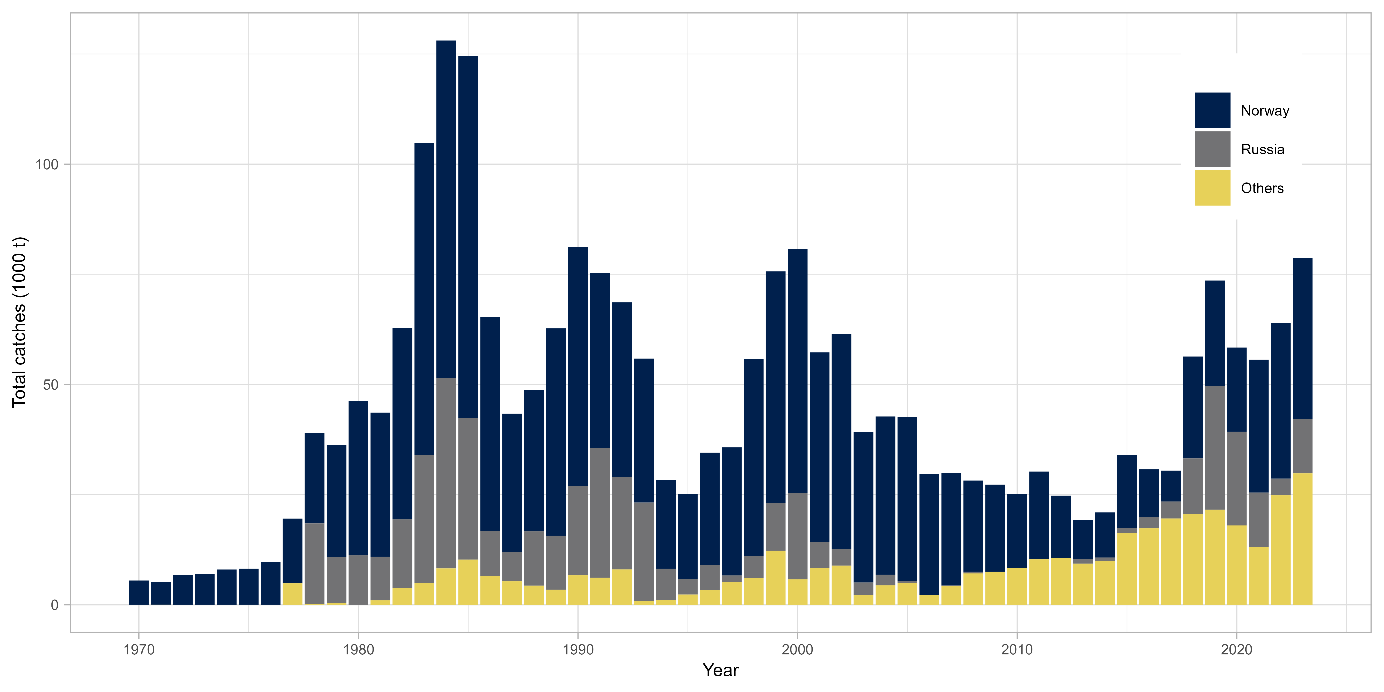
Landings. Landings have increased from 19 248 t in 2013 to above 55 000 t in the past 6 years. Catches in 2023 are estimated to be the highest since 1990.
2013
2014
2015
2016
2017
2018
2019
2020
2021
20221
20231
Catch
19 248
20 963
34 022
30 748
30 441
56 341
73 582
58 380
55 641
63 969
78 643
Norway
8 846
10 234
16 618
10 898
7 010
23 126
23 924
19 115
30 177
35 329
36 535
Russia
1 067
741
1 151
2 491
3 849
12 561
28 081
21 265
12 379
3 790
12 288
Others
9 335
9 988
16 252
17 359
19 582
20 653
21 576
17 999
13 085
24 849
29 819
1 Preliminary
Table 1: Recent catches in tonnes, as used for the assessment by country. Catches for 2022 and 2023 are based on preliminary information.
Figure 1: Total reported catches by country and year. Catches for 2022 and 2023 are based on preliminary catch reporting.
Discards and bycatch Discards of shrimp cannot be quantified but are believed to be small as the fishery is not limited by quotas. Bycatch rates of other species are estimated from at-sea inspections and research surveys and are corrected for differences in gear selection pattern (ICES 2018a) and raised with the corresponding shrimp catches from logbooks to give an overall bycatch estimate. Revised and updated discards estimates (1983–2017) of cod, haddock and redfish juveniles in the Norwegian commercial shrimp fishery in the Barents Sea were available in 2018. Since the introduction of the Nordmøre sorting grid in 1992, only small individuals of cod, haddock, Greenland halibut, and redfish, in the 5–25 cm size range, are caught as bycatch.
In 2017, specific information on bycatch from EU-Estonia based on onboard scientific observers was presented. They indicated 2.9% by weight of fish discards and 0.6% discards of shrimp. Collecting bags, an extra codend mounted on the shrimp trawl for catching ground fish as bycatch, are being used by some EU vessels. Attempts to quantify the magnitude of this type of bycatch have been made (see ICES 2022c).
Ecosystem considerations. Since the 1980s, the Barents Sea has shifted from a situation with high fishing pressure, cold conditions and low demersal fish stock levels, to a state of high levels of demersal fish stocks, reduced fishing pressure and warm conditions. A steady decline of Atlantic cod ( Gadus morhua ) may, however, indicate a changing trend and possibly reduce predation pressure on northern shrimp ( Pandalus borealis ). More detailed information on ecosystem dynamics in the Barents Sea can be found in ICES (2022a).
2 - Input data
2.1 - Commercial fishery data
Information on catches by country were retrieved from the ICES database and complemented with catch information from the Norwegian landings register for the assessment year. Logbook data are normally available only from the Norwegian fleet. For 2020 - 2023 summary catch and effort data was received from Poland, Latvia, Lithuania and Estonia. In addition, information was provided by Russia, including information on catches in current year, catch distribution and standardized catch rates.
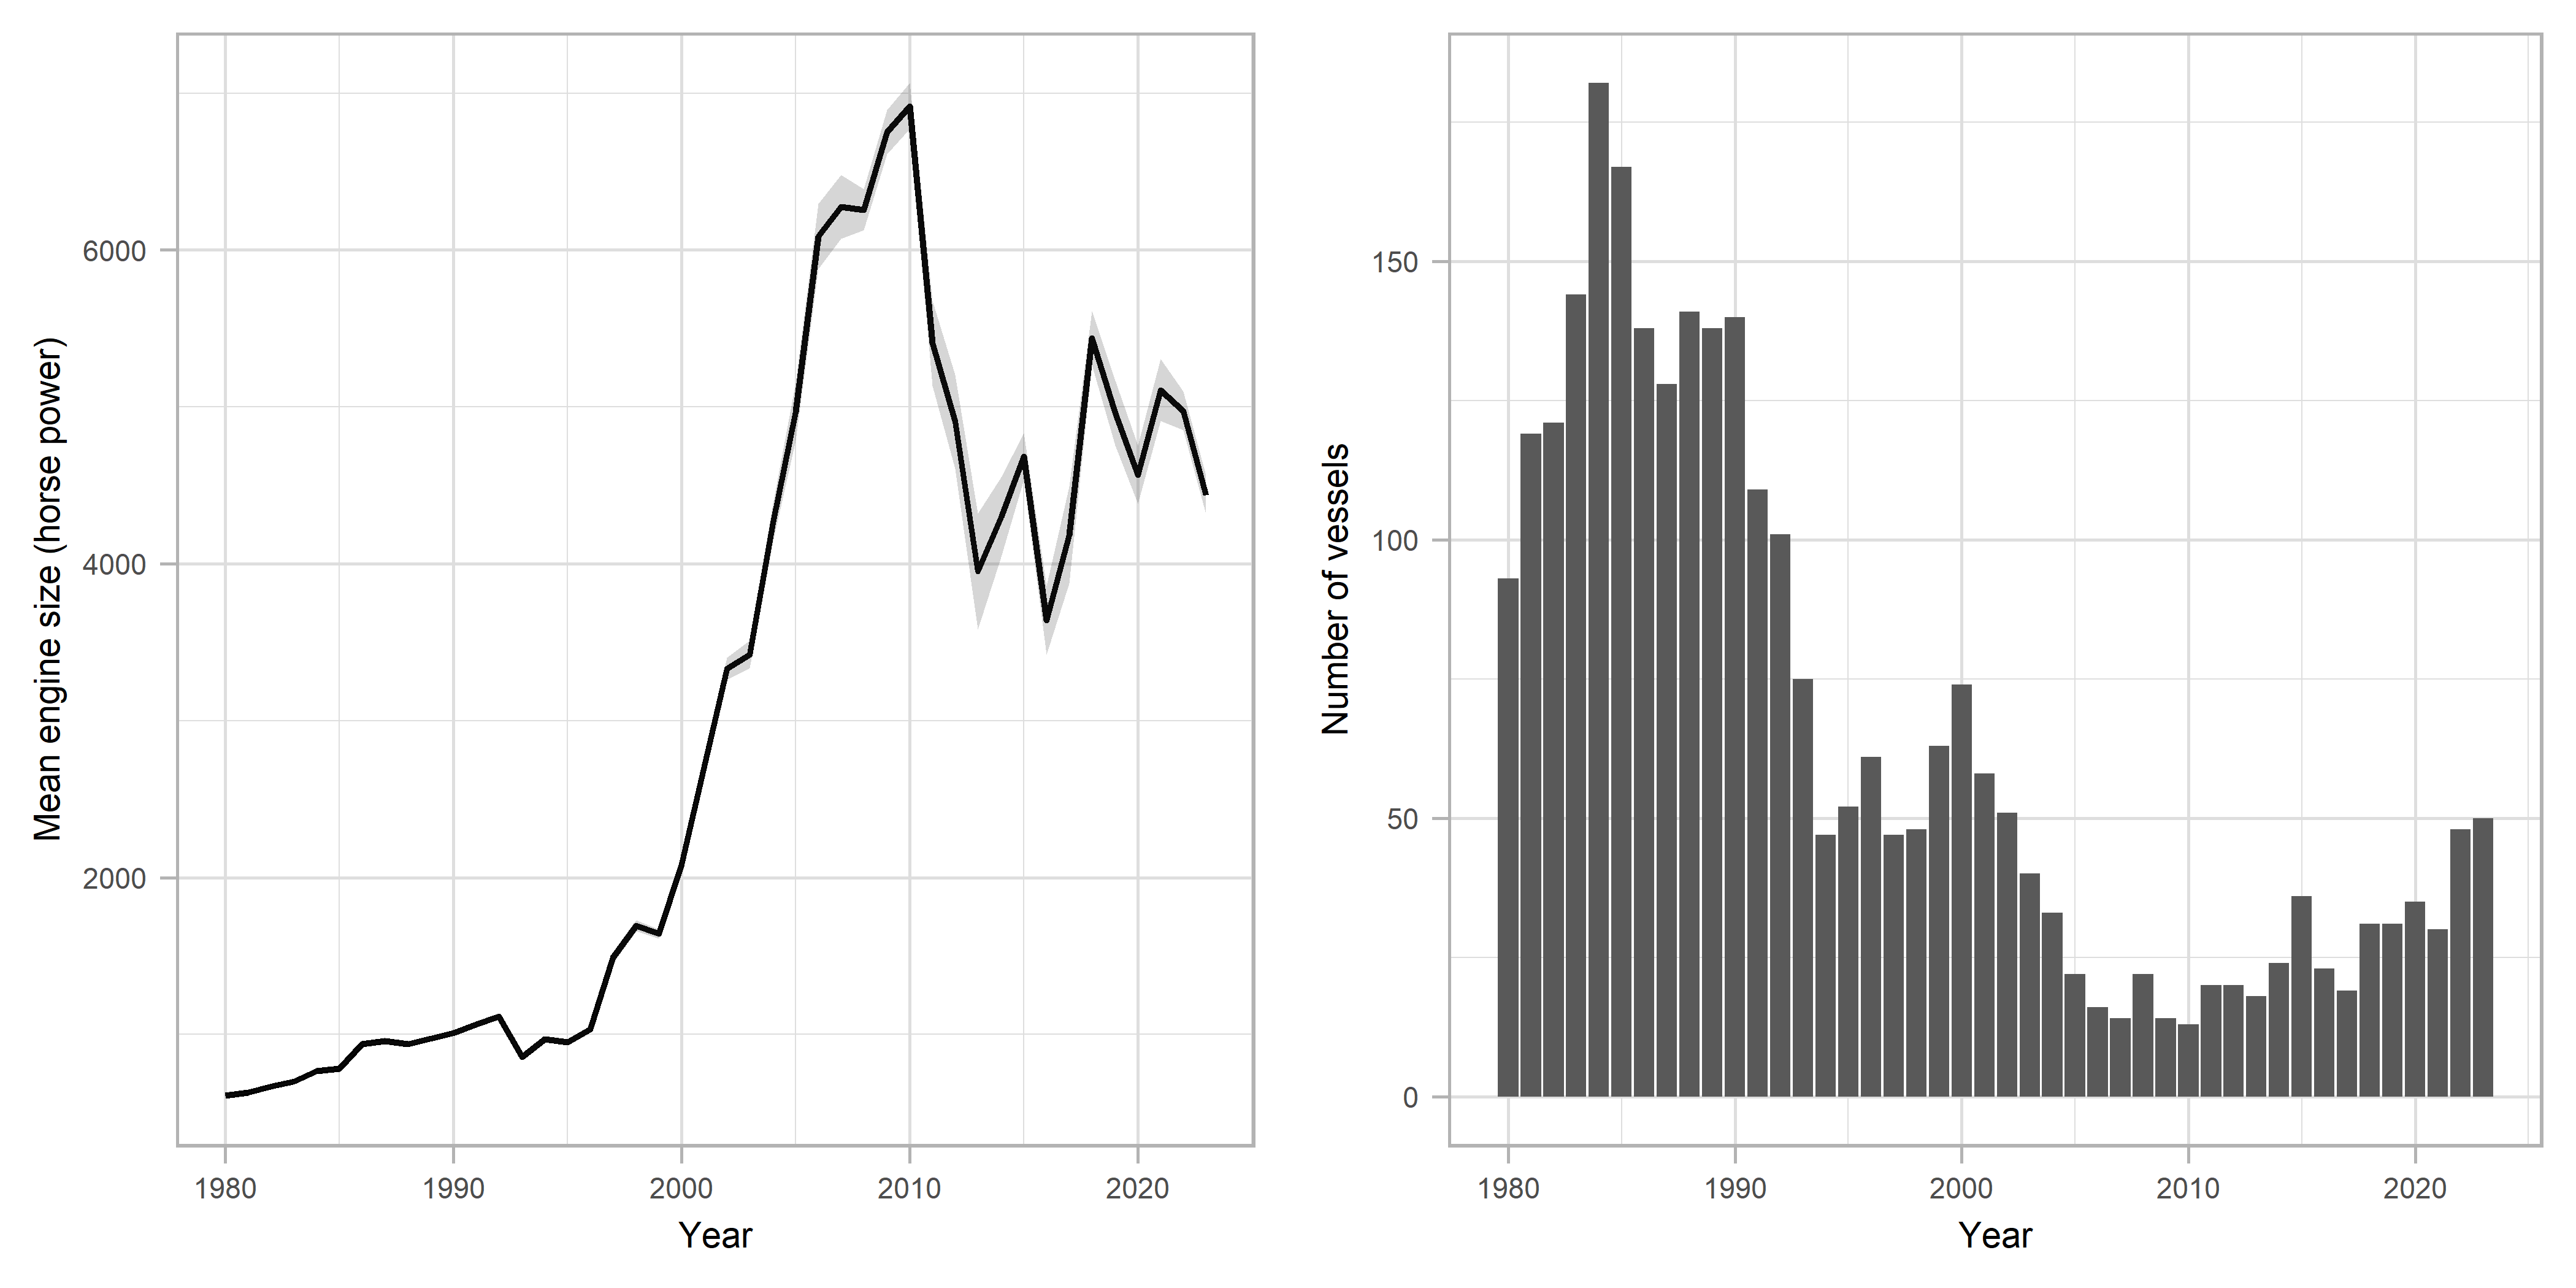
A major restructuring of the Norwegian shrimp fishing fleet towards fewer and larger vessels took place during the late-1990s through the early 2000s (Figure 2). Until 1996, the fishery was conducted using single trawls only. Double and triple trawls were then introduced. An individual vessel may alternate between single and multiple trawling depending on fishing conditions.
Figure 2: Mean engine power (HP) weighted by trawl-time (left) and number of vessels (right) in Norwegian fleet. Data are based on logbook registrations.
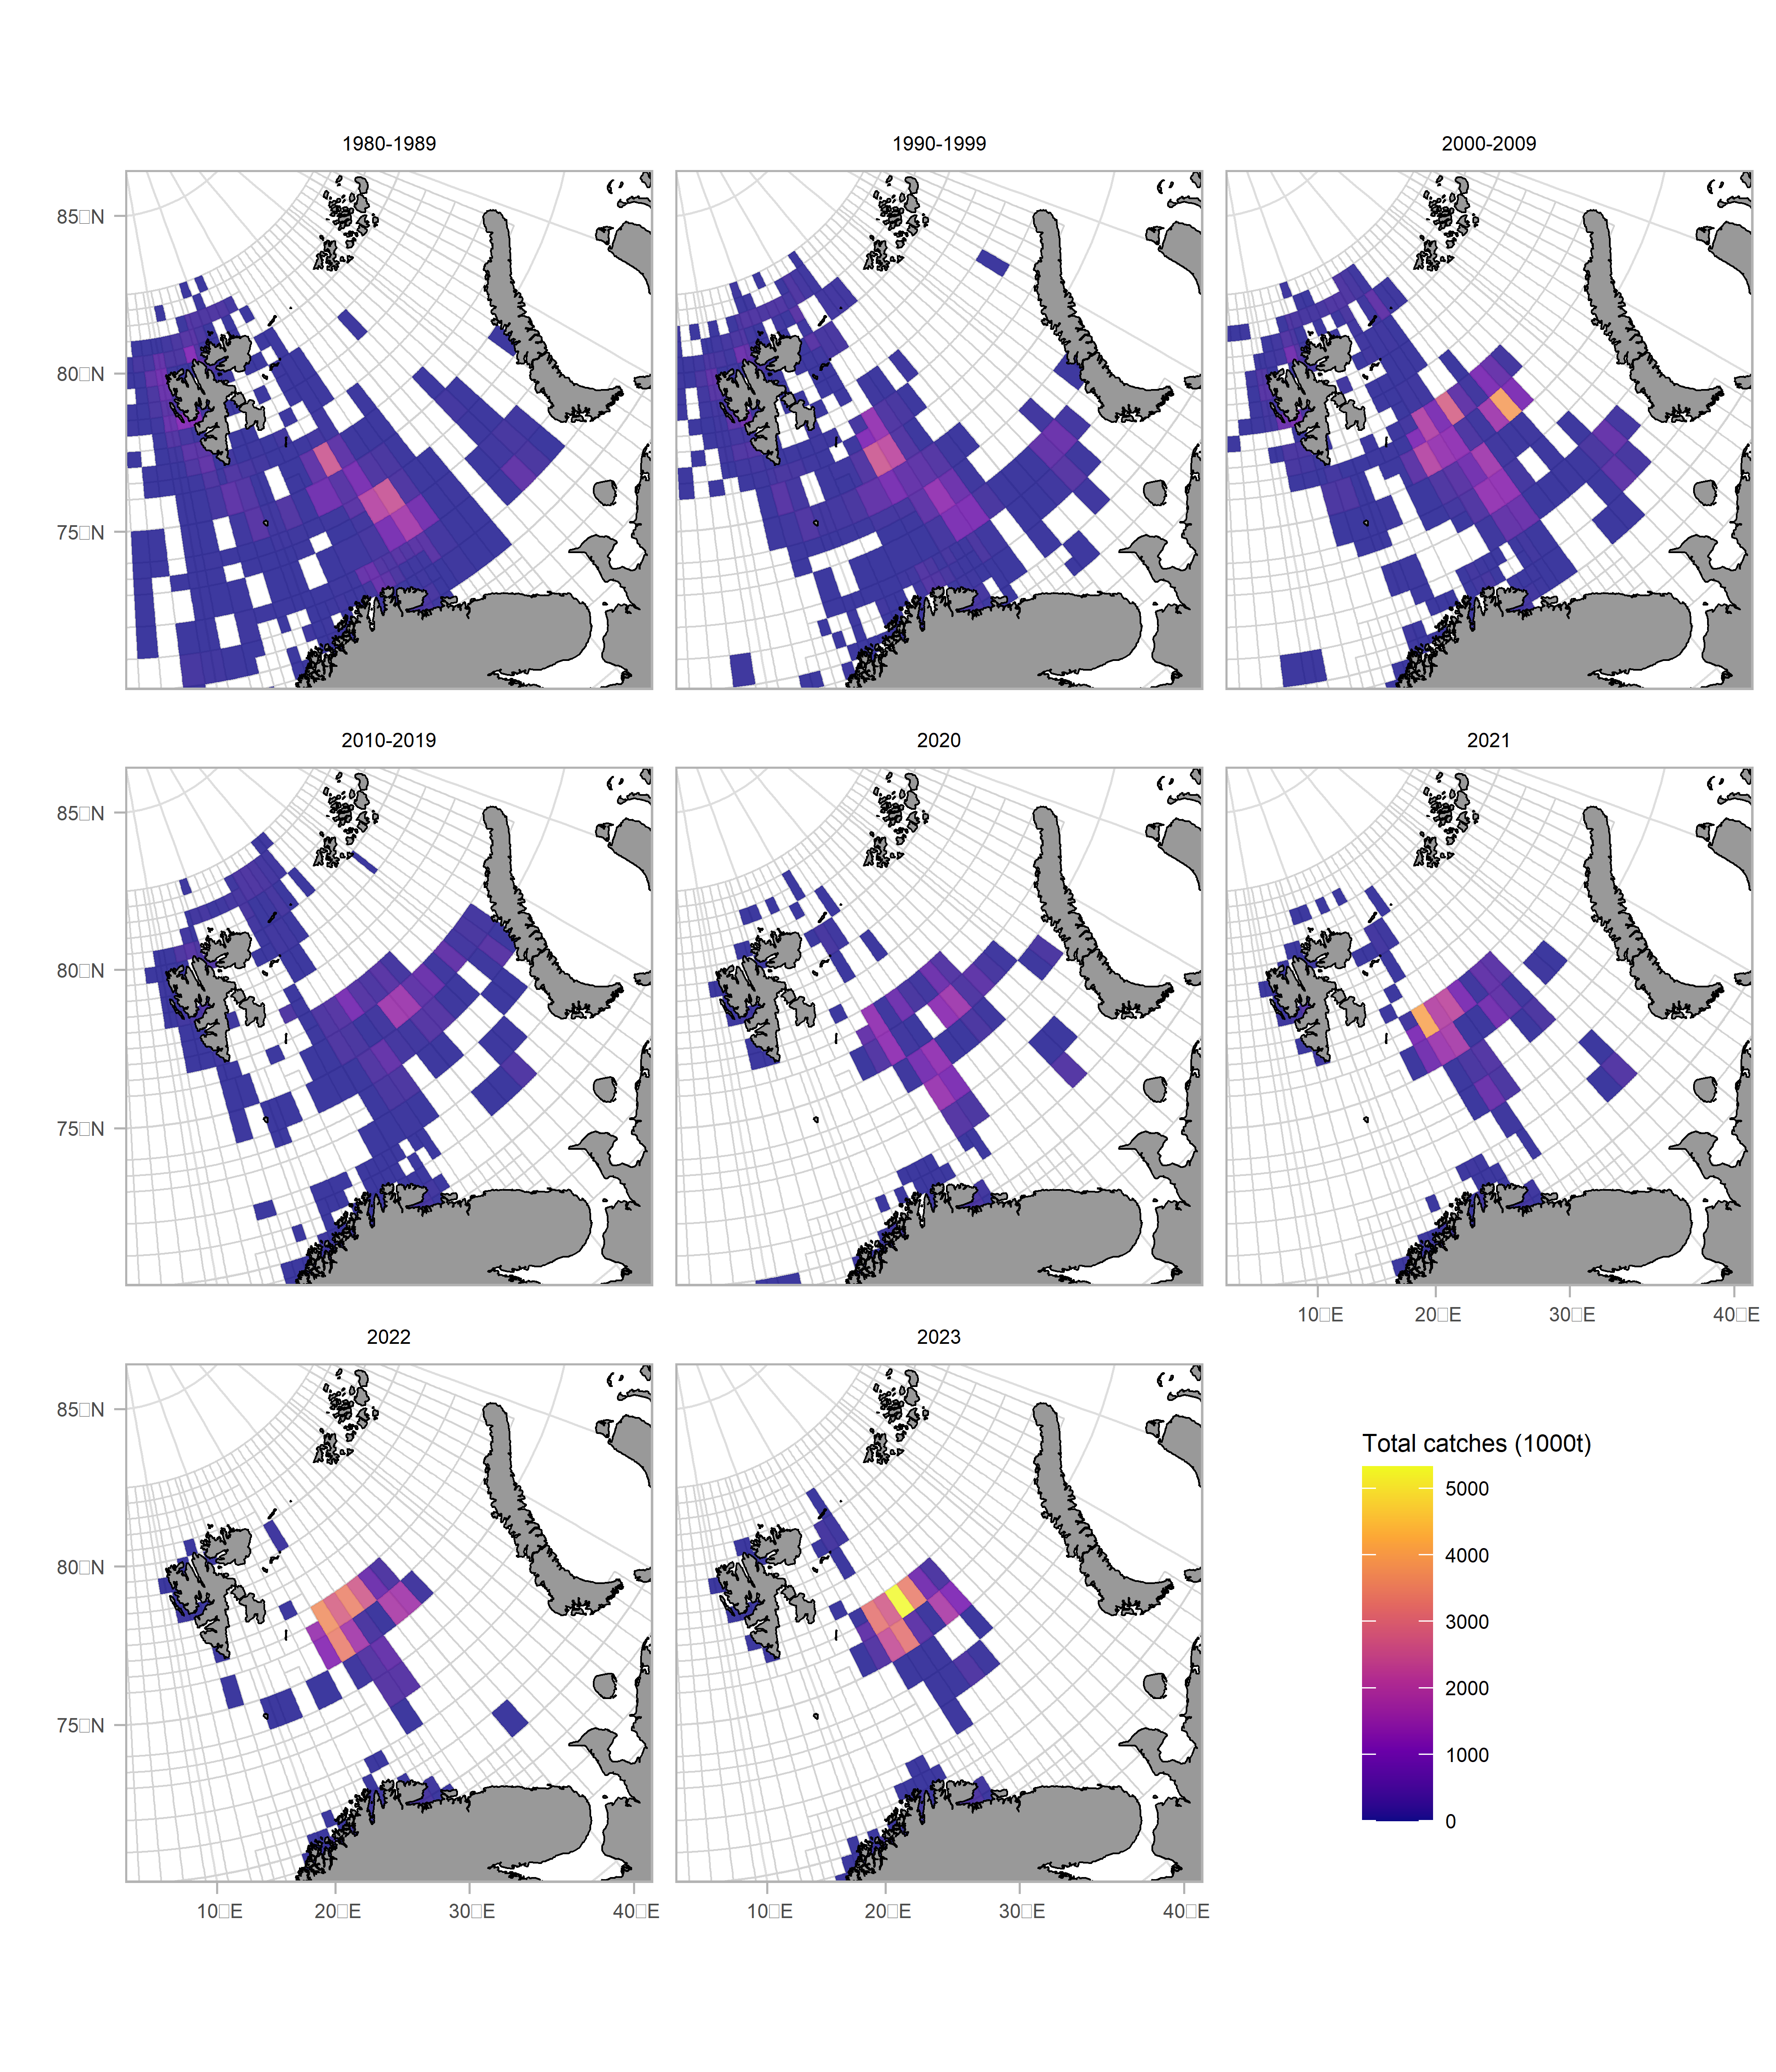
The fishery takes place throughout the year but can be seasonally restricted by ice conditions. Fishing activity is generally in October through March, the highest in May to August. The fishery was originally conducted mainly in the central Barents Sea and on the Svalbard Shelf along with the Goose Bank (southeast Barents Sea). Norwegian logbook data since 2009 show decreased activity in the Hopen Deep and around Svalbard, coupled with increased effort further east in international waters (the “Loophole”) (Figure 3). Information from the Norwegian industry points to decreasing catch rates and more frequent area closures due to bycatch of juvenile fish on the traditional shrimp fishing grounds as the main reasons for the observed change in fishing pattern.
The Soviet/Russian fishery for the northern shrimp in the Barents Sea started in 1978. Catches peaked in 1983-1985 and varied in subsequent years (Figure 1). From 2005 onward, the Russian fishery for shrimp largely ceased and just rebounded 10 years later following a restructuring of the fleet. Catches increased above 20 000 t in 2019 before decreasing to lower levels in recent years. In the early 2000s, the Russian fishery was mainly conducted in the open part of the Barents Sea and the Svalbard area, but later the main fishing grounds shifted eastward. Currently fishing occurs in the Russian EEZ in the areas of the Novaya Zemlya Bank, the Perseus Upland, Cape Zhelaniya and Cape Sukhoi Nos. The main fishing period is March to September; however, some vessels fish all year round.
A standardized CPUE index based on Russian logbook data that that took area, depth, gear, and month into account in a generalized additive mixed model (GLM), was stable from 2000 to 2015. From a maximum in 2019 it decreased by 23% in 2020, but increased again in recent years. This standardized CPUE was not evaluated at the 2022 benchmark and is at this point not used as input to the assessment model.
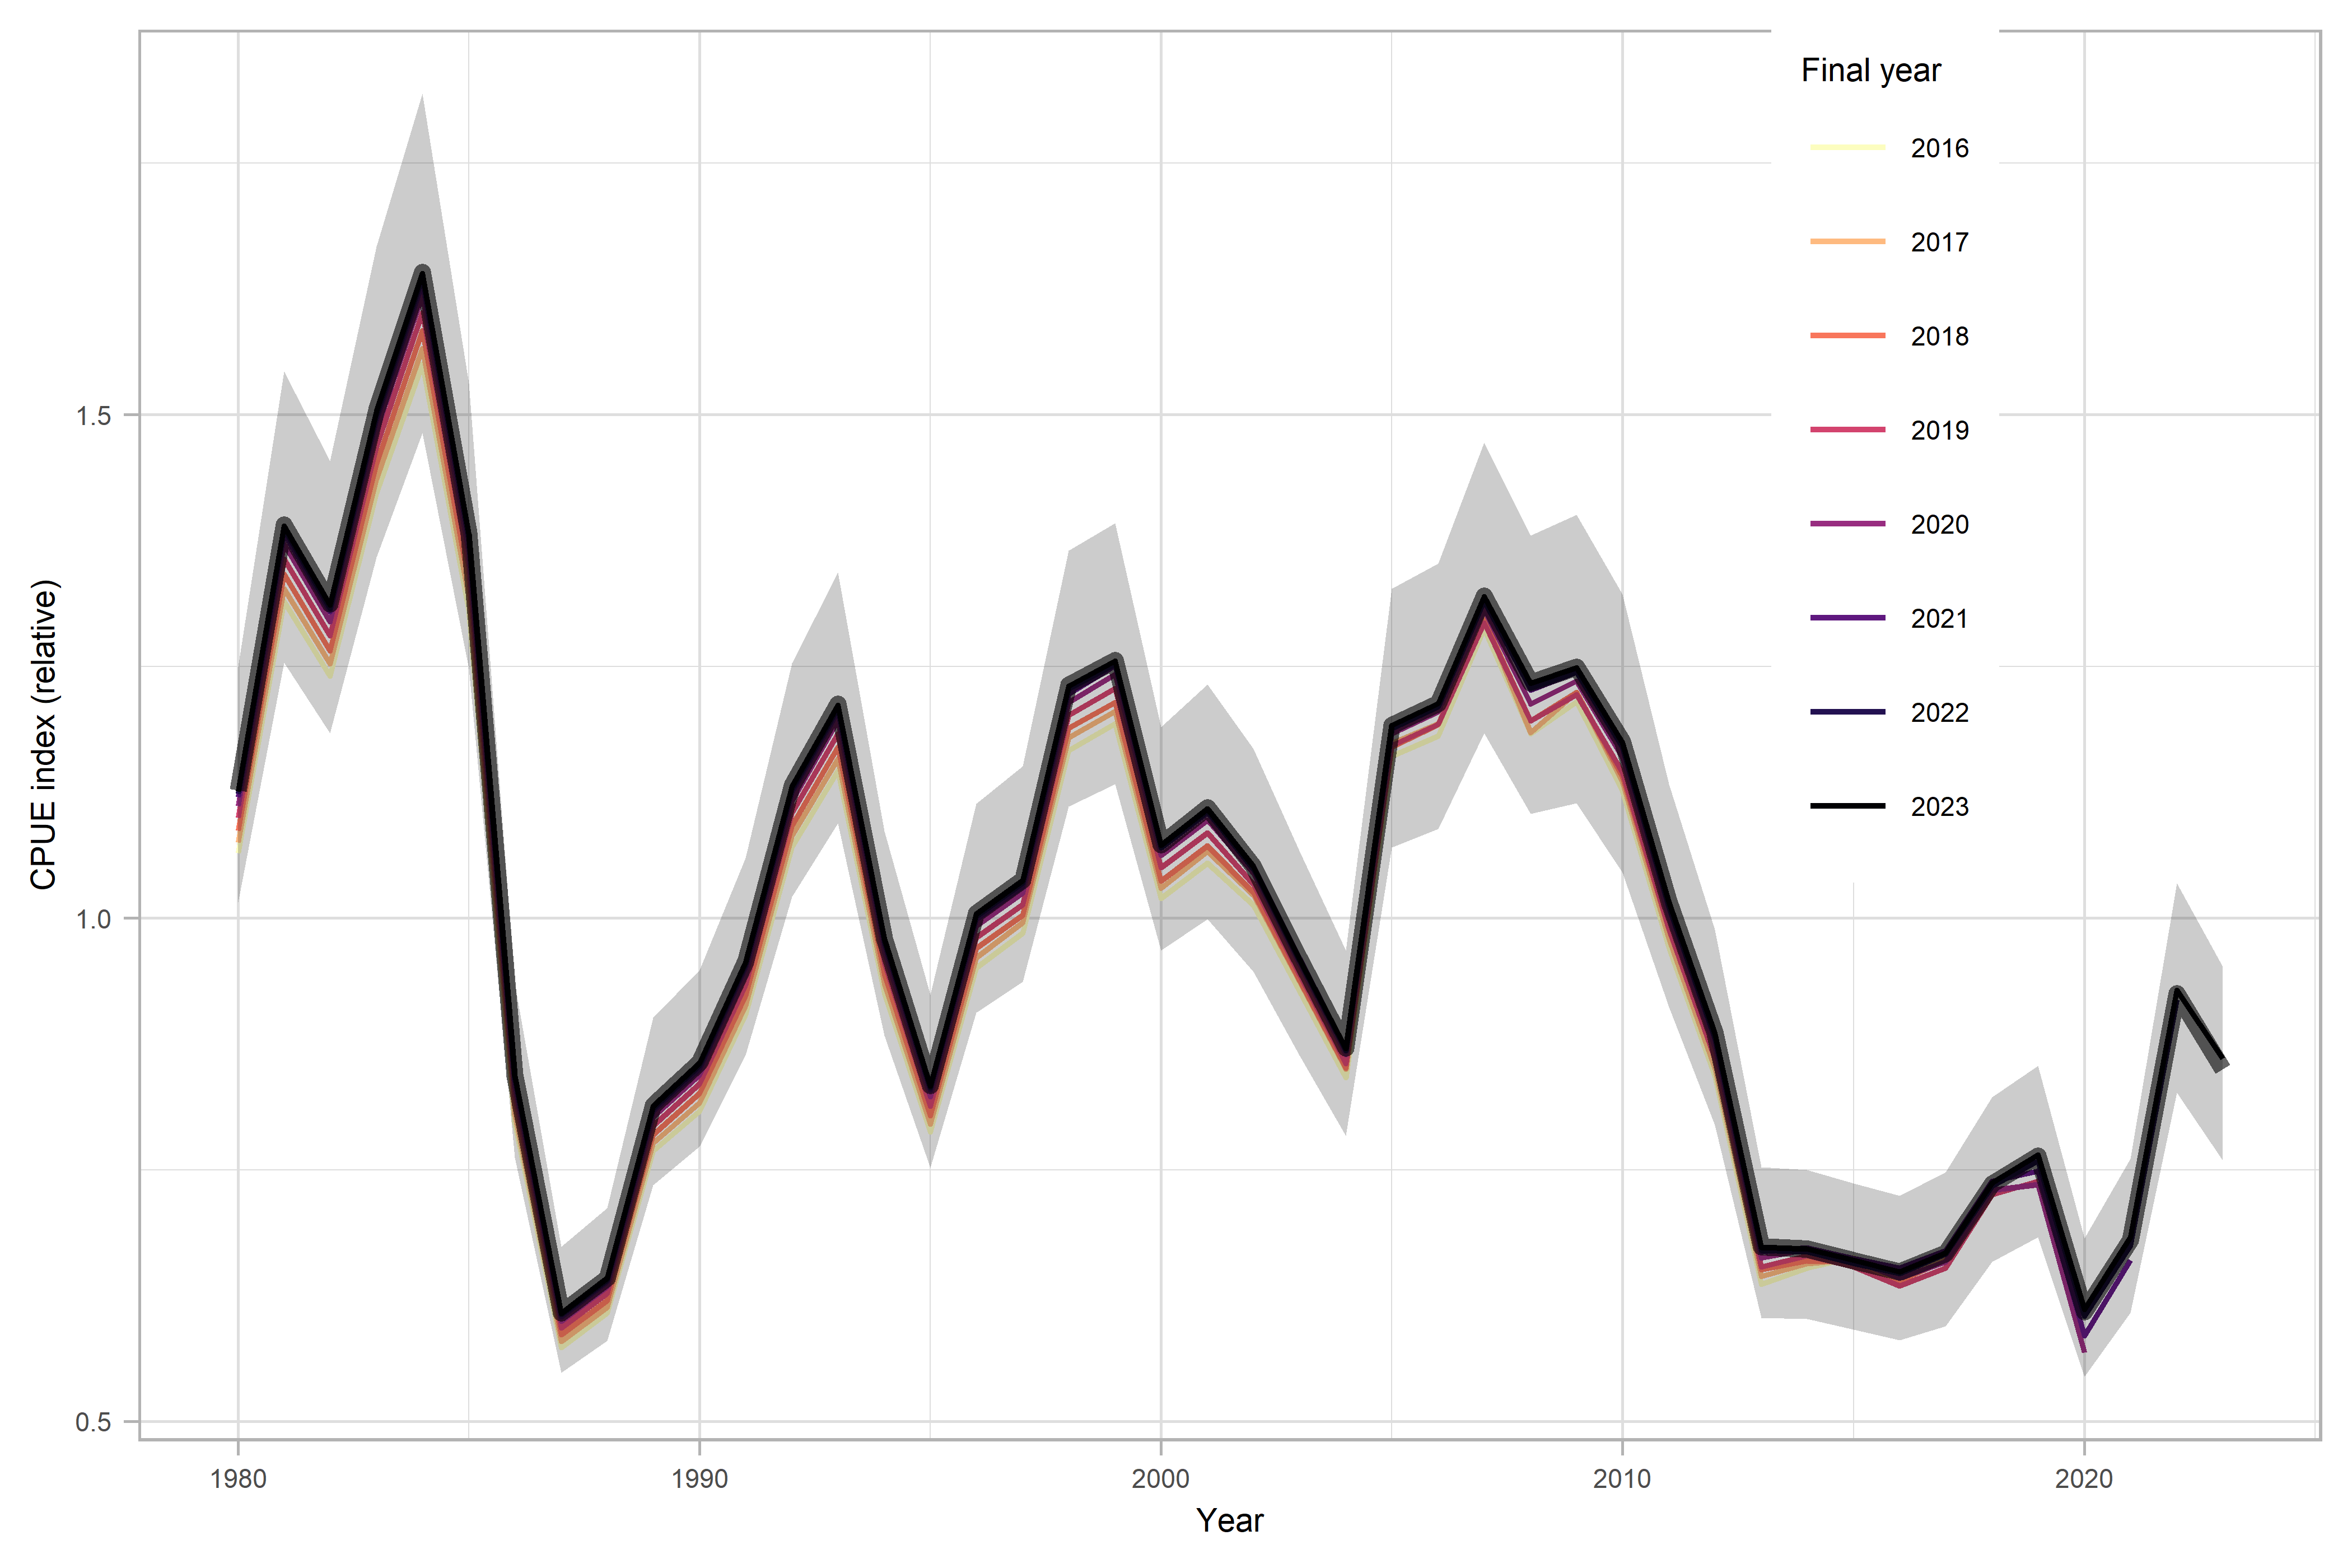
Norwegian logbook data were used in a generalized additive mixed model (GAMM) to calculate standardized annual catch rate indices (ICES 2022b). The GAMM used to derive the CPUE indices was implemented in glmmTMB (Brooks et al 2017) and included the following variables: (1) vessel and (2) area (five survey strata) as random intercepts, (3) season (month) and (4) gear type (single, double or triple trawl) as categorical fixed effects, and vessel size (registered length) as continuous effect with a smooth spline (restricted to 3 knots). The underlying data combines logbook data with lower resolution prior to 2011 with electronic logbooks from 2011 onward. The approach estimation method has been evaluated and revised during the last benchmark (ICES 2022b), resolving prior robustness issues and resulting in a stable index (Figure 4).
The resulting series provides an index of the fishable biomass of shrimp ≥17 mm CL, i.e. females and older males. The minimum commercial size in this fishery is 15mm. The Norwegian logbook data on which the CPUE index is based represents fishing activity from most of the stock distribution area. Although in recent years the portion of total catches taken by Norway has varied, it has remained between one third and more than half of the total catches.
Figure 3: Distribution of annual catches by Norwegian vessels since 1980 based on logbook information. For periods before 2020, mean annual catches across a decade are shown. 2023 includes only data until November.
Figure 4: Standardized CPUE index based on Norwegian data. The solid black line shows the index used in the current assessment, and colored lines retrospective indices with data restricted to January-October in the final year, peeling off years back to 2016. Index values are centered around the mean of the series. The shaded area marks the 95% confidence intervals. Indices were standardized using a GAMM implemented in glmmTMB.
2.2 - Research survey data
Russian and Norwegian surveys were conducted in their respective EEZs of the Barents Sea from 1982 to 2004 to assess the status of the northern shrimp stock. In 2004, these surveys were replaced by the Norwegian-Russian Ecosystem Survey in August/September, which monitors shrimp along with a multitude of other ecosystem variables in the Barents Sea and around Svalbard (IMR-PINRO 2022).
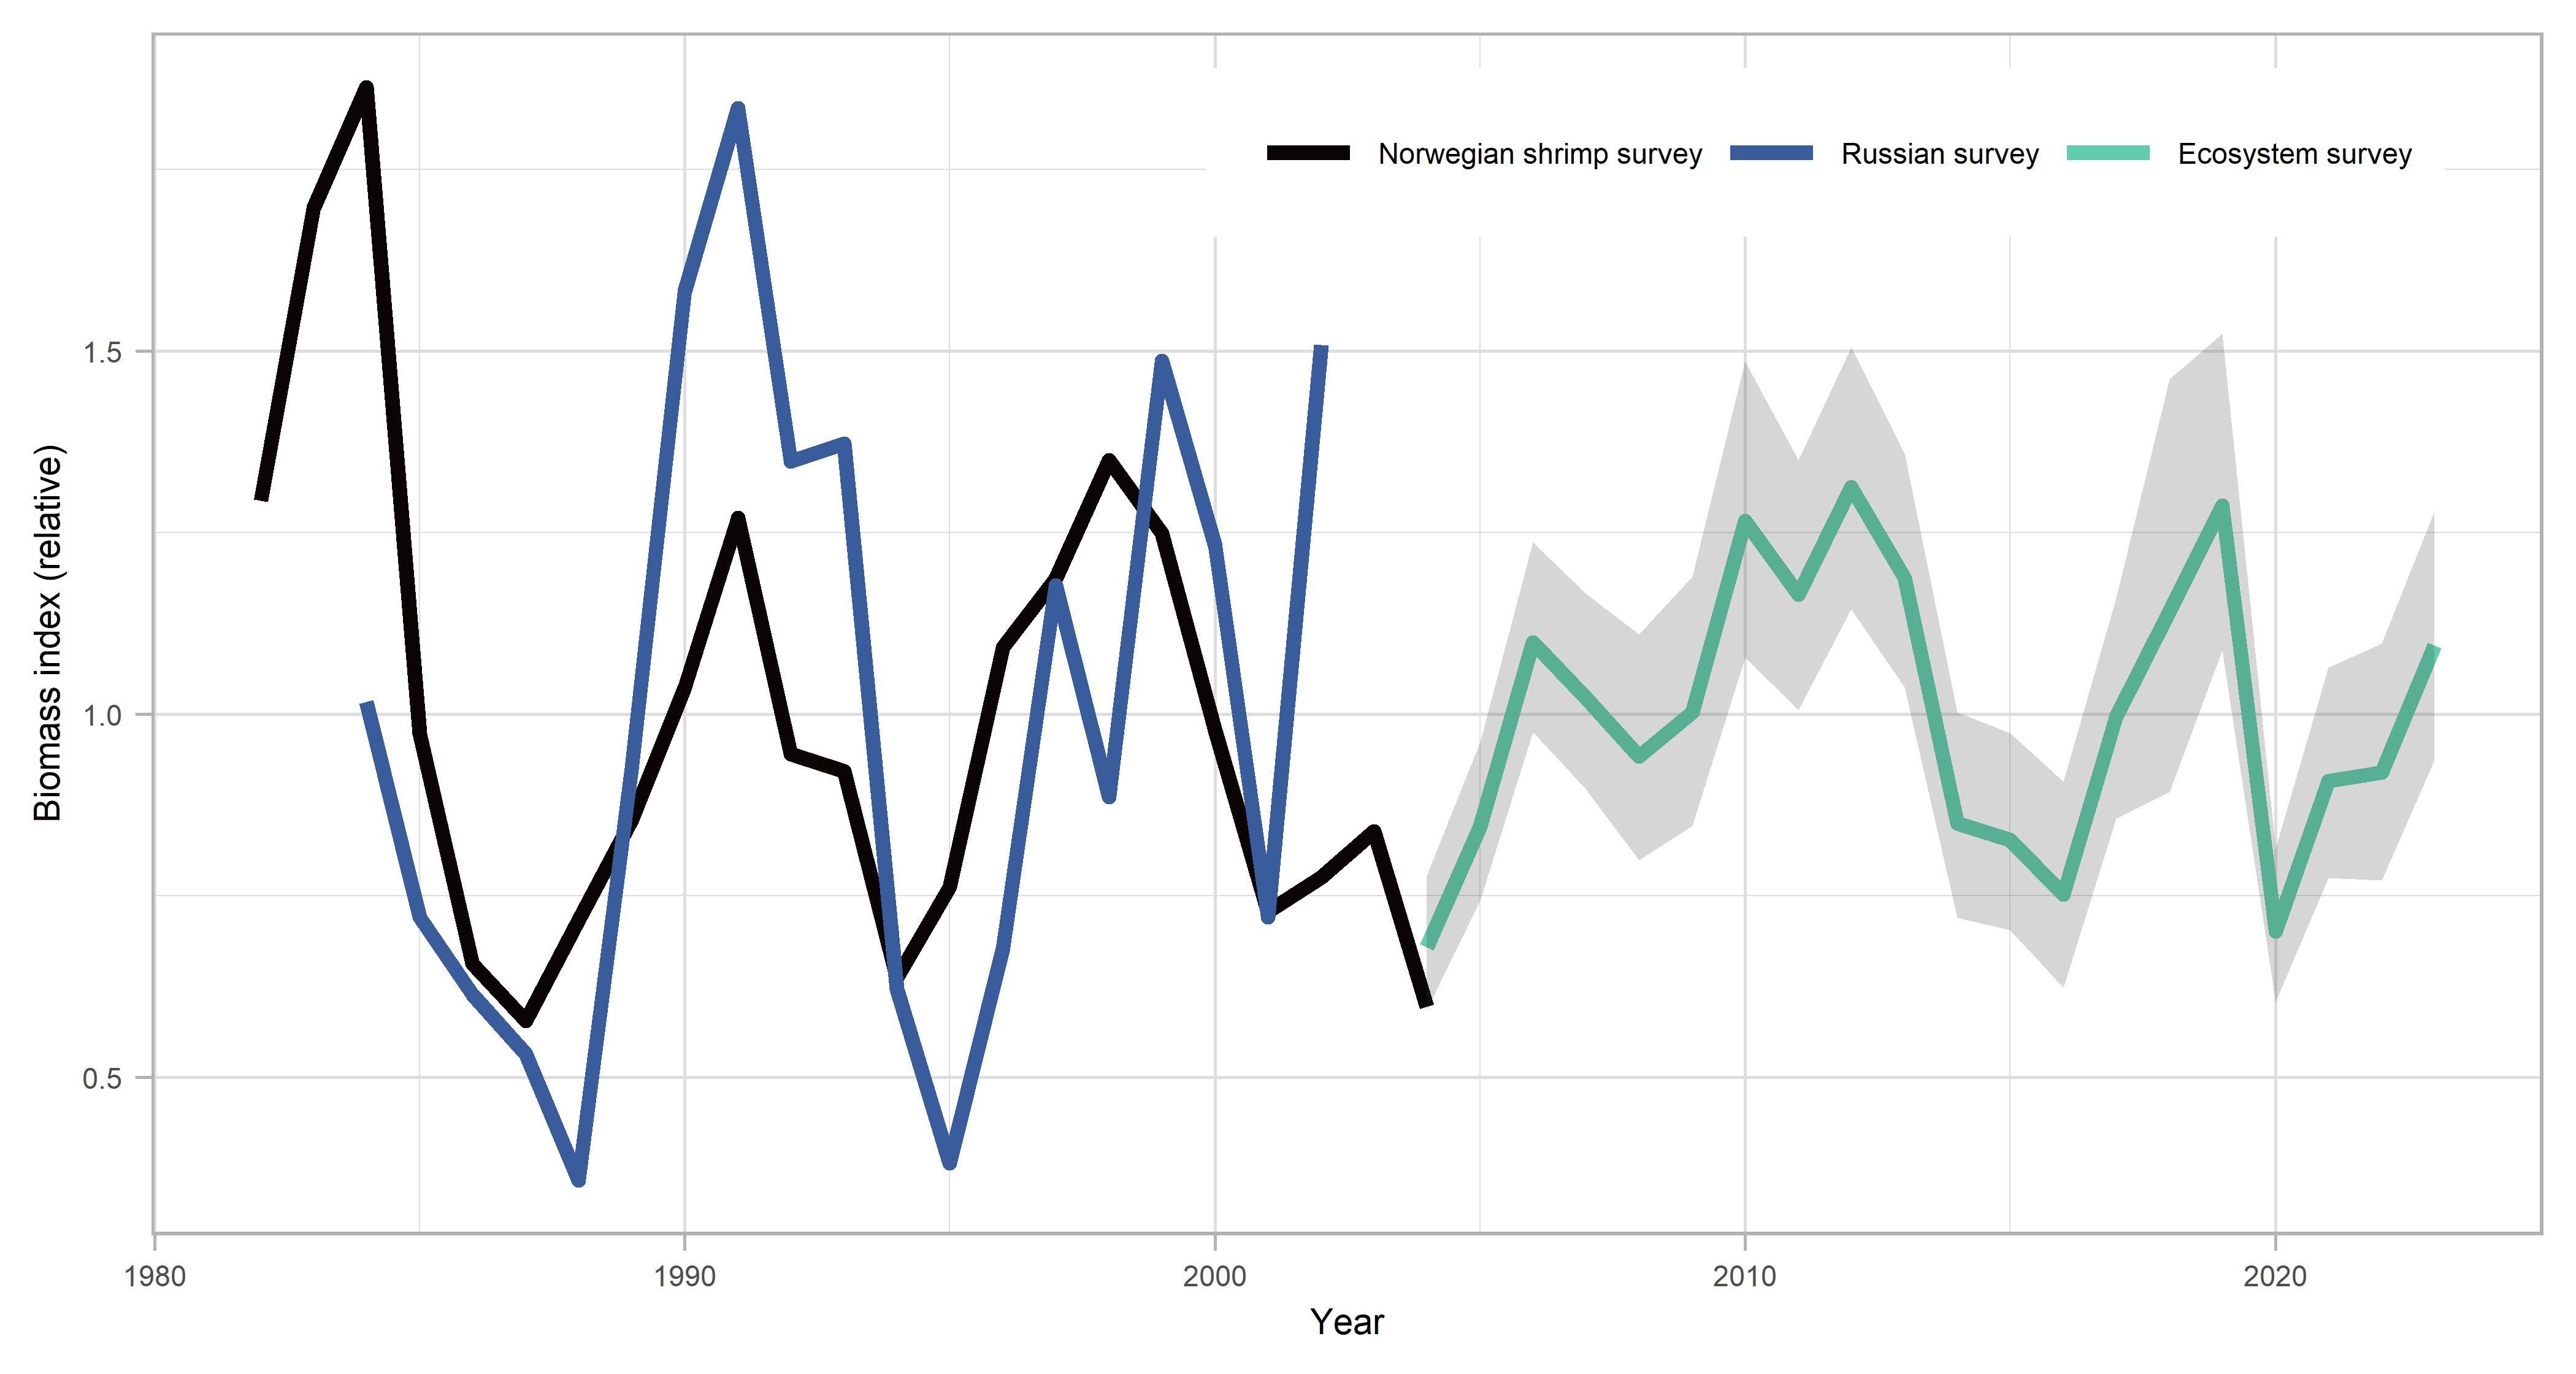
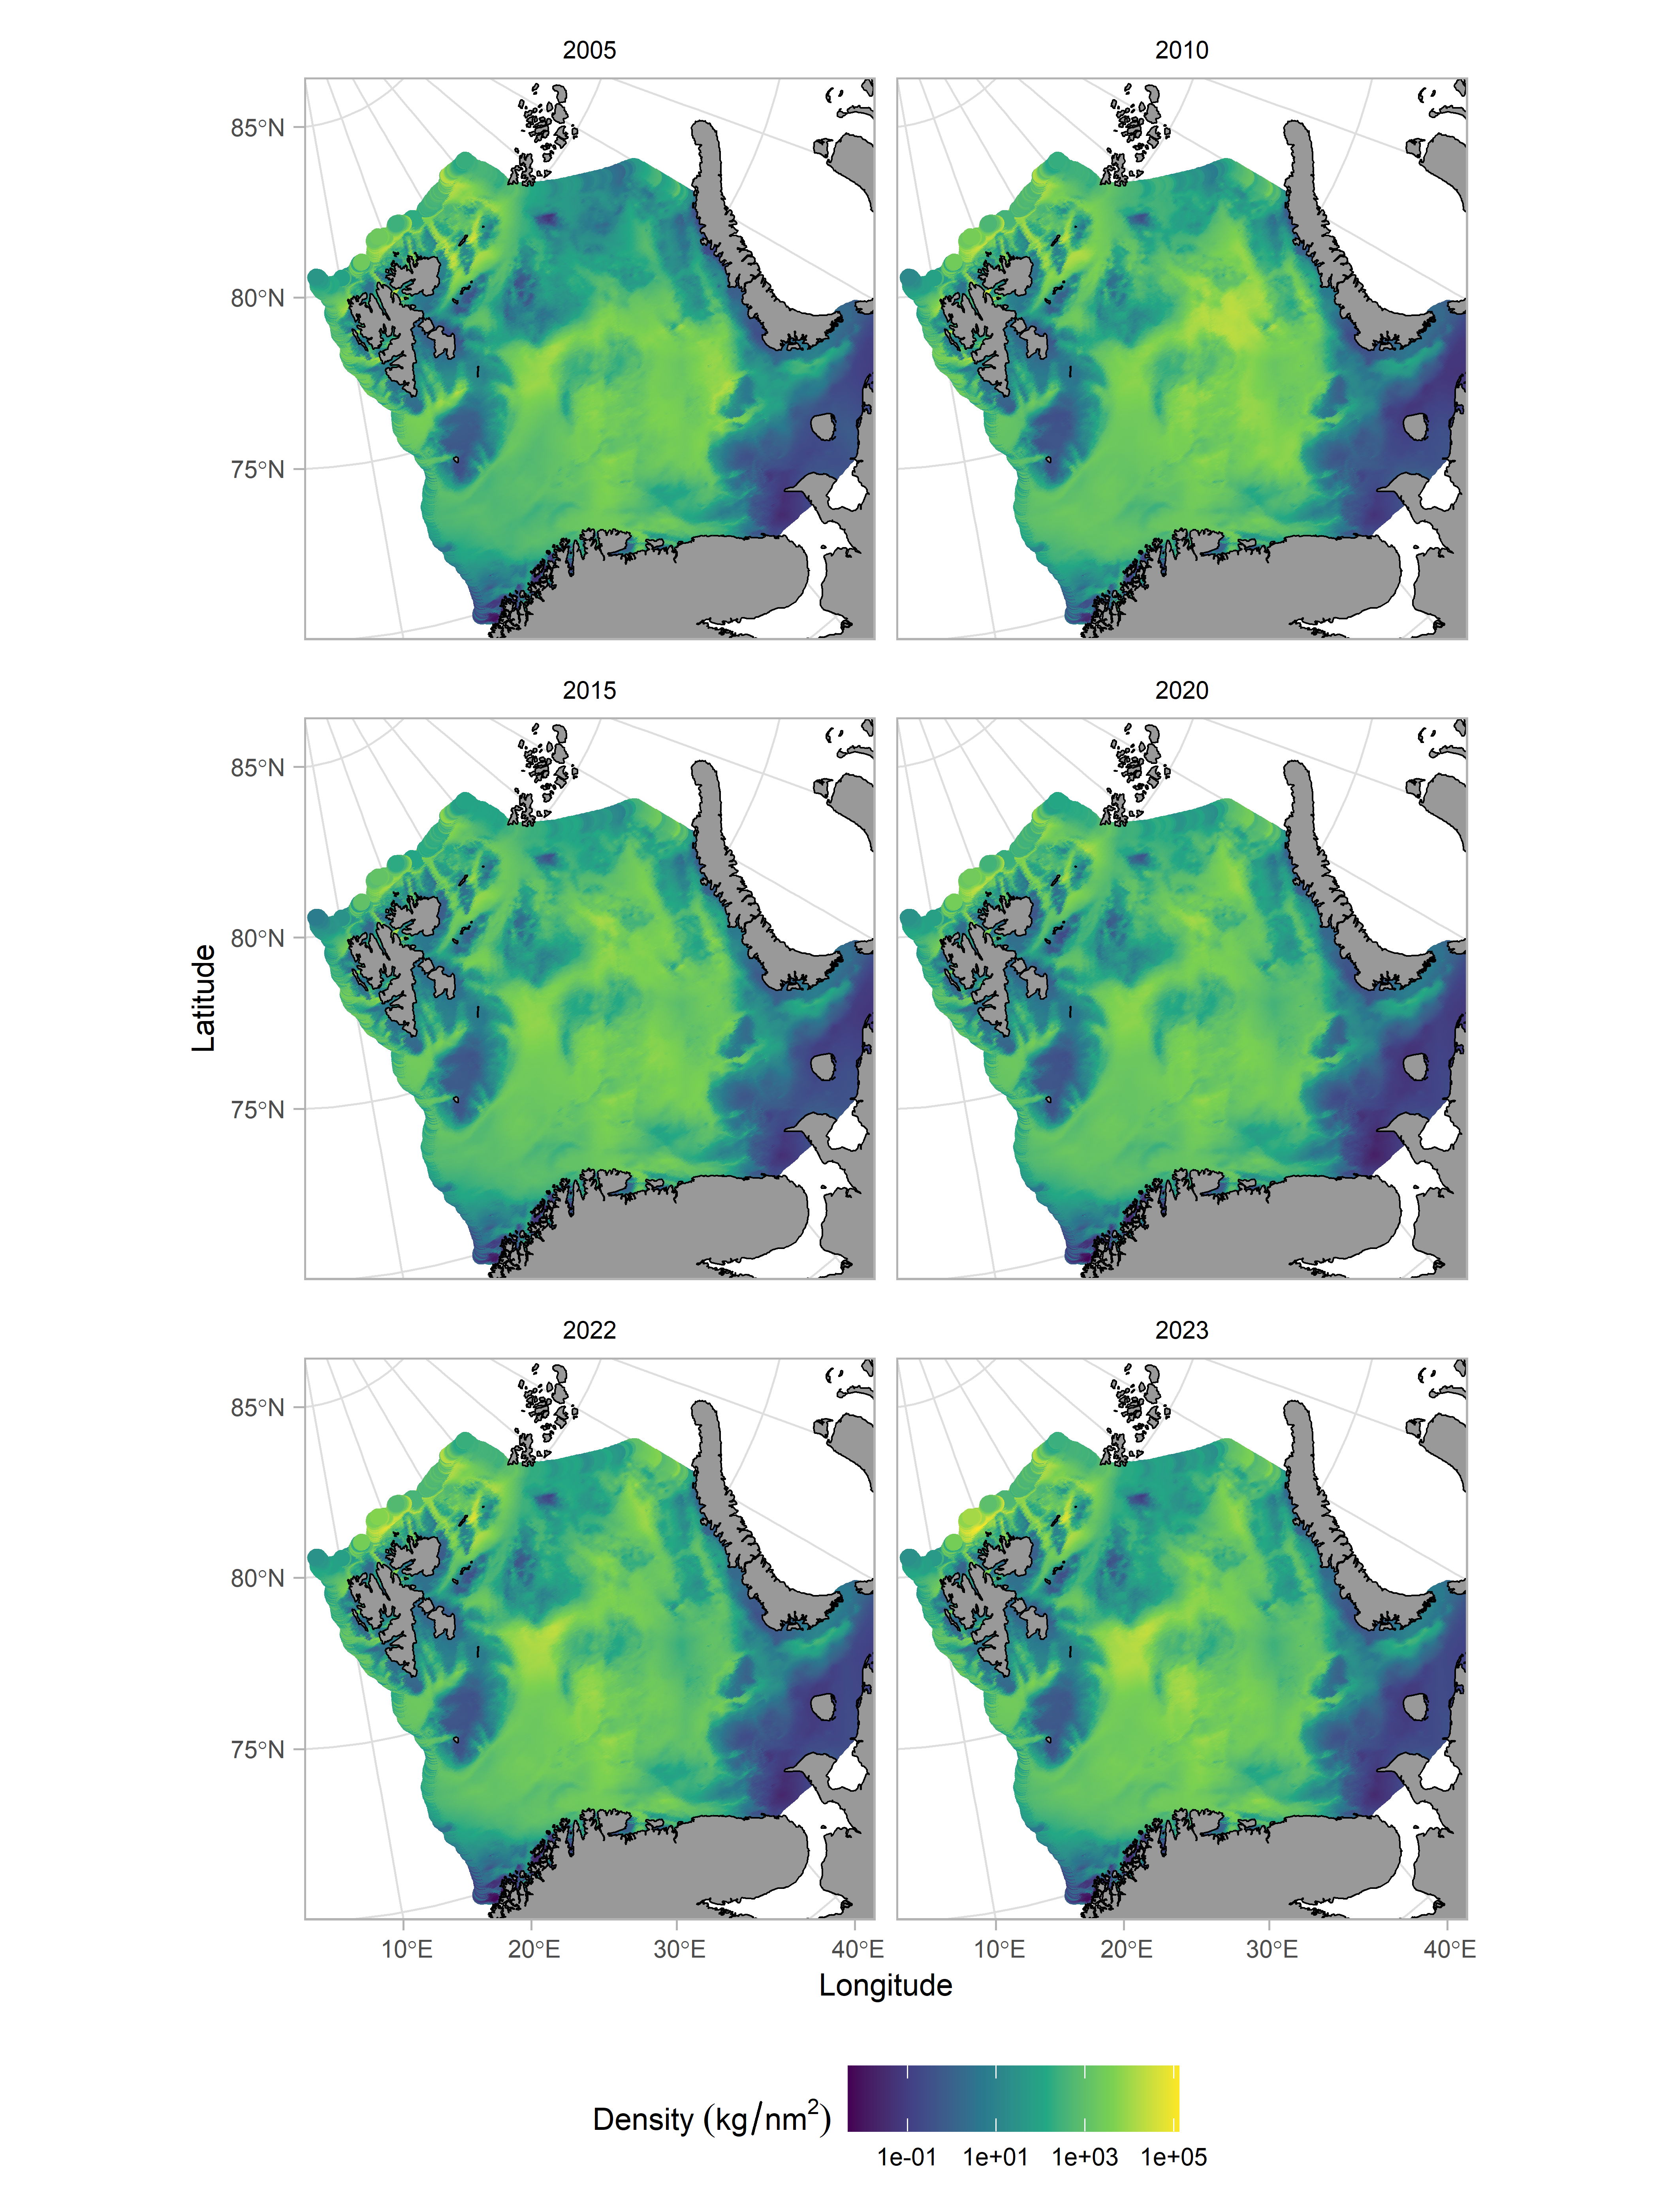
Biomass. The biomass indices of the Norwegian shrimp and Russian surveys have fluctuated without trend over their respective time periods covered (Figure 5). The most recent survey series, the ecosystem survey, has increased steadily over the last years after a low in 2020. The spatial distribution of shrimp biomass has been relatively stable over the recent survey period (Figure 6).
In general, the entire survey area of the ecosystem survey (Figure 6) is covered in all years, however, due to heavy ice conditions in 2014 the northern part of the area was not covered, and in 2020 and 2022, parts of the survey were not conducted or at a later stage due to technical problems with survey vessels. In 2022, data from the Russian EEZ were not available in time but have been included in the current assessment.
During the benchmark in 2022, estimation methods for the ecosystem survey index were evaluated to determine a suitable approach that can handle better incomplete coverage (ICES 2022b). A geostatistical model was subsequently adopted to replace the prior design-based approach, using a GAMM implemented in the R-package sdmTMB (Anderson et al 2022) that includes spatio-temporal correlation. In the modelled index, missing coverage is predicted out of the estimated relationship between shrimp density and depth as well as the spatio-temporal random fields. The new method provides a robust approach that relies on established statistical methodology, provides uncertainty estimates, and improves on the past ad-hoc approaches to produce indices in situations with incomplete coverage.
Figure 5: Indices of stock biomass from the (1) joint Russian-Norwegian ecosystem survey (since 2004), (2) Norwegian shrimp survey (1982-2004), and (3) the Russian survey (1984-2005). Lines show the mean estimates, the shaded area the 95% confidence interval. All indices were standardized to their respective mean.
Figure 6: Spatial distribution of shrimp biomass based on ecosystem system survey data. Biomass is predicted with a GAMM including spatio-temporal correlation that was used to produce the standardized survey index.
Recruitment indices. The benchmark in 2022 (ICES 2022b) concluded that availability of length data from the joint ecosystem survey was too inconsistent and spatially incomplete for extracting reliable information about changes in size composition or recruitment.
3 - Assessment
The modelling framework introduced in 2022 (ICES 2022b) was used for the assessment. Model settings were the same as those determined during the benchmark meeting. However, the observation error for the total catch in the final year was doubled to account for uncertainty in preliminary catches.
The model is formulated in the state-space framework Surplus production in Continuous Time (SPiCT), implemented in the R package with the same name (Pedersen and Bergen 2017). Within this model, parameters relevant for the assessment and management of the stock are estimated, based on a stochastic version of a surplus-production model. The model synthesized information from priors, four independent stock indices and the time series of total shrimp catches. The shape of the surplus production function was fixed to a Schaefer-type shape (shape parameter = 2).
Input time series. The input data consisted of standardized stock indices from time series of annual fishery catch rates for 1980-2023 (Figure 4) and trawl-survey biomass indices for 1982–2004, 1984–2005 and for 2004–2023 (Figure 5). These indices were scaled to stock biomass by individual catchability parameters, q, with lognormal observation errors. Total reported catches in ICES Division 1 and 2 since 1970 were used as removals (Figure 1). Catches are being estimated in the model and are, thus, not treated as error-free values. Biomass, B, was estimated relative to the biomass that would yield maximum sustainable yield (MSY), BMSY. The estimated fishing mortality, F, refers to the removal of biomass by fishing and is scaled to the fishing mortality at MSY, FMSY . Model specification, fitting procedure and diagnostics followed the standard recommendations (Berg et al 2021, Mildenberger et al 2021).
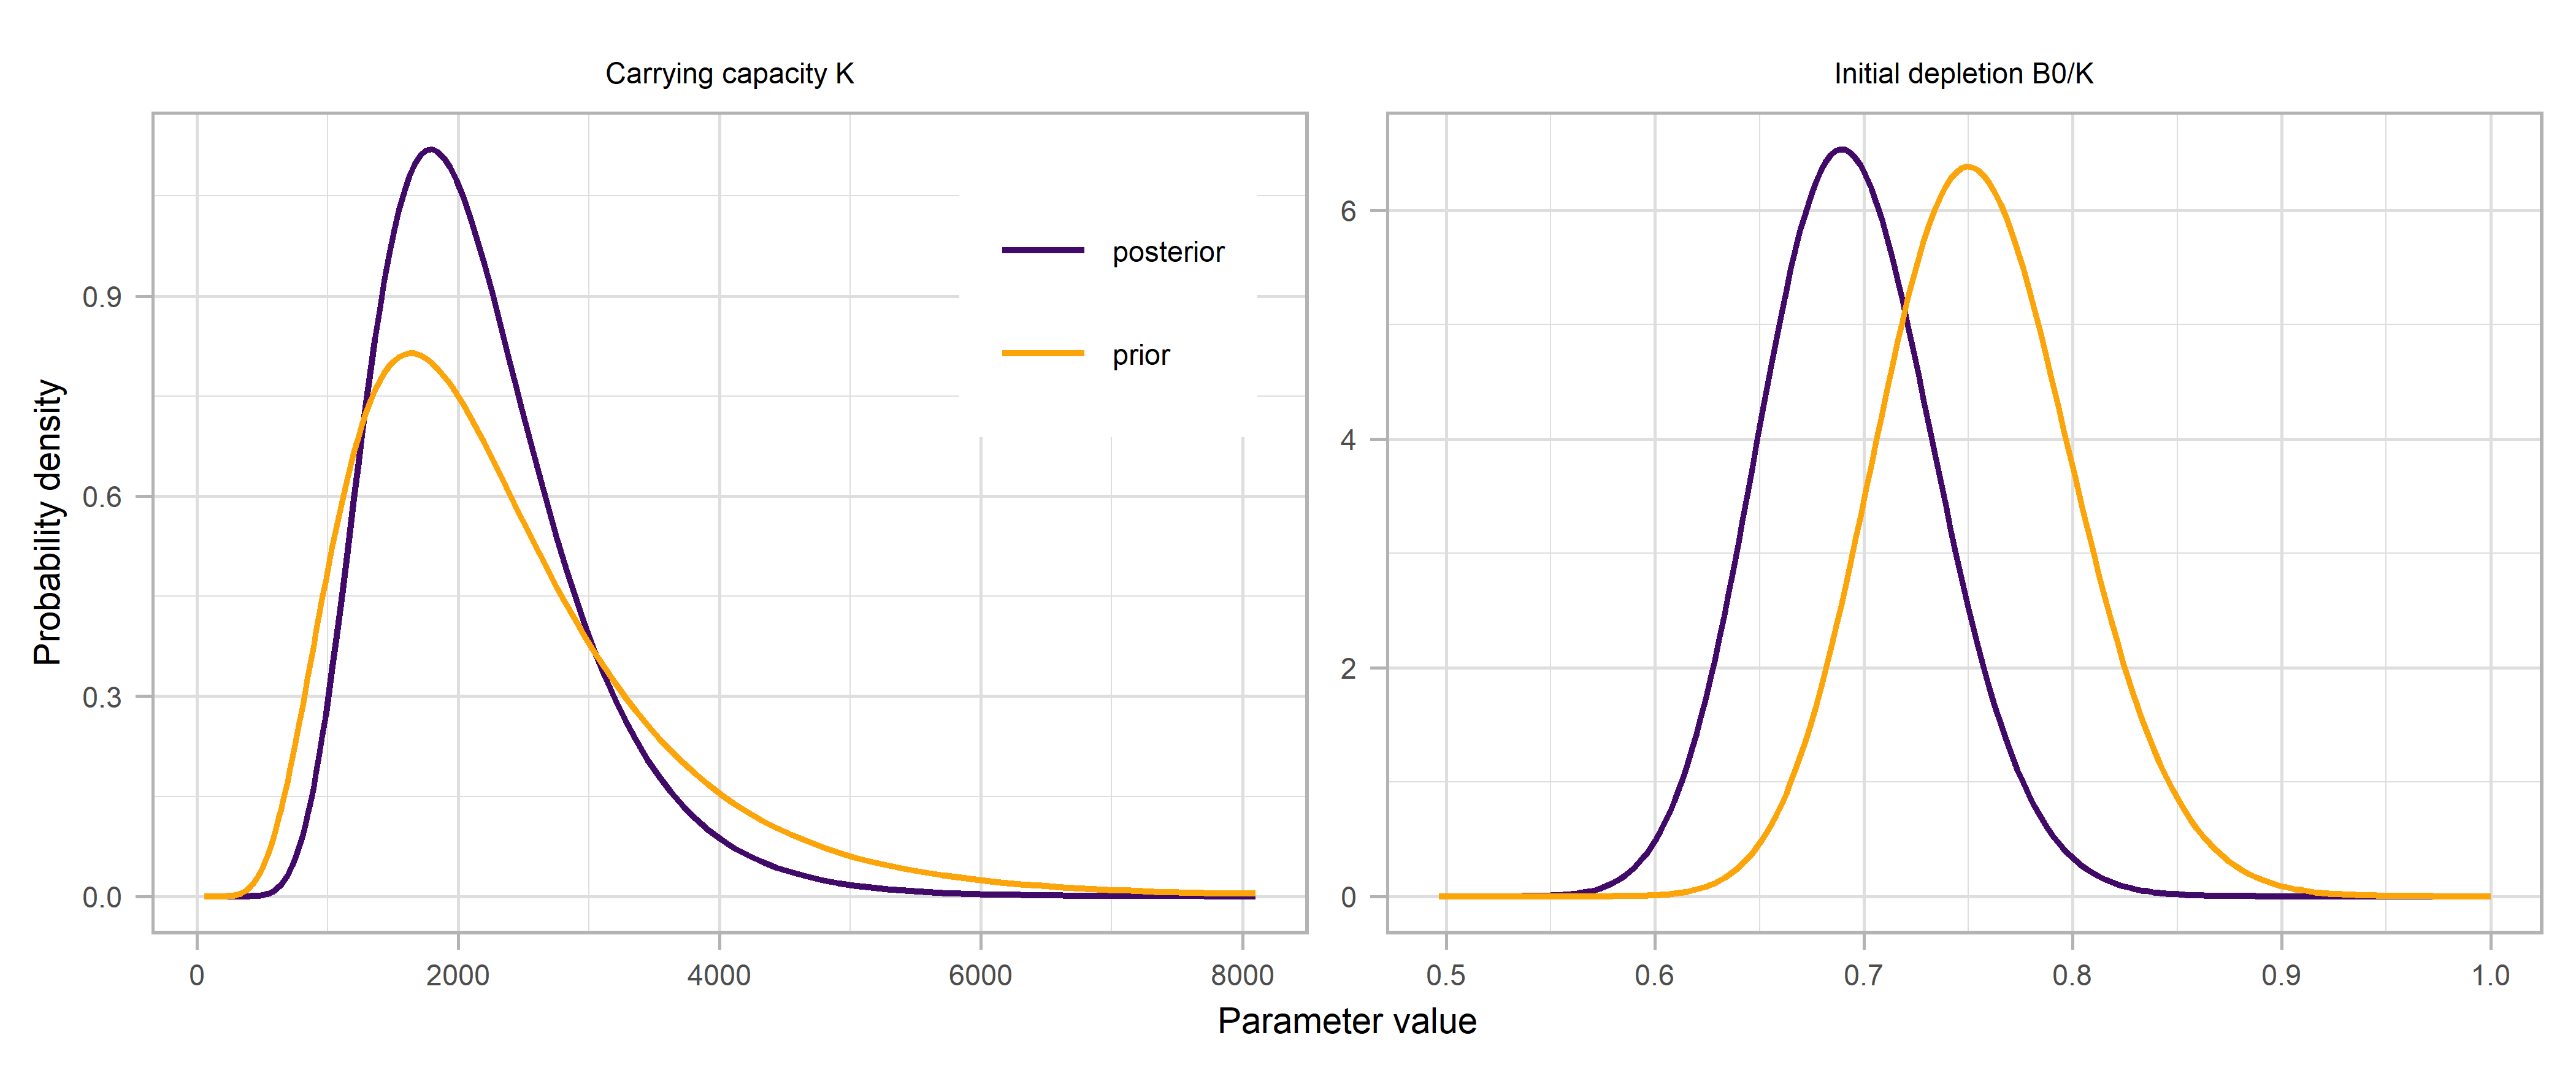
Priors. Uninformative priors of standard settings for SPiCT were used, except for priors for carrying capacity and initial depletion based on a priori knowledge on stock density and historic fishing pressure. For carrying capacity, a log-normal input prior (7.4 ±0.7) was constructed based on the estimates of suitable shrimp habitat in the Barents Sea and carrying capacity in the West Greenland shrimp stock (ICES 2022b). West Greenland shrimp are comparable to Barents Sea shrimp because of a similar environment, providing a reference value for likely densities at carrying capacity. Together with information habitat size and relative habitat quality, this provided the basis for the carrying capacity prior. The prior for the initial exploitation level (-0.29 ±0.25, corresponding to a mean of 75% depletion), on the other hand, was based on information on the historic fishing landings (Melaa et al 2022) from the Barents Sea prior to the time series included in the assessment.
The sensitivity of the stock and parameter estimates was explored during the benchmark in 2022 (ICES 2022b). The analysis showed that the mean and standard deviation of the priors for carrying capacity and initial depletion has little or no impact, respectively, on the perception of stock status. Prior and posterior distributions are shown in Figure 7.
Figure 7: Prior and posterior distribution for carrying capacity K and initial depletion B0/K.
Model performance. The model was validated and performed well, in line with the in-depth exploration and sensitivity analysis conducted during the benchmark (ICES 2022b). The model gives substantially more weight to the CPUE index than the survey indices, likely due to the longer time series with less inter-annual variation. Thus, the survey indices included in the assessment have little relevance. Parameter estimates are presented in Figure 2.
Description
Parameter
Estimate
Low
High
MSY (kt)
m
127
39
414
Carrying capacity (kt)
K
1 787
555
5 757
Catchability NO survey
q1
0.153
0.041
0.570
Catchability RU survey
q2
0.382
0.102
1.435
Catchability BESS survey
q3
0.001
0.000
0.003
Catchability CPUE index
q4
0.001
0.000
0.002
Process error NO survey
sdi1
0.204
0.151
0.274
Process error RU survey
sdi2
0.406
0.295
0.557
Process error BESS survey
sdi3
0.271
0.193
0.379
Process error CPUE index
sdi4
0.029
0.005
0.162
Table 2: Summary of parameter estimates: mean and 95% confidence intervals for selected parameters estimated in the 2023 assessment.
Reference points. Four reference points are considered: MSY Btrigger and FMSY representing the MSY approach, and Blim and Flim representing the precautionary approach. MSY Btrigger is defined as 50% of BMSY, and Blim and Flim as 30% and 170% of BMSY and FMSY, respectively (NIPAG 2021). BMSY and FMSY are estimated directly in the assessment model.
Despite the changes in assessment inputs and model introduced during benchmark in 2022, the results of the 2022 and 2023 assessment have remained consistent with those of previous years. The conclusions on stock status drawn from the model were largely insensitive to the setting of the priors for initial stock biomass and carrying capacity.
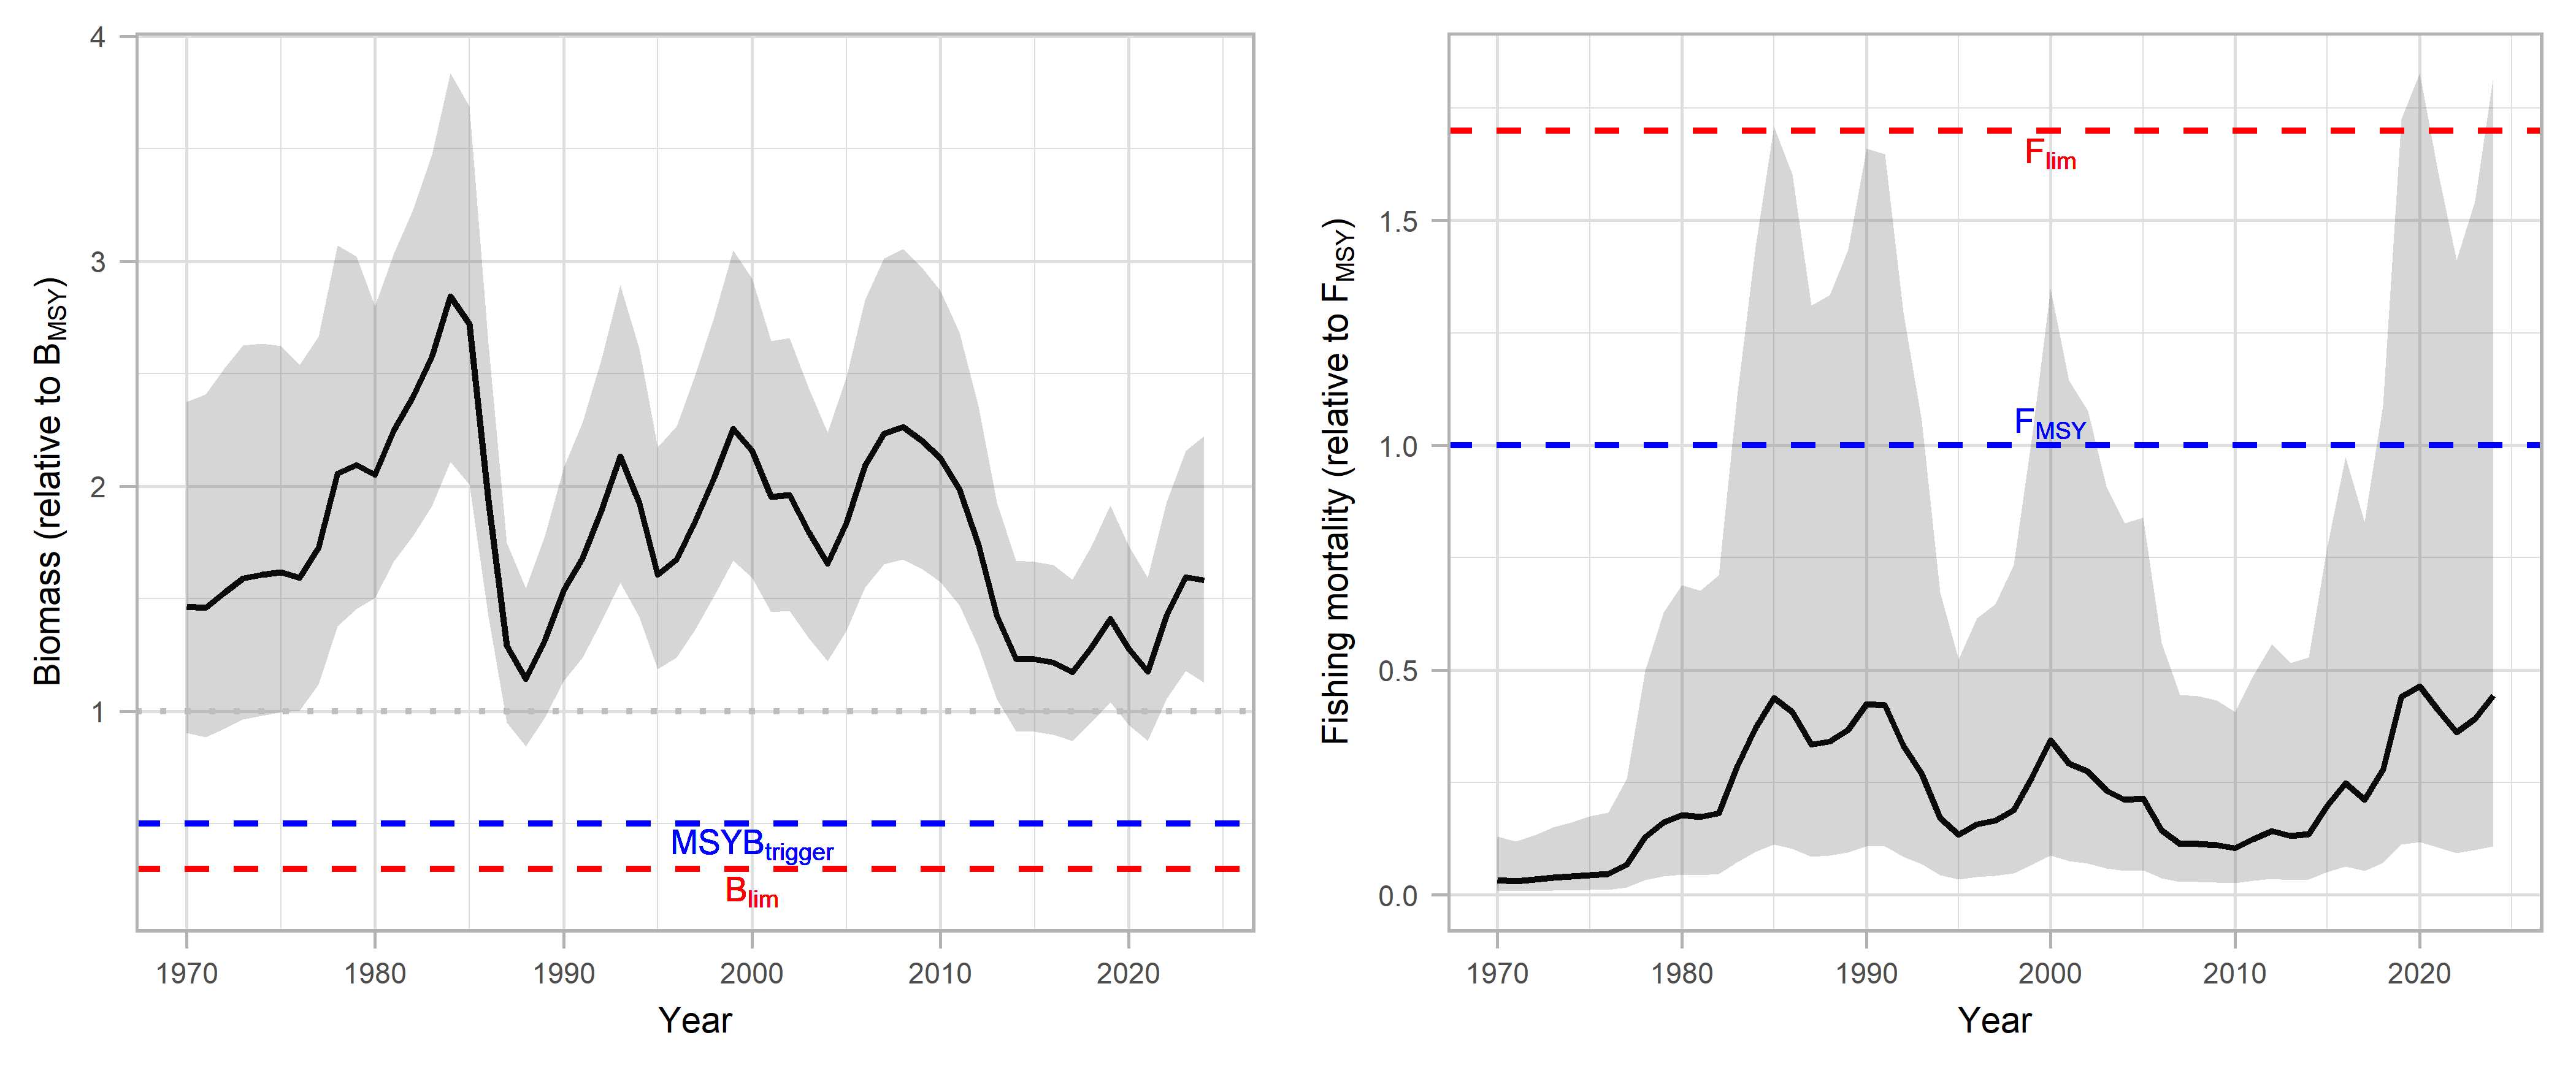
Stock size and fishing mortality. A steep decline in stock biomass almost to BMSY level in the mid-1980s was noted following some years with high catches (Figure 8). After the late 1980s, however, the stock has varied on a higher level before stabilizing on the current level above BMSY during the past decade. The estimated risk of stock biomass being below MSY Btrigger by the end of 2024 is less than 1% (Table 3). The mean estimate of fishing mortality has remained below FMSY throughout the history of the fishery (Figure 7). In 2024, there is a 7% probability of the F being above FMSY (Table 3).
Figure 8: Estimated relative biomass (B/Bmsy) and fishing mortality (F/Fmsy) since 1970. Solid lines represent the mean estimates, shaded surfaces the 95% confidence intervals. MSY and precautionary approach reference points are indicated with blue and red dashed lines, respectively.
2023
2024
Stock size (B/B MSY )
1.60
1.58
Fishing mortality (F/F MSY )
0.39
0.44
Probability of falling below B trigger
0.0%
0.0%
Probability of falling below B lim
0.0%
0.0%
Probability of exceeding F MSY
9.0%
13.0%
Probability of exceeding F lim
1.8%
3.1%
Table 3: Summary of parameter estimates: mean and 95% confidence intervals for selected parameters estimated in the 2023 assessment.
Projections. Catch advice at the mean of FMSY and the ICES advice rule would imply no more than 174 kt or 156 kt, respectively – far above the historic catches of the fishery. Given that the right-hand side of the probability distributions of the yield at the FMSY is difficult to estimate, the working group considers it more appropriate to apply the mode as a point estimate of yield at FMSY. This mode is at 143 kt. Assuming a catch of 78 kt for 2023, catch options up to 100 kt for 2024 have moderate risks of exceeding FMSY (<21%), Flim (<6%), and low risk of going below Btrigger (<1%) by the end of 2024 (Table 4). All these catch options are likely to maintain the stock above BMSY
Scenario
Catch (kt)
Stock size (B/Bmsy)
Fishing mortality (F/FMSY)
Risk of falling below Blim
Risk of falling below Btrigger
Risk of exceeding FMSY
Risk of exceeding Flim
Fish at F MSY
174
1.48
1.00
0.0%
0.0%
50.0%
23.0%
ICES advice rule
156
1.50
0.89
0.0%
0.0%
43.8%
18.6%
F MSY mode
143
1.51
0.82
0.0%
0.0%
38.9%
15.4%
Constant catch
100kt
1.56
0.56
0.0%
0.0%
21.1%
6.2%
125kt
1.53
0.71
0.0%
0.0%
31.6%
11.2%
150kt
1.50
0.86
0.0%
0.0%
41.5%
17.1%
175kt
1.47
1.01
0.0%
0.0%
50.5%
23.4%
Table 4: Predictions of risk and stock status associated with optional catch levels for 2024.
4 - Environmental and other considerations
Temperature . In the ecosystem survey, shrimps were only caught in areas where bottom temperatures were above 0°C. Highest shrimp densities were observed between zero and 4°C, while the limit of their upper temperature preference appears to lie at about 6-8°C. Although temperature is a likely driver for stock dynamics and distribution, no relationship of temperature with observed catch rates or stock biomass could be found during analysis conducted at the benchmark (ICES 2022b). Further investigations of environmental drivers of shrimp distribution and abundance are necessary.
Predation . Both stock development and the rate at which changes might take place can be affected by changes in predation, in particular by Atlantic cod, which has been documented as capable of consuming large amounts of shrimp. The relationship between shrimp biomass and cod has been investigated during the benchmark but was not found to be significant given the available data (ICES 2022b). The cod stock in the Barents Sea has decreased but remained at a relatively high level during the recent ten years. As predator biomass may not be representative of predation pressure, further investigations into shrimp consumption by cod and potential impacts on stock dynamics are recommended.
Recruitment, and reaction time of the assessment model. The model used is best at projecting trends in stock development but estimates and uses long-term averages of stock dynamic parameters. Large and/or sudden changes in recruitment or mortality may therefore be underestimated in model predictions.
5 - State of the stock
Biomass. Stock biomass has been above Btrigger throughout the history of the fishery. The probability that the biomass at the end of 2023 is below Btrigger is less than 1%.
Mortality. Fishing mortality is likely to have remained below FMSY throughout the history of the fishery. In 2023 there is 2% risk of fishing mortality exceeding Flim
State of the stock. The stock is estimated to be well above BMSY and exploited sustainably.
6 - Research recommendations
The fishery has expanded since 2014 and catches by countries other than Norway have increased to account for more than 50% of the total in most years. In 2016, NIPAG therefore recommended that available data (logbook data and catch samples) from the participating nations be made available for the assessment. Status: an official data call has been made and some parties have now provided aggregated data on total catch and effort. This is of limited use in the assessment work and the original recommendation is therefore reiterated.
The survey indices, including the Norwegian-Russian ecosystem survey, has little to no weight in the assessment model compared to the CPUE index. Considering that the survey coverage of the stock is comprehensive and representative, the lack of relevance for the assessment may indicate an issue with the index or the model configuration. This could not be sufficiently resolved during the 2022 benchmark and should therefore further investigated, with the goal to increase the utility of the survey data in the assessment. Status: analysis will be conducted in 2024/25.
During the 2022 benchmark, it was recommended to explore the utility of the joint Norwegian-Russian demersal survey in winter as a potential data source for a stock index (separate or integrated with the ecosystem survey index). Status: further analysis is needed and is planned for 2024/25.
During the 2022 benchmark, it was recommended to investigate further the predator-prey relationship between shrimp and cod, including available data from cod stomach sampling. Status: further analysis is needed.
A recent study highlighted that maximum economic yield for the stock is likely significantly lower than MSY (Lancker et al 2023), underlining that economic factors are likely limiting the fishery. The economic drivers of fisheries dynamics could provide insights on economically optimal harvest strategies. Status: further analysis is recommended.
7 - References
Anderson, S. C., Ward, E. J., English, P. A., and Barnett, L. A. K. 2022. sdmTMB: an R package for fast, flexible, and user-friendly generalized linear mixed effects models with spatial and spatiotemporal random fields. doi: 10.1101/2022.03.24.485545.
Berg, C., Coleman, P., Cooper, A., Hansen, H. Ø., Haslob, H., Herrariz, I. G., Kokkalis, A., et al. 2021. Benchmark Workshop on the development of MSY advice for category 3 stocks using Surplus Production Model in Continuous Time; SPiCT (WKMSYSPiCT).
Brooks, M., Kristensen, K., van Benthem, K., Magnusson, A., Berg, C. W., Nielsen, A., Skaug, H. J., et al. 2017. glmmTMB Balances Speed and Flexibility Among Packages for Zero-inflated Generalized Linear Mixed Modeling. The R Journal, 9: 378-400.
ICES. 2018a. Report of the Arctic Fisheries Working Group (AFWG), 18–24 April 2018b, Ispra, Italy. ICES CM 2018/ACOM:06. 859 pp
ICES. 2022b. Benchmark workshop on Pandalus stocks (WKPRAWN). Edited by C. Lordan, and J. Lövgren. 10.17895/ices.pub.19714204.v1
ICES 2022c. ICES Workshop on the use of Collecting bags in shrimp fisheries (WKCB). ICES Scientific Reports 4:1. 126 pp. https://doi.org/10.17895/ices.pub.9709
IMR-PINRO.2022. Ecosystem Survey in the Barents Sea August-September 2021. Edited by D. Prozorkevich, and G .I. van der Meeren. IMR-PINRO 2-2022.
Lancker, K., Voss, R., Zimmermann, F., and Quaas, M. F. 2023. Using the best of two worlds: A bio-economic stock assessment (BESA) method using catch and price data. Fish and Fisheries. doi: https://doi.org/10.1111/faf.12759.
Melaa, K. W., Zimmermann, F., Søvik, G., and Thangstad, T. H. 2022. Historic landings of northern shrimp (Pandalus borealis) in Norway - Data per county for 1908-2021. Rapport fra havforskningen, 2022. doi: 10.13140/RG.2.2.32348.05768.
NAFO/ICES 2021. NAFO/ICES Pandalus Assessment Group Meeting-February and September 2021. SCR Doc. 20/21.
Pedersen, M. W., and Berg, C. W. 2017. A stochastic surplus production model in continuous time. Fish and Fisheries, 18: 226-243. https://doi.org/10.1111/faf.12174.
8 - Annex
Year
BESS index
NO survey
RU survey
CPUE index
Catch
1970
6
1971
5
1972
7
1973
7
1974
8
1975
8
1976
10
1977
20
1978
39
1979
36
1980
1.13
46
1981
1.39
44
1982
327
1.31
63
1983
429
1.50
105
1984
471
661
1.64
128
1985
246
468
1.38
124
1986
166
399
0.84
65
1987
146
346
0.61
43
1988
181
233
0.64
49
1989
216
603
0.81
63
1990
262
1028
0.86
81
1991
321
1192
0.96
75
1992
239
876
1.13
69
1993
233
892
1.21
56
1994
161
404
0.98
28
1995
192
248
0.83
25
1996
276
441
1.00
35
1997
300
765
1.04
36
1998
341
576
1.23
56
1999
316
966
1.26
76
2000
247
800
1.07
81
2001
184
468
1.11
57
2002
196
980
1.05
61
2003
212
0.96
39
2004
0.68
151
0.87
43
2005
0.85
1.19
43
2006
1.10
1.21
30
2007
1.02
1.32
30
2008
0.94
1.23
28
2009
1.00
1.25
27
2010
1.27
1.18
25
2011
1.17
1.02
30
2012
1.31
0.89
25
2013
1.19
0.67
19
2014
0.85
0.67
21
2015
0.83
0.66
34
2016
0.75
0.65
31
2017
1.00
0.67
30
2018
1.14
0.74
56
2019
1.29
0.76
74
2020
0.70
0.61
58
2021
0.91
0.68
56
2022
0.92
0.92
64
2023
1.09
0.85
79
Table 5: Northern shrimp in subareas 1 and 2. Input data for the stock assessment model. Indices include Norwegian-Russian ecosystem survey (BESS), Norwegian shrimp survey (NO), Russian survey (RU) and Norwegian CPUE index. BESS and CPUE indices are scaled to their respective mean.