Gå til hovedinnhold
Havforskningsinstituttet
HI
English
<- Tilbake
Søk
Søk
Søk
View page in English
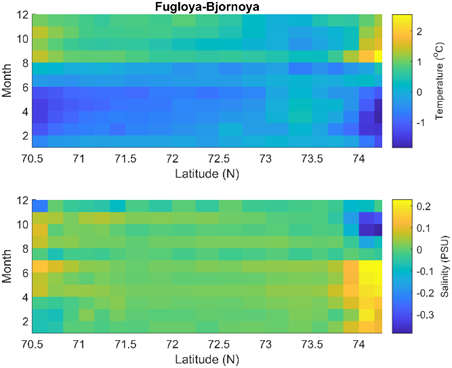
Figur
Fra rapporten:
Numerical models and long term monitoring
Figure A7: Monthly mean anomalies of temperature (top) and salinity (bottom) at each station along the Fugløya-Bjørnøya transect (1991-2021) highlighting the different seasonal cycles in coastal and offshore regions.