—
A standardised, operational welfare monitoring protocol for Atlantic salmon held in sea cages
Author(s):
Jonatan Nilsson (HI), Kristine Gismervik, Kristoffer Vale Nielsen (Veterinærinstituttet), Martin Haugsmo Iversen (Nord universitet), Chris Noble, Jelena Kolarevic (Nofima), Hilde Frotjold, Kathrine Nilsen (STIM), Eirik Wilkinson (Labora), Barbo Klakegg, Hege Sørvåg Hauge, Per Anton Sæther (Åkerblå) and Tore Kristiansen og Lars Helge Stien (HI)
Report series:
Rapport fra havforskningen 2025-40ISSN: 1893-4536Published: 20.06.2025Project No.: 15542On request by: Fishery and Aquaculture Industry Research Funding (FHF)Reference: 901554 Research group(s):
DyrevelferdSubject:
FiskevelferdProgram:
Fremtidens havbruk
Research group leader(s):
Lars Helge Stien (Dyrevelferd)
Approved by:
Research Director(s):
Geir Lasse Taranger
Program leader(s):
Robin Ørnsrud
External:
English version edited by Angelico Madaro (HI)
Standardisert operasjonell velferdsovervåking for laks i matfiskanlegg
For å måle å registrere fiskevelferd på en enhetlig måte er det nødvendig med en detaljert protokoll for hvordan målinger og skåringer skal gjennomføres. Denne rapporten beskriver tre miljøbaserte (oksygen, temperatur og saltholdighet), 3 gruppebaserte (atferd, appetitt og dødelighet) og 14 individbaserte operasjonelle velferdsindikatorer for bruk på matfiskanlegg for laks. Alle indikatorene er delt inn i fire nivåer som indikerer økende velferdsbelastning for hvert nivå. Protokollen innholder instruksjoner om hvordan indikatorene skal måles eller skåres, og for de individbaserte velferdsindikatorene er det en guide med beskrivelse av hver indikator og tre eksempelbilder av hvert av de tre nivåene som indikerer avvik (skår 1-3).
Velferdsovervåkingen beskrevet i denne protokollen er ment som et basisnivå for å avdekke potensielle velferdsproblemer, og gir ikke nødvendigvis detaljert informasjon om hva årsaken til observerte avvik er. Grundigere undersøkelser kan derfor være nødvendig i tillegg.
To measure and record fish welfare in a consistent manner, a detailed protocol is necessary for how measurements and scores should be conducted. This report describes three environmental based (oxygen, temperature, and salinity), three group based (behavior, appetite, and mortality), and fourteen individual based operational welfare indicators for use in salmon grow-out facilities. All indicators are divided into four levels that indicate increasing welfare burden at each level. The protocol includes instructions on how the indicators should be measured or scored, and for the individual-based welfare indicators, there is a guide with a description of each indicator and three example images for each of the three levels indicating deviations (scoring levels 1-3).
The welfare monitoring described in this protocol is intended as a basic level for detecting potential welfare issues and does not necessarily provide detailed information about the cause of observed deviations. Therefore, additional more in-depth investigations may be necessary.
Although fish farmers and fish health personnel have extensively investigated and documented the welfare of the salmon over many years, a standardized way of conducting this documentation is currently lacking in Norway. This documentation protocol is designed to be used as a common standard for the cage based post-smolt production of Atlantic salmon in Norway and potentially beyond.
When creating a standardized protocol for routine monitoring of fish welfare, there are many considerations to take into account, and these can sometimes be contradictory. Any protocol should be based up on a solid knowledge-based foundation, so that the monitoring and documentation process gives as clear a picture of the welfare status of the fish group as possible. In an ideal situation, stated threshold values for welfare impacts should be accurate, and measurements and levels should be accurate, and conducted frequently enough and on a large enough scale so that the welfare status of the entire population can be documented at all times. However, this is not possible in practice. For example, both the environment within and around a cage based rearing system and the fish's distribution change continuously in time and space, and a full documentation of the environment would require unrealistically detailed environmental measurements. In addition, the same environment will affect individuals that have varying welfare states in different ways. Documentation protocols must be clear, easily understood and easy to perform so that everyone who uses the protocol, after some training, can be expected to get similar results on the same group of fish. The time needed for conducting the documentation must also be feasible, both for the farmer and for the fish being examined so that the procedure itself doesn't adversely impact upon welfare too much. Furthermore, the protocol should be based on established and recognizable methods and routines, and not conflict with other standards or legal requirements.
The LAKSVEL protocol is largely based on knowledge described in the FISHWELL handbook and SWIM, but also other scientific literature, in addition to knowledge and experiences from the fish health service and tests carried out in the Laksvel project. The main aim of the work has been to create a system for standardized operational welfare monitoring, i.e. that all users measure and conduct a welfare audit in the same way, and that the monitoring is simple and practical to carry out. We have also, as far as possible, taken account of other standards such as the Norwegian Standard (NS 9417) and imposed procedures such as the Norwegian Lice Regulation.
The scoring form for individual-based indicators is based on the FISHWELL handbook. The scoring form has been tested repeatedly at Norwegian Atlantic salmon farms in Hordaland, Trøndelag, Nordland and Troms counties. After each test case, the scheme was re-evaluated and weaknesses and ambiguities worked upon. A scoring guide has been created with explanations and photographic examples of each scoring level for the various indicators to support the end user. We recommend that an end user goes through and becomes familiar with the scheme before they start scoring fish.
2 - Introduction to the Laksvel guide
The welfare of farmed Atlantic salmon has been debated and discussed for many years. In the wake of this increased focus, several operational approaches have been proposed on how to measure or record the welfare status or changes in the welfare status of fish out on the farm. This LAKSVEL protocol is primarily based on previous work conducted by many of the project team in the project FISHWELL (FHF -funded project 901157 "FISHWELL: Compilation of knowledge on fish welfare for salmon and rainbow trout in farming), and the main focus has been to standardize and simplify the use of operational welfare indicators for salmon held in sea cages.
2.1 - Definition of fish welfare
There are many advantages to having good welfare in animal husbandry, and fish farming is no exception. The farmers know this, and over the years have tried to optimize their operation with the aim that the fish should thrive, grow and stay healthy. We hereby define fish welfare as:
Fish welfare = quality of life as perceived by the fish itself
By using this definition, one assumes that the fish must have some form of a conscious qualitative experience of life in order to experience welfare, and animal welfare is described as something that the individual perceives. The Norwegian Animal Welfare Act points out the intrinsic value of the animal regardless of its utility value for humans, which also corresponds to this definition. It is also in line with the adjusted definition from Broom: "Animal welfare=the individual's state as regards its attempts to cope with its environment", but the animal's perspective is more in focus. One could object that an emotional definition of animal welfare lacks utility as we cannot know how animals experience their lives. However, we can get good indications of how animals are doing by observing the animals' environment, behaviour, health and physiological state. These then become indicators for the animals' perceived quality of life, i.e. welfare indicators (WIs). For a more comprehensive discussion of the topic of salmon welfare in an operational setting, we refer to the FISHWELL handbooks (Noble et al. 2018) and Kristiansen et al. (2020).
2.2 - Welfare indicators
Welfare indicators (WIs) are all the parameters that can be measured or observed that provide information on the welfare state of an animal. These can be measurements on the resources and environment the animals live in and that affect their welfare (input-based welfare indicators), or parameters that describe the condition of the animals, such as observations of the animals' behavior and health (outcome-based welfare indicators at the individual or group level). WIs that can be routinely used in commercial aquaculture settings are referred to as operational welfare indicators (OWIs). Welfare indicators that are collected on the farm but are complex enough that they must be analyzed elsewhere are called laboratory-based welfare indicators (LABWIs).
2.3 - Assessment tool for fish welfare: the Laksvel guide
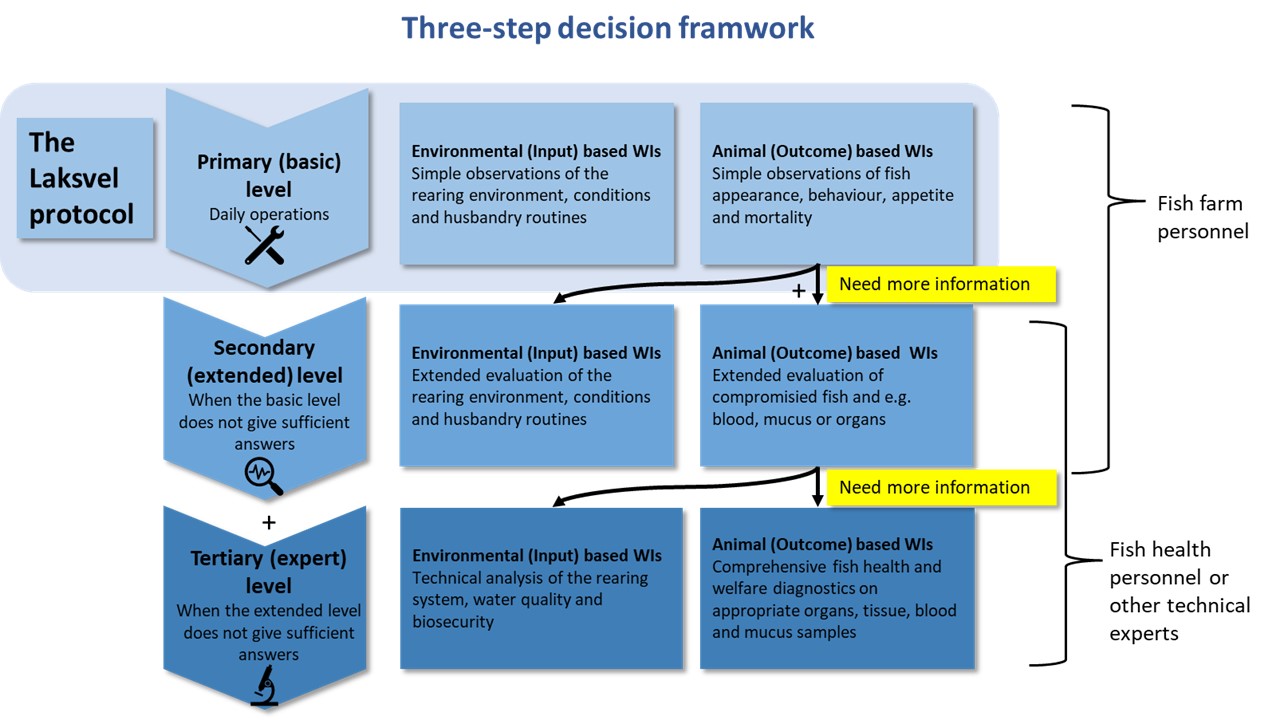
In the FISHWELL handbooks, a three-step framework was proposed for how welfare indicators can be used as part of a welfare documentation and monitoring platform on the farm (Noble et al., 2018). This platform was further updated by Stien et al. (2020) to increase the focus on both animal (Outcome) and environmental (input) based indicators. Through the Laksvel project (and others), this framework has been refined and optimized to increase its operational feasibility, as well as to make it easier to incorporate into already existing health and welfare plans for farmed fish. The "new" framework has retained the three levels from the original framework proposed by the FISHWELL manuals. The basic level includes only operational welfare indicators (OWIs), indicators that are quick and easy to use, such as some environmental parameters and visual observations of the fish. No LABWIs are included at this level. The basic qualitative or even subjective information obtained at this level can be used to quickly identify possible welfare threats. This can be sudden deviations or changes in an OWI, especially if the OWI is input based. If a problem is identified and a corrective action can be taken, the Primary level of OWI tools within the framework may be sufficient.
The Laksvel protocol is intended to strengthen and standardise this Primary level in the monitoring framework and is aimed at those involved in daily/regular monitoring of fish health and welfare. The protocol consists of a set of environmental (input) based OWIs, group based (outcome) OWIs and individual based (outcome) OWIs. If, on the basis of findings made under Primary level monitoring, there is uncertainty related to the cause or severity of an identified welfare threat, a more comprehensive or detailed investigation should be carried out. The same applies to uncertainty around corrective measures. Any new investigation that is carried out at a Secondary level and possibly Tertiary level should involve collaboration with fish health personnel or other relevant professional personnel.
Three-step decision framework for how welfare indicators can be used as a welfare monitoring and documentation platform on site. At the Primary (basic) level, operational welfare indicators (OWIs) will be used, while on the extended and expert levels an increasing degree of analysis will require that laboratory-based welfare indicators (LABWIs) will be taken into use, and/or larger samples will be collected.
3 - Environmental (Input) - based welfare indicators
Environmental measurements are recorded as continuous values that can be within or outside an optimal range for the fish. Colour codes are used here to indicate the distance from the optimal range, where green indicates within the optimal range, yellow the edge of the optimal range, orange outside, and red far outside the optimal range.
3.1 - Oxygen
Dissolved Oxygen saturation should be measured daily at 3, 5, 15 metres and the maximum cage depth in each cage. This is in order to obtain information about oxygen levels at different depths in the cage. Information on oxygen levels in and around where the fish are, can help to understand the fish's distribution in the cage, for example whether they avoid areas of water that have low oxygen saturation levels.
Oxygen saturation is given as a percentage (of saturation in air, which is 100%). Water that is 100% saturated with oxygen contains more oxygen (mg/L) at low temperatures than at higher temperatures, and when water temperature increases, less oxygen will be available to the salmon. This does not correspond well with the salmon's need for oxygen, which increases with temperature. Activity levels, digestion and stress will also increase the need for oxygen. The oxygen saturation in a cage can vary considerably in space and time as a result of tides, photosynthesis and the fish's activity and distribution. Two identify limiting oxygen levels, oxygen should be measured at the time and place where the oxygen level is potentially the lowest, most often at the depth with the highest biomass and when water current strength is at its weakest. Ideally, oxygen should be logged continuously. Limiting oxygen values are most often experienced in periods of high water temperature and high biomass.
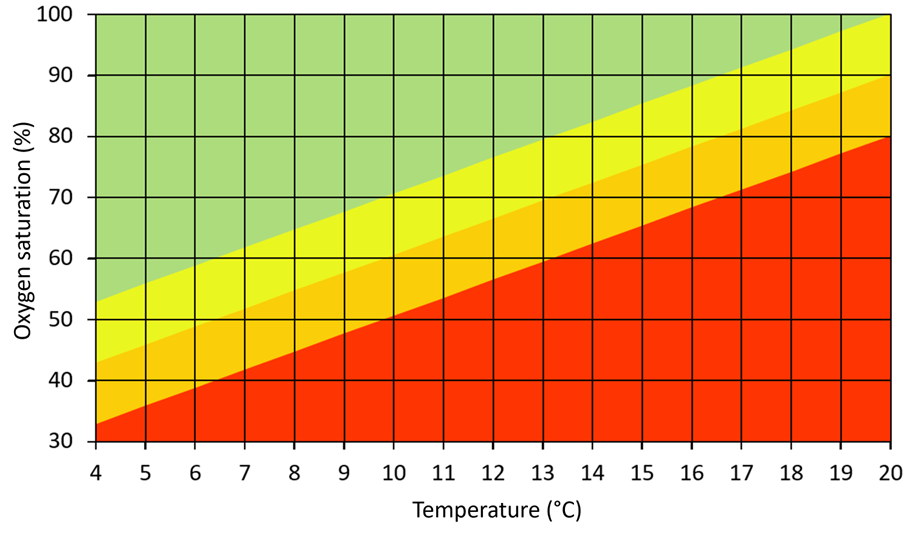
Green, yellow, orange and red levels for oxygen saturation levels are shown in the figure for the temperature range 4 – 20°C. At water temperatures below 7°C, low oxygen saturation will rarely be a challenge in open cage systems. At temperatures above 19°C it can be challenging to ensure the fish have sufficient oxygen without additional oxygenation, but the fish will also potentially begin to be challenged simply as a result of the temperature.
Figure outlining limiting values of oxygen saturation at 4-20°C. The values are based on known minimum levels that ensure normal activity in healthy, unstressed post-smolts, based on worked carried out by Remen et al. (2016), which represent the border between red and orange levels. In order to account for variation in oxygen demand which may be related to health status, stress levels etc., a margin of 10% has been added for the yellow level and 20% for the green level.
3.2 - Temperature
Water temperature should also be measured daily at 3, 5, 15 metres and the maximum cage depth. This is in order to obtain information about temperatures at different depths in the cage. Information about temperature both in and around where the fish are, can help a stakeholder better understand the fish's distribution in the cage, e.g., whether it is a temperature preference that drives the fish's distribution (Oppedal et al., 2011).
Since salmon are ectothermic animals, water temperature has a great influence on their physiology and metabolism. In addition, water temperature affects other factors that can impact upon the welfare of salmon, such as the solubility of oxygen and living conditions for pathogens and parasites such as salmon lice. In addition to seasonal variation, temperature can vary a lot with depth, especially in locations with a clear thermocline. Numerous studies have shown that the vertical temperature profile is a strong driver for a salmon's positional depth in the cage, as the salmon seek out depths with preferred temperatures if other conditions do not override this. Numerous studies have shown that salmon in sea cages have a preference for rising temperatures up to about 16°C, but avoid temperatures above 17°C.
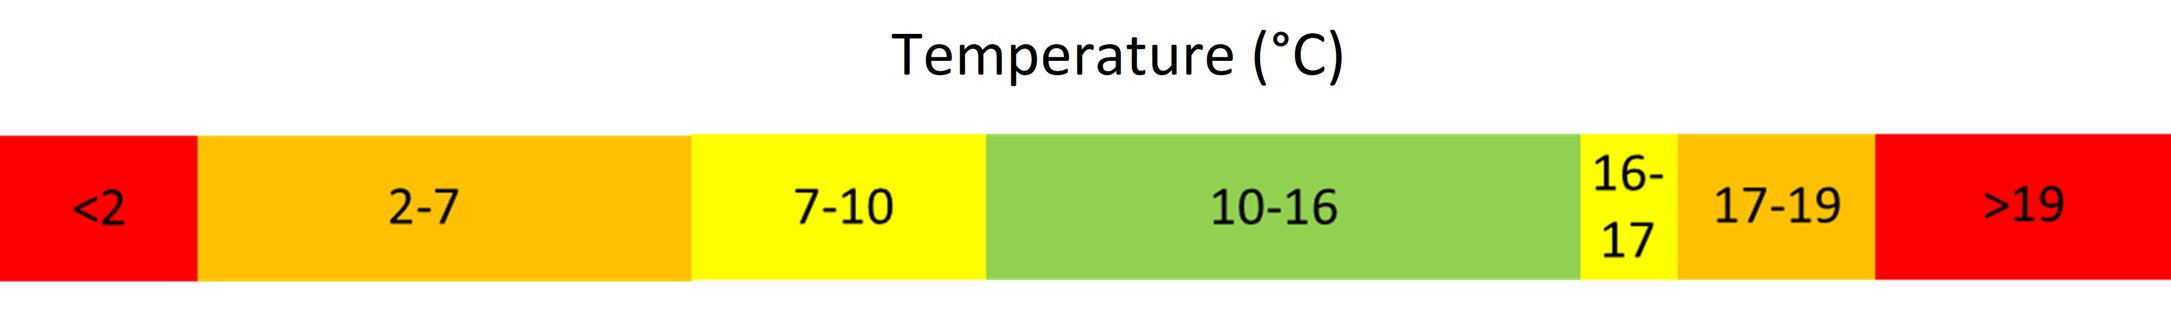
The expected welfare impact of differing water temperatures upon Atlantic salmon is shown in the figure below. If the salmon has the opportunity to move away from and avoid poorer temperatures, the welfare colour coding scheme applies to the best temperature to which the salmon has access. If for instance the temperature is 7-10°C in the upper water layer but 10-16°C deeper in the cage, the welfare colour code is green. Temperatures outside the green color code do not necessarily mean that the welfare is reduced, but that the risk of welfare problems increases outside the green temperature range.
Figure outlining the potential welfare impacts of water temperature upon cage held Atlantic salmon. The colour codes should be seen as approximates, as the welfare impact of temperature is dependent upon numerous factors, for instance whether the temperature is rising or falling, stress levels, the presence of pathogenes in the water, and the clinical health status of the fish.
3.3 - Salinity
Salinity should be measured daily at 3, 5, 15 metres and the maximum cage depth. Post-smolt salmon have a relatively large tolerance range for different salinities. However, the high salinity of full strength seawater (32-34‰) increases the energy consumption of the salmon in order to maintain osmotic balance and therefore has a somewhat negative effect on growth compared with more brackish water (Ytrestøyl et al., 2020). In addition, the risk of individuals being unable to maintain osmotic balance increases, which can result in health problems and potentially early death. High salinity is primarily a challenge for smolt and smaller post-smolt, especially if they are poorly smoltified. In the period following the seawater transfer of smolts to the cages, they seem to prefer brackish water and tend to stay in or above the halocline if possible. For healthy and larger salmon in sea cages, salinity in itself probably has little effect on their welfare unless they are mature. Measuring salinity is however useful for knowing which haloclines and water masses the fish are subjected to in the cage. This has implications for how other environmental parameters may develop and for the expected distribution of salmon lice larvae, which avoid lower salinity.
4 - Group (Outcome) -based welfare indicators
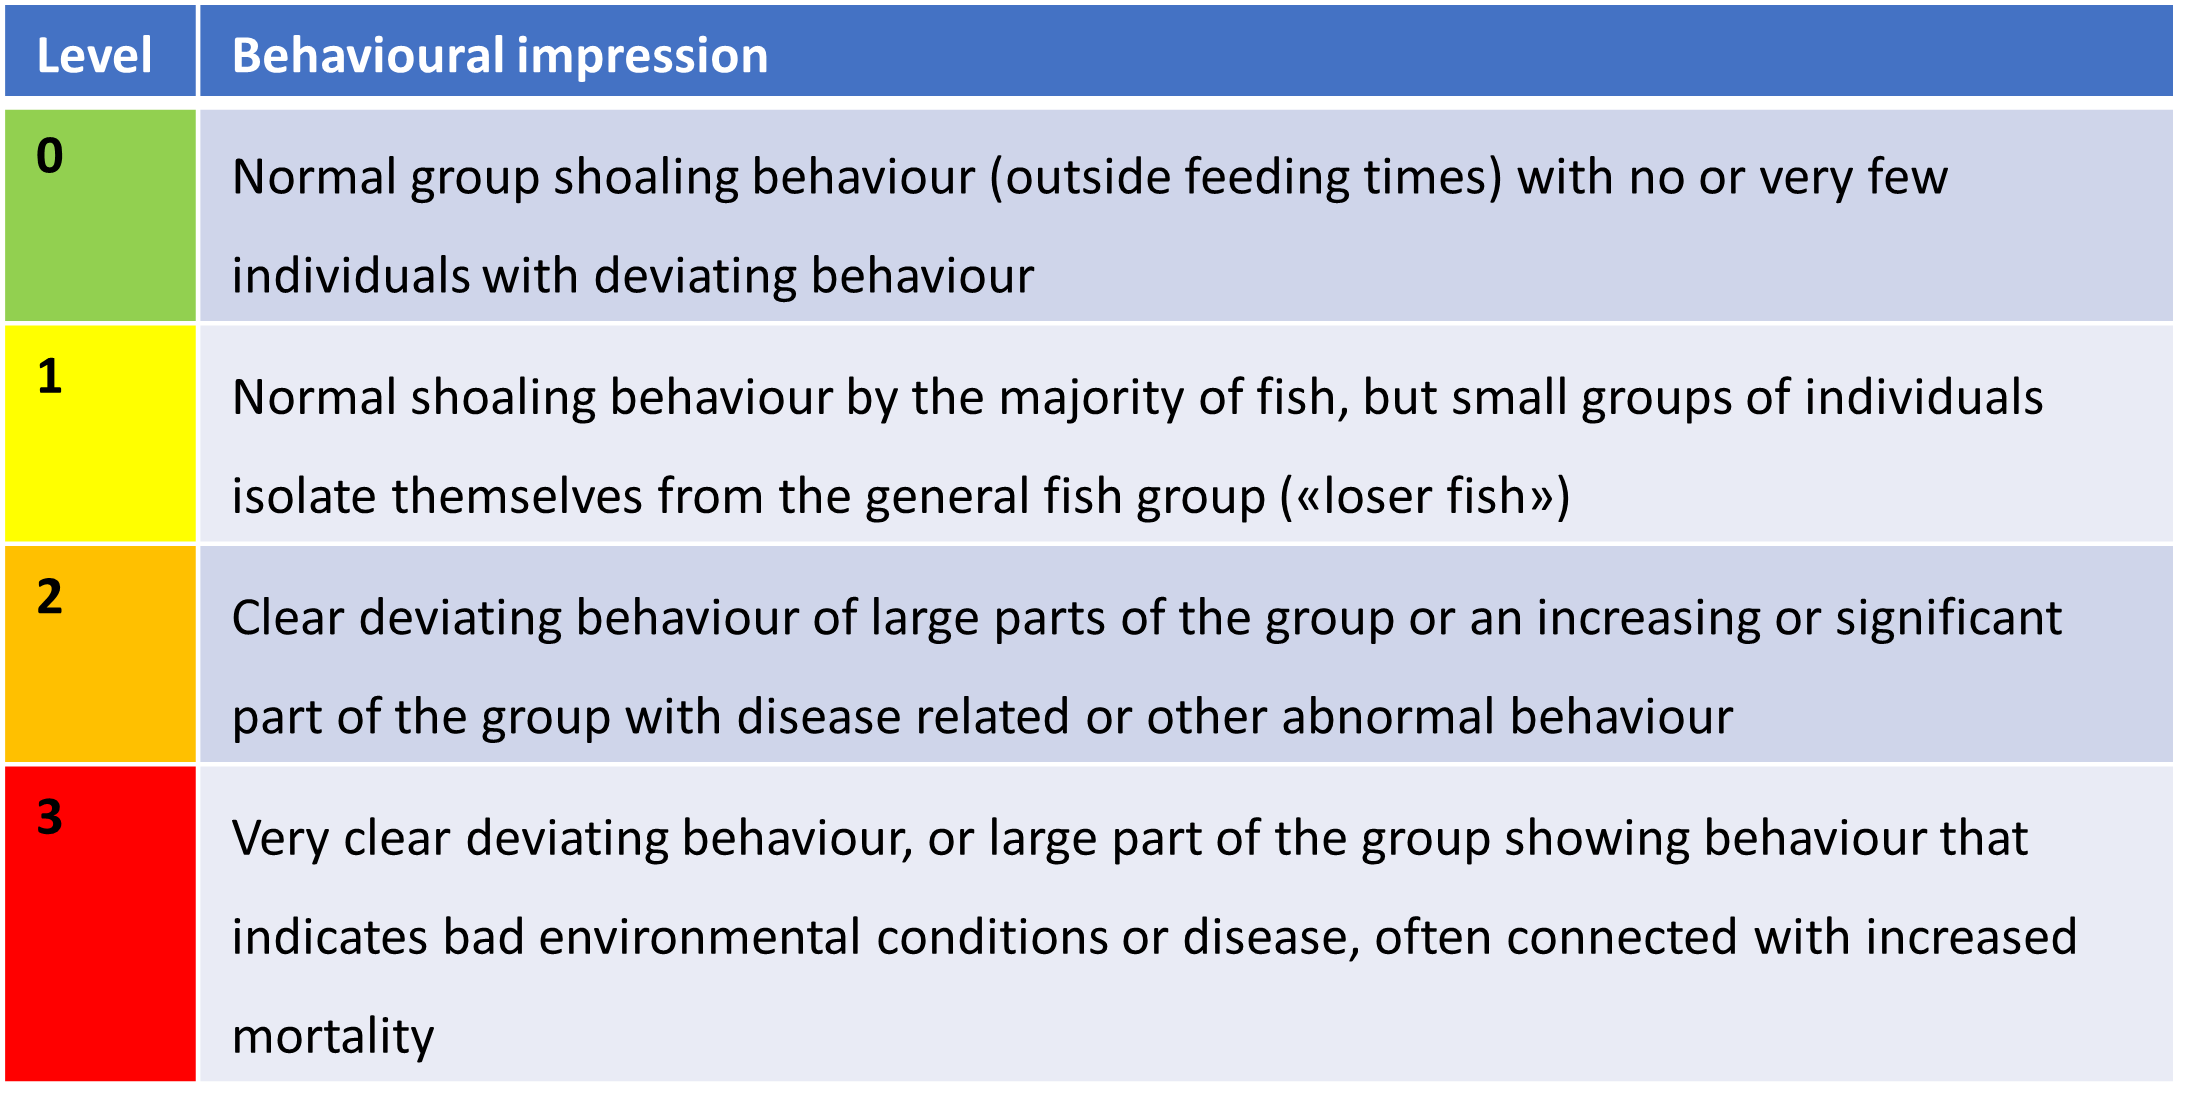
The group-based welfare indicators, Behavior and Appetite are recorded as a scoring level from 0-3, while Mortality is recorded as more continuous numbers (number of individuals, %). The level division for group-based welfare indicators is therefore indicated with both scores and colour codes.
4.1 - Behaviour
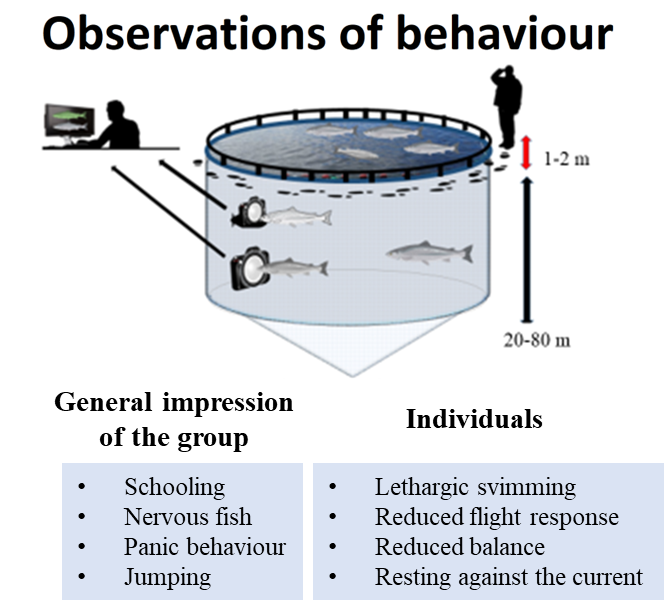
Standardising descriptions of normal and deviating behaviour for salmon is difficult as 'normal' behaviour can vary greatly over time and between localities. In addition, deviating behaviour can be monitored as e.g., the degree of deviation, as a proportion of the group, or both. Despite this, behaviour is an excellent welfare indicator, as it can often give an immediate signal about how the fish is experiencing its current situation. Salmon in cages normally swim around in a more or less loosely organized shoal, but the shoal structure can break down during feeding. Their behaviour and position in the cage can vary with fish size, time of day, season, and environmental conditions, but with good observations and experience, the farmers can have a good idea of the expected behavior of the fish at any given time. Sudden changes in behavior can be indicative of problems in and around the cages such toxic algal blooms, jellyfish, predator attacks, handling stress or sudden changes in environmental conditions, such as upwelling of oxygen-poor deep water. More gradual changes in swimming behaviour and feeding response, and often only by part of the fish group, can be due to disease. Gradual changes in environmental conditions due to weather and season can cause the entire group to change behaviour.
Observing salmon behaviour from above water is often done by walking around the cage walkway or by monitoring overwater cameras. This approach limits observations to the fish in the uppermost meters of a cage, which is perhaps 50 meters deep. Fish with deviating behaviour (such as 'loser fish' - sick and moribund fish) often isolate themselves from the general fish group in the upper water layers and will thus be relatively easily visible from the edge of the cage. Nevertheless, by counting the number of fish with deviating behaviour, you will usually only end up with a certain proportion of the real number in the cage. In order to be able to assess the behavior of the main part of the shoal, which is not visible from the surface, an underwater camera is often used, but this also only gives a part of the overall picture. Other technological tools are being increasingly used for monitoring behaviour, including hydro-acoustic technologies but we will limit our auditing and scoring to what can be seen directly from cameras or the naked eye.
It is important that the observations of behaviour are standardised and done in the same way at the facility every day. It is also important that those who conduct the scoring agree on the method and scoring level. In addition to the scoring, a log should be kept with comments on suspected reasons for changes in salmon behaviour. If behavioural deviations can be linked with other data such as environmental measurements or handling incidents, they are easier to understand and respond to.
Illustration showing potential daily observations of cage-held salmon behaviour, and examples of potential signs to look for
4.2 - Appetite
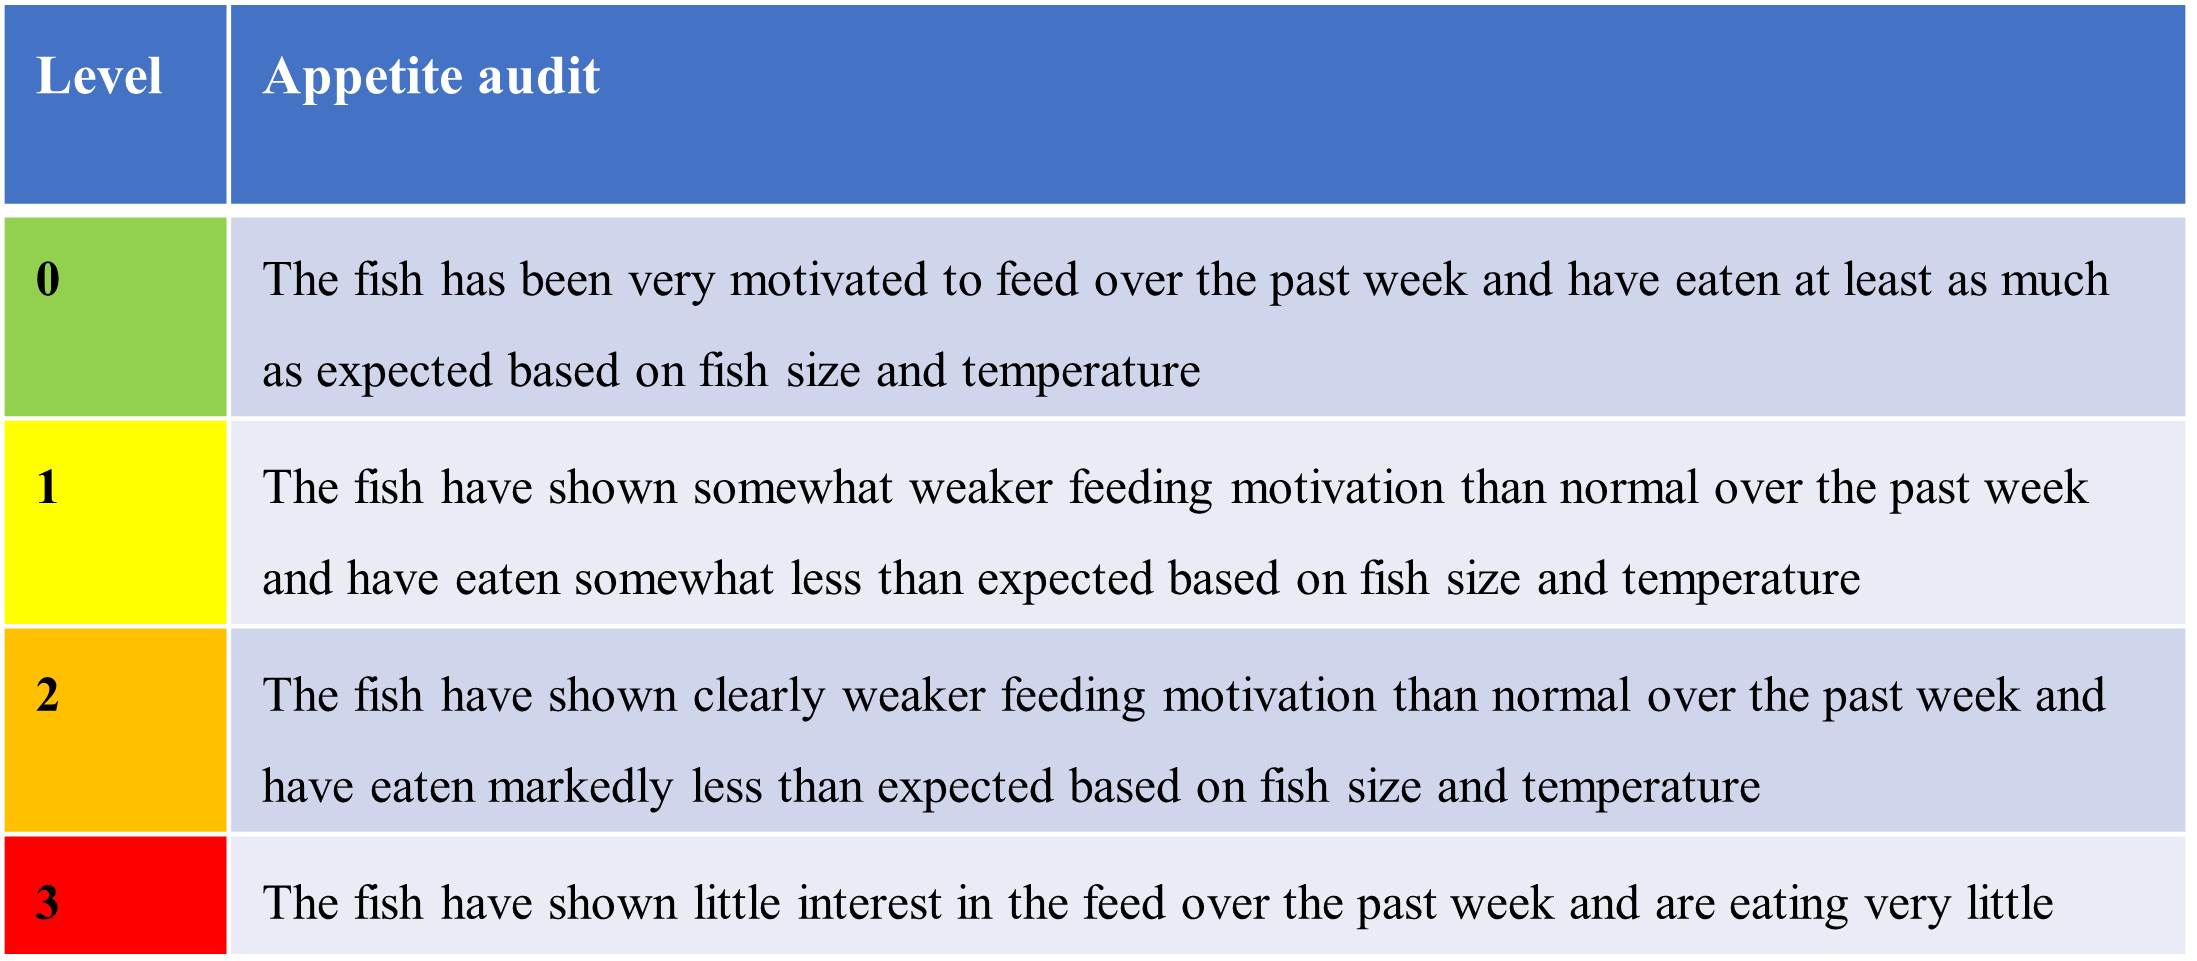
Appetite is a good group-based welfare indicator for farmed salmon, and reduced appetite can be an indicator of a number of different health and welfare problems. However, one must be aware that a short-term reduced feeding motivation can also have other explanations, e.g., that the fish recently fed and are already satiated, and this must be taken into account when using appetite as a welfare indicator.
Farmed salmon in Norway are mostly fed to appetite via an underwater camera to observe their feeding behaviour and the amount of uneaten pellets (although other methods and technologies are available for performing this operation). Numerous feed management tools also calculate the estimated growth and feed requirements of salmon at varying sizes under the prevailing temperature conditions and season, so that the farmer has an expectation of how much feed should be fed to the fish on any given day. However, as salmon that eat to satiation one day will often eat less the next day, which is particularly true for large fish at low temperatures, there may be some variation in feed intake from day to day and there are also other e.g. behavioural or environmental drivers that can lead to short-term fluctuations in appetite. But in general, there will usually be a steady increase in the amount of feed delivered over the production cycle as the biomass increases. If you are to use appetite as a welfare indicator, you must therefore assess feed consumption over several days or a week and check whether it deviates over time from what is expected. A gradual decrease in appetite can be a sign of illness, such as Pancreas Disease, while an acute decrease in the feed intake of almost all fish in the facility may indicate toxic algae or other harmful substances or organisms in the water. After the fish has been stressed during e.g., a delousing treatment, it may take a few days for their appetite to return to normal. The time it takes for appetite to recover can also therefore be used as an indicator of the degree of stress the fish has been exposed to.
The following scale can be used as a simple operational log of appetite:
4.3 - Mortality
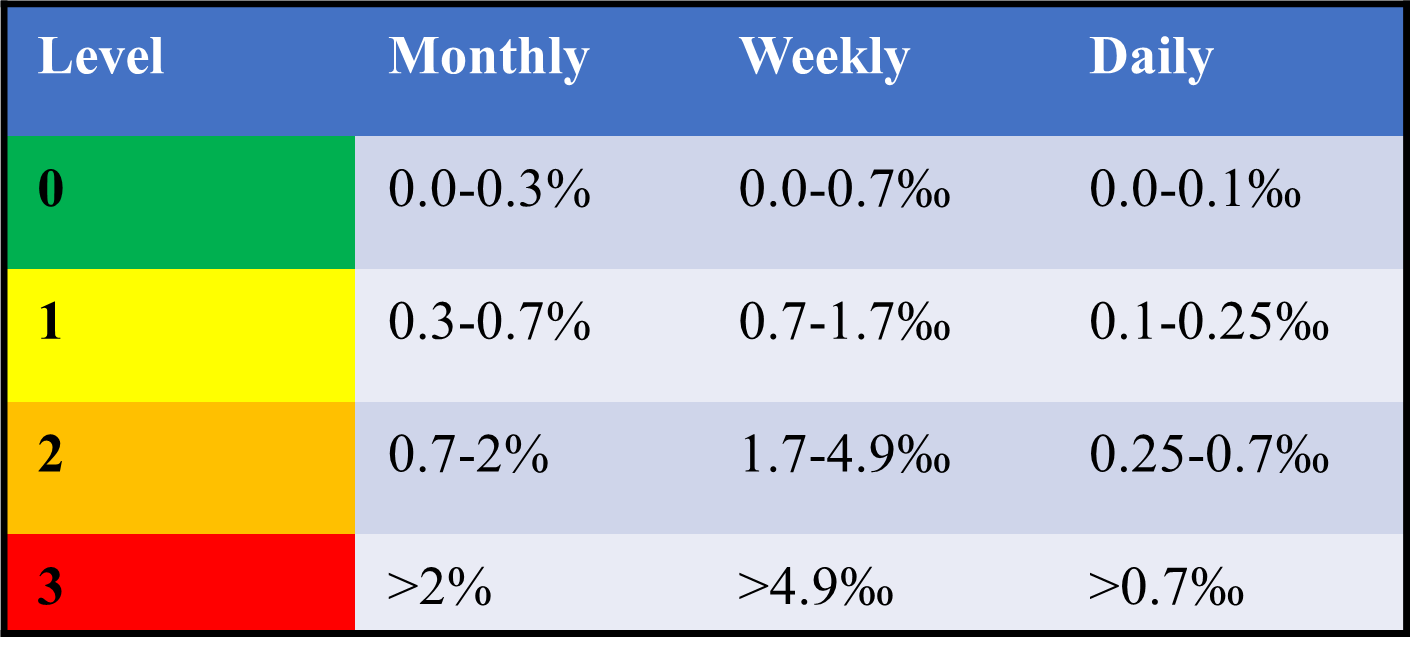
Mortality is a non-specific but good indicator of welfare at the group level. To estimate expected mortality in relation to fish size (weight), we have benchmark mortalities against mortality data for the 2011-2021 generations in Norway. During this period, there has been a development where mortalities have decreased early in the seawater production phase and increased later in production. However, since both the mortality rate for small post-smolts has the potential to rise again, and the mortality rate for larger fish has the potential to improve, we have nevertheless chosen to use the entire period in the calculations for what can be considered expected mortality when producing salmon in cages. The data shows that 50% of the cages had monthly mortality below 0.3%, with some variations in relation to fish size. A cage that has less than 0.3% monthly mortality throughout the production cycle will have an accumulated mortality of below 5% after 18 months. This must be described as good in relation to the monthly mortality average of 0.8% for the 2011-2021 generations, and mortality <0.3% per month is therefore set as level 0 (green level). 75% of cages housing the 2011-2021 generations had an average monthly mortality of <0.7% (0.4-1.1% depending on fish size). A cage that has a constant 0.7% monthly mortality will have an accumulated mortality of 12% after 18 months. This is still lower than average but has the potential to be better. Monthly mortality levels between 0.3% and 0.7% are therefore set as level 1 (yellow level). The worst performing 5% cages housing the 2011-2021 generations had >2% monthly mortality, which would give a cumulative mortality of >36% after 18 months. This must be described as very high, and >2% monthly mortality is set as level 3 (red level). Level 2 (orange level) is monthly mortality between 0.7% and 2%.
See below for an example of mortality scoring in relation to monthly, weekly or daily mortality.
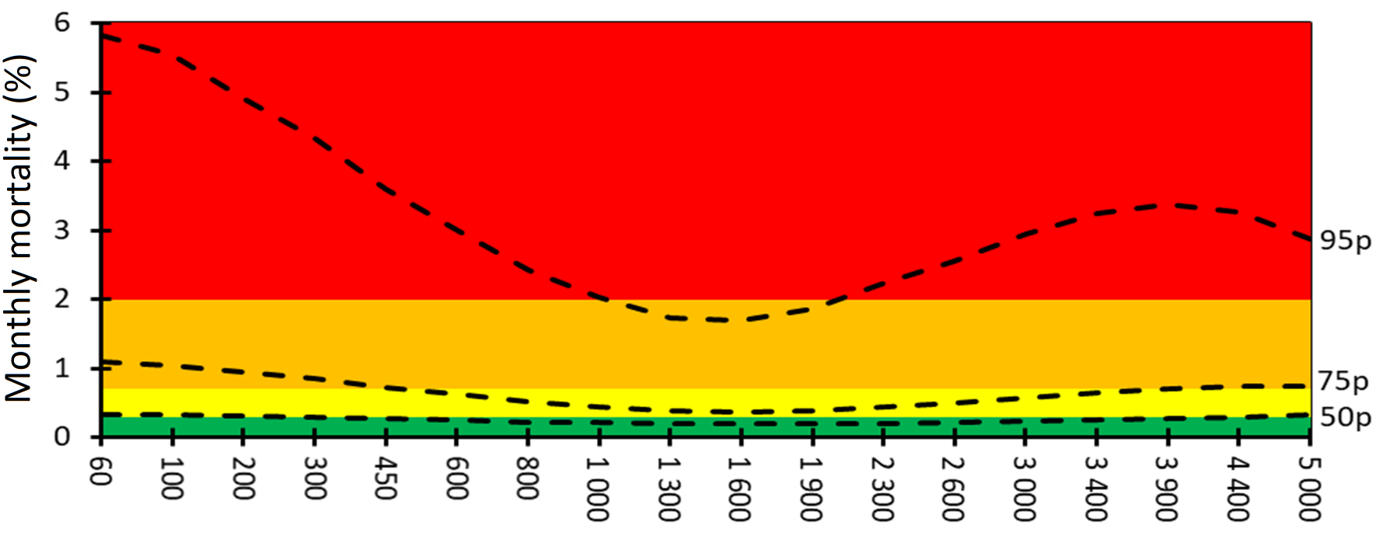
Standard monthly mortality curves in relation to fish size (weight). The dashed lines indicate the 50th, 75th and 95th percentiles for mortality in Norwegian farming cages as reported to the Directorate of Fisheries for salmon transferred to cages in 2011-20201. Cages with fewer than 50,000 fish, or where delousing has been reported to the Norwegian Food Safety Authority in the same month, or the month before, are not included.
5.1 - Individual examination of fish - sampling frequency and sample size
5.1.1 - Frequency
Capturing fish for welfare monitoring is both time-consuming for the farmers and also a potential welfare burden on the fish, especially to the individuals that are taken out of the cage, but to some extent also the rest of the cage population, which may also be disturbed by the operation. It is therefore logical to carry out welfare monitoring when the fish have to be caught for other purposes, usually during standard lice counts. Lice counts must be carried out weekly in Norway.
5.1.2 - Sample size
When counting lice, Norwegian requirements state that at least 10 random individuals from each cage must be examined. However, with so few fish, there can be large uncertainty of whether the welfare data collected is truly representative of the entire group of fish, particularly for welfare deviations that only occur in a small proportion of the individuals. On the other hand, an unrealistically large number of individuals must often be examined to obtain fairly precise estimates. A trade-off must therefore be made between resource use and the accuracy of the estimate, and at least 20 individuals per sampling occasion is recommended. Although estimates are relatively imprecise for each sample case, one will be able to see a pattern in how the numbers develop over time. Furthermore, if one were to examine more cages at the farm at each sampling event, the overall impression of welfare on the farm will also be more robust than if you only look at isolated cages. In addition to regular welfare auditing during e.g., lice counting operations, sampling of greater numbers of individuals can be carried out with a lower frequency to obtain a more precise estimate of the injury status of the fish. When using an underwater camera for automatic injury scoring from images, the number of scored individuals can be increased considerably in relation to what is realistically feasible with traditional manual examinations of fish out of water.
5.2 - Capture and handling of fish
5.2.1 - Capture
The fish that are to be examined must be as representative of the population as possible. The Norwegian lice regulations require that fish for lice counting be caught with seine net, and the same should apply to welfare evaluation. If feeding has started before the capture of fish, it is more difficult to get hold of fish that are actively feeding towards the center of the cage, or are full and not motivated to respond to bait in the seine net. Catching will then become more difficult and less representative, typically with an over-representation of fainters and loser fish. Feeding in the cage must therefore be withheld until capture is complete.
5.2.2 - Netting
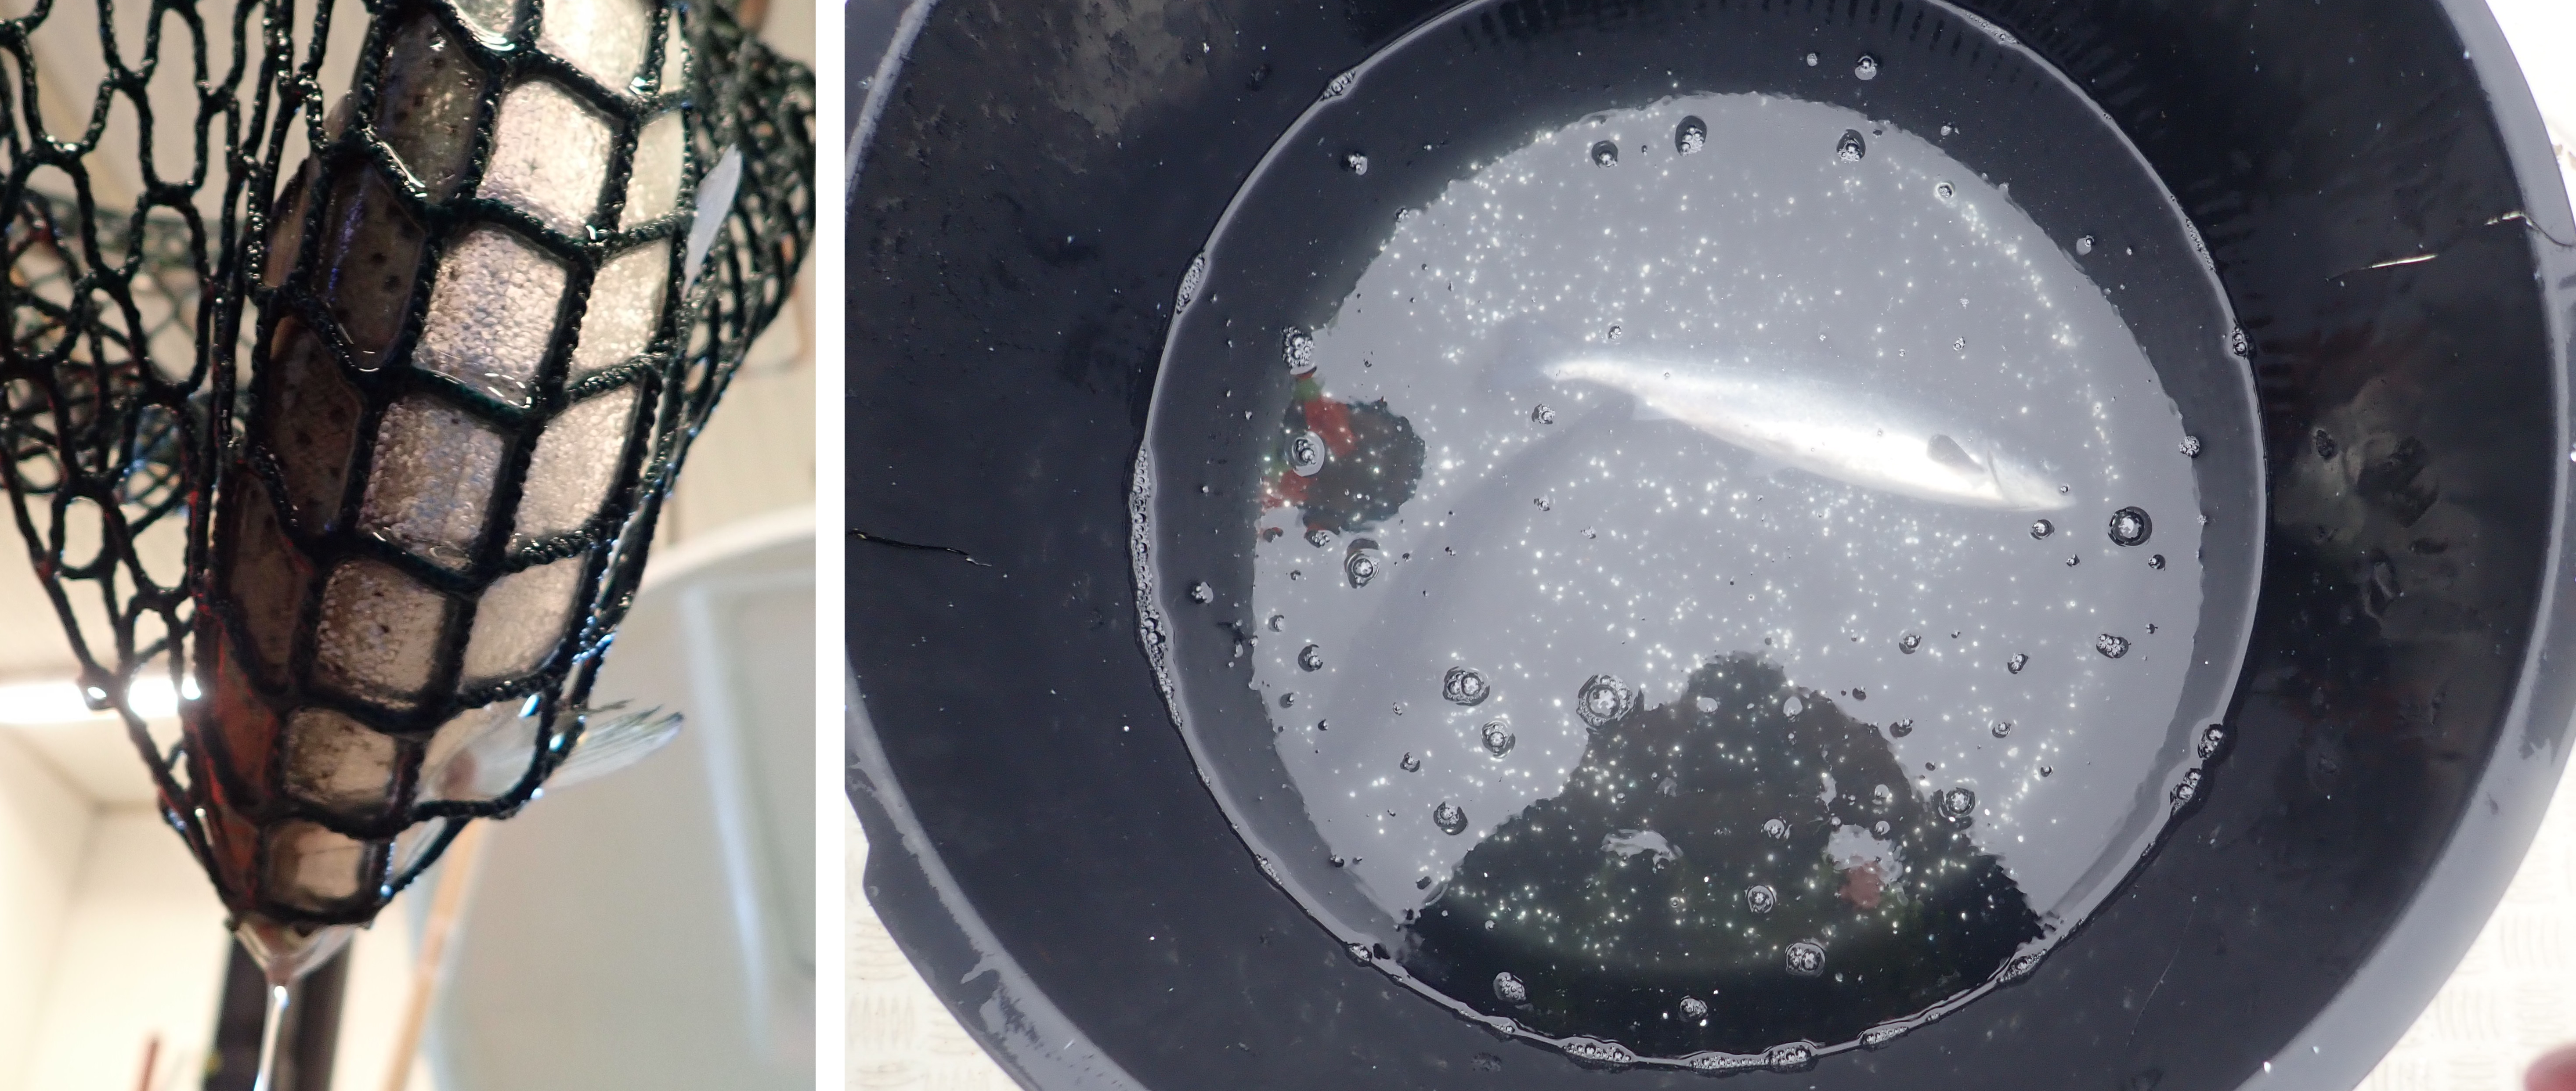
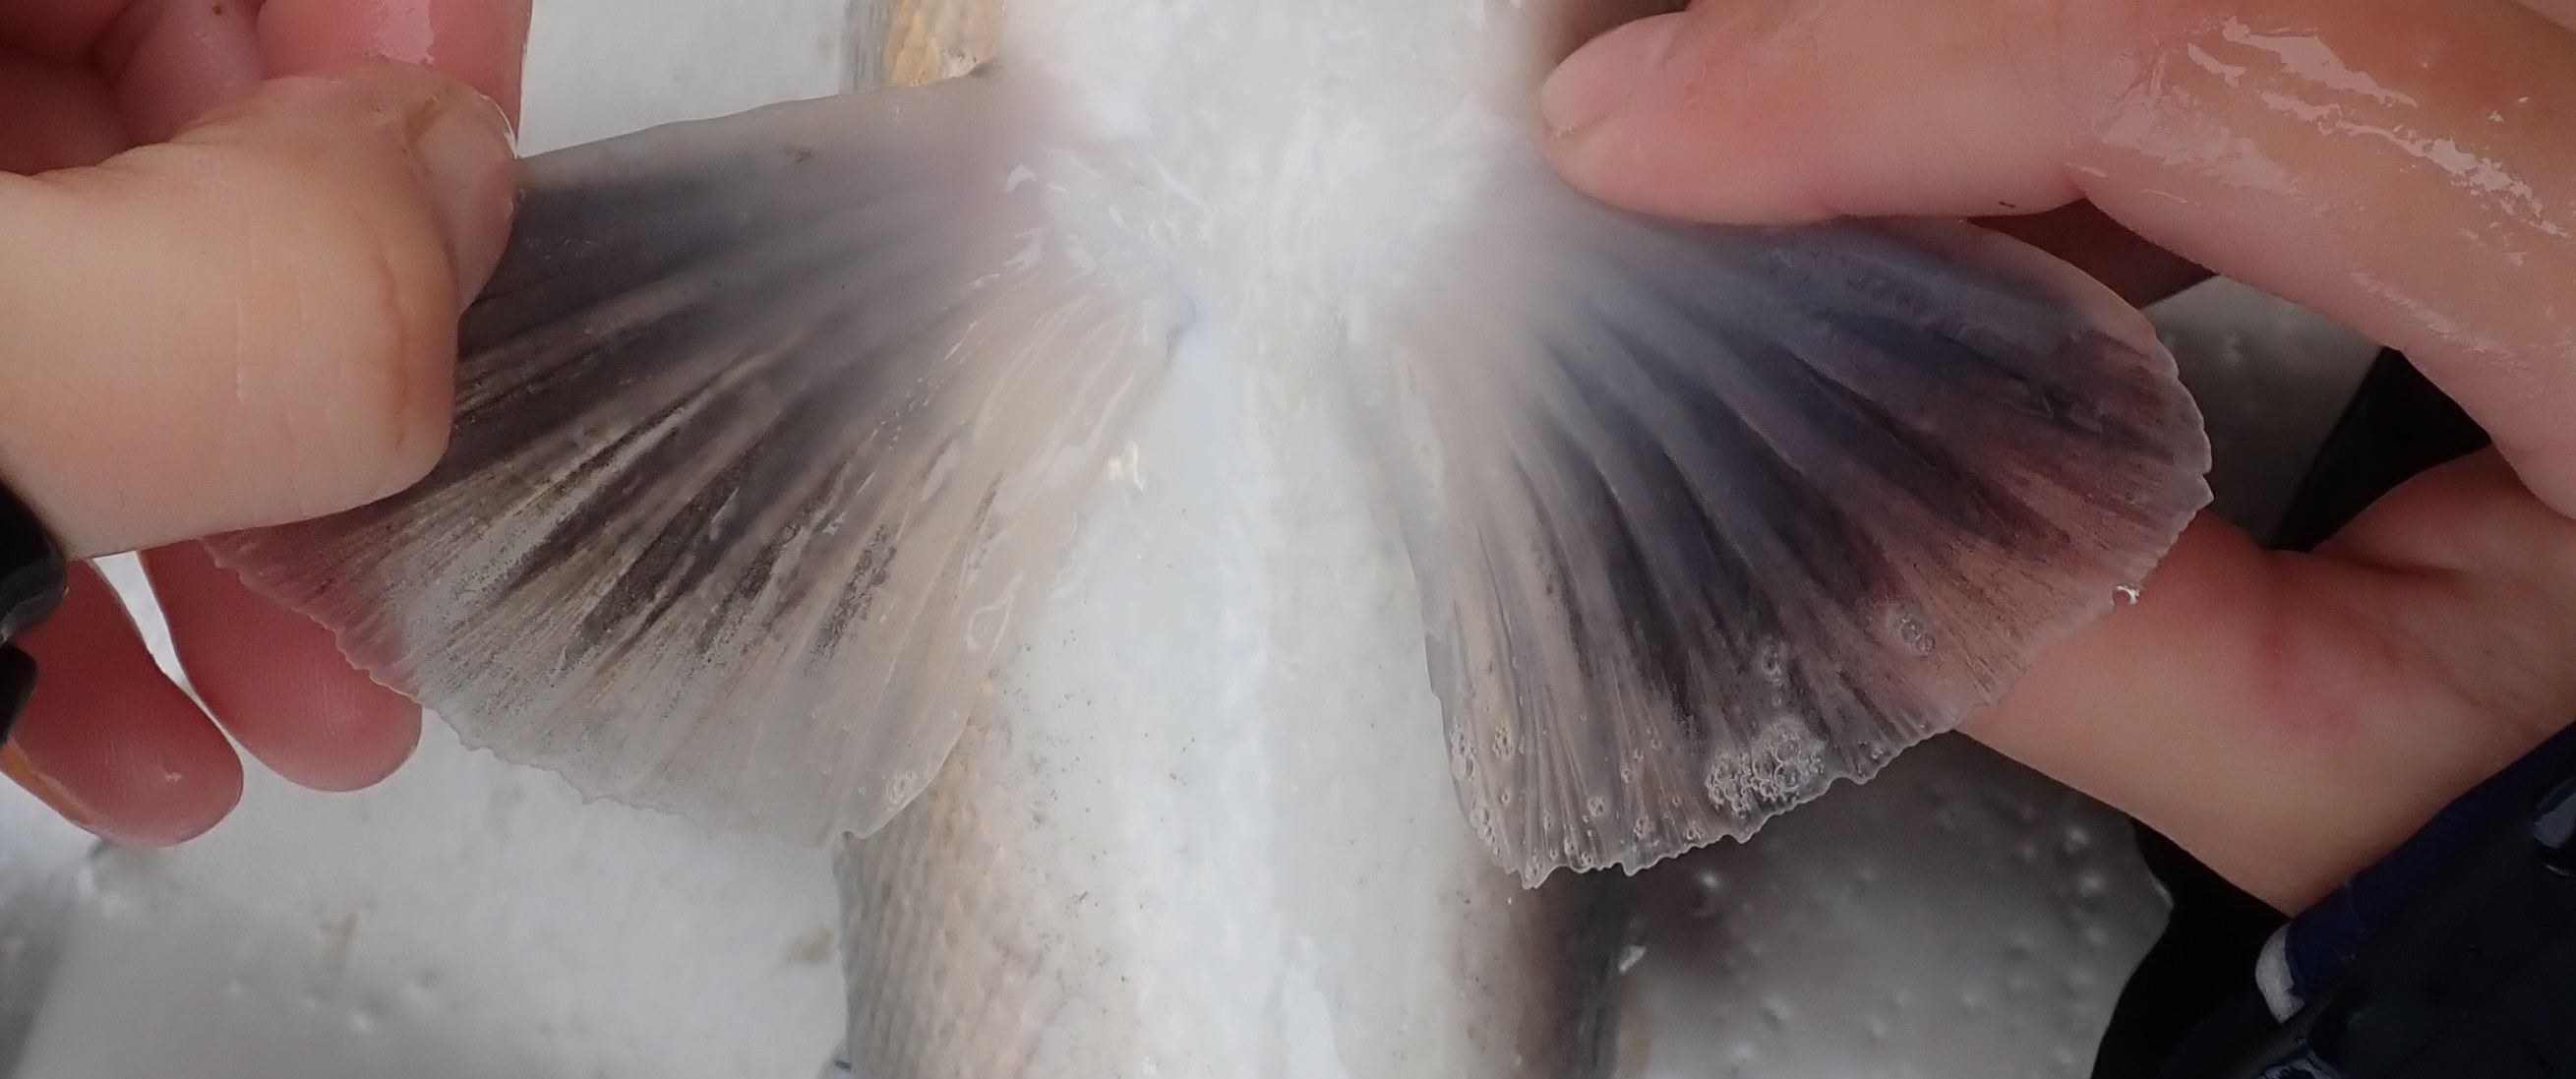
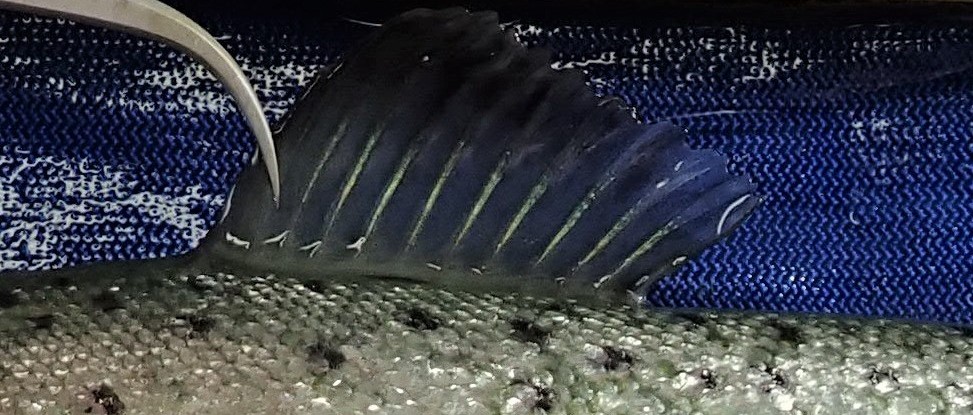
From the seine net, the fish is netted out, with a maximum of five fish at a time in the net, and into a bath with anesthetics. The risk of causing damage to the fish such as scale loss and fin splitting during netting probably increases with the number of fish in the net, especially for larger individuals, and it is recommended to minimize the number of individuals in the net. Characteristics of the net used also have an impact on the risk of injury. Large mesh size and holes in the mesh increase the likelihood of fins being pushed out and split, and knotted meshes cause more damage than knotless meshes. Undamaged, knot-free dip nets with a mesh size of 5-10 mm are recommended. Damage caused during crowding, netting and handling of the fish will, in addition to unnecessary harm on the individuals, give an overestimate of the true amount of damage in the cage.
Examples of damage caused by sampling. Above: a pectoral fin that is pressed through and split into a 20 mm net mesh. Bottom: scales that have fallen off during netting into the anesthetic tub.
5.2.3 - All should be included
All captured individuals, including those with cleare injuries or signs of disease, for example "loser fish", even if it is considered that they are overrepresented in the sample. Individuals with a reduced escape response and who are easily captured may be overrepresented in the sample but excluding them will also give an incorrect measure of the cage situation. If you have a strong suspicion that the selection of individuals is misleading, you should rather set a new cast to get a better selection.
5.3 - Manual examinations of fish
During examination, the time the fish is kept in air should be minimised as much as possible, especially when the air temperature is below 0°C or at high temperatures greater than 20°C or in windy conditions. Weighing fish can be useful for estimating average size in the cage, but size is not in itself a welfare indicator. The measurement of weight and length is necessary to calculate condition factor, but this will add time to the examination and increase air exposure. In addition, it is often difficult to obtain precise weight measurements under operational conditions with wind and waves. A more subjective assessment of the individual's condition, Emaciation, is therefore included in the protocol as an alternative to the weight- and length-based condition factor.
The individual-based indicators are ordered in this protocol to consider the observers impression of the whole fish first, then indicators scored from the head to tail region, before finally focusing on the fins. By consistently scoring the indicators in the same order, an examiner will quickly get into a routine that can shorten the time needed to examine each.
One should be prepared to euthanise fish that have serious injuries or that have been exposed to air for too long at extreme temperatures, for example by having a bucket of strong anaesthetic ready.
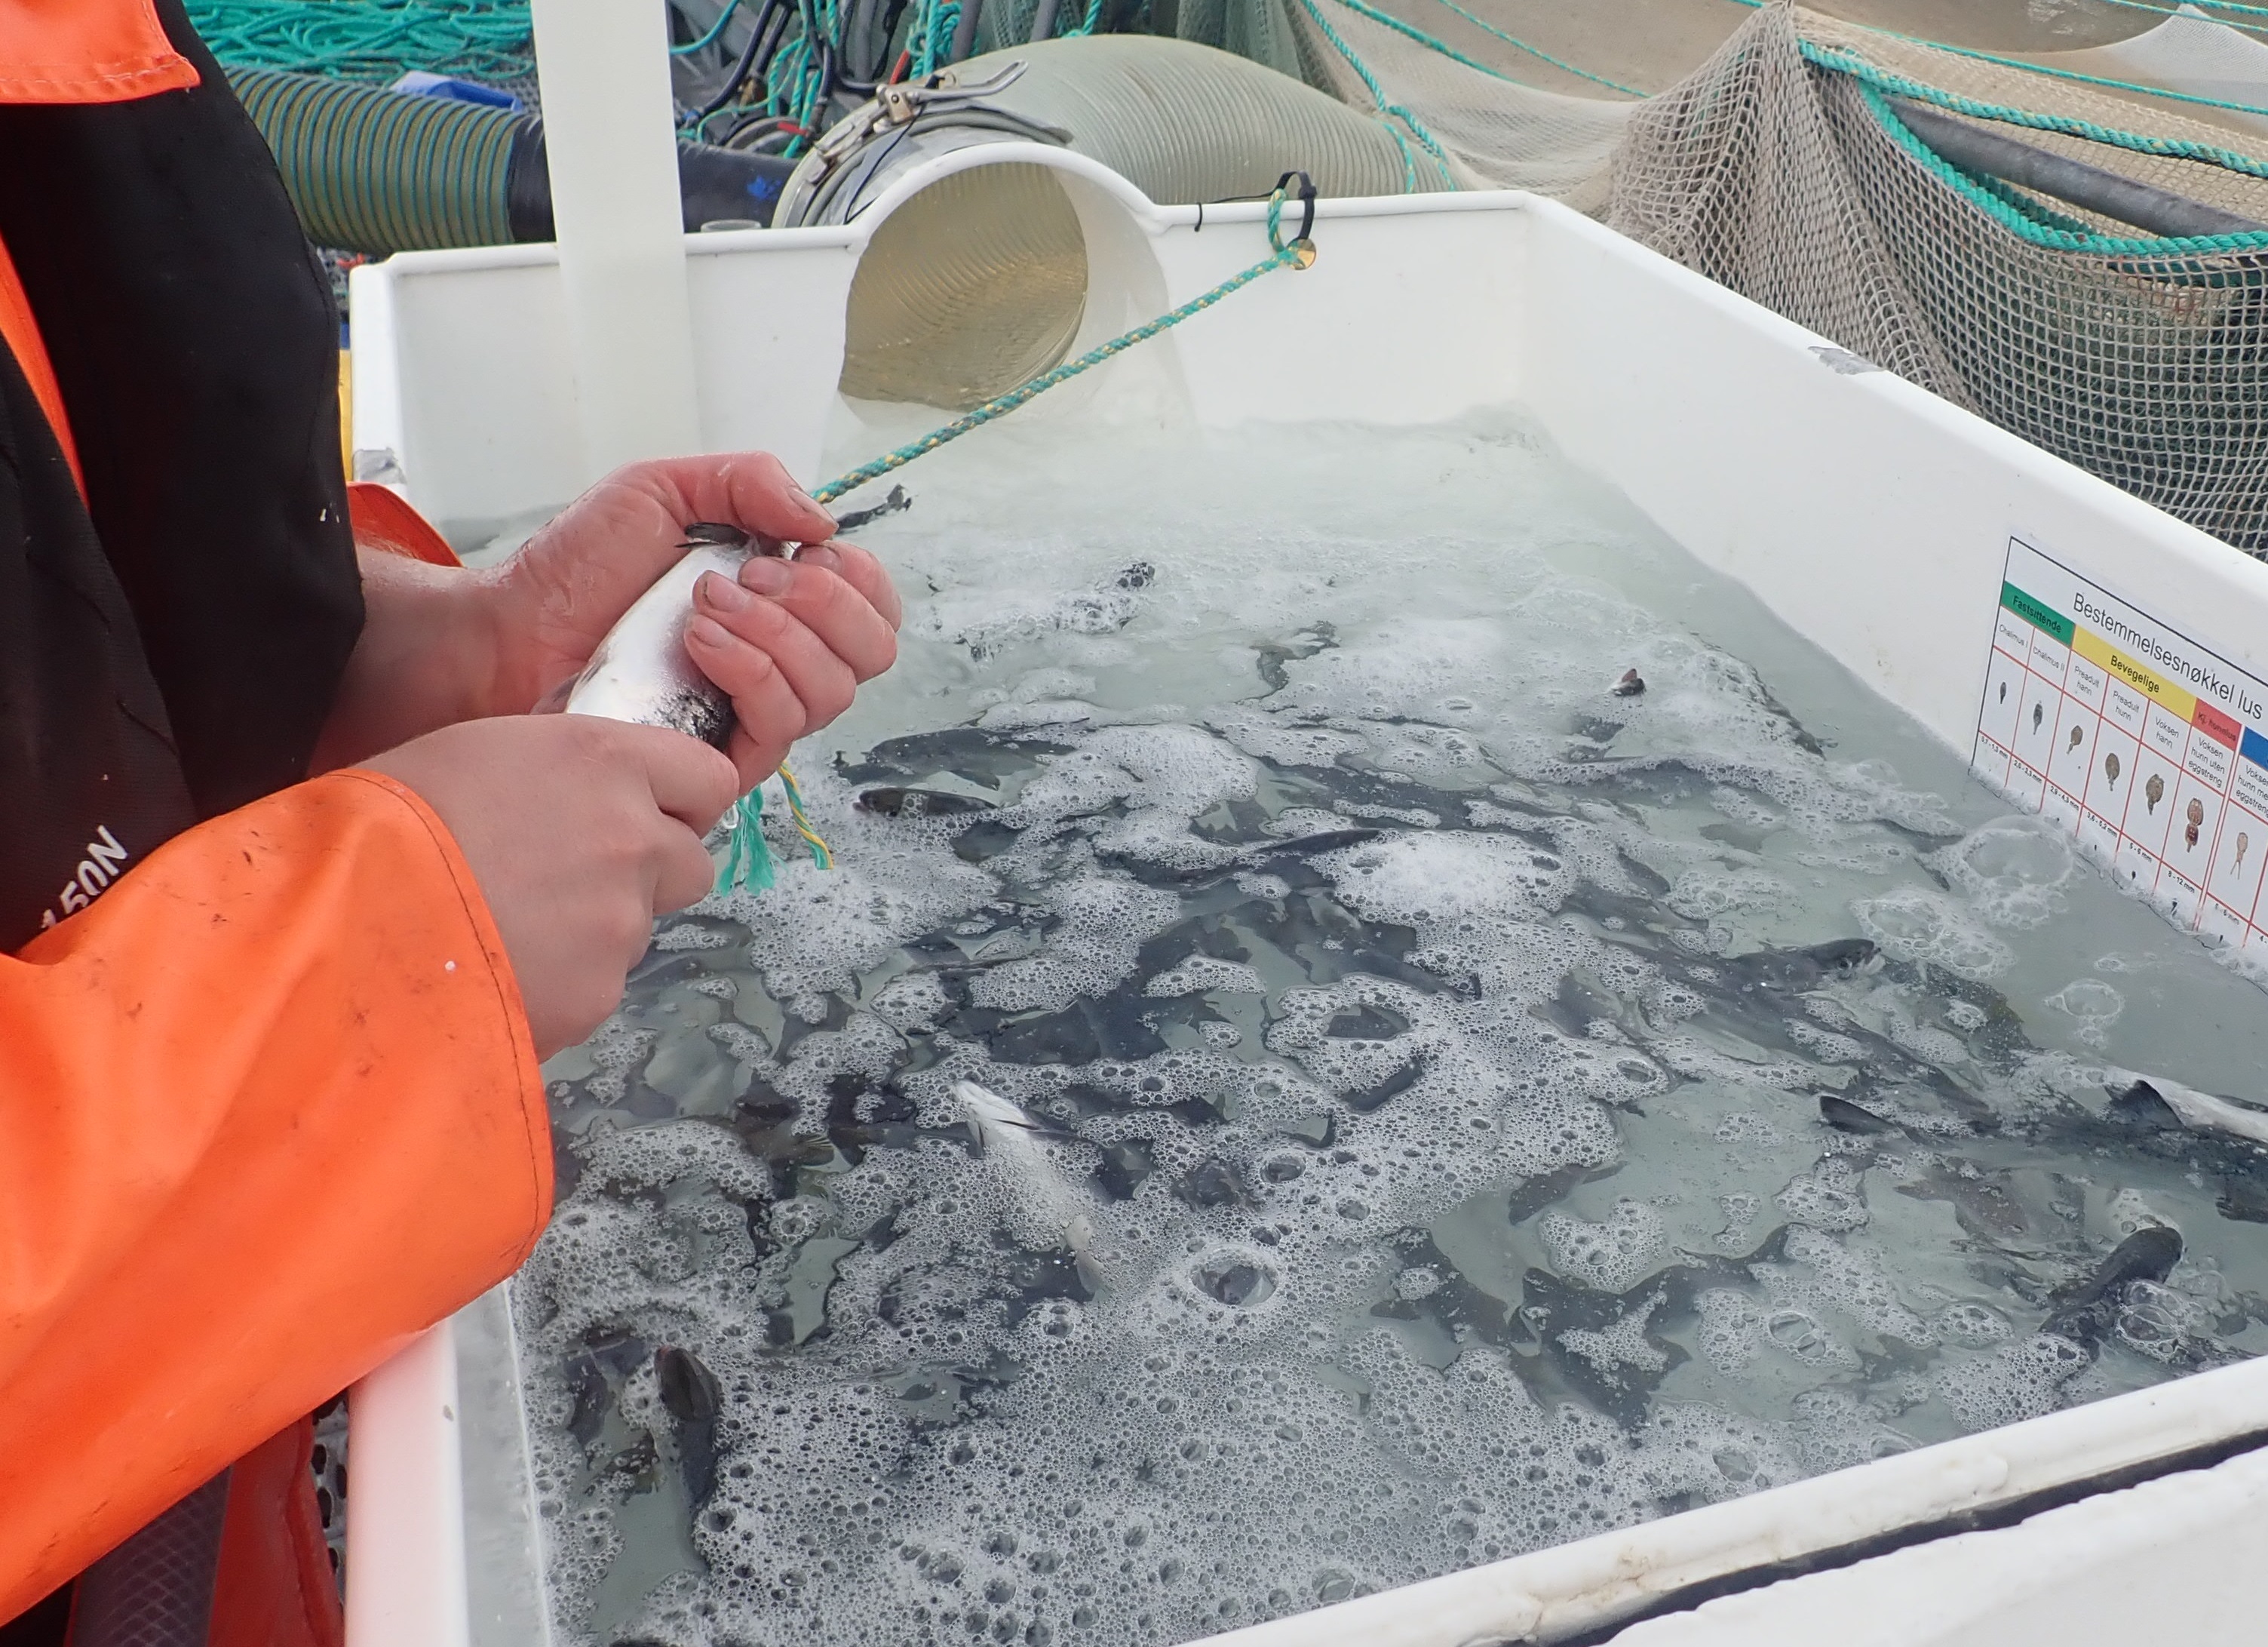
If the fish is held directly above the anaesthetic bath during examination, it can easily be dipped in water to keep it wet, and it also reduces the risk for the fish if it falls out of the observer's hands. A measuring tape on the edge of the bath allows the observer to quickly measure fish length.
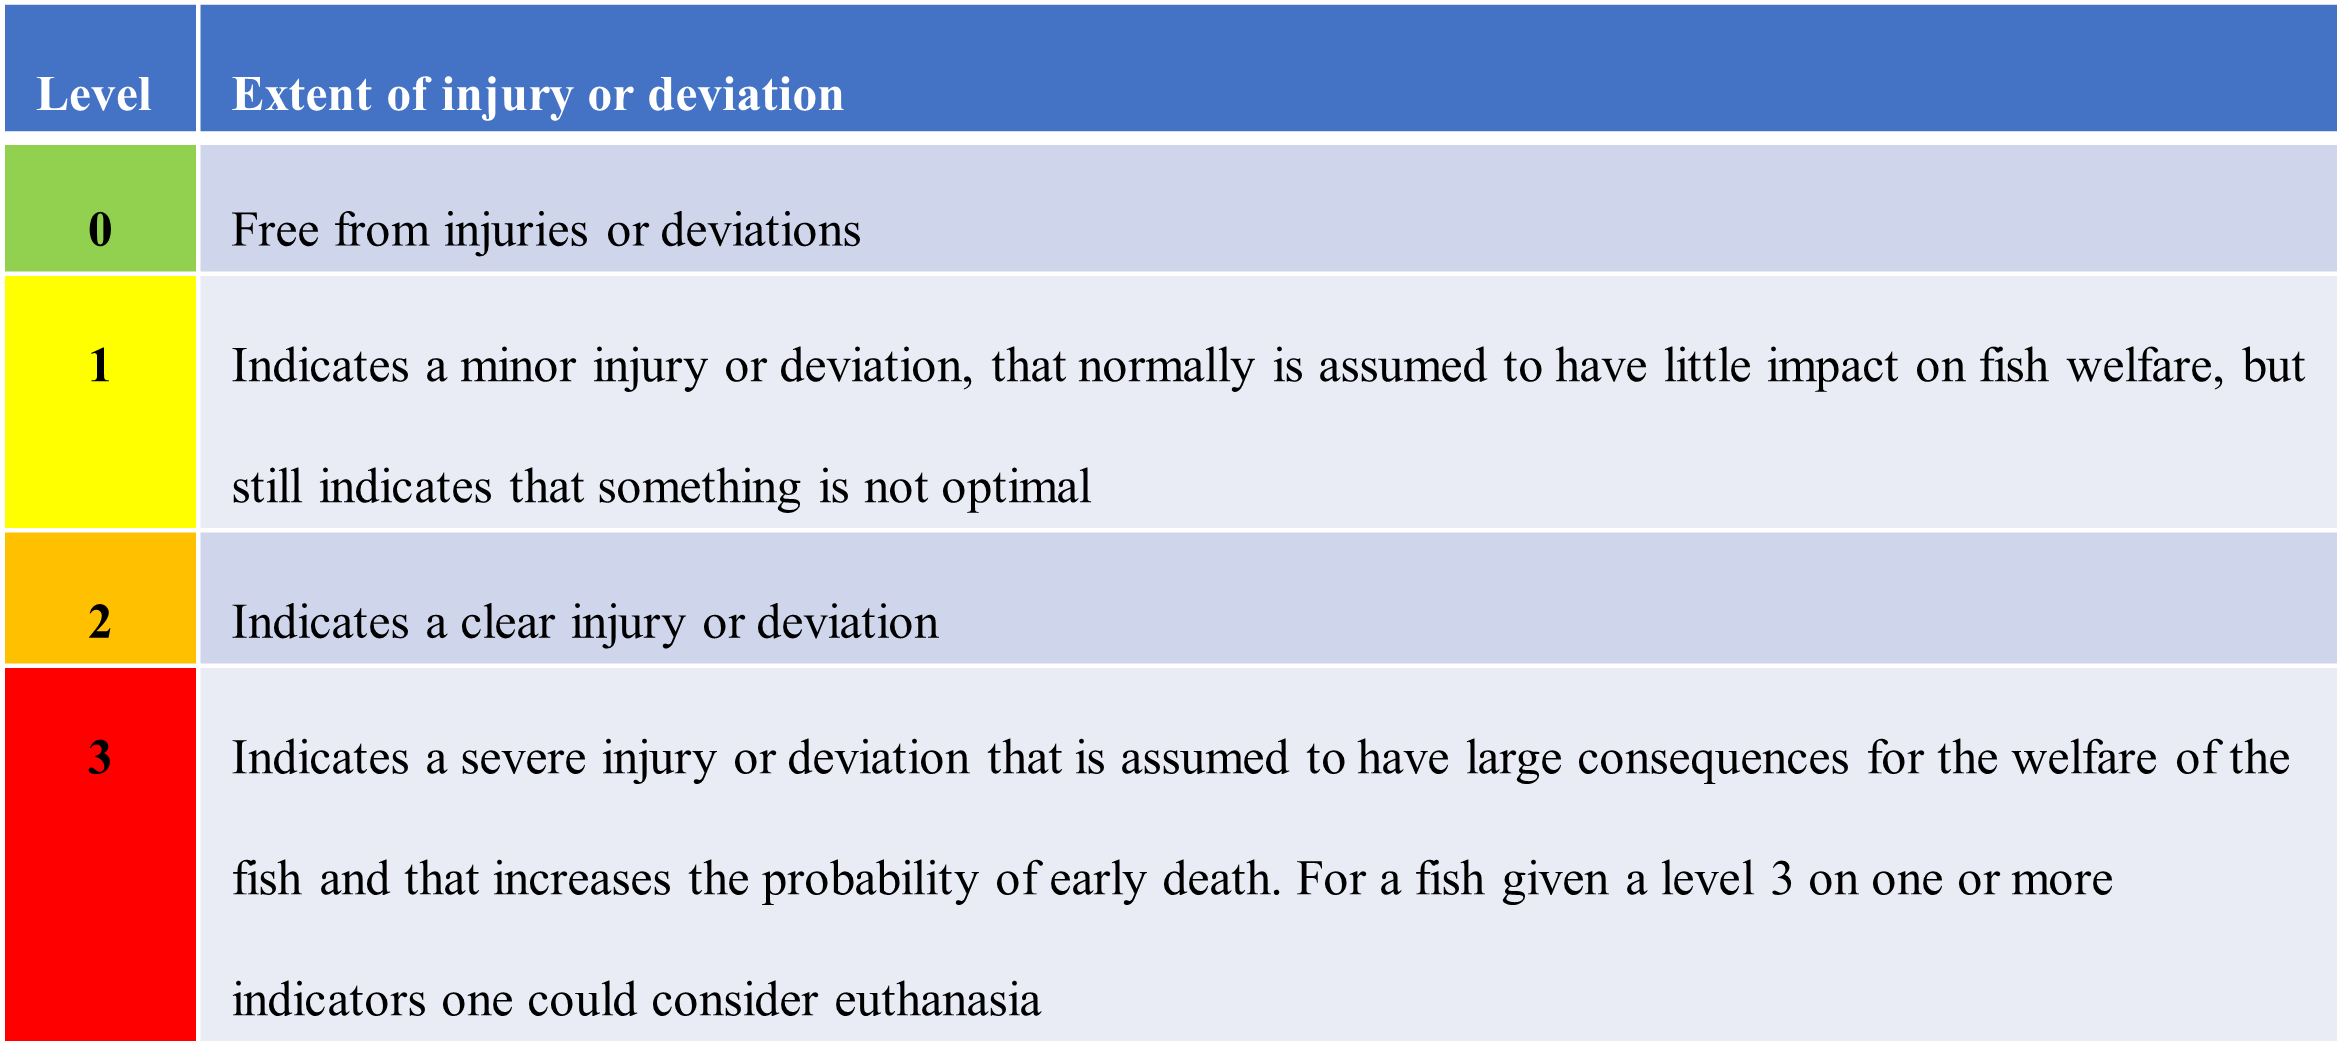
5.4 - About the scoring system and levels
The scoring levels range from 0 to 3, and are intended to describe the extent of the damage or deviation in relation to what is expected for a completely damage- and deviation-free fish. The welfare indicators can differ in their prognosis, e.g. some injuries, such as wounds and scale loss, can heal and improve, while others, such as deformities, are chronic. Sexual maturation is a natural biological process, but it can have negative consequences for maturing salmon if they are kept in seawater.
The severity of each of the different indicators is not weighted. Some indicators may have more serious impacts upon fish welfare than others at the same scoring level, but these impacts are not considered here.
A brief description of what to consider with regard to the various indicator levels is listed below. Expected consequences for the fish under normal conditions are intended as support for describing the extent of the damage.
The exact consequences a given level can actually have on fish welfare depend on many factors such as temperature, salinity, infection pressure, degree of handling, etc. This should not be taken into account when scoring, even though it may have consequences for the choice of potential corrective actions to be taken after scoring.
When sampling fish from cages, you will get a distribution of fish with different welfare scores. When monitoring a population, it is the relative proportion, and possibly change in proportion, of fish with the various scoring levels that is of interest. The scoring levels are not linear and results from scoring must therefore never be presented as average values, or changes in average values, as this can give a particularly misleading representation of the result. For example, if one goes from having 100 individuals where a given indicator is scored at level 1, to 90 individuals with level 1 and 10 individuals with level 3 after a handling operation, this only results in a change in mean scoring level from 1.0 to 1.2, which may seem negligible, but the population has gone from having 100% fish with only minor deviations to 10% of the population now having severe injuries. The scores for each indicator should therefore be presented as a proportion of the surveyed population with the respective level.
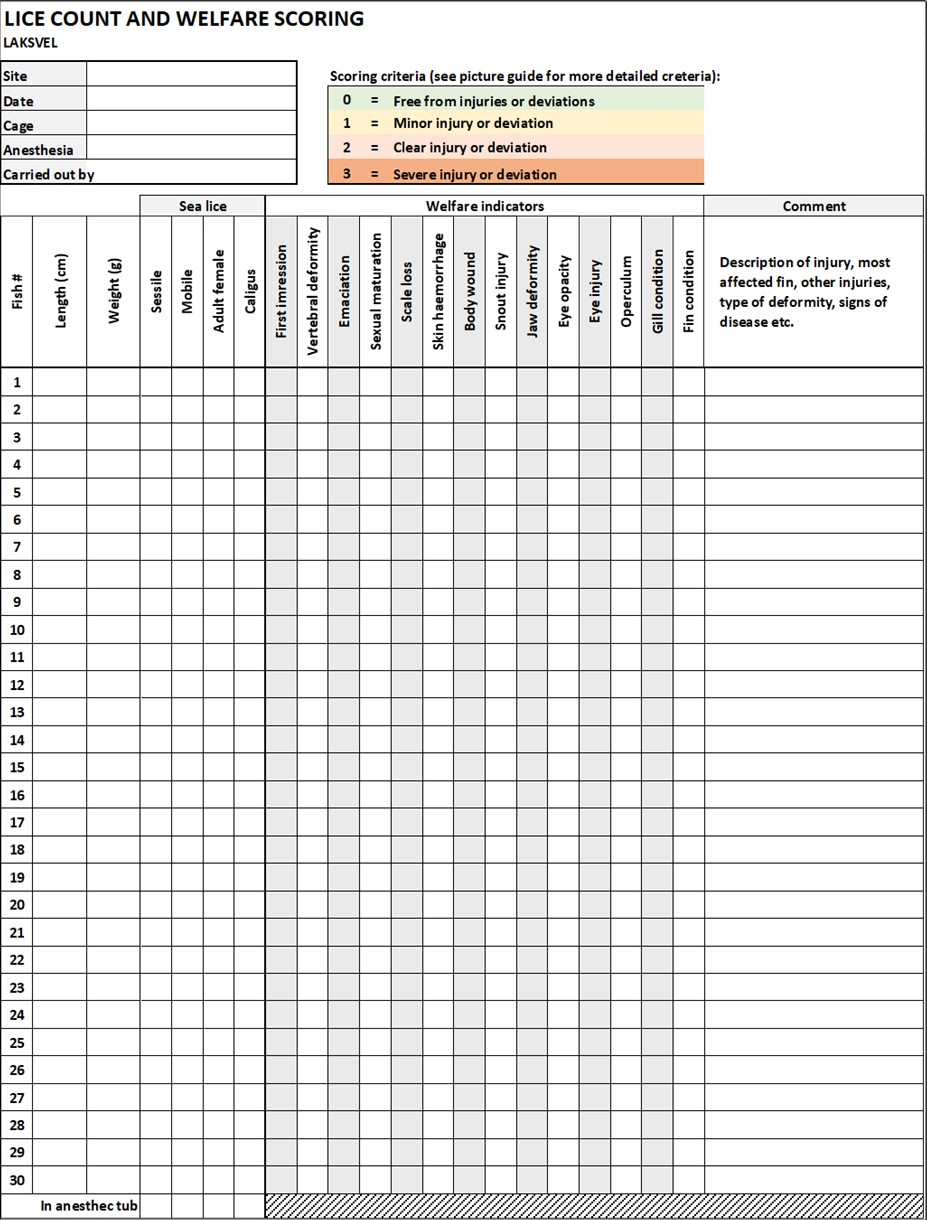
6 - Scheme for scoring individual based welfare indicators
Weight, length and number of lice are not among the welfare indicators in this protocol, but are included in the scheme as they are often registered on the same fish at time of scoring
7 - Scoring guide
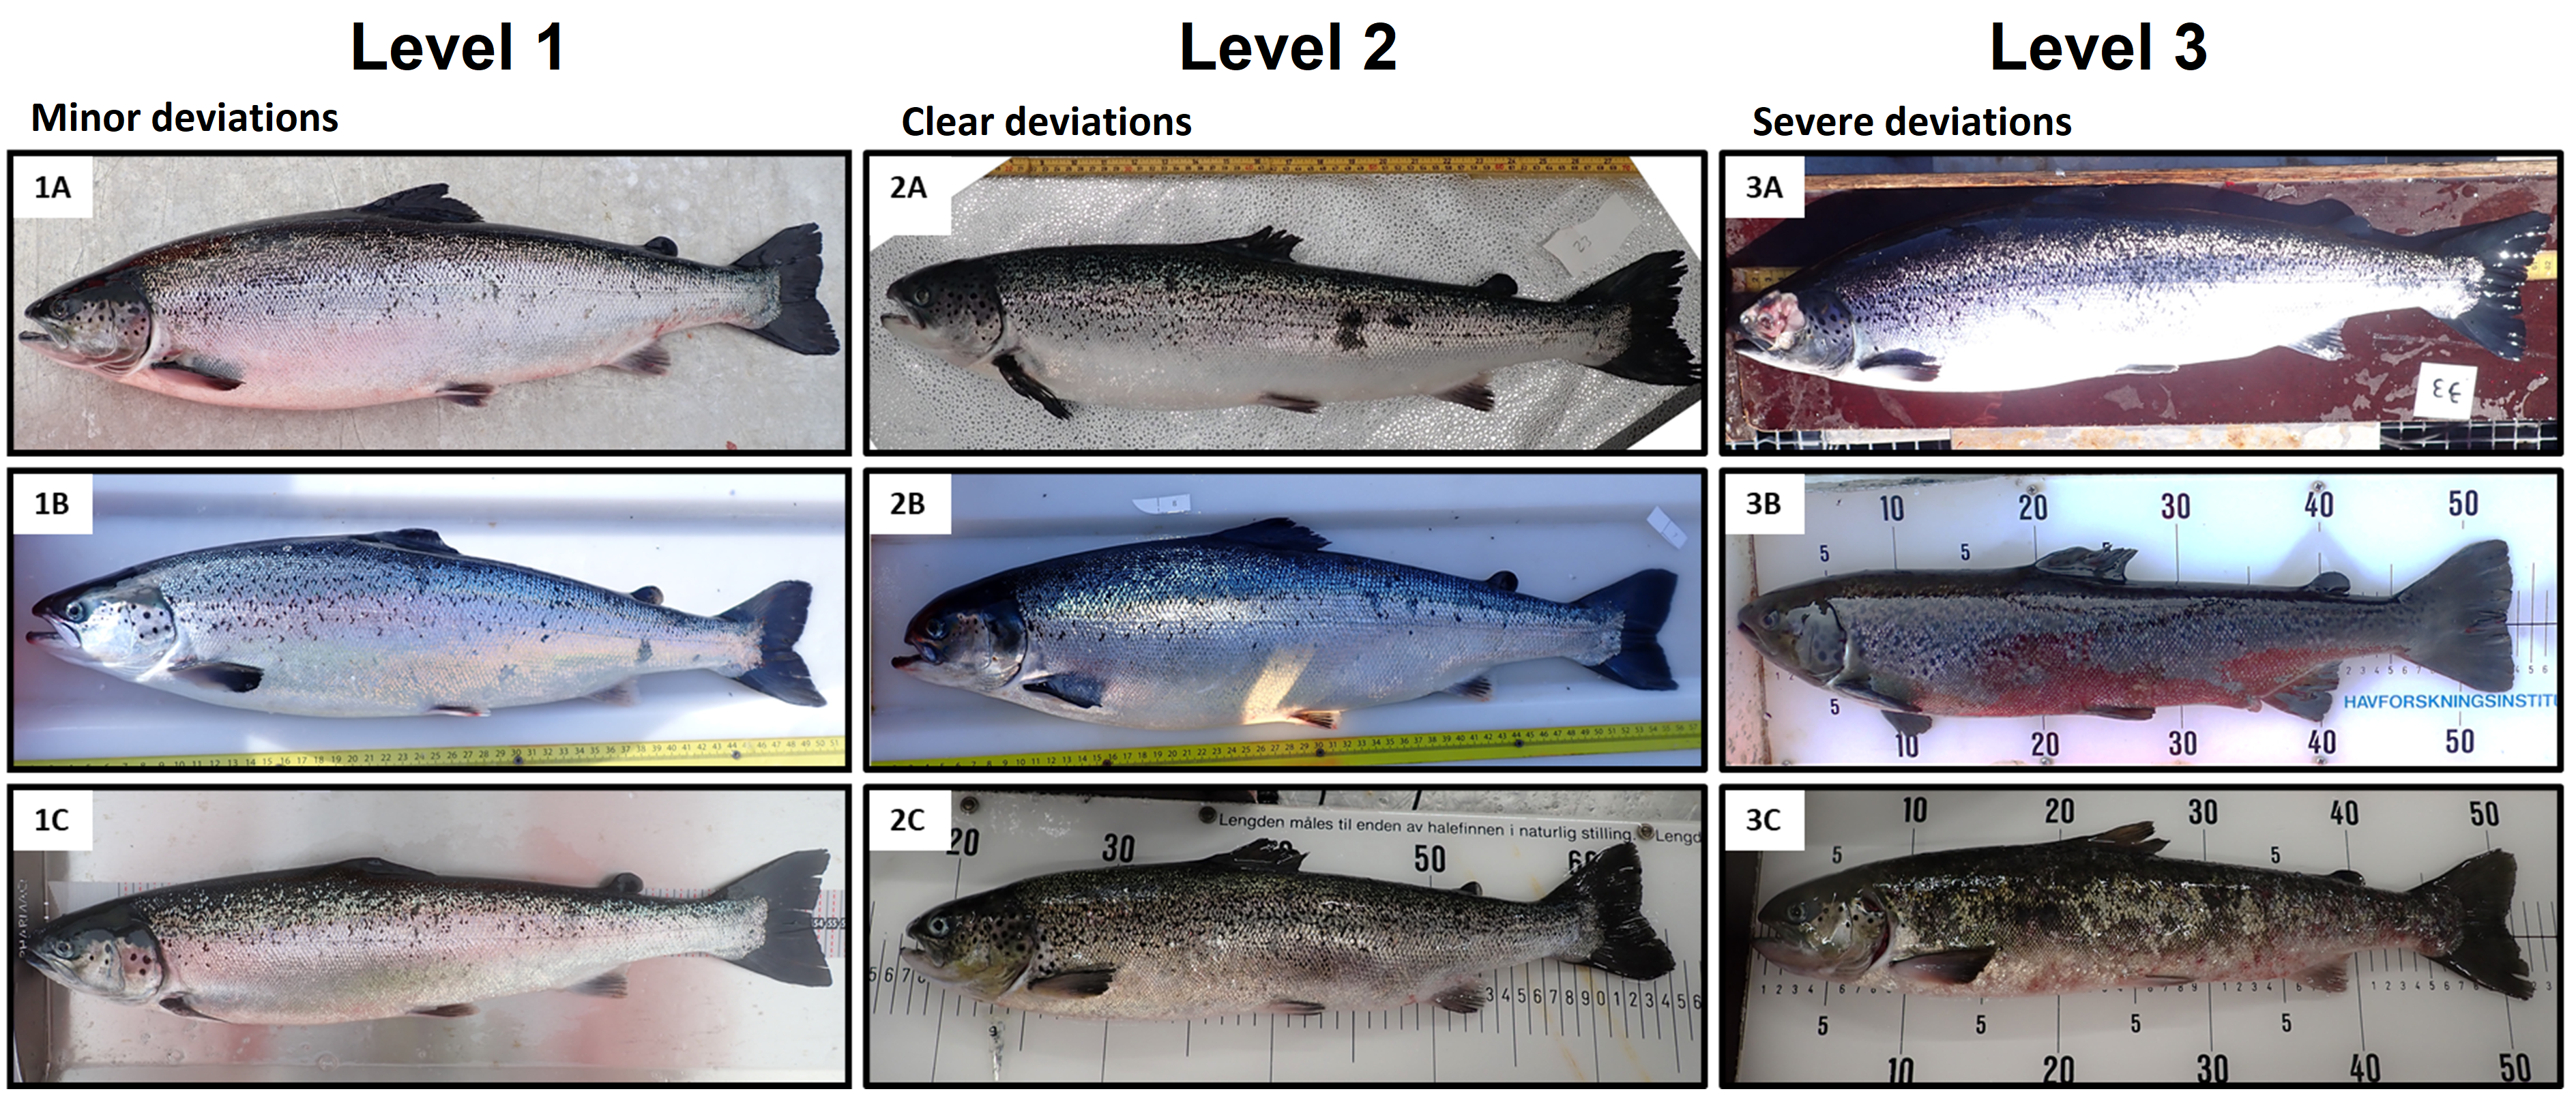
The scoring guide shows 3 example images for each scoring level from 1 to 3 for each indicator. Scoring level 0 (free from injuries or deviations) is not shown. Example images of Fin damage scoring level 0 are given in the Appendix.
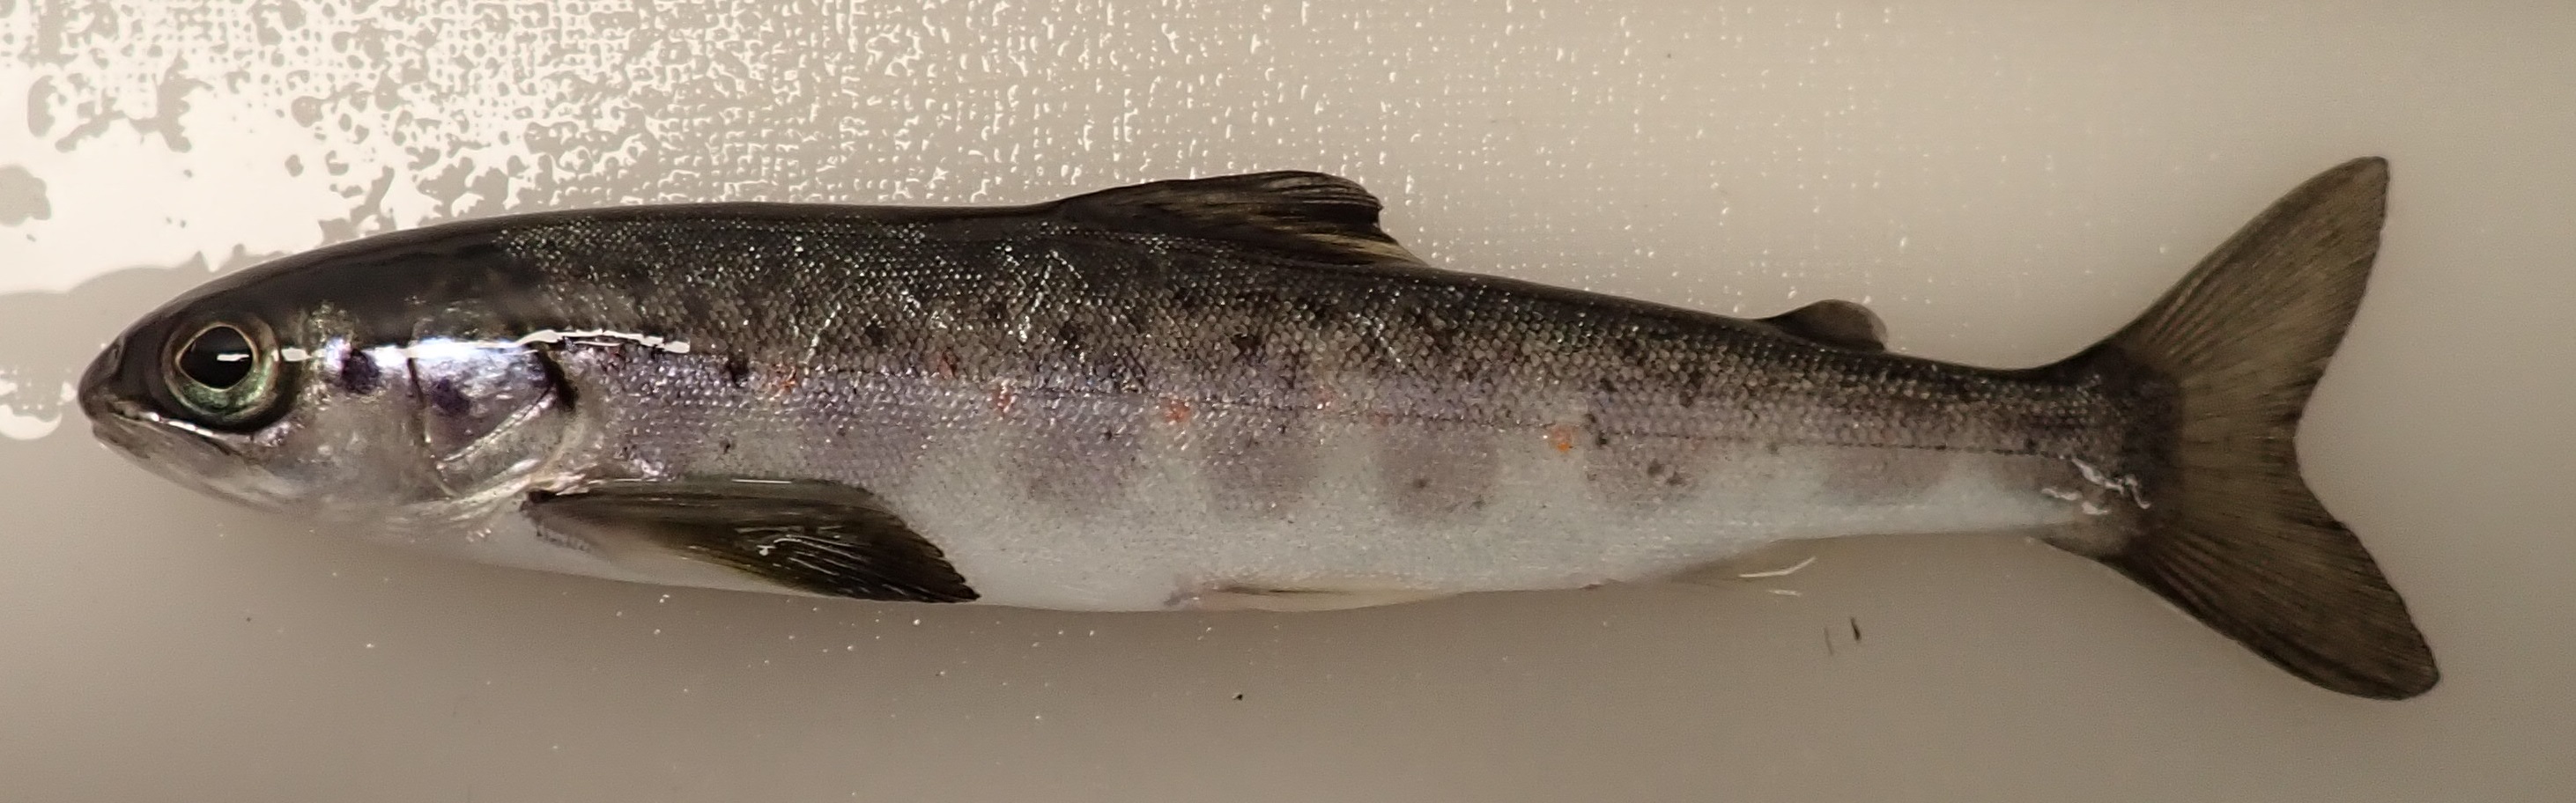
7.1 - First impression
By first impression we mean the impression you first look at the salmon. Almost no farmed salmon is entirely injury free level 0), but may have minor injuries such as some fin damage or scale loss loss (picture 1A-B), or other minor deviations such as signs of minor emaciation (picture 1C). If they are otherwise well-functioning and of the expected size and condition, they are recorded as level 1. Salmon of expected size but with more pronounced external injuries or challenges blemishes (picture 2A-C), e.g. moderate, but clear, deformities, wounds, injuries, signs of disease or sexual maturation, are recorded as level 2. Fish that give a very poor overall impression—for example, those with large wounds (picture 3A), major deformities, full maturation state (picture 3B), stunted growth with emaciation (picture 3B) or clear signs of disease (picture 3C) are recorded as level 3.
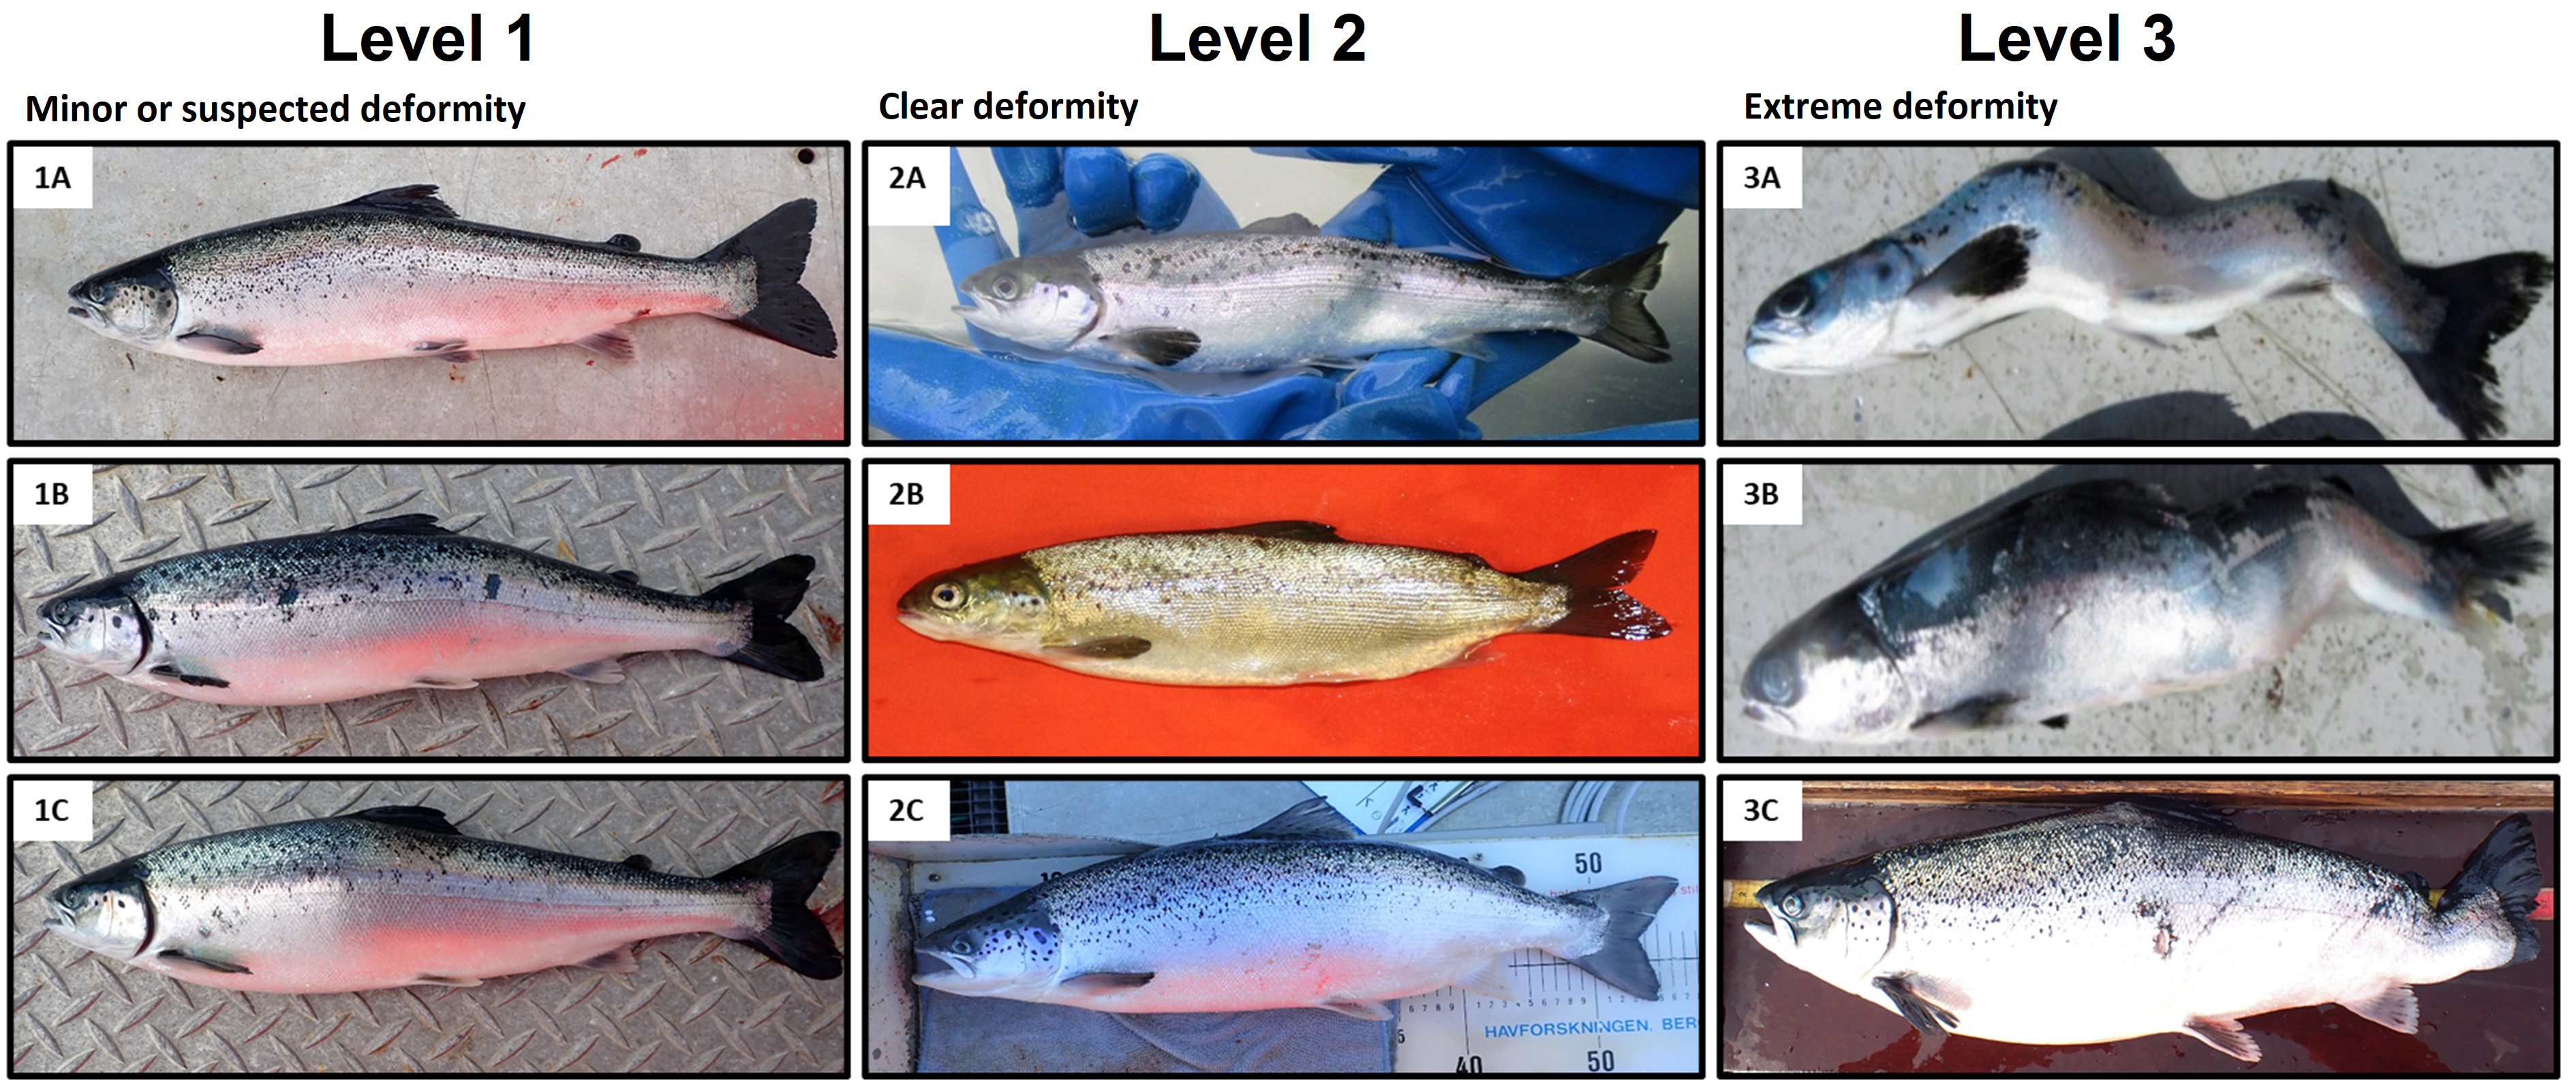
7.2 - Vertebral deformities
Vertebral deformities are likely to be the result of several contributing factors such as nutrition, high egg incubation temperature, rapid smolt growth, vaccination, water flow and quality, environmental pollution and/or triploidy. Smaller deformities (picture 1A-C) are recorded as level 1. These can be easiest to detect if you gently run your hand over the fish. Clear deformities, but where the fish has a relatively normal size and where the deformity has not led to further injuries (picture 2A-C), are recorded as given level 2. Large deformities that obviously reduce the fish's function and ability to move or that cause further injuries (picture 3A-C) are recorded as level 3.
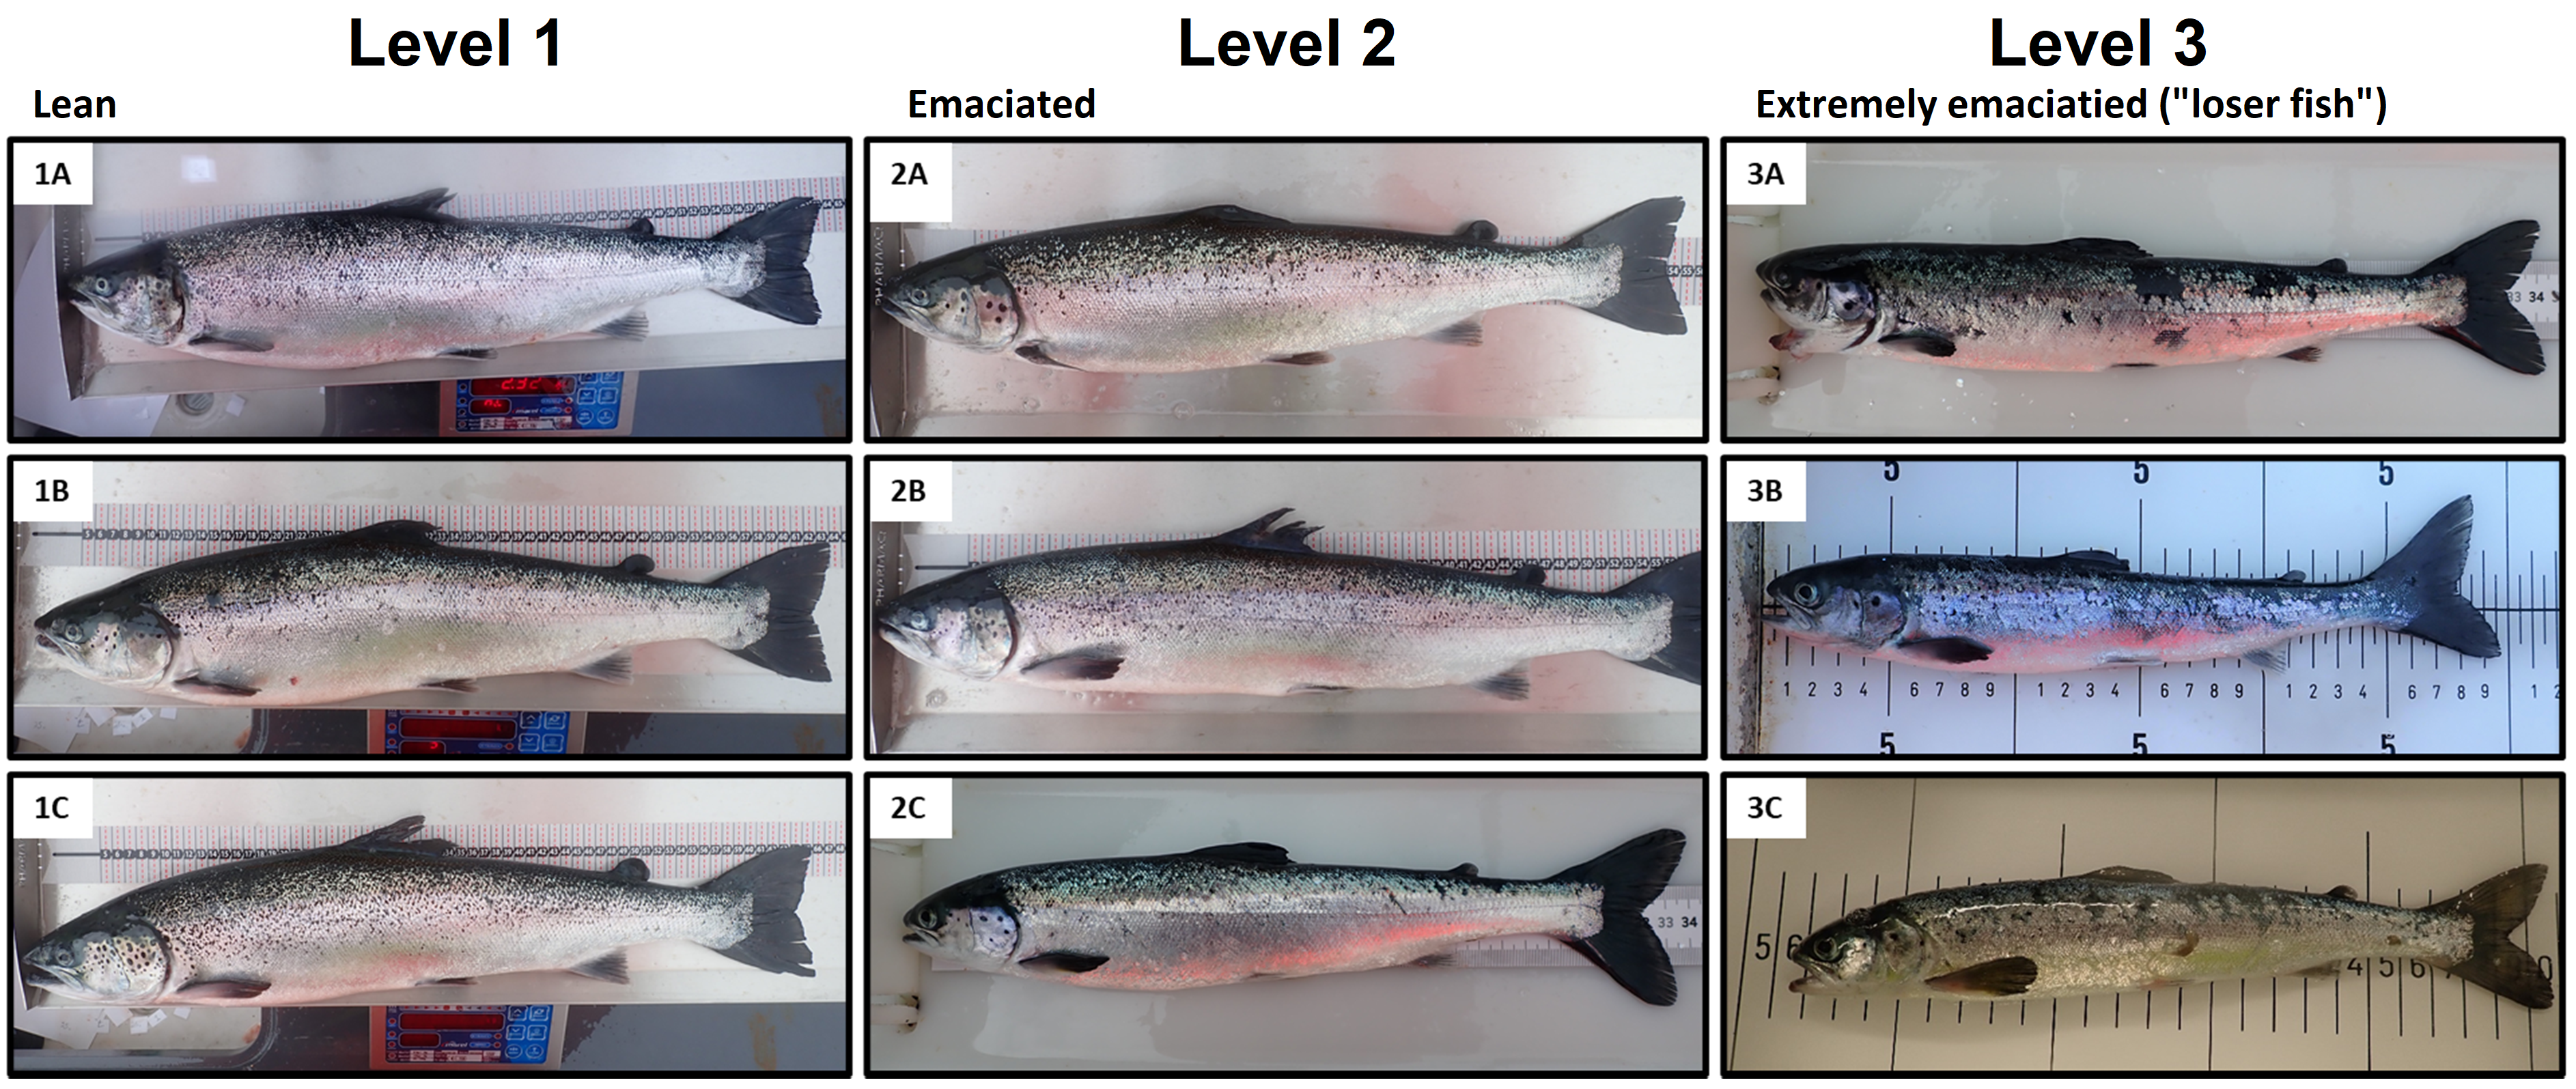
7.3 - Emaciation
The relationship between a fish’s length and weight (condition factor) can vary for natural reasons such as age and season but can vary due to underlying problems such as disease. Smaller salmon normally have a more elongated body shape and thus a lower condition factor than larger salmon. Salmon that are a little lean but have the potential to grow well under the right conditions (picture 1A-C) are recorded as level 1. This corresponds to a condition factor of approx. 1-1.2, but what is expected in relation to the life stage of the fish must also be taken into account. Clearly emaciated salmon that are similar in length to their conspecifics (picture 2A-C) are recorded as level 2. Very emaciated salmon that are markedly smaller than their conspecifics, so-called "loser fish" (picture 3A-C), are recoded as level 3.
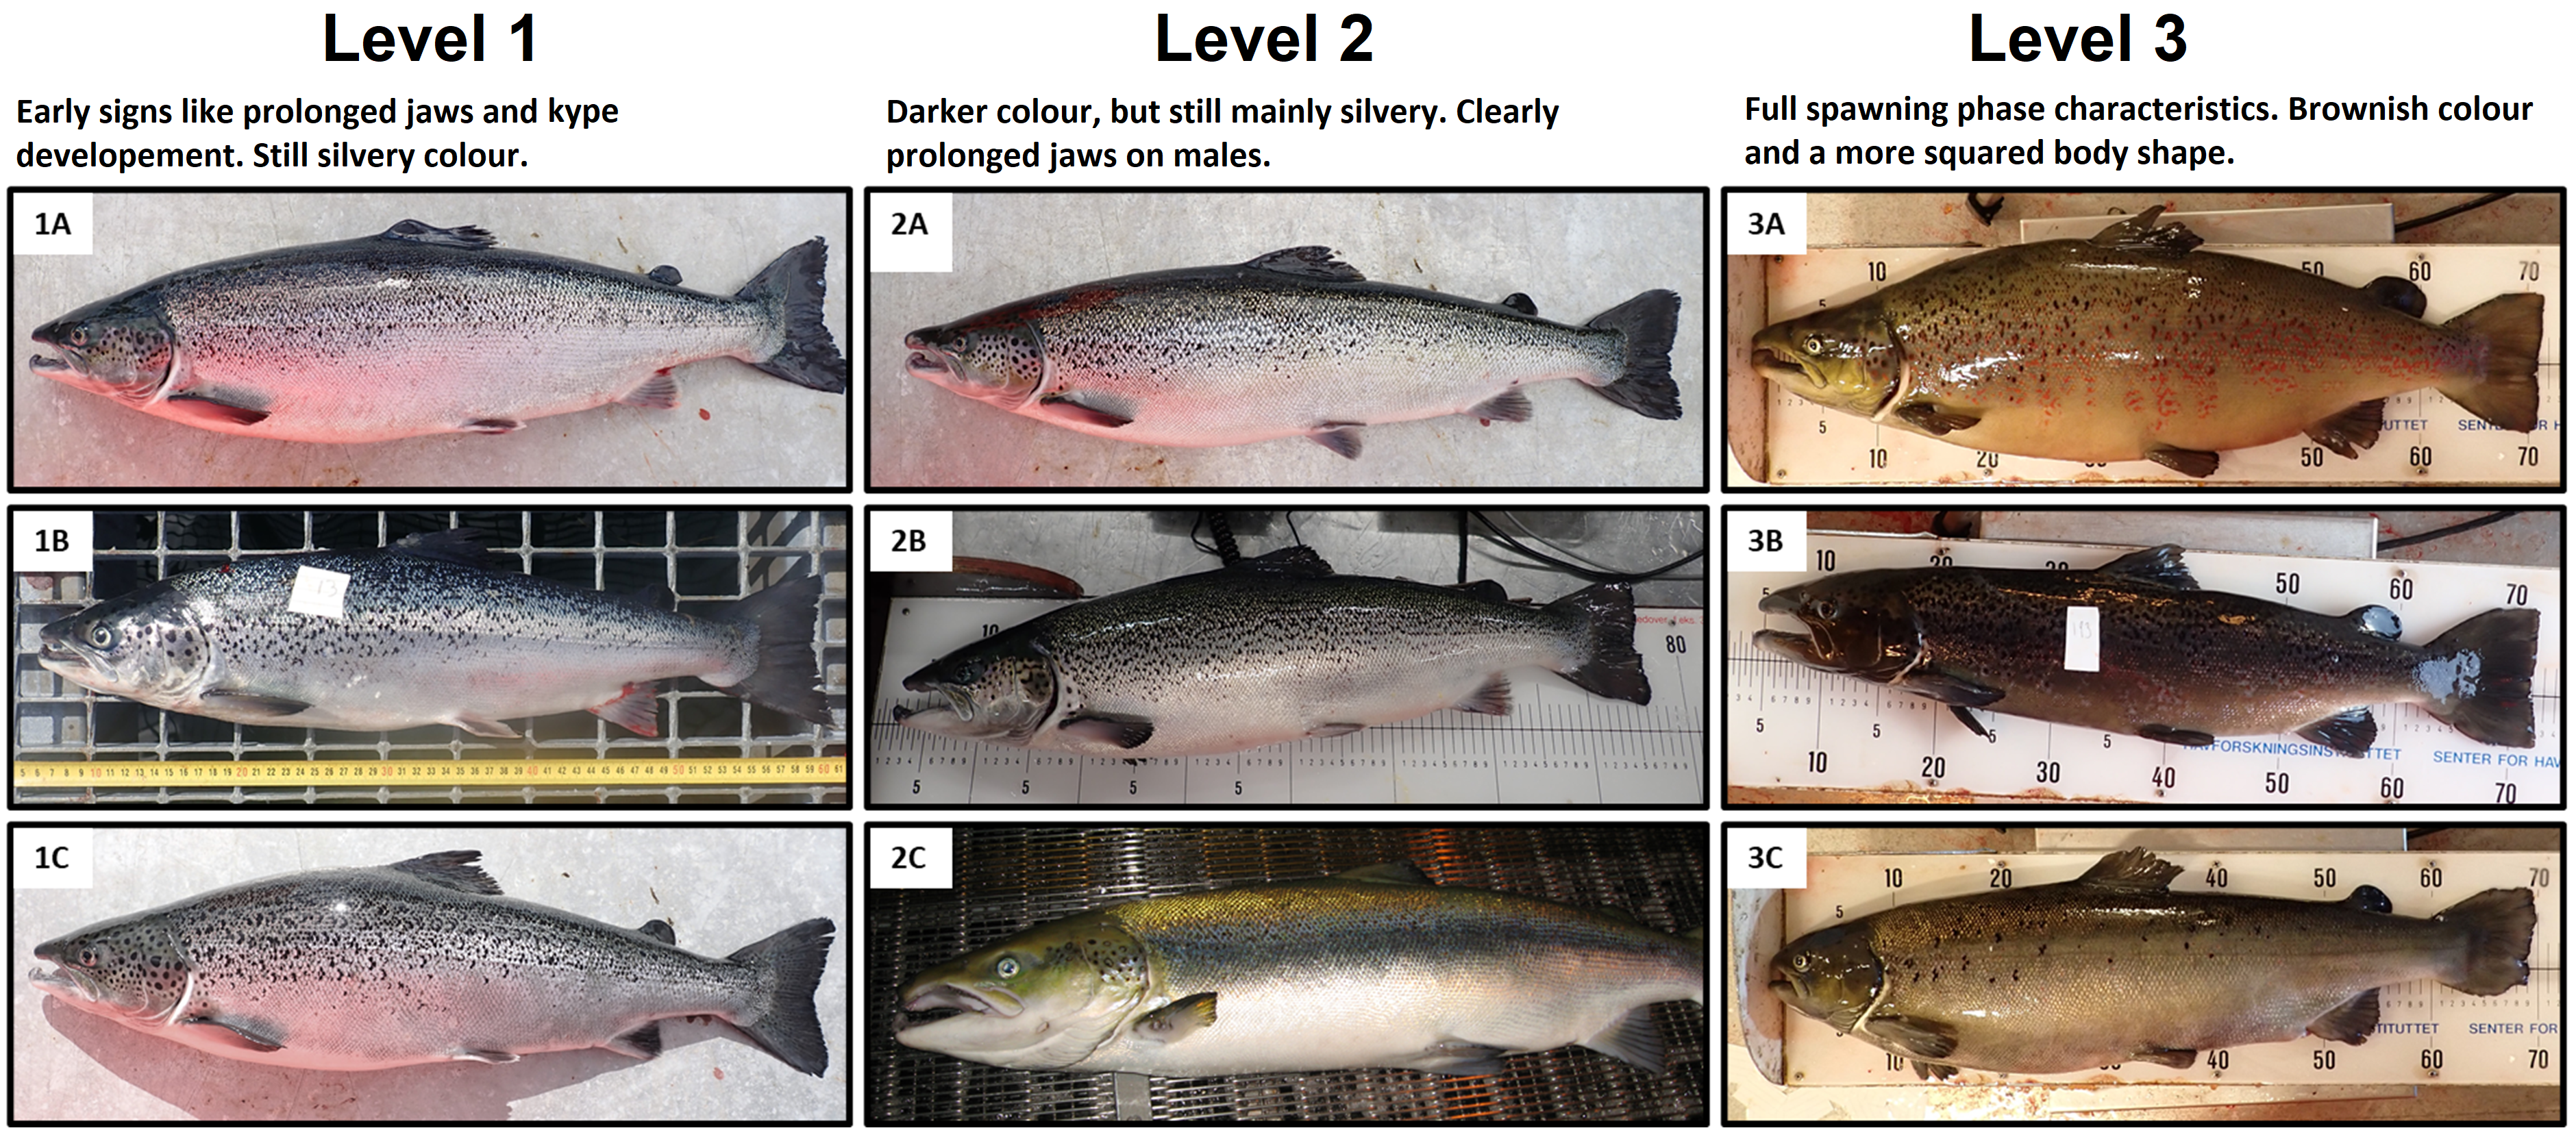
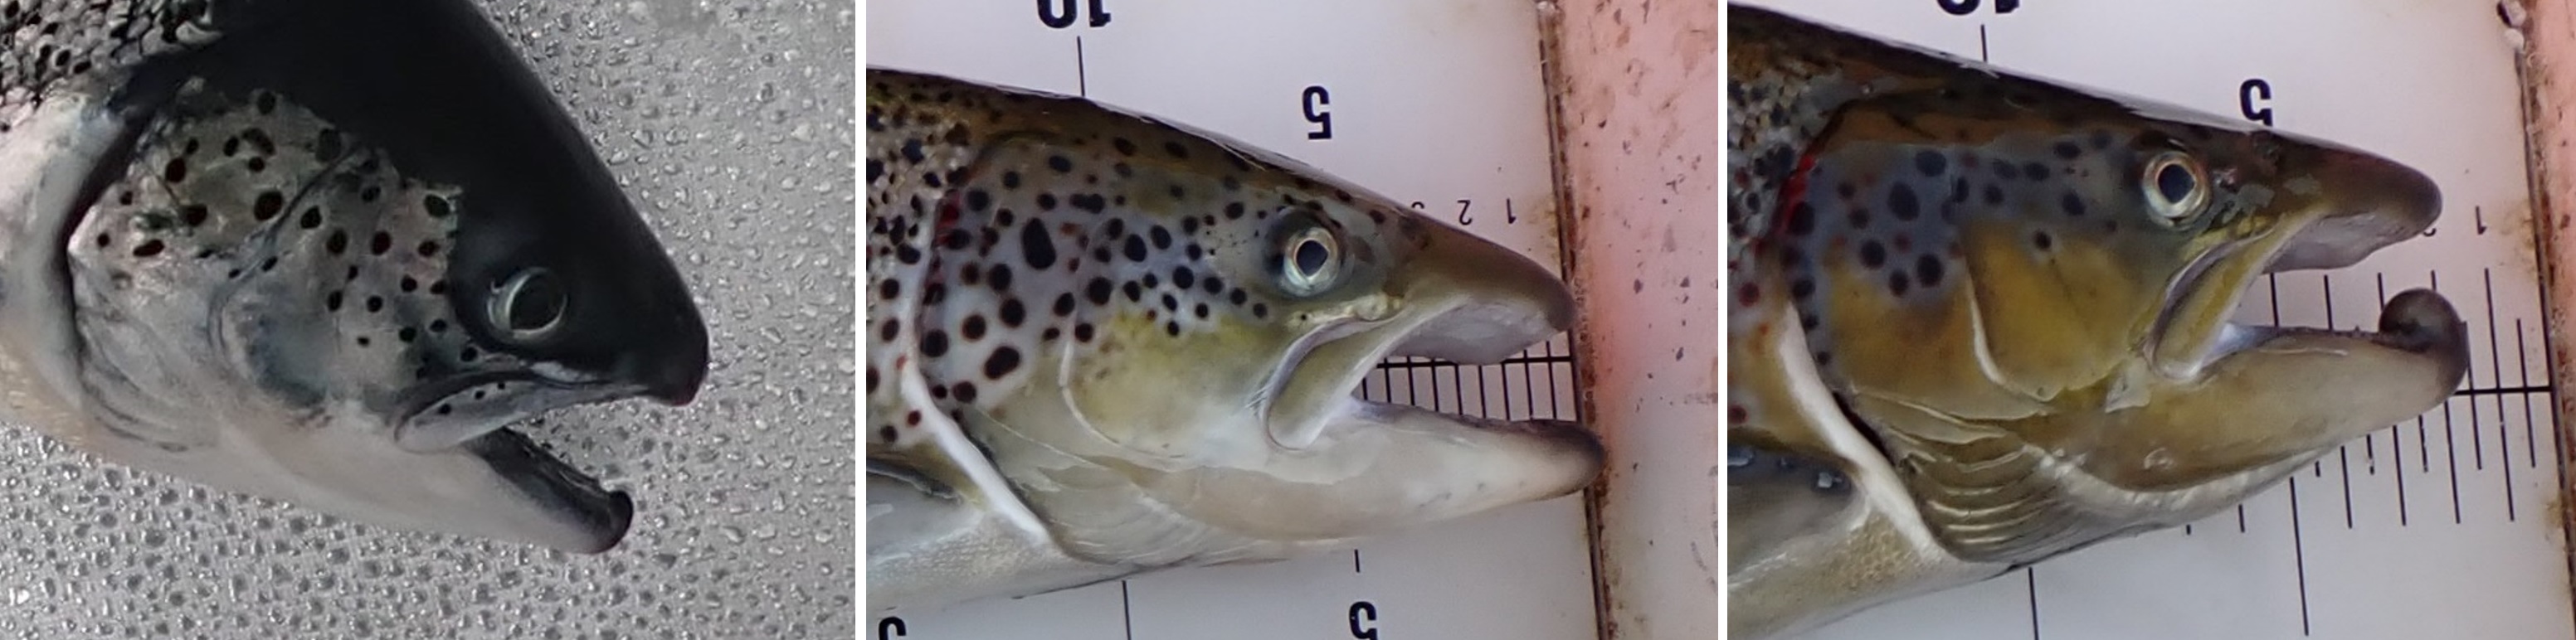
7.4 - Sexual maturation
It is primarily males that become sexually mature in sea cages, although maturation does also occur in females. The first external signs of maturation, such as prolonged extended jaws and kype (picture 1A-C, level 1), normally appear in early summer. The front of the lower jaw may thicken in immature salmon, without a clear indication of a kype (see Appendix for picture example). Over the summer, the fish change colour, especially on the upper part of the body, and one observes growth and extension of the jaws (picture 2A-C, level 2). In the autumn, they become fully mature, develop a brownish colour and a more thickset body shape with increased cranio-dorsal body mass (picture 3A-B). Mature females do not have the characteristic jaw morphology, but do exhibit changes in colour and body shape (picture 3C). A fully mature fish is recorded as level 3.
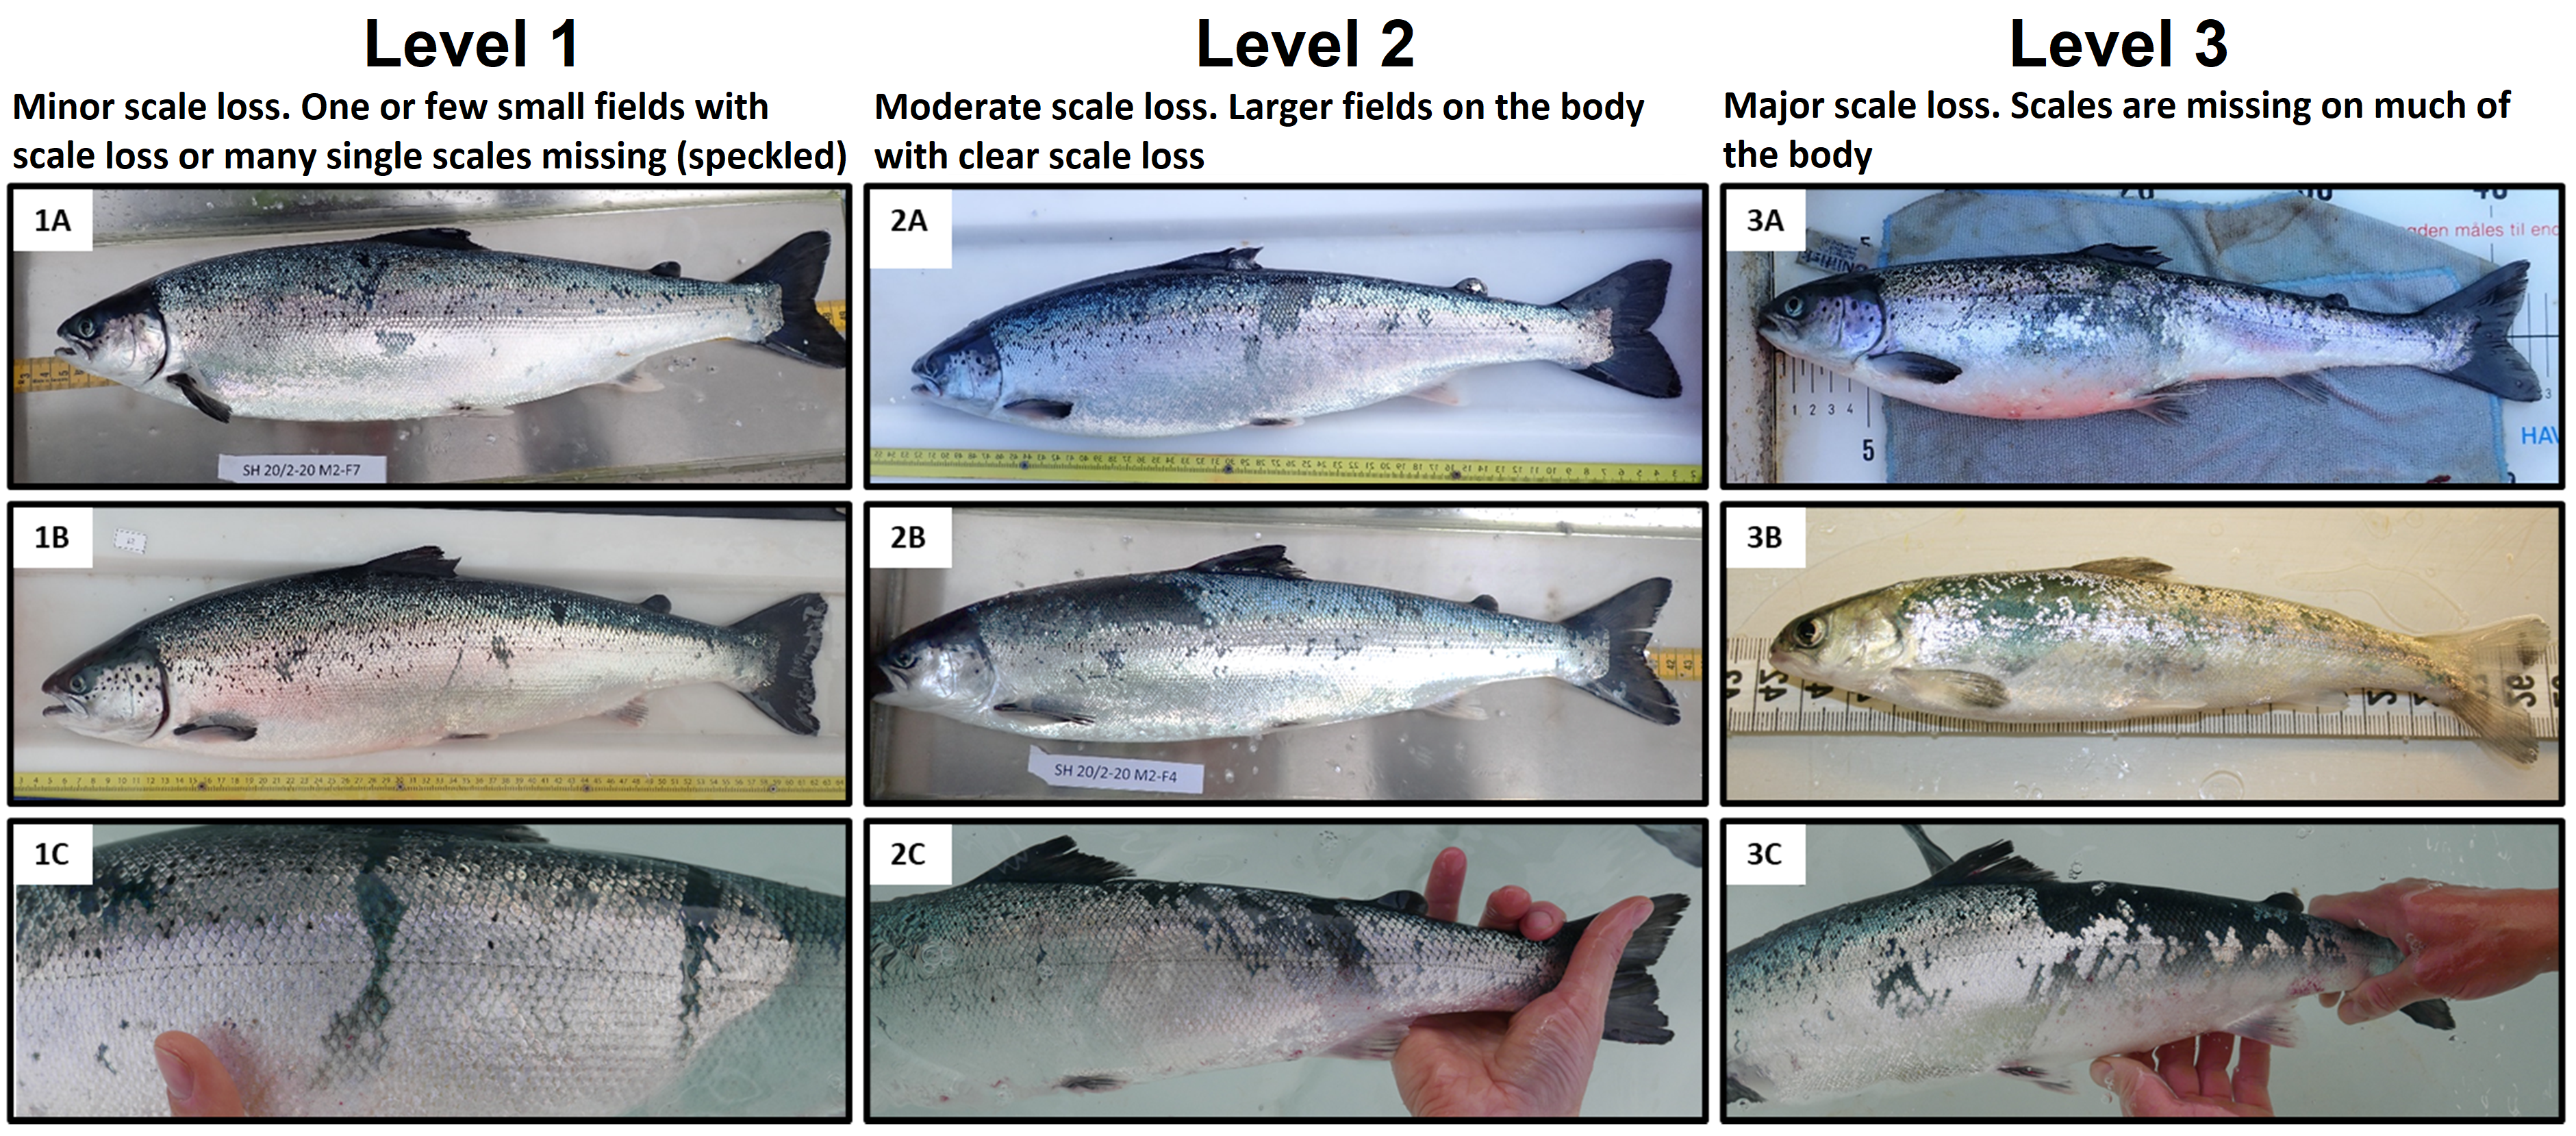
7.5 - Scale loss
Some scale loss can easily occur during netting, sampling and other handling procedures and does not normally have a markedly negative effect on the fish. Scale loss that only includes a few individual scales is therefore recorded as level 0. Loss of many individual scales or one or two small areas of scale loss (picture 1A-1C) are recorded as level 1, while several small or larger areas, but without the scale loss dominating the overall impression of the fish (picture 2A-2C), are recorded as level 2. Picture 1C is close to a level 2. Cases where it is clear that the fish has undergone harsh treatment and the visual impression of the fish is dominated by scale loss are recorded as level 3 (picture 3A-3C).
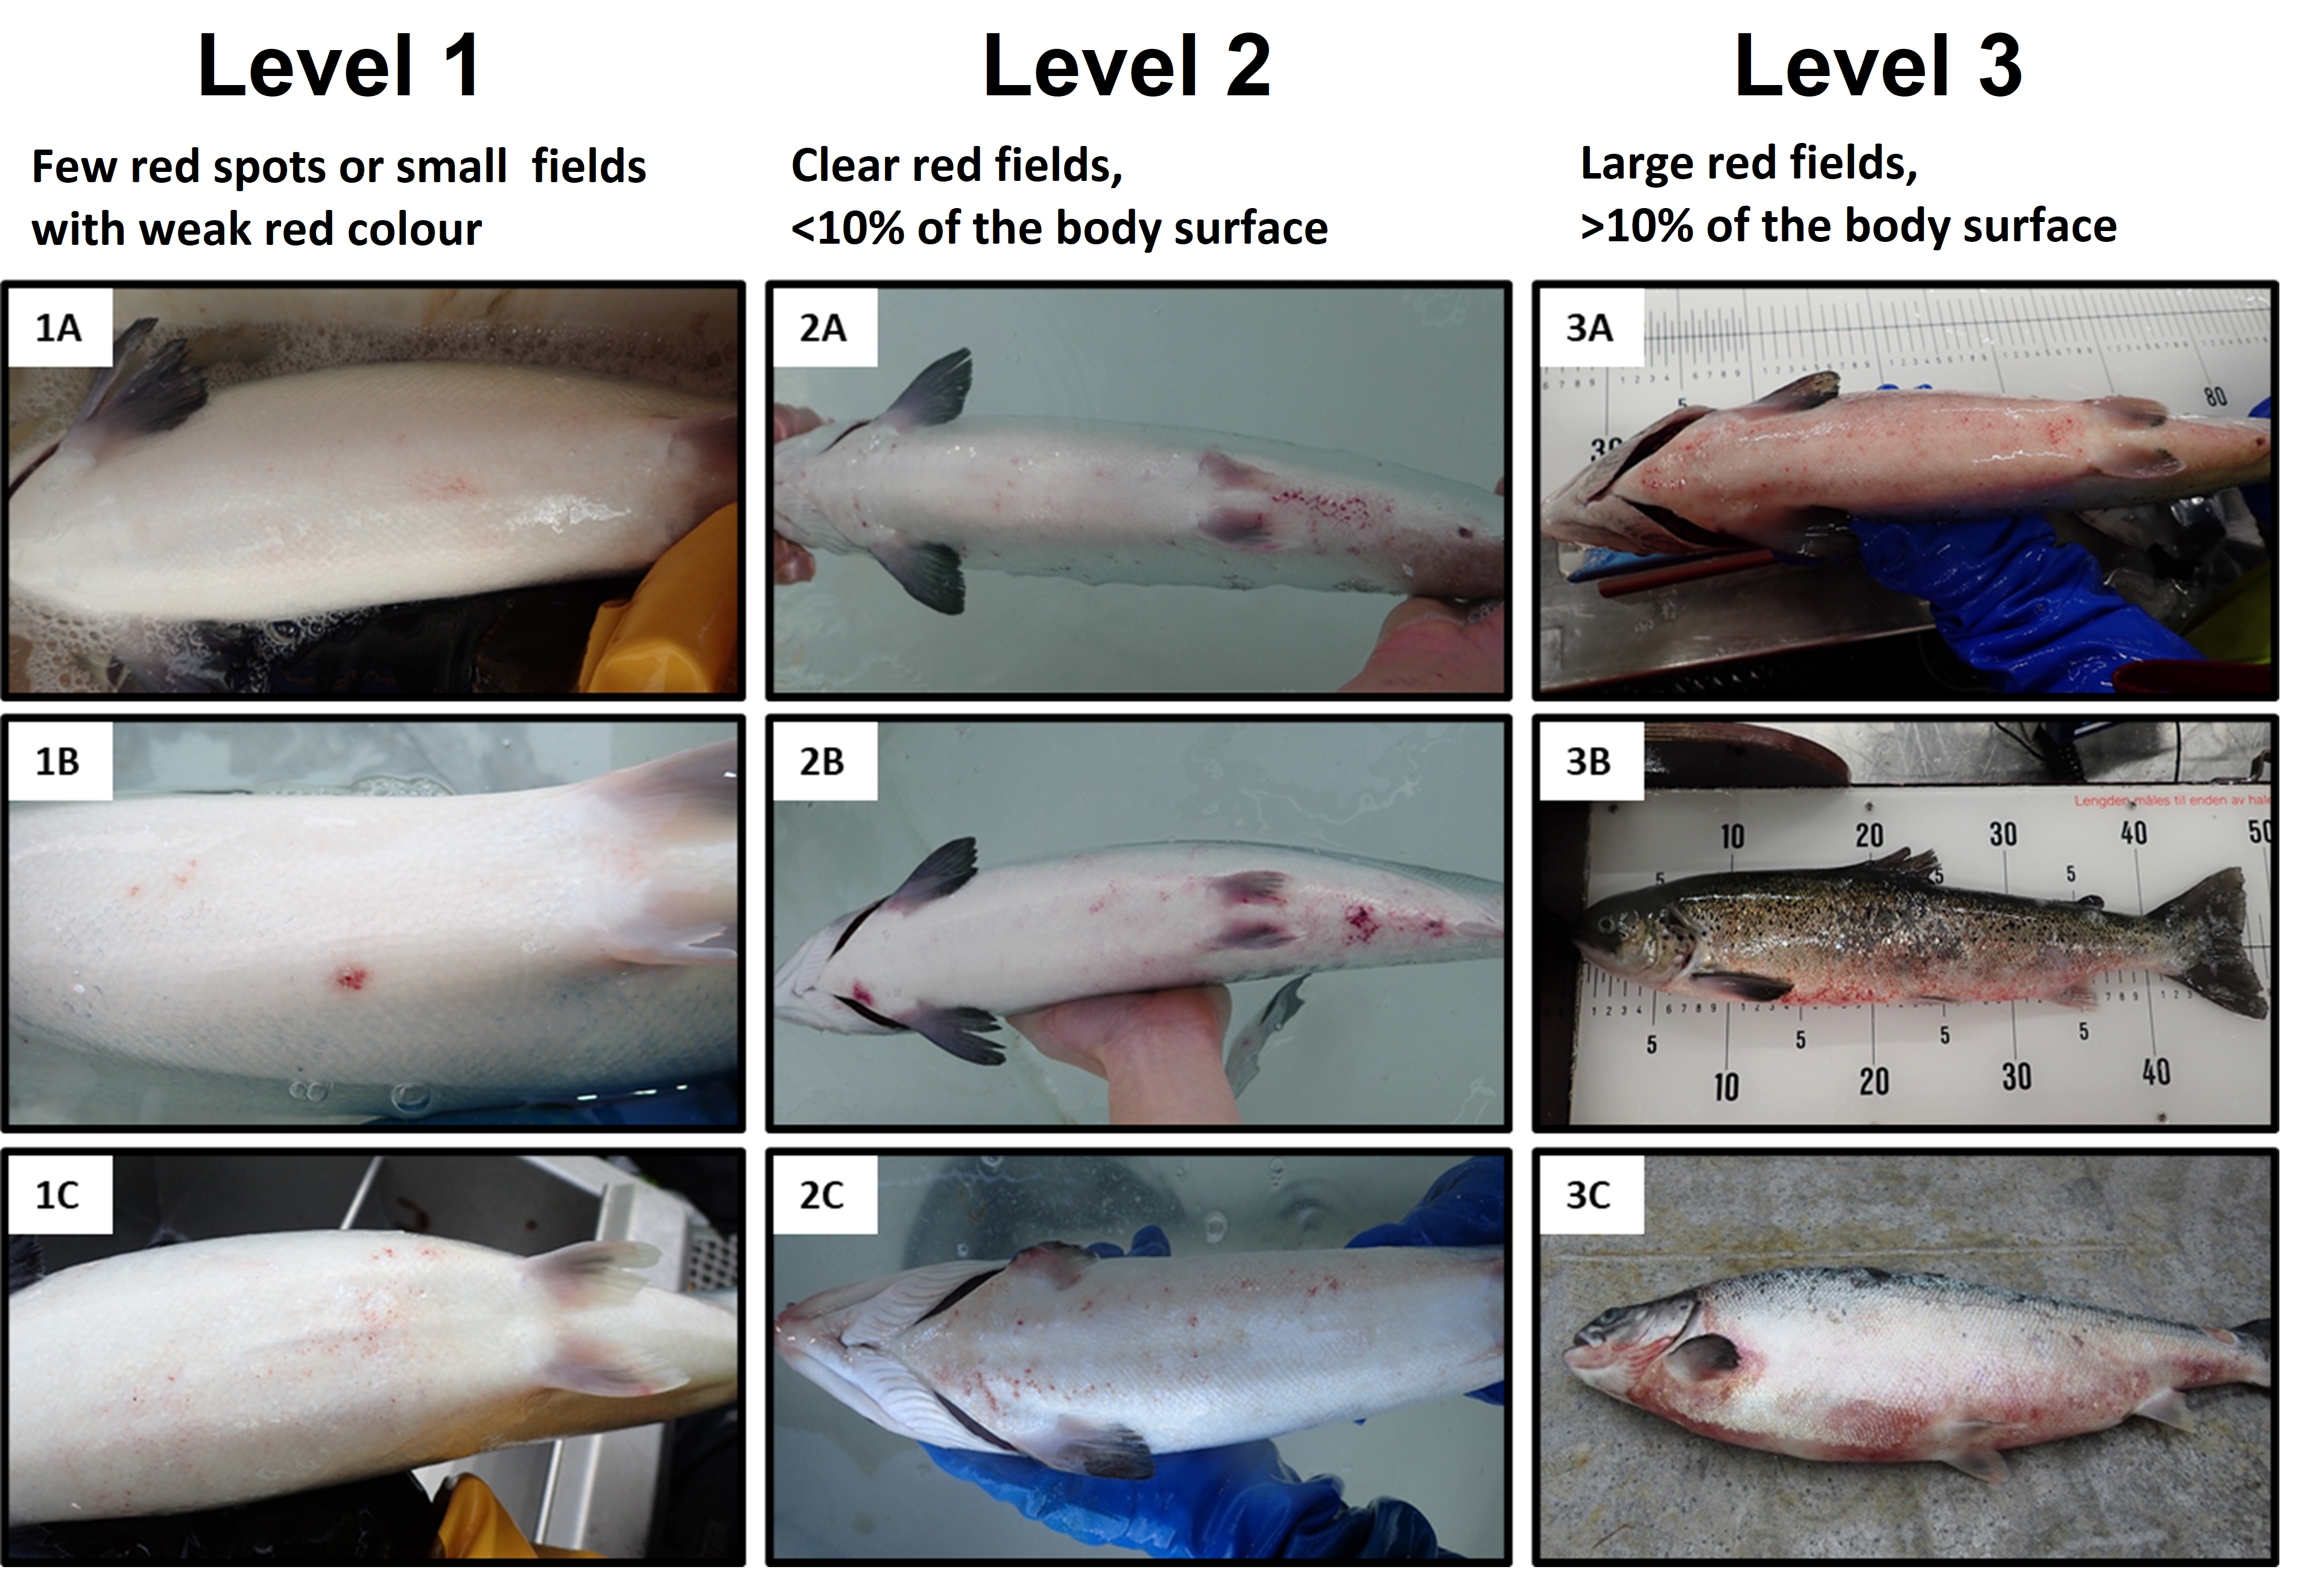
7.6 - Skin haemorrhaging
This section addresses skin haemorrhages on the body, but not to the fin base and fins. Skin haemorrhaging can be caused by handling, collisions or other types of physical contact, salmon lice, and some diseases. Visible red dots (point haemorrhaging, picture 1A-B), which can also be somewhat scattered and appear as weak fields (picture 1C) are recorded as level 1. Clear haemorrhaging that covers a larger area, but not more than 10% of the body surface (picture 2A -C), is recorded as level 2. More pronounced haemorrhaging that covers more than 10% of the body surface (image 3A-C) is recorded as level 3.
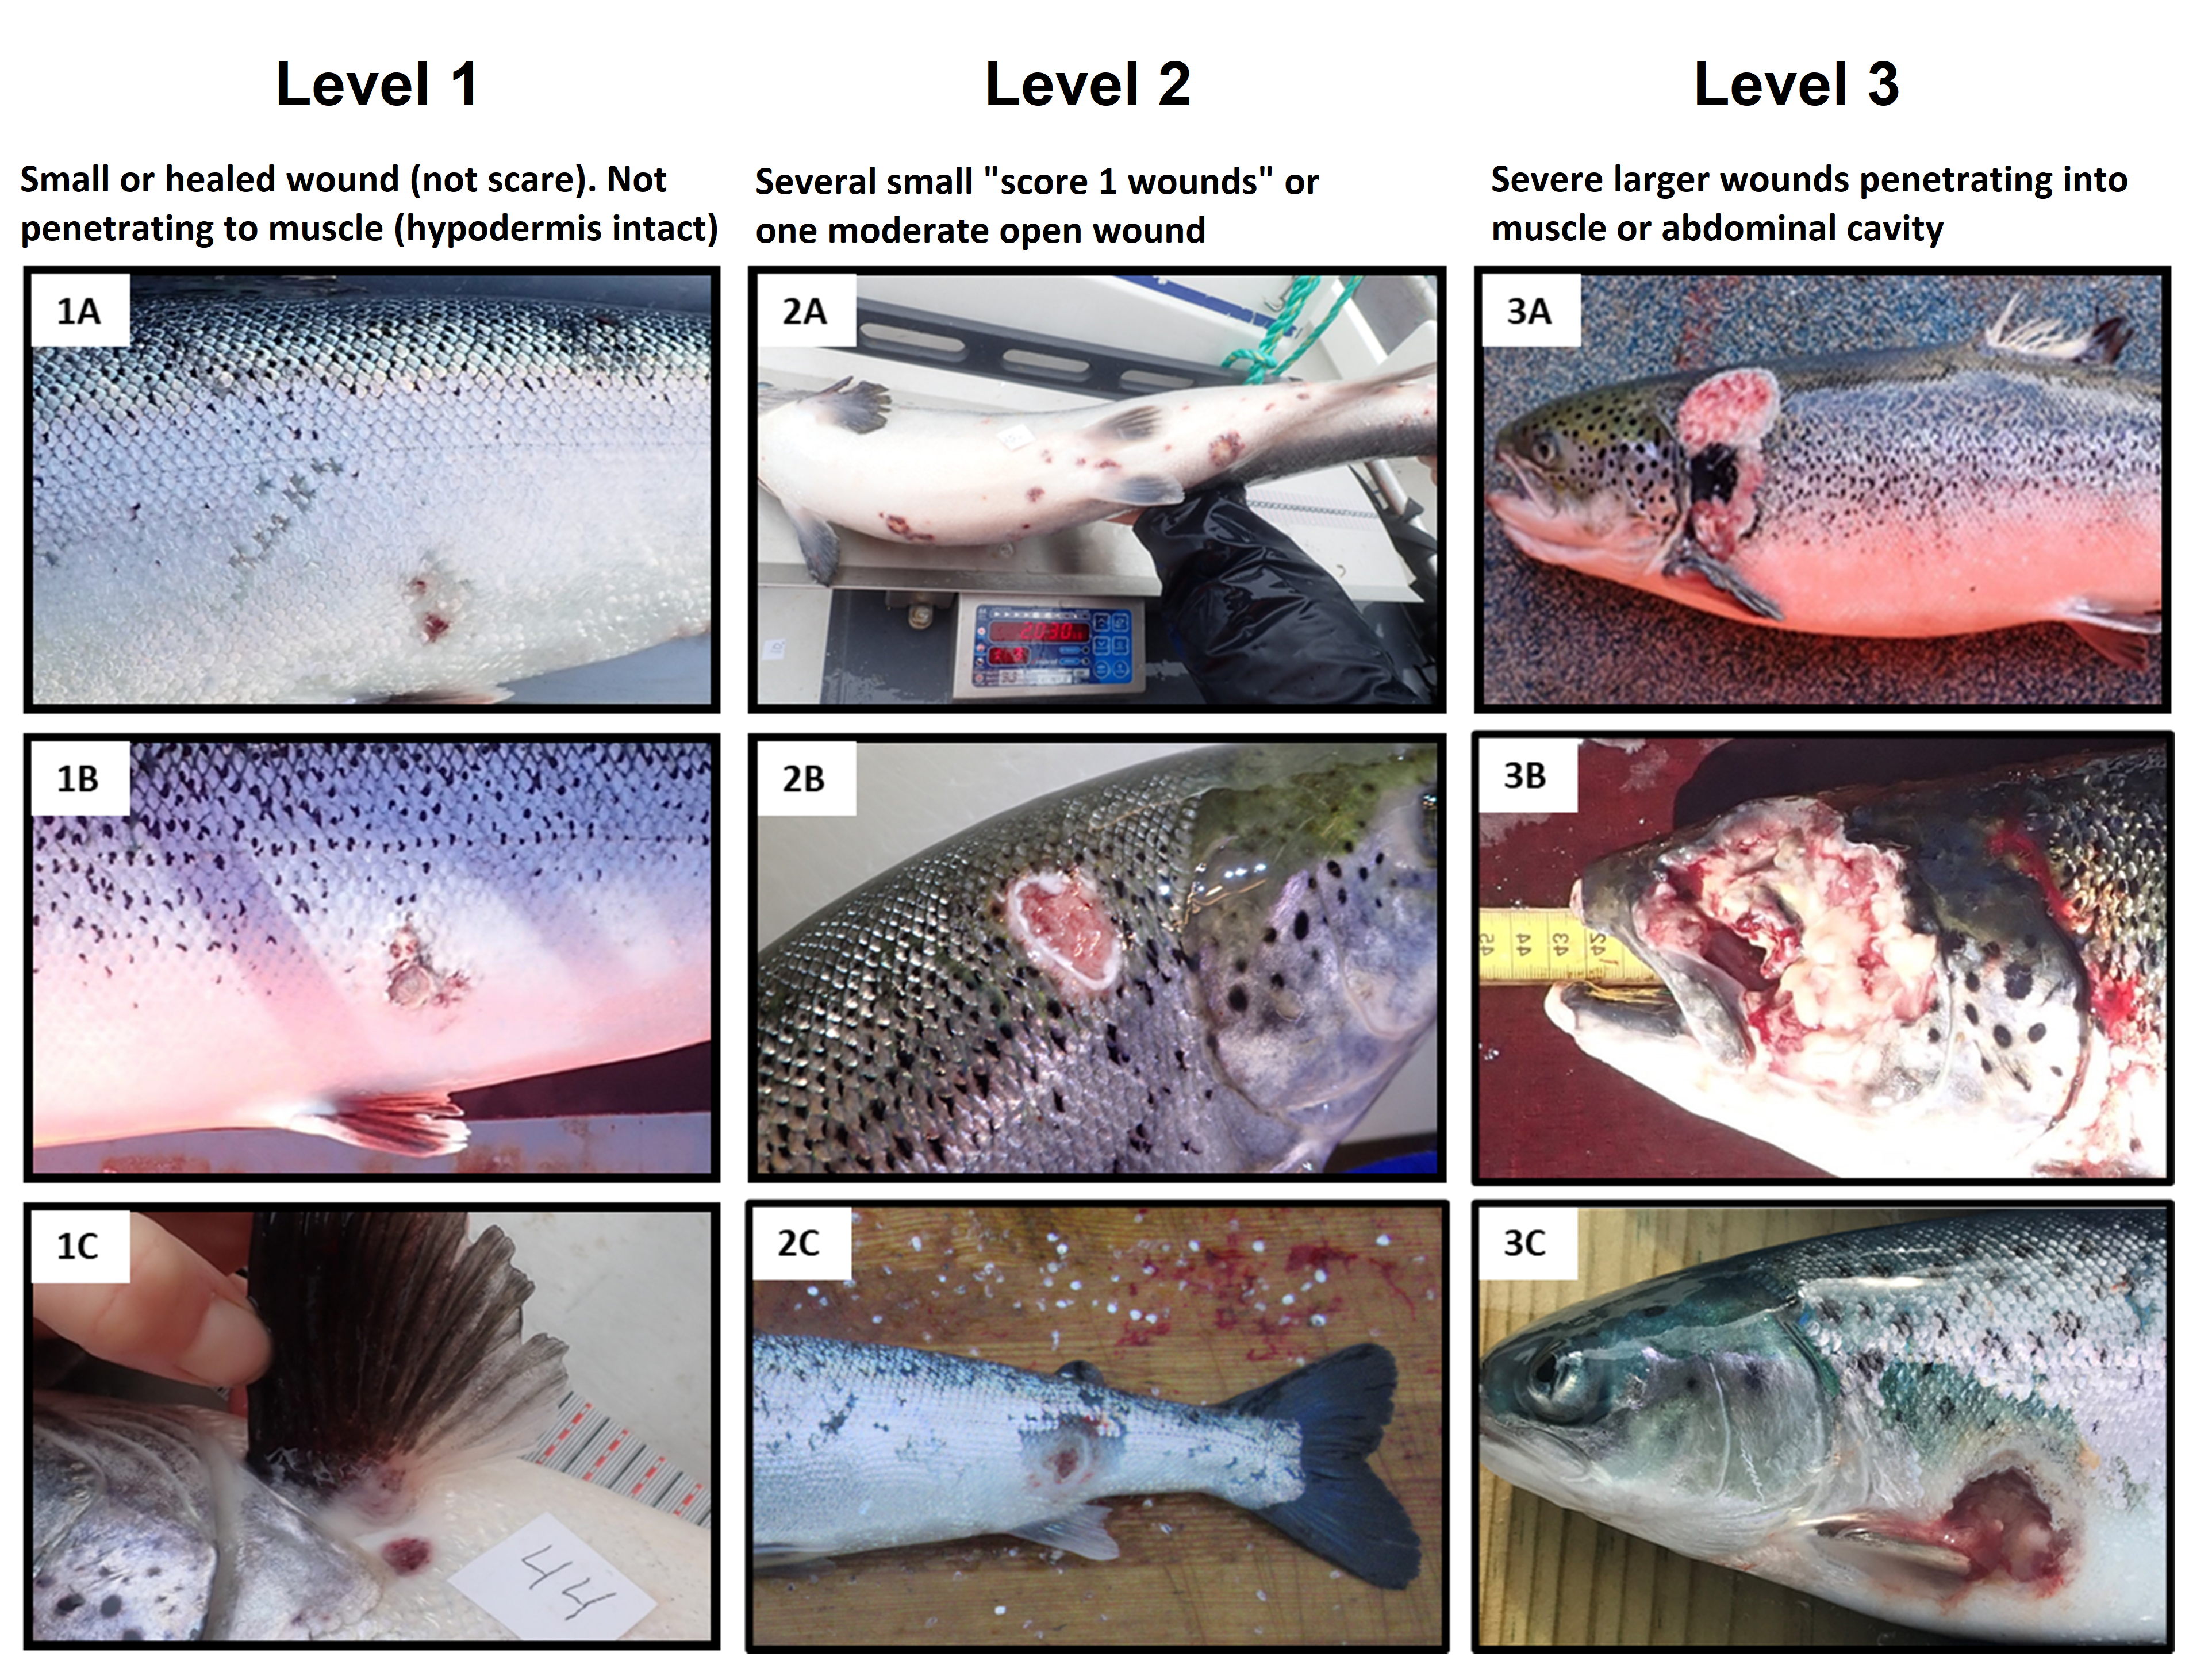
7.7 - Wounds
This section addresses wounds to the body (not snout or fins) including superficial or deeper damage to the epidermis that in some cases leads to exposure of the subcutaneous tissue and musculature.
A small wound that does not penetrate down to the muscle, e.g., where the hypodermis is intact (picture 1A-1C) is recorded as level 1. Several smaller level 1 wounds, or an open wound of small to moderate size (picture 2A-C), is recorded as level 2. Serious wounds, which are often open and expose subcutaneous tissue and muscle (picture 3A-B), are recorded as level 3. Wounds that penetrate into the abdominal cavity (picture 3C) will be classified as serious recorded as level 3, regardless of size.
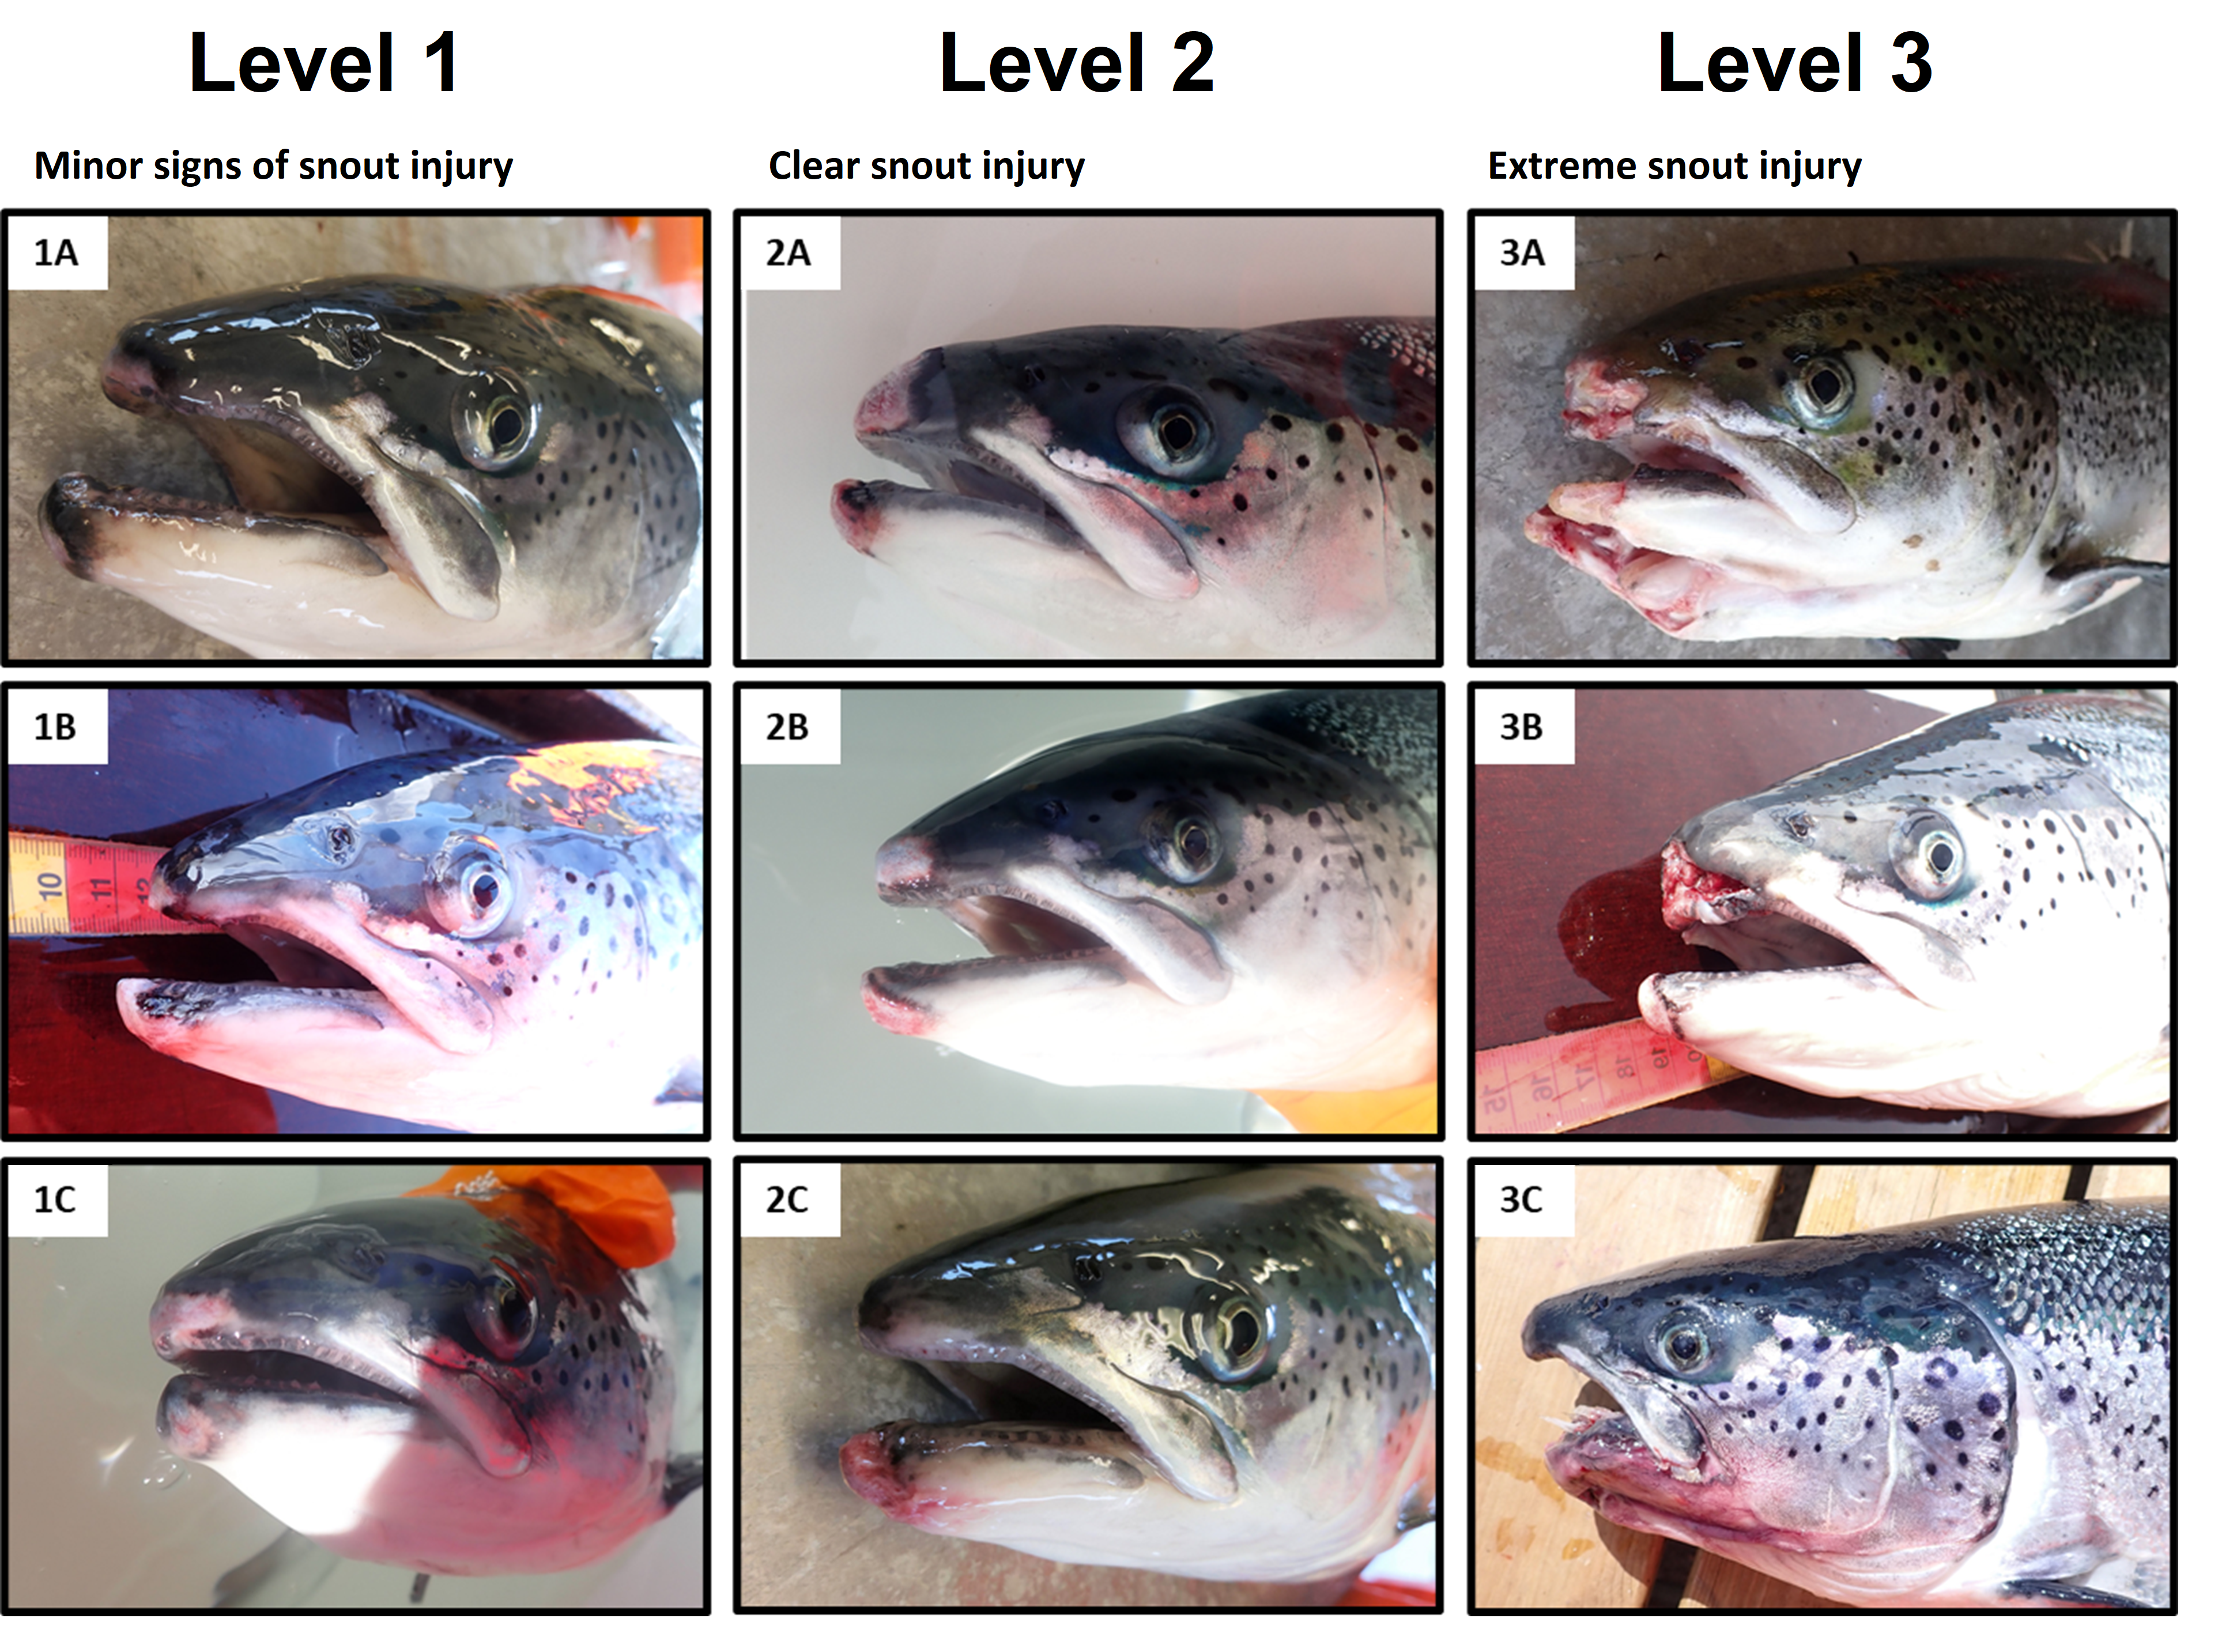
7.8 - Snout damage
Snout injuries are defined as wounds and damage to the snout tip of the jaw, upper jaw, lower jaw or both. The damage can extend backwards and cover a larger area than the snout tip of the jaw. Injuries to the jaw that do not include the tip of at least one of the jaws are recorded as body wounds.
Snout injuries can have various causes, such as mechanical damage after contact with net or equipment, and bacterial infections, and its appearance can vary. Snout injuries that are not open wounds (picture 1A-C) are recorded as level 1. Clear injuries and penetrating wounds that are penetrating or that cover a large area (picture 2A-C) are recorded as level 2. Large injuries that cover a large area and/or are deep enough for the bone to be exposed (picture 3A-C) are recorded as level 3.
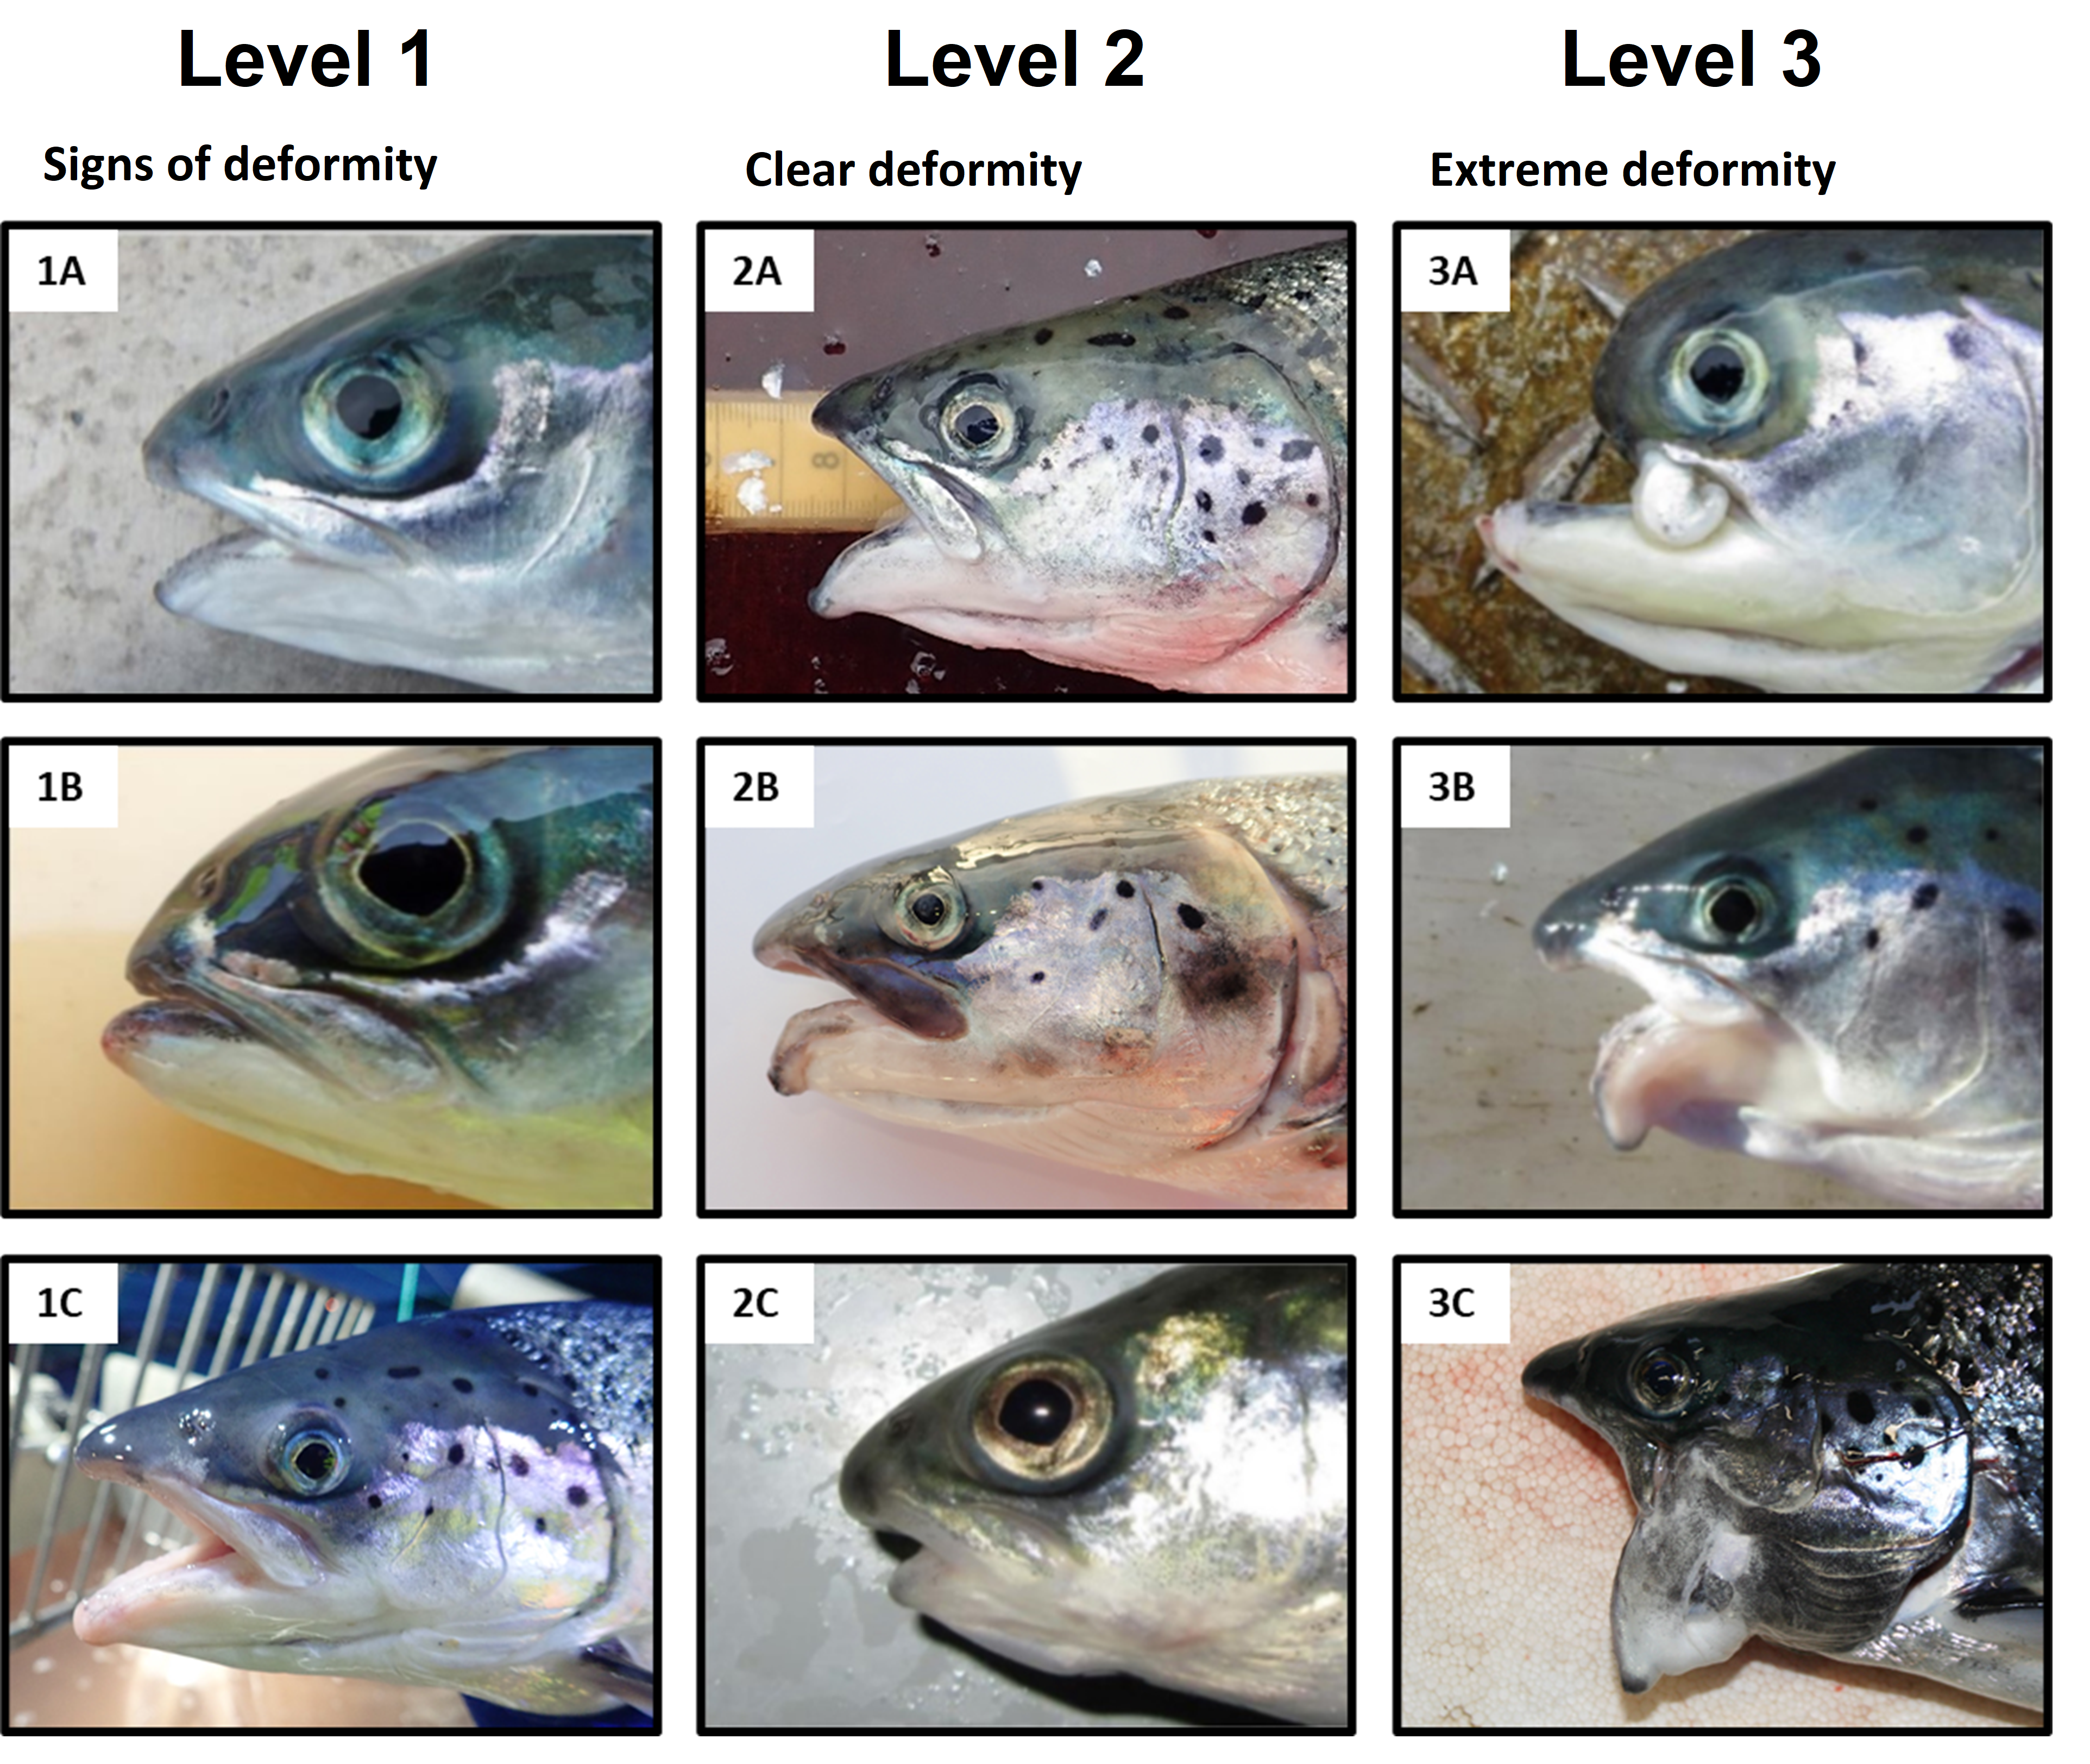
7.9 - Jaw deformities
Jaw deformities can occur to both the upper (pictures 1B and 3A) and lower jaw (remaining pictures). The deformities can vary from barely visible to extreme. Minor deviations (picture 1A-C) are recorded as level 1, clear deviations but where the fish is largely able to eat and grow normally (picture 2A-C) are recorded as level 2, and extreme deformities that may affect respiration and/or the fish's ability to eat (picture 3A-C) are recorded as level 3.
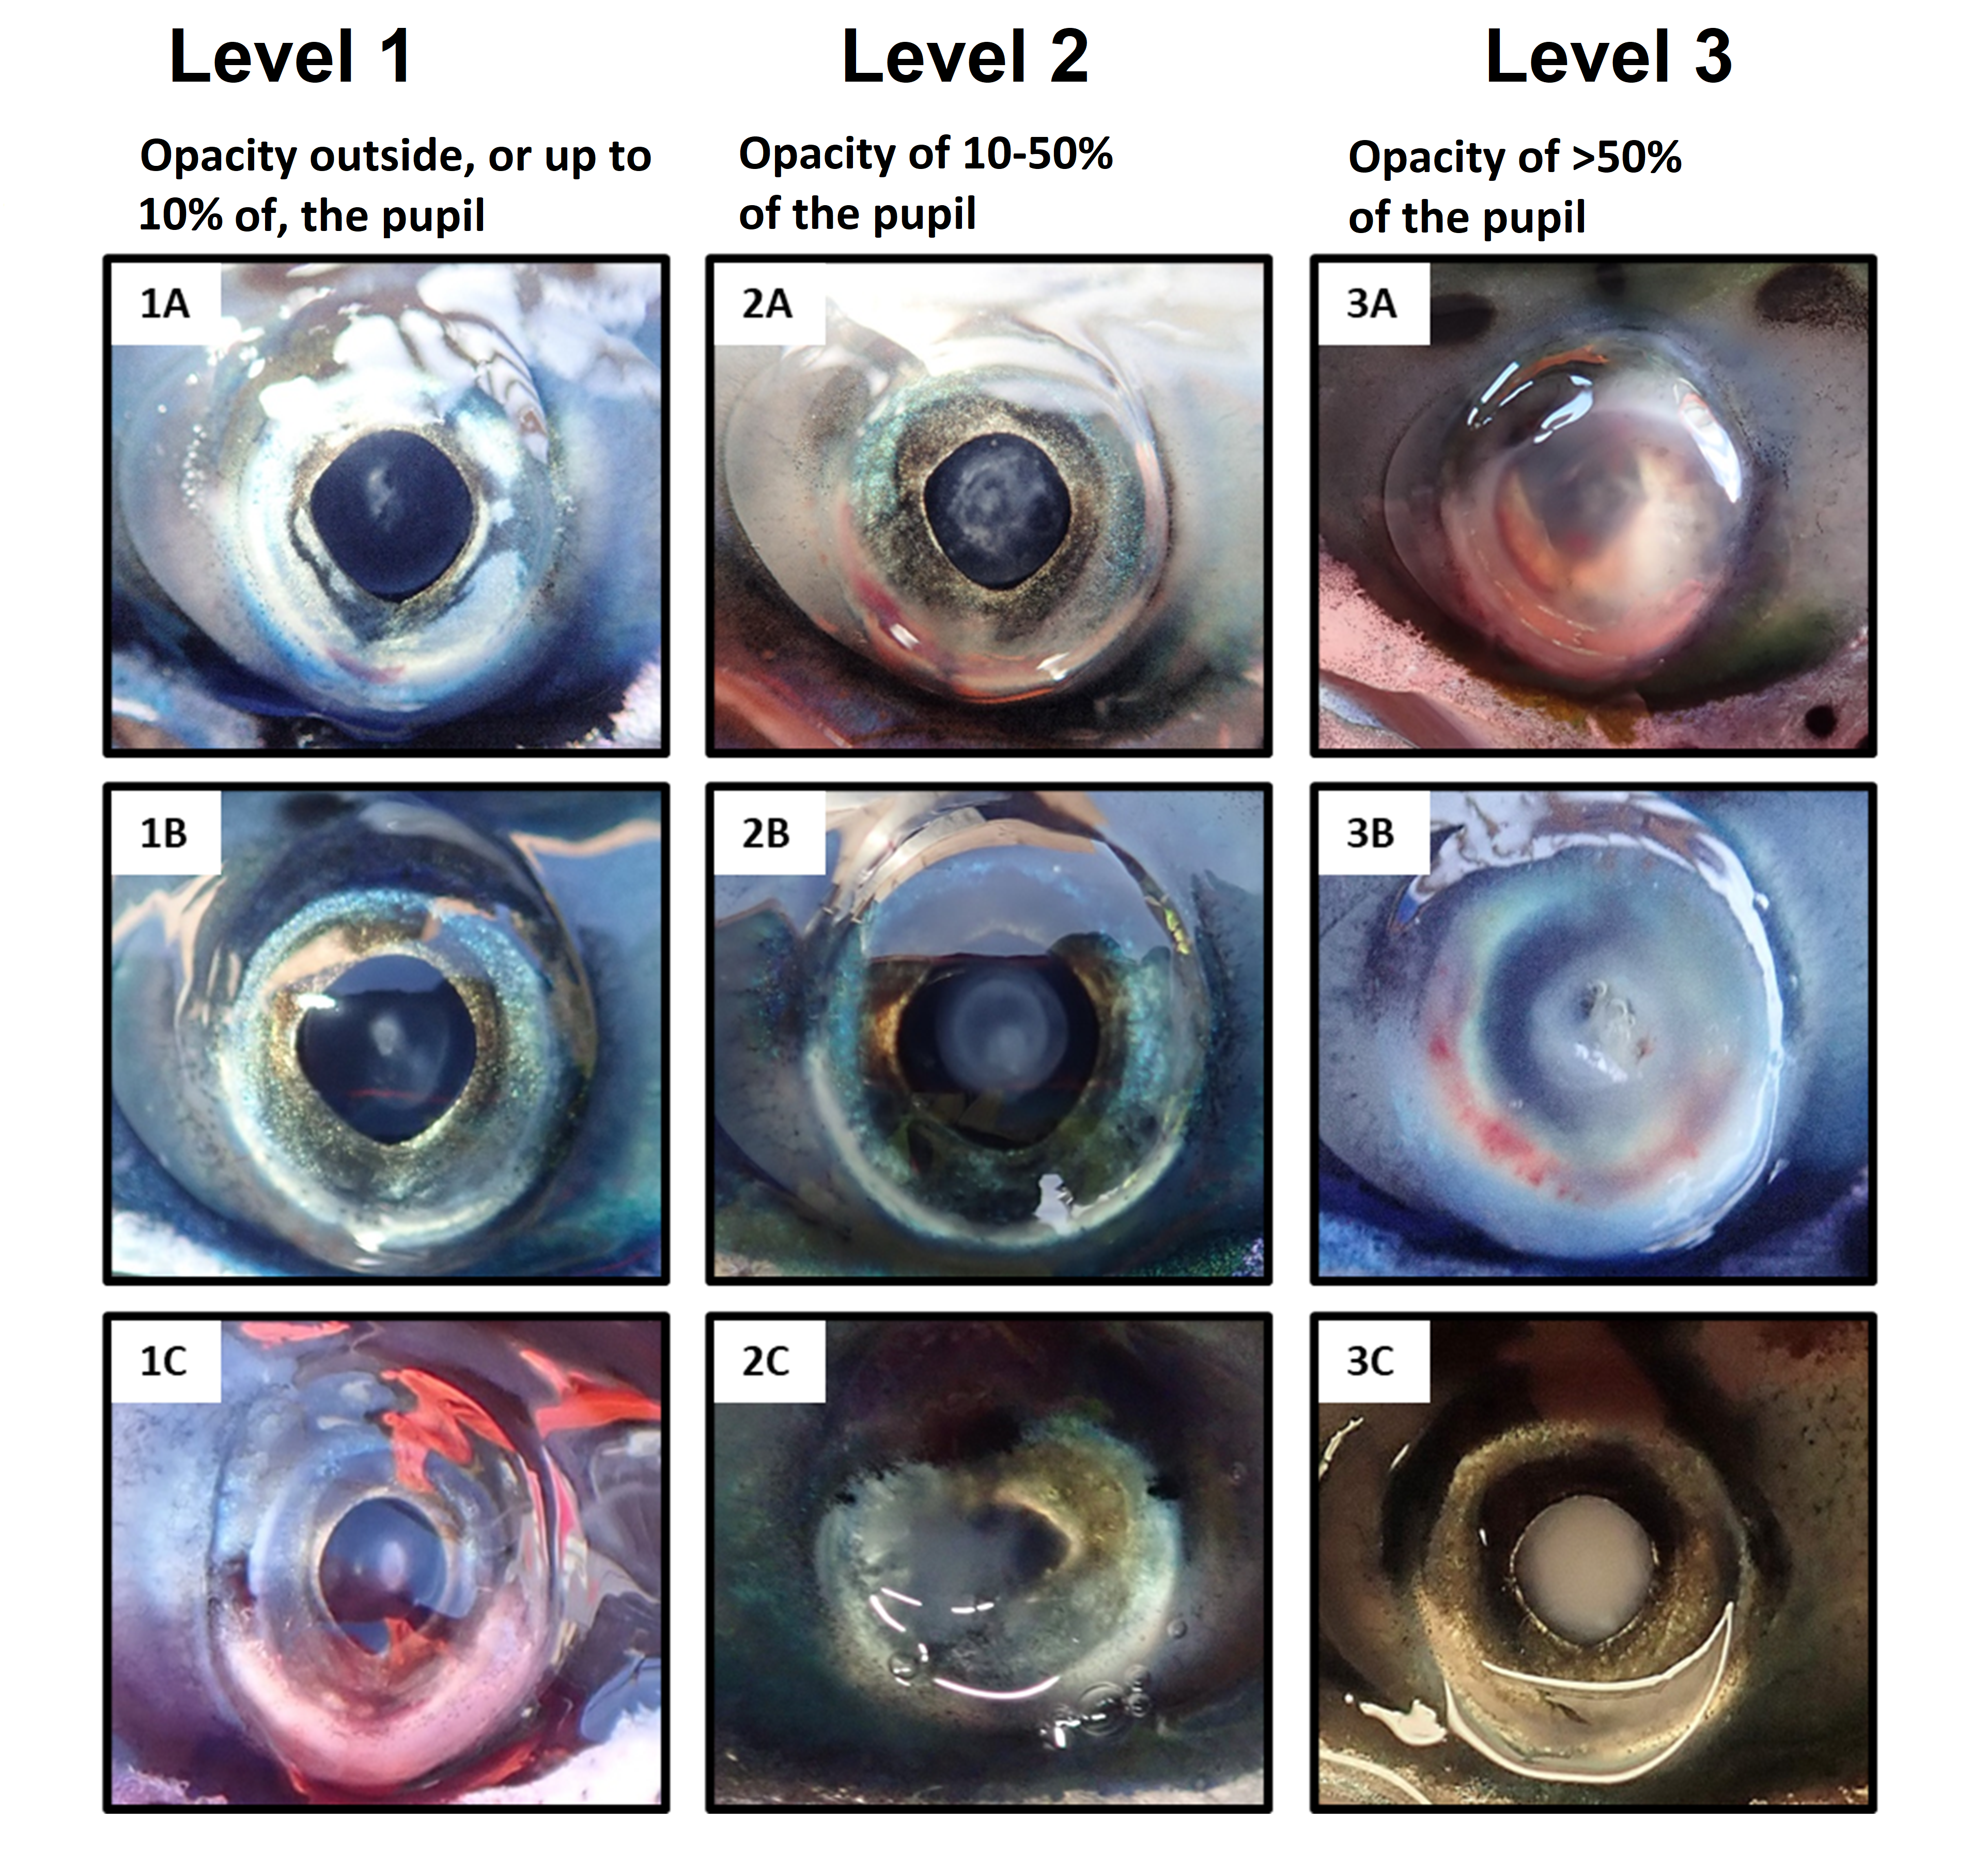
7.10 - Eye opacity
Eye opacity is recorded in relation to the eye with the most damage.
Eye opacity of the eye can have different causes and can vary in its appearance. A common cause of clouding of the eye opacity is cataract, where the lens becomes partially or completely opaque (pictures 1A-C, 2A-B and 3C). Other causes of eye opacity are e.g., inflammatory changes to the cornea (pictures 2C and 3A) and other types of eye damage (picture 3B). Under practical conditions on the farm in the field, it is not always easy to distinguish between opacity to the lens and the cornea, and all types of opacity of the eye are therefore scored as eye opacity. Opacity outside and/or up to 10% of the pupil (picture 1A-C) is recorded as level 1. Opacity covering 10-50% of the pupil (picture 2A-C) is recorded as level 2, and >50% of the pupil (picture 3A-C) is recorded as level 3.
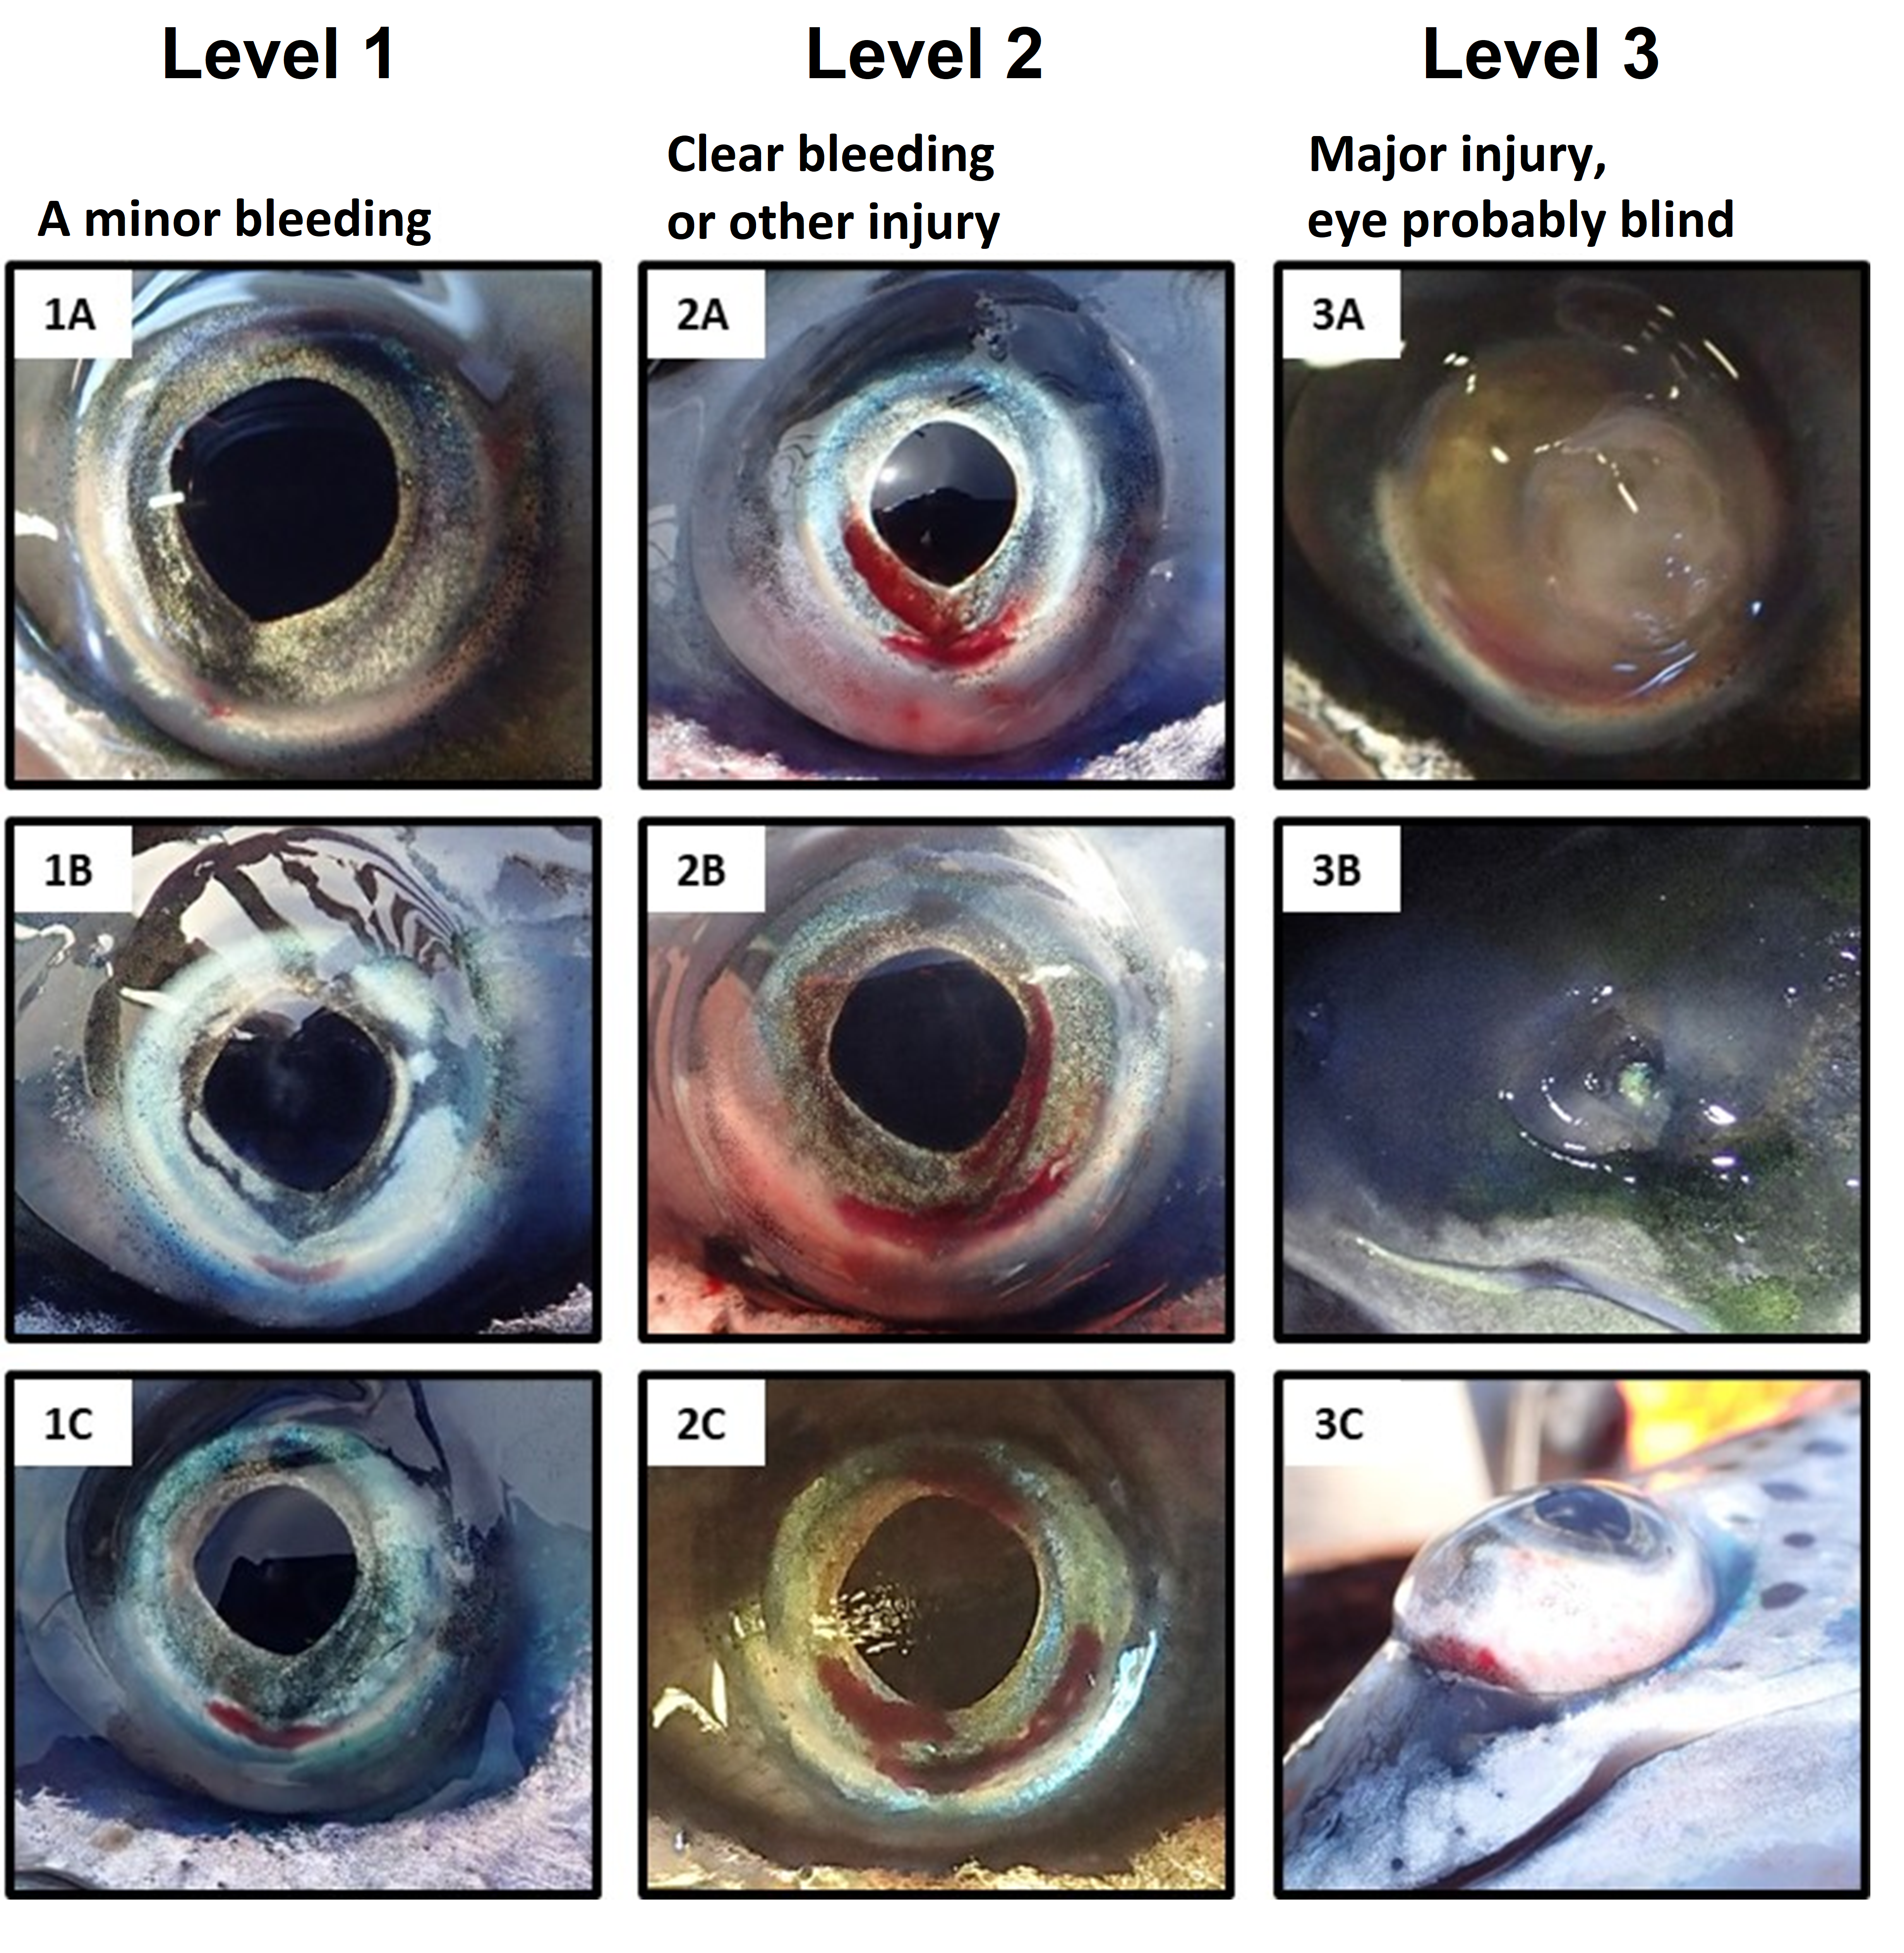
7.11 - Eye injuries
Eye injury is recorded in relation to the eye with the most damage.
Eye injuries can have many causes but are often caused by mechanical impacts during handling, as the fish's protruding eye without a protective eyelid makes it vulnerable. Minor haemorrhaging, often to the lower edge of the eye (picture 1A-C), is recorded as level 1. Clear haemorrhaging that covers a larger part of the eye (picture 2A-C) and other clear eye injuries that are not assumed to lead to blindness, are recorded as level 2. Major injuries that presumably result in blindness, such as a punctured (picture 3A) or very protruding (picture 3C) eye is recorded as level 3.
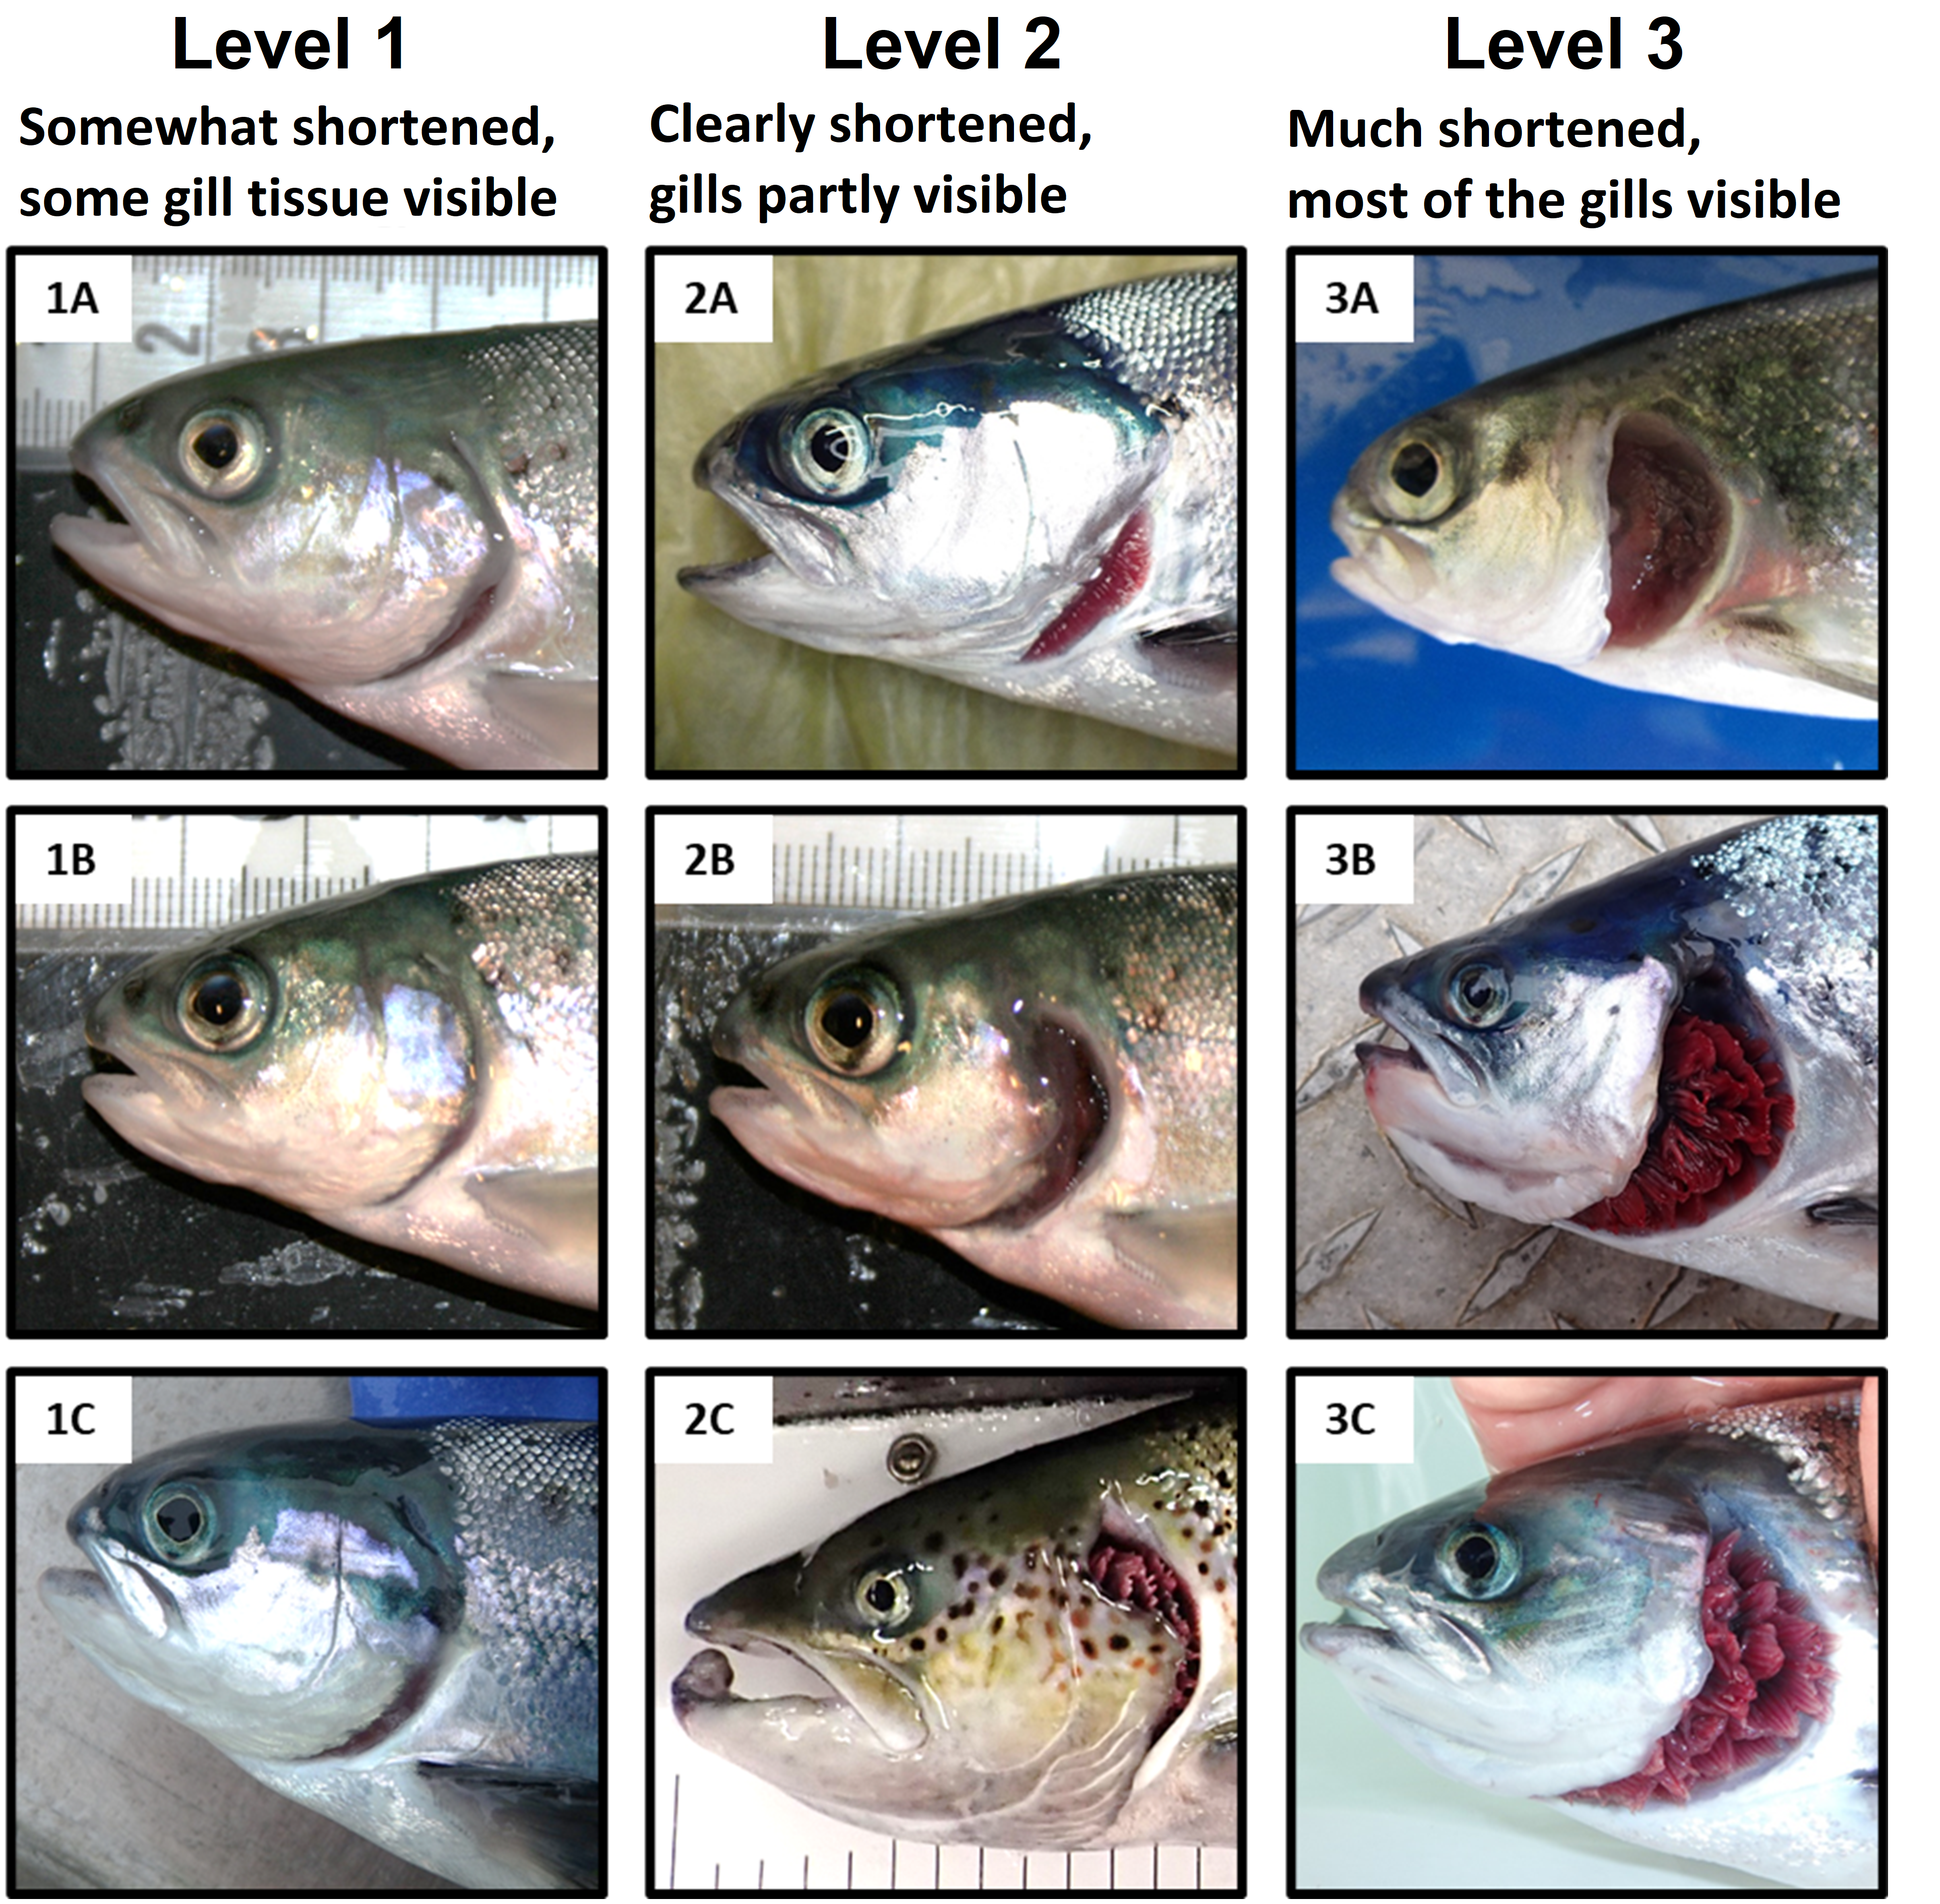
7.12 - Opercular damage
Opercular damage is recorded in relation to the opercula with the most damage.
When scoring the opercula, the head must be held in a natural position to correctly evaluate the extent to which the opercula covers the gills.
Fish can suffer damage to the opercula for various reasons, such as water quality or aggression in the hatchery phase, incomplete growth of the opercula, or mechanical impact where the opercula is damaged or partially broken off (e.g. picture 2C). A slight shortening where the underlying gill tissue is visible (picture 1A-C) is recorded as level 1. A clearly shortened opercula where the gill tissue is clearly visible (picture 2A-C) is recorded as level 2. A markedly shortened opercula where much of the gill is visible (picture 3A-C) is recorded as level 3. At level 3, one will often, but not always see clear damage to the underlying gills.
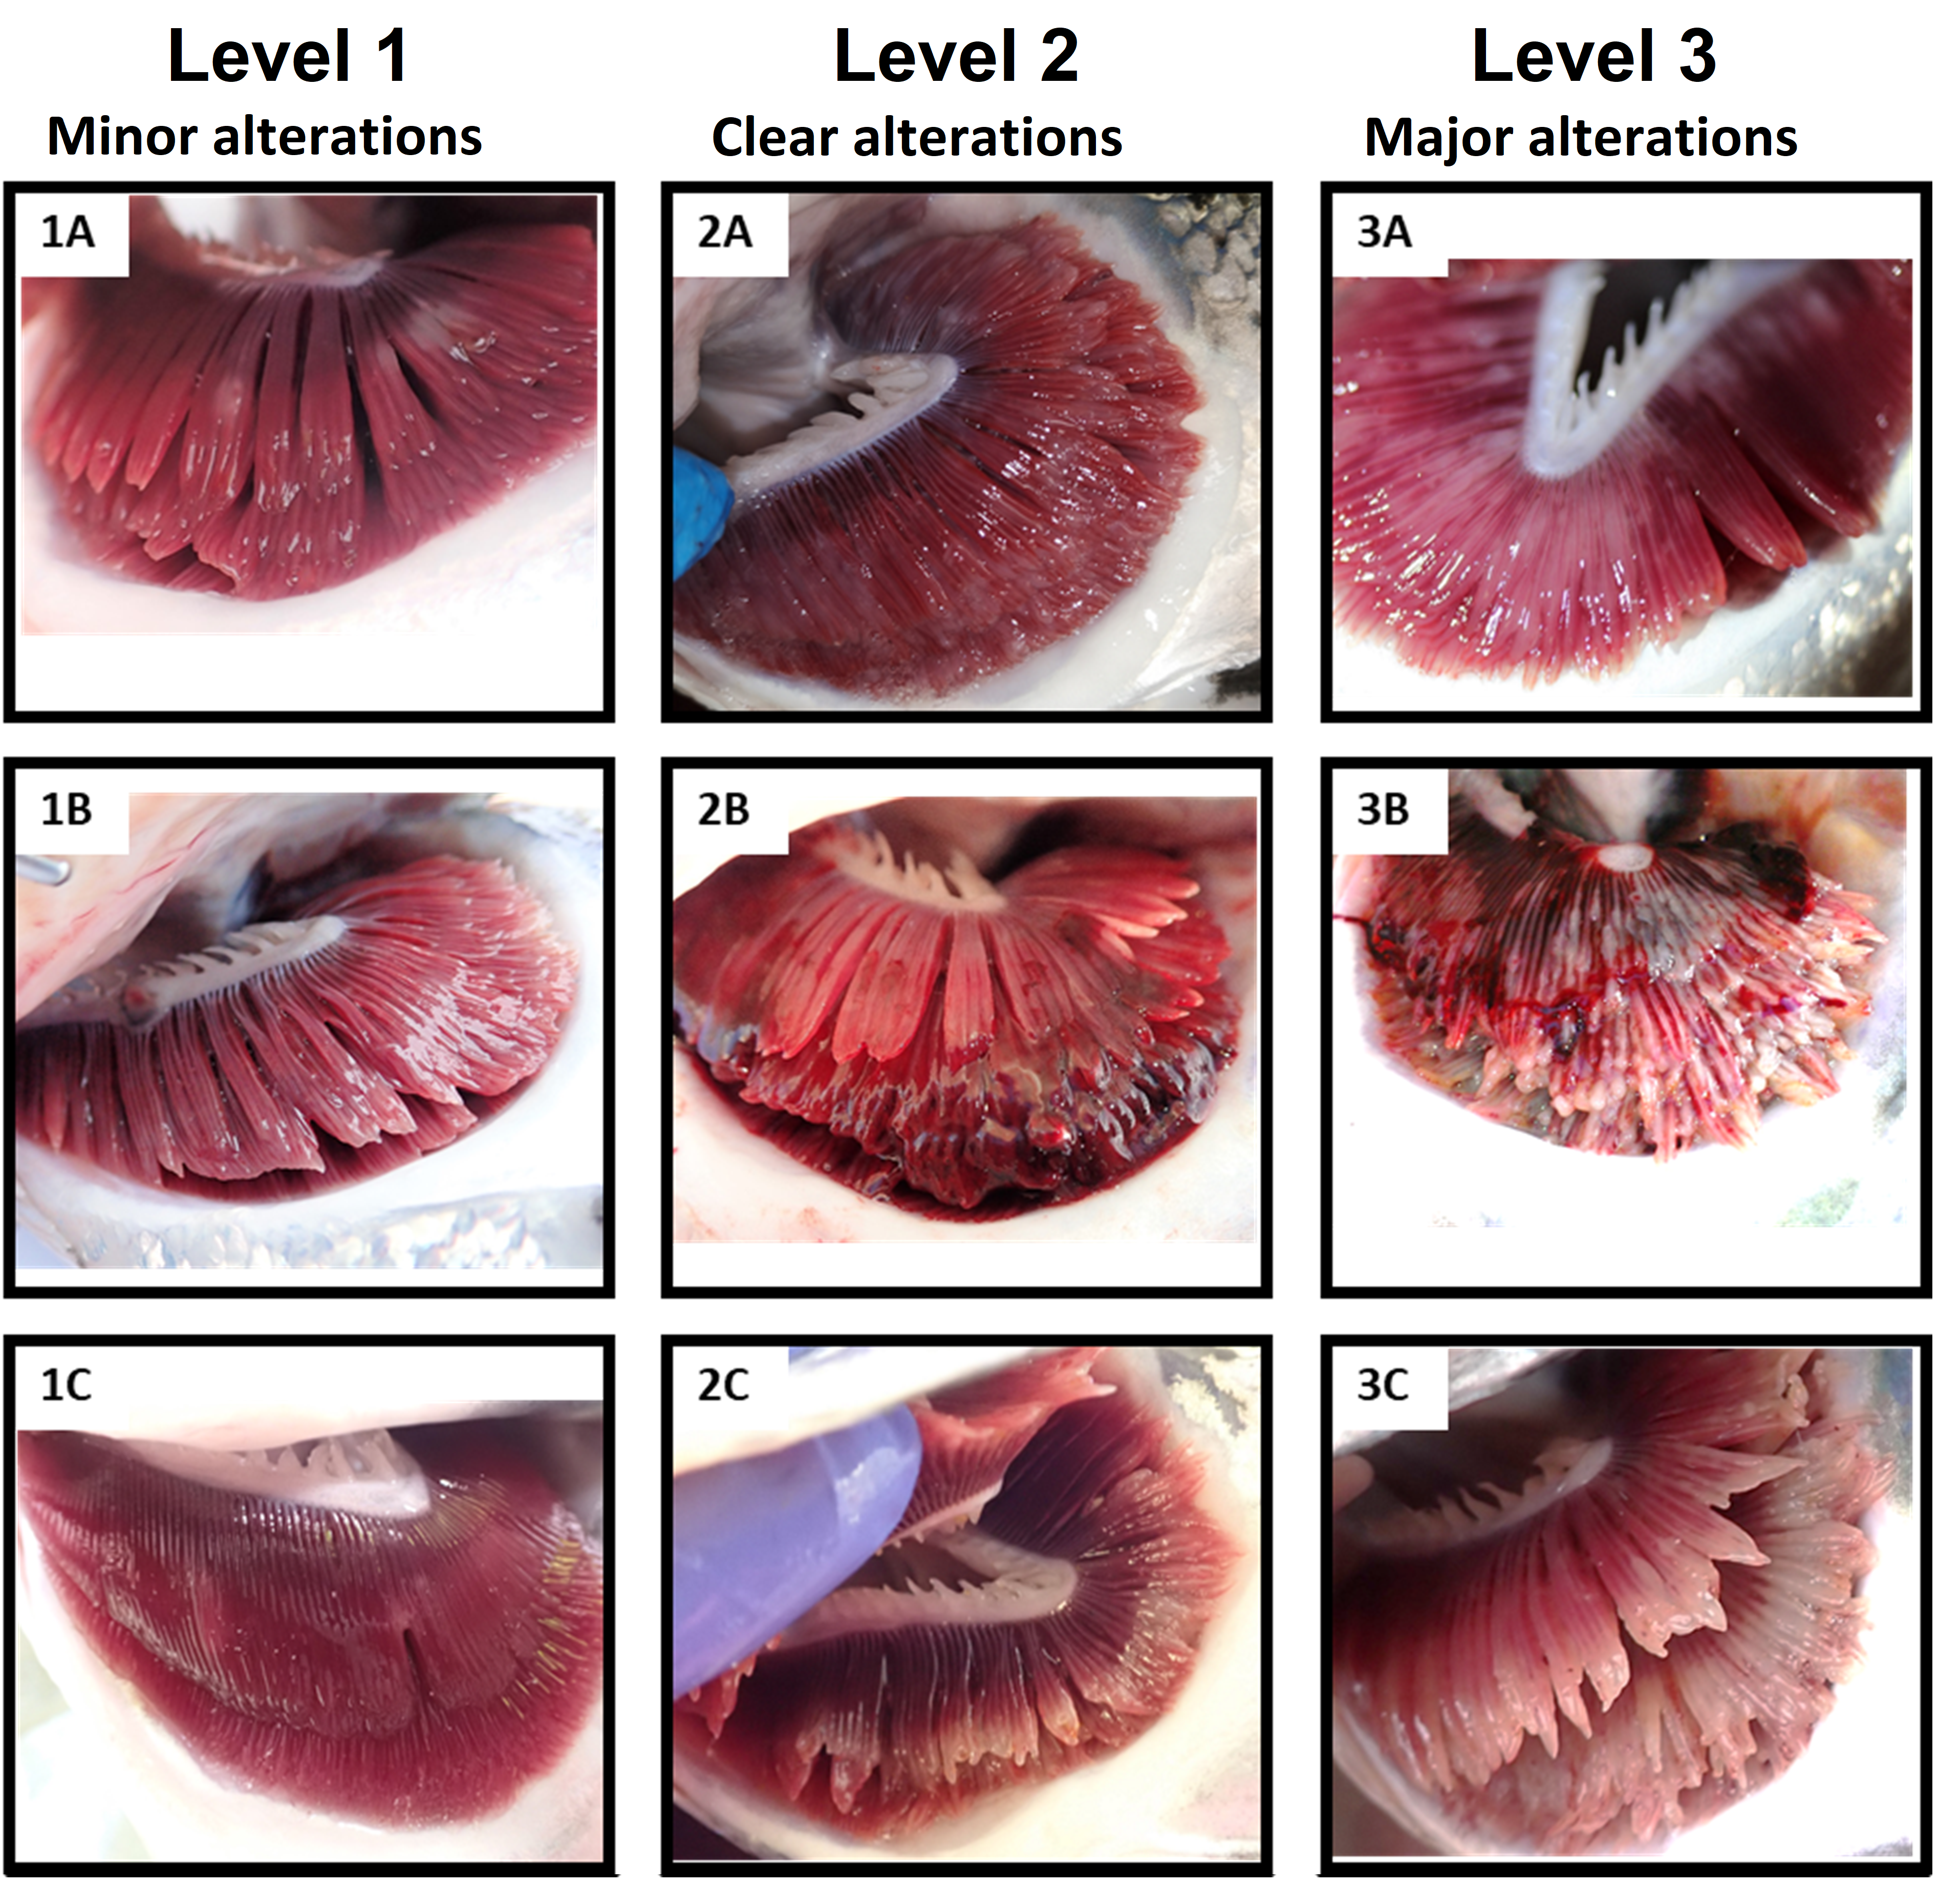
7.13 - Gill damage
Gill condition is recorded in relation to the gill with the most damage.
Gill condition is scored by carefully lifting the opercula and taking a quick look at the gills, without examining all the gill arches on each side of the fish.
Gill condition relates to potential reduced gill function based on the sum of all visible damage and abnormalities to the gills. Gill changes that can be clearly observed can be discolouration of the mucus, haemorrhaging in the lamellae, blood clots on the periphery of the lamellae, pale areas on the gill or missing gill lamellae. Damaged gill arches can also occasionally be observed. Drivers of gill damage can be various infections such as AGD (picture 1A, 2A and 3A), algae, jellyfish, chemical exposure and mechanical damage, e.g., after mechanical or thermal delousing treatments.A change that is assumed to lead to slightly reduced gill function (picture 1A-C), corresponding to a total level of 1 or 2 in ordinary gill scoring which ranges from 0 to 5, is recorded as level 1. A clearly injured gill with reduced gill function (picture 2A-C), corresponding to a total level of 3 or 4 in ordinary gill scoring (up to 50% of the gill tissue is affected) is recorded as level 2. Gills with marked injuries (picture 3A-C), corresponding to a total level of 5 in ordinary gill scoring (>50% of the gill tissue is affected), are recorded as level 3.
7.14 - Fin damage
Fin condition is recorded according to the most damaged fin.
Fin damage is often the result of mechanical impacts during handling or contact with the net or other fish, but it can also be caused by infections or lice infestation. Fin damage primarily includes erosion, splitting and fin haemorrhaging, but can also include fin deformities. Fin erosion is the loss of fin rays or tissue, which reduce the fin's area. Splitting happens when the tissue between fin rays is split open. Haemorrhaging in the fin can both be related to a given injury, e.g. a split (picture 2B) or be more widespread within the fin (picture 1B). A fin with minor damage such as mild erosion (picture 1A), mild haemorrhaging (picture 1B) and/or splits of <50% of the fin length (picture 1C) is recorded as level 1. A fin with moderate erosion, clear haemorrhaging and/or splits which are >50% of the fin length is recorded as level 2. Fins with serious damage (picture 3A-C) such as severe erosion, large areas of haemorrhaging and/or many deep splits, are recorded as level 3. Examples of undamaged fins (level 0) are provided in the Appendix.
Fin injuries that have completely healed are not scored as level 3 but as level 1 for minor to moderate damage and level 2 for major damage (picture 2C).
8 - Appendix
8.1 - Extra pictures, Fin damage
Examples of fin condition level 0. Top: Injury free Pelvic fins on a farmed salmon. Middle: <An injury free Dorsal fin on a farmed smolt. Bottom: A wild smolt with intact fins. Note that Fin condition is recorded according to the worst fin, and to get a scoring level of 0 all fins on the fish must be completely undamaged.
8.2 - Extra pictures, Sexual maturation
Although a kype is often a sign of sexual maturation in male salmon, immature individuals may have a small outgrowth anterior to the lower jaw that can be confused with early development of a kype (left), while sexually mature males do not always have a clear kype (middle). If one is in doubt, extended jaws can be a surer sign of puberty than the kype. A very clear kype (right) is nevertheless a sure sign of sexual maturation.
9 - References
Noble, C., Nilsson, J., Stien, L. H., Iversen, M. H., Kolarevic, J., & Gismervik, K. (2018). Welfare indicators for farmed salmon: How to assess and document fish welfare: NOFIMA, 328pp. ISBN 978-82-8296-531-6.
Stien, L. H., Bracke, M., Folkedal, O., Nilsson, J., Oppedal, F., Torgersen, T., Kittilsen, S., Midtlyng, P. J., Vindas, M. A., Øverli, Ø., & Kristiansen, T. S. (2013). Salmon Welfare Index Model (SWIM 1.0): a semantic model for overall welfare assessment of caged Atlantic salmon: review of the selected welfare indicators and model presentation. Reviews in Aquaculture 5, 33-57.
Ashley, P. J. (2007). Fish welfare: current issues in aquaculture. Applied Animal Behavior Science, 104(3-4), 199-235.
Branson, E. J. (2008). Fish Welfare: Blackwell Publishing Ltd, Oxford, U.K. 300 pp.
Hardy-Smith, P., & Roadknight, N. (2021). Fish Welfare and One Welfare–A Veterinarian's Perspective. In One Welfare in Practice (pp. 255-277): CRC Press.
Kristiansen, T. S., Fernö, A., Pavlidis, M. A., & Van de Vis, H. (2020). The welfare of fish: Springer.
Medaas, C., Lien, M. E., Gismervik, K., Kristiansen, T. S., Osmundsen, T., Størkersen, K. V., Tørud, B., & Stien, L. H. (2021). Minding the Gaps in Fish Welfare: the untapped potential of fish farm workers. Journal of Agricultural and Environmental Ethics, 34(5), 1-22.
Martins, C. I. M., Galhardo, L., Noble, C., Damsgard, B., Spedicato, M. T., Zupa, W., Beauchaud, M., Kulczykowska, E., Massabuau, J. C., Carter, T., Planellas, S. R., & Kristiansen, T. (2012). Behavioural indicators of welfare in farmed fish. Fish Physiology and Biochemistry, 38(1), 17-41.
Noble, C., Gismervik, K., Iversen, M. H., Kolarevic, J., Nilsson, J., Stien, L. H., & Turnbull, J. F. (2020). Welfare indicators for rainbow trout in aquaculture: How to assess and document fish welfare. : NOFIMA, 309 pp. ISBN 978-82-8296-638-2.
Stien, L. H., Bracke, M., Noble, C., & Kristiansen, T. S. (2020). Assessing fish welfare in aquaculture. In The welfare of fish (pp. 303-321): Springer.
Broom, D.M. (1986). Indicators of poor welfare. British Veterinary Journal 142, 524-526.
Gismervik, K., Tørud, B., Kristiansen, T. S., Osmundsen, T., Størkersen, K. V., Medaas, C., Lien, M. E. & Stien, L. H. (2020). Comparison of Norwegian health and welfare regulatory frameworks in salmon and chicken production. Reviews in Aquaculture 12, 2396-2410.
Remen, M., Sievers, M., Torgersen, T. & Oppedal, F. (2016). The oxygen threshold for maximal feed intake of Atlantic salmon post-smolts is highly temperature-dependent. Aquaculture 464, 582-592.
Lovdata (2016). Regulations on the control of salmon lice in aquaculture facilities. Published 07.12.2012 , corrected 16.03.2016.
Oppedal, F., Dempster, T. & Stien, L. H. (2011). Environmental drivers of Atlantic salmon behaviour in sea-cages: a review. Aquaculture 311(1), 1-18.
Ytrestøyl, T., Takle, H., Kolarevic, J., Calabrese, S., Timmerhaus, G., Rosseland, B. O. Teien, H. C., Nilsen, T. O., Handeland, S. O., Stefansson, S. O., Ebbesson, L. O. E. & Terjesen, B. F. (2020). Performance and welfare of Atlantic salmon, Salmo salar L. post-smolts in recirculating aquaculture systems: Importance of salinity and water velocity. Journal of the World Aquaculture Society 51, 373-392.