The climatic conditions in the Norwegian coastal waters are observed at a regular basis for a set of hydrographical stations from the Skagerrak in the South to Finnmark in the North.
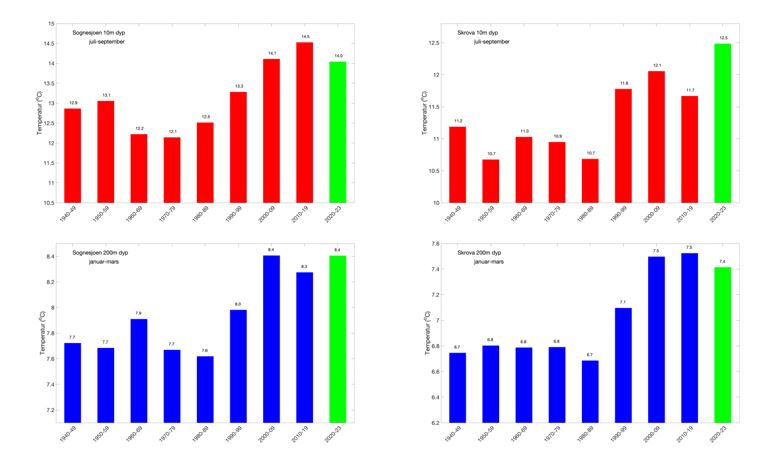
After 1990, measurements show a significant temperature increase in the Atlantic Water along the Norwegian coast. Between 2000 and 2009 the mean temperature increased to about 0.7 oC above the 1940-89 long-term average. After 2009, the mean temperature in the Atlantic water along the northern coastal areas (Skrova) seems to have stabilized at the same high level as in the period 2000–09, but in the southern coastal areas (Sognesjøen), the mean temperature in the Atlantic water are reduced by about 0.1 oC. During 2023, temperatures in both the surface layer and deep water along the entire Norwegian coast were above normal, but deep-water temperatures at Skrova were slightly lower compared with the two previous decades. The deep water off the coast in both southern Norway, represented by the Sognesjøen station, and northern Norway, represented by the Skrova station, were in 2023 more than one and around one standard deviation, respectively, higher than the 1961–2020 reference period.
Figure 1. Decadal mean temperatures (1940–2023) in the surface layer (10 m depth) in July–September and at 200 m depth in January–March at Sognesjøen and Skrova.
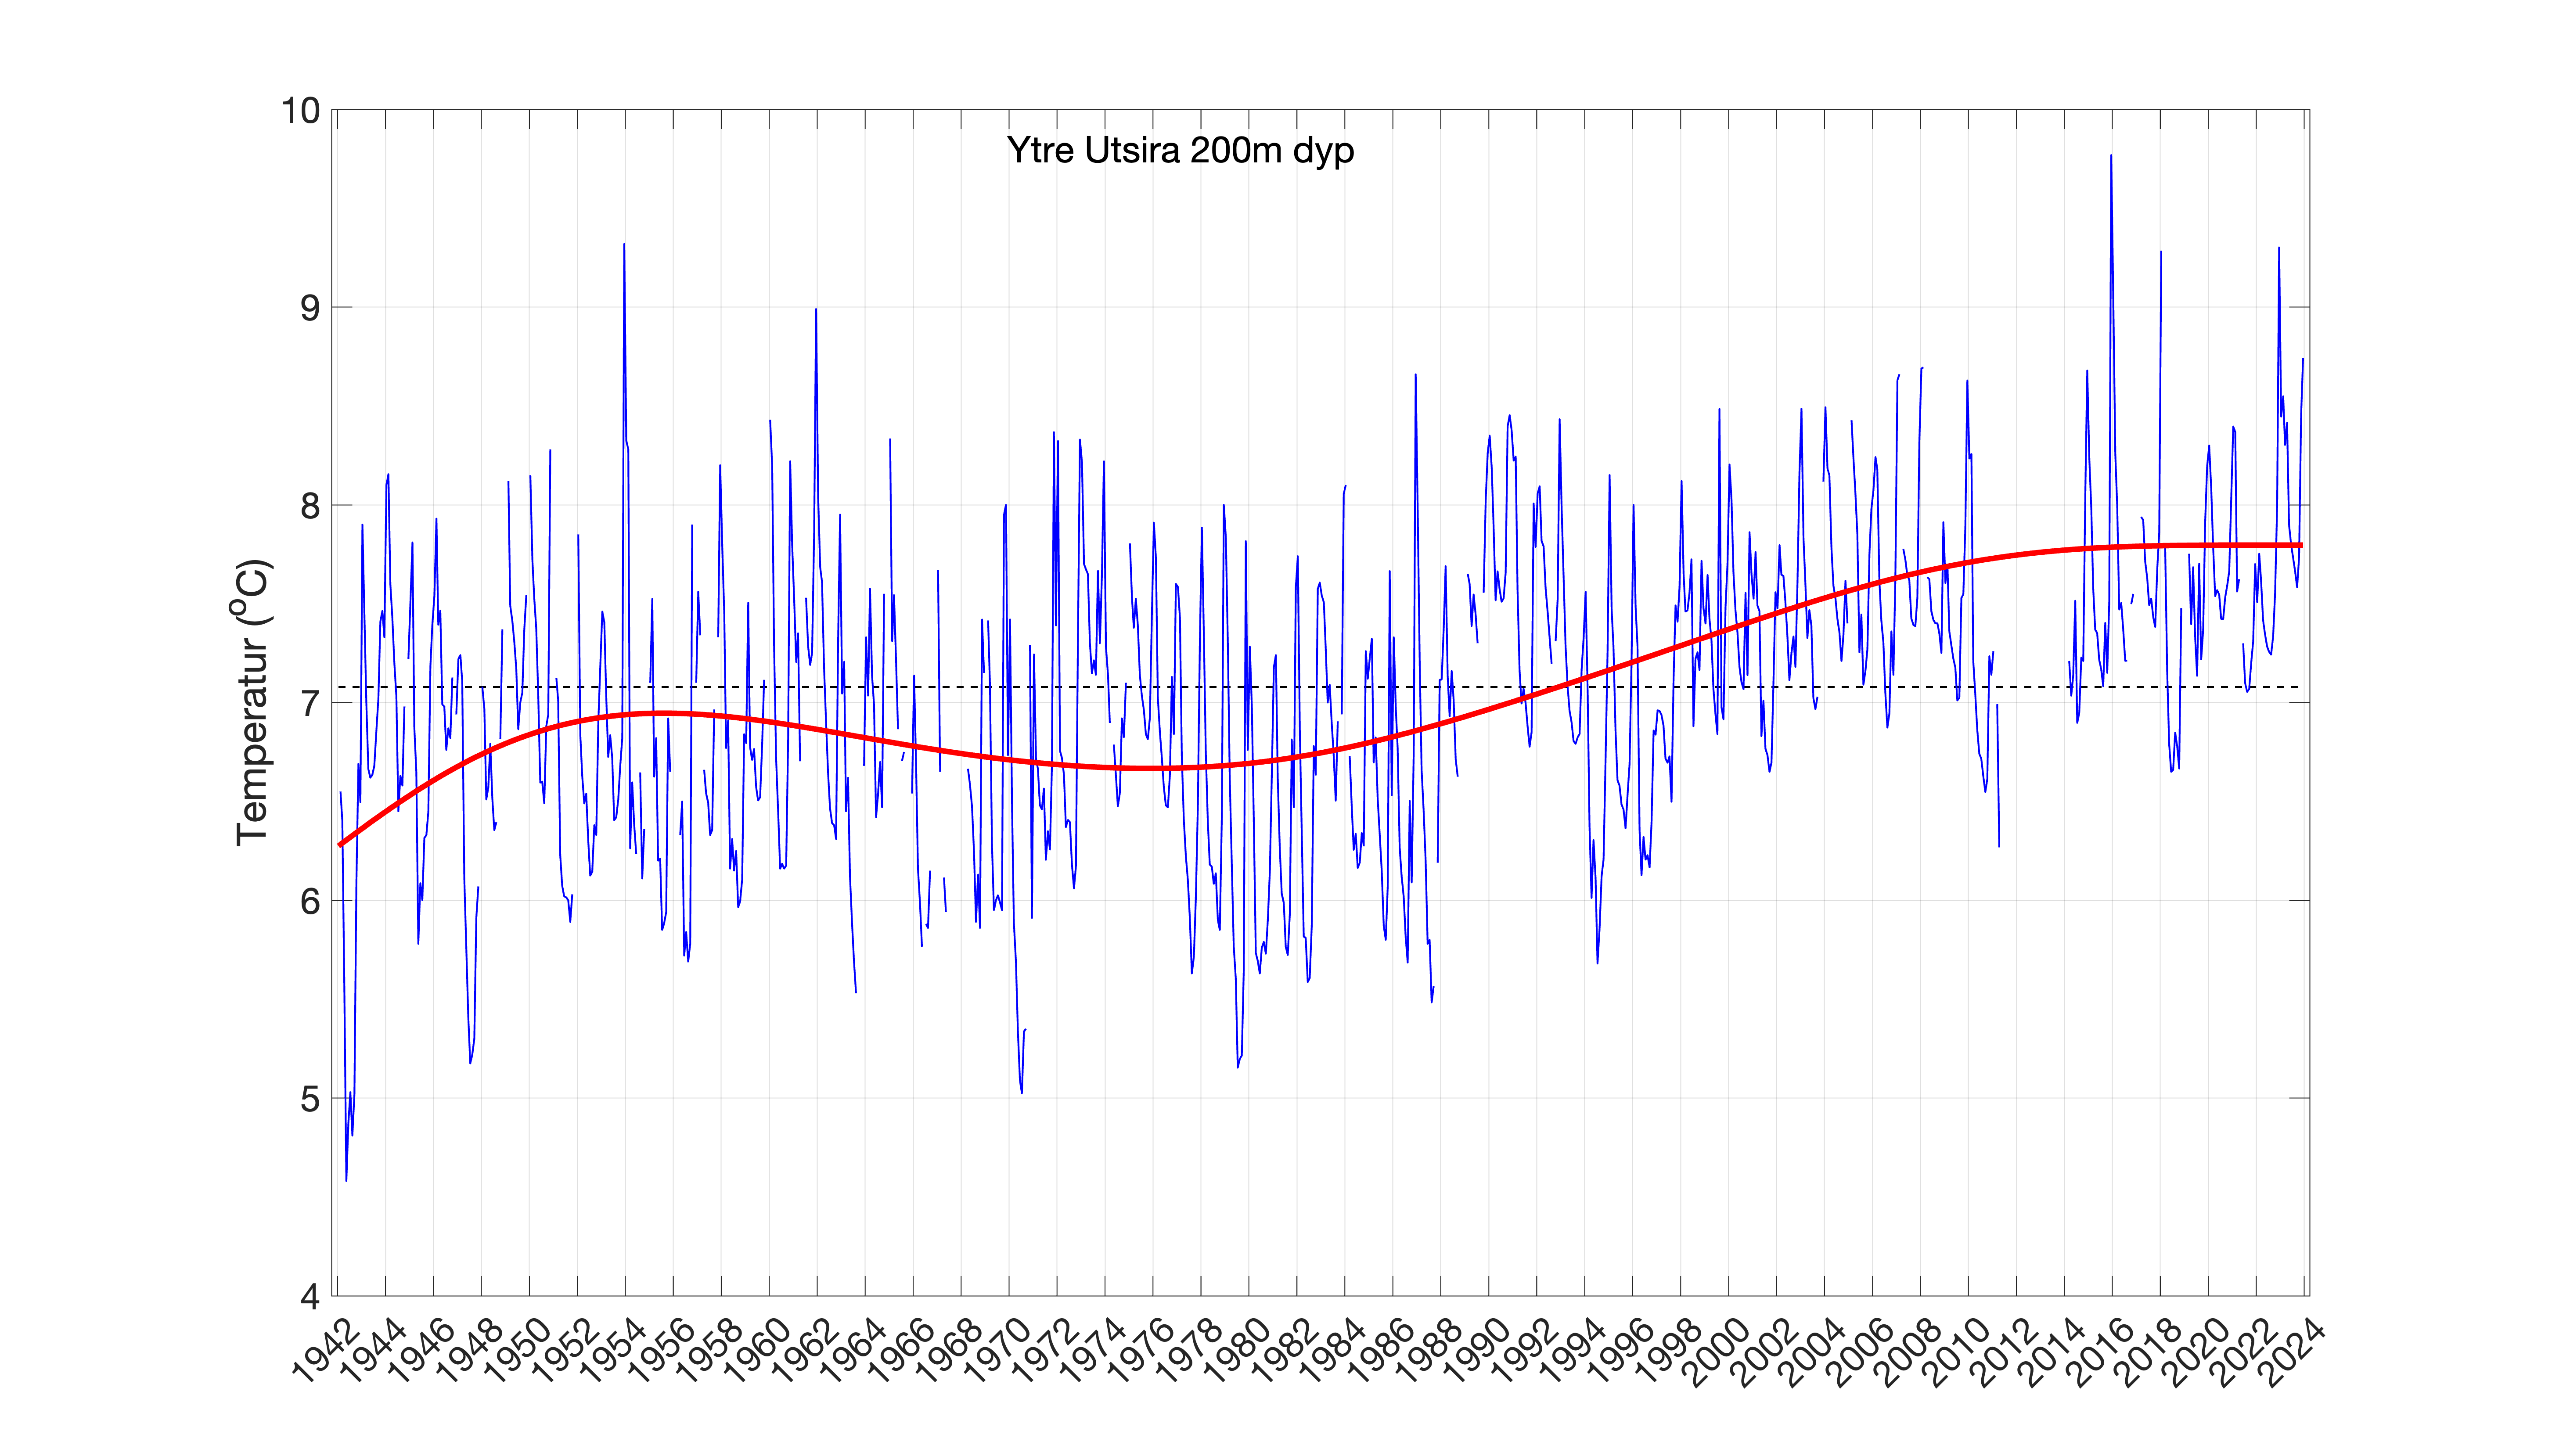
Figure 2. Time series of temperature at 200 m depth from the coastal station off Utsira between 1940 and 2023. Blue line denotes the monthly average temperature, red line is a filtered time series with 30-year cutoff period and dashed line is the normal temperature (1961–2020).
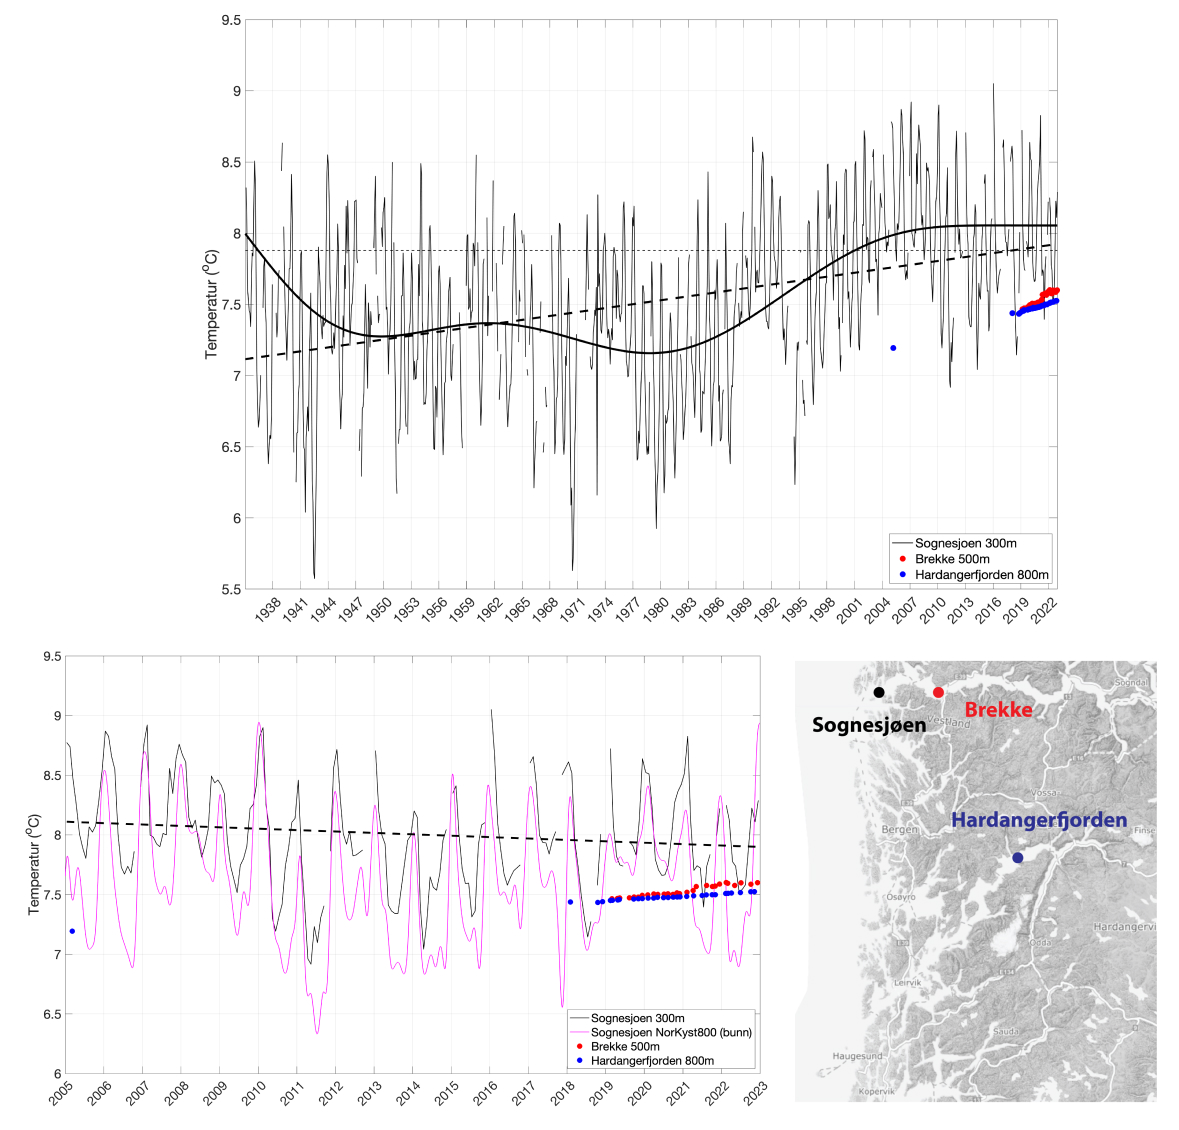
Figur 3. The upper panel shows observed temperature at 300 m depth from the coastal monitoring station Sognesjøen between 1935 and 2023. The black lines show the observed temperatures in different ways: thin and solid line shows the monthly averages, thick and solid line denote the filtered time series with 30-year cutoff period, thin and dashed line is the normal temperature (1961–2020) while thick and dashed line represents the linear trend of the dataset. Red and blue dots are observations from deep basins in Sognefjord and Hardangerfjord, respectively. Positions for the observations are shown in the map. The lower left panel denotes the observed temperature after 2005 only. The magenta line shows comparable, filtered results from the numerical current model results of NorKyst800. The black, dashed line represents the linear trend of the dataset for this limited time period.
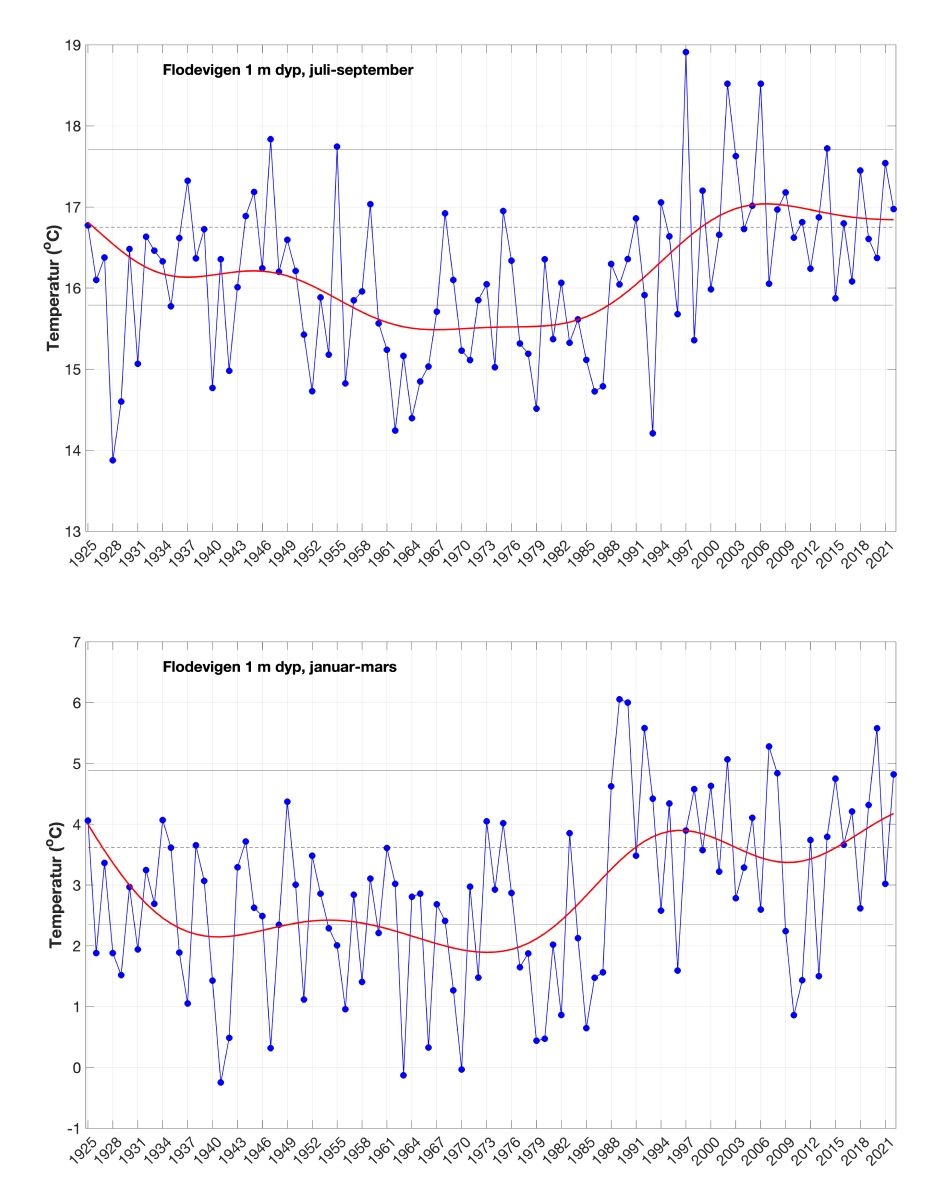
Figure 4. Time series of mean summer (July-September, upper panel) and winter (January–March, lower panel) temperature at one meter depth in Flødevigen between 1925 and 2023. Blue line denotes the mean summer and winter temperature, respectively, red line is the 30-year moving average, dashed line is the normal temperature (1961–2020) and the black lines denote +/- one standard deviation.
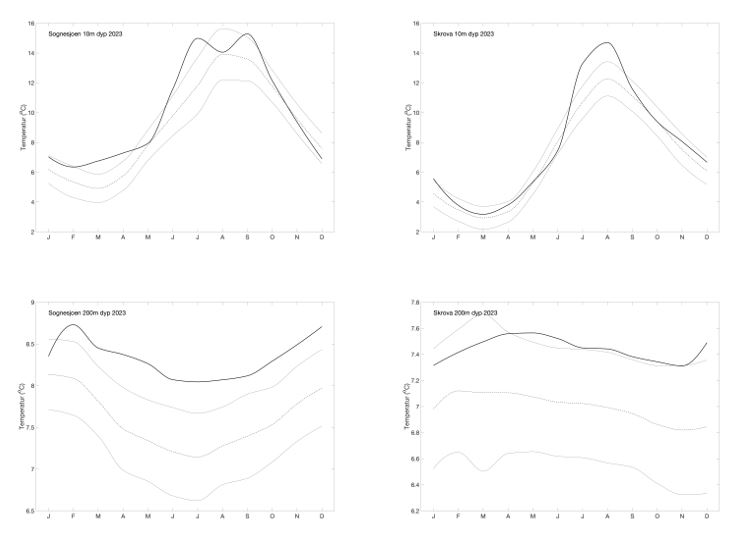
Figure 5. Temperatures at Sognesjøen (left panels) and Skrova (right panels) at 10 and 200 m depth in 2023 (thick line). The dotted lines represent the mean values (1961–2020), and solid lines represent +/- one standard deviation.