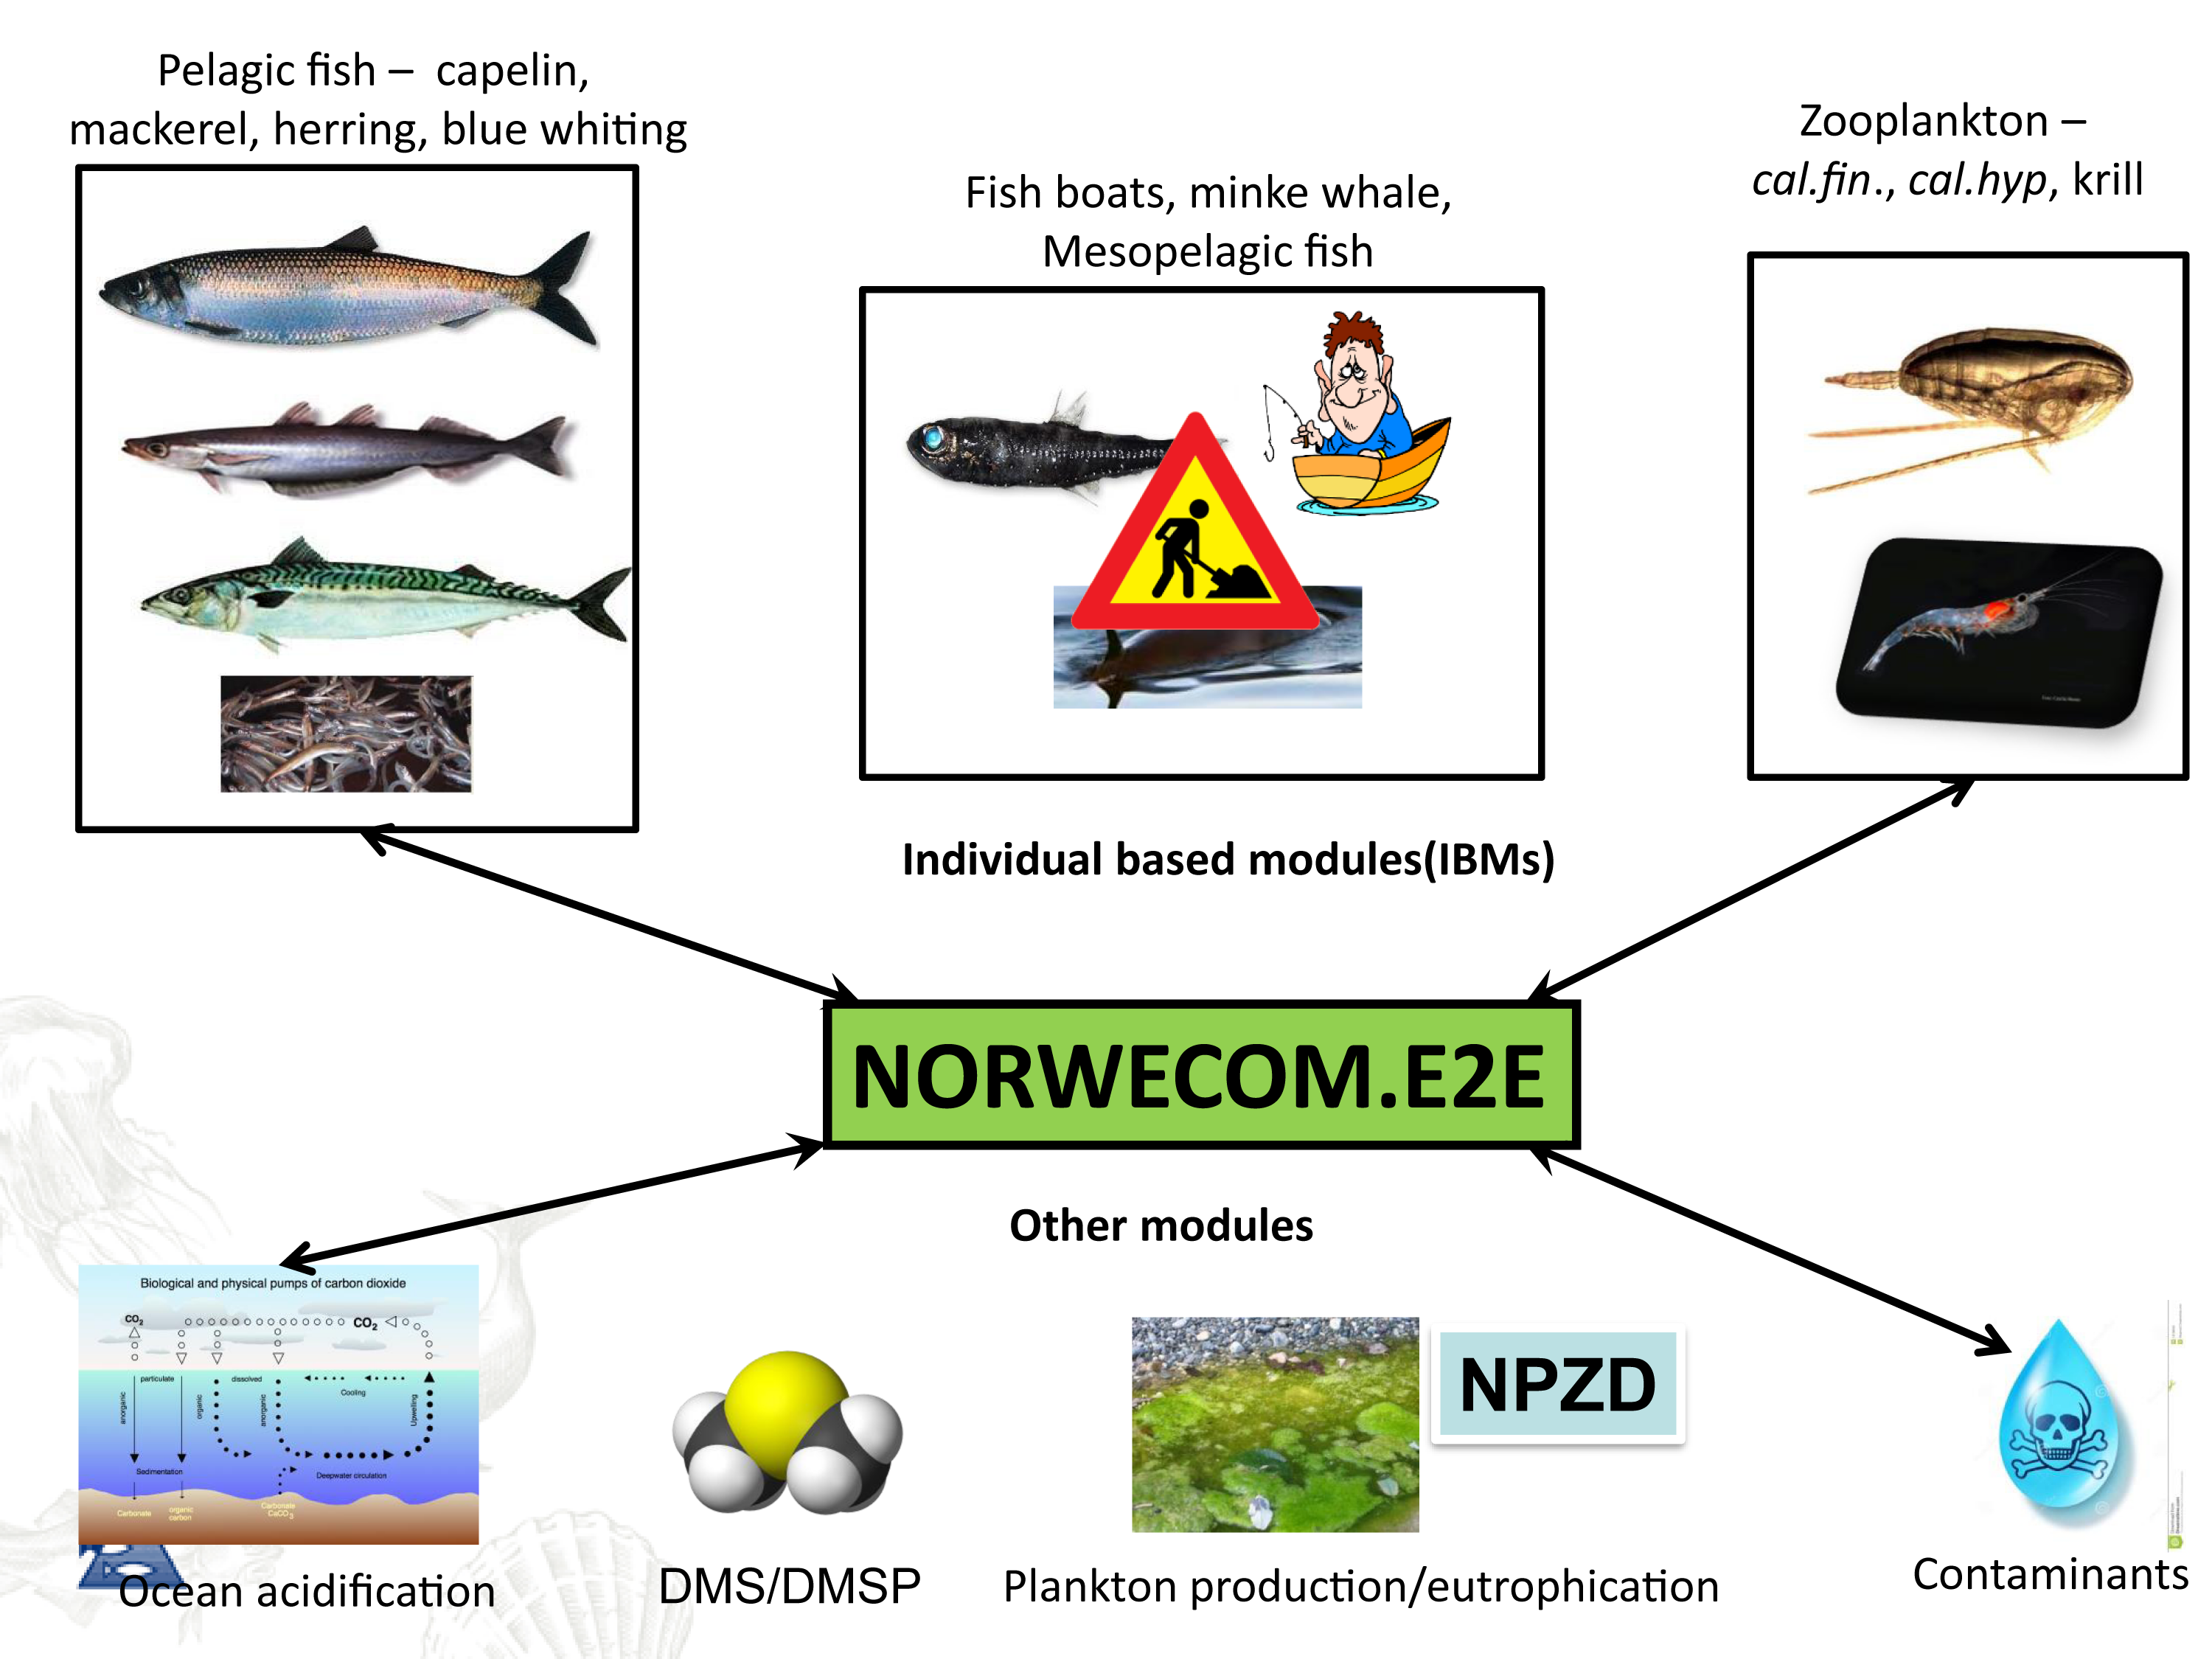
NORWECOM.E2E is a merger of several models; an Nutrient-Phytoplankton-Zooplankton-Detritus (NPZD) model for nutrient cycling and the lower trophic levels and different Individual Based Models (IBMs) developed initially for fish and zooplankton. NORWECOM.E2E is one of very few bottom-up models world-wide where IBMs for different trophic levels are two-way coupled and used to simulate food web dynamics of a large regional sea, and the only model system to run for the Norwegian Sea. At present, IBMs for adult pelagic fish (mackerel, herring, blue whiting), Calanus finmarchicus, Calanus hyperboreus, Calanus glacialis and fishing vessels are included. The model system also has modules for ocean acidification and contaminants. Through NORWECOM.E2E, all these models are now being integrated into a fully coupled model system using physical fields (salinity, temperature, velocities, etc.) from the an ocean model. The model system is used to study natural variations and effects of, for example, climate change, ocean acidification or fishing in our ecosystems, but also as a tool for assessing monitoring strategies and observation patterns.
The IBMs for zooplankton and fish are three-dimensional in time and space, taking into account the entire life cycle and the most important life history features such as growth, mortality, movement and reproduction, as well as adaptive properties that control the interaction with the environment. The models are connected so that each IBM receives input about the other species. For example, zooplankton will receive information on the amount of phytoplankton and zooplankton densities from the NPZD model. The zooplankton then feed on the plankton and the local plankton quantity is continuously updated in the model. All zooplankton biomass that is removed (eg by grazing pelagic fish) becomes part of the mortality in the Calanus population so that mass balance is achieved. The three species of pelagic fish included in the model are herring, blue whiting and mackerel, which are dominant in terms of biomass in the region. The pelagic fish feeds on Calanus, and the spatial distribution of C. finmarchicus will therefore be affected by the fish in the model. The two-way connection provides unique opportunities to study the combined effects of pressures.
Cited literature
Aksnes, D.L., Ulvestad, K.B., Baliño, B.M., Berntsen, J., Egge, J.K., Svendsen, E. (1995) Ecological modeling in coastal waters - Towards predictive physical-chemical-biological simulation-models. Ophelia, 41, 5-36.
Green, N.W., et al (2011). Tilførselsprogrammet 2010. Overvåking av tilførsler og miljøtilstand I Nordsjøen. Technical report TA 2810/2011 (p. 101pp+106app). Oslo, Norway: KLIF.
Grimm, V., Railsback, S. (2005). Individual-based Modeling and Ecology: Princeton University Press.
Hjøllo, S.S., Huse, G., Skogen, M.D., Melle, W. (2012) Modelling secondary production in the Norwegian Sea with a fully coupled physical/primary production/individual-based Calanus finmarchicus model system. Marine Biology Research, 8, 508-526.
Huse, G. (2005) Artificial evolution of Calanus' life history strategies under different predation levels. GLOBEC Newsletter, 11, 19 Huse, G., Ellingsen, I. (2008) Capelin migrations and climate change - a modeling analysis. Climatic Change, 87, 177-197.
Huse, G., Giske, J. (1998) Ecology in Mare Pentium: an individual based spatio-temporal model for fish with adapted behaviour. Fisheries Research (Amsterdam), 37, 163-178.
Huse, G., et al. 2012. Effects of interactions between fish populations on ecosystem dynamics in the Norwegian Sea - results of the INFERNO project Preface. Marine Biology Research, 8: 415-419.
Huse, G., Johansen, G.O., Bogstad, L., Gjøsæter, H. (2004) Studying spatial and trophic interactions between capelin and cod using individual-based modeling. ICES Journal of Marine Science, 61, 1201-1213.
Samuelsen, A., Huse, G., Hansen, C. (2009) Shelf recruitment of Calanus finmarchicus off the west coast of Norway: role of physical processes and timing of diapause termination. Marine Ecology Progress Series, 386, 163-180.
Shchepetkin, A.F., McWilliams, J.C. (2005) The regional oceanic modeling system (ROMS): a split-explicit, free-surface, topography-following-coordinate oceanic model. Ocean Modelling, 9, 347-404.
Skaret, G., Dalpadado, P., Hjøllo, S.S., Skogen, M.D.,& Strand, E.(2014). Calanus finmarchicus abundance, production and population dynamics in the Barents Sea in a future climate. Prog. Oceanogr.doi:dx.doi.org/10.1016/j.pocean.2014.04.008
Skogen, M.D., Budgell, W.P., Rey, F. (2007) Interannual variability in Nordic seas primary production. ICES Journal of Marine Science, 64, 889-898.
Skogen, M.D., Olsen, A., Børsheim, K.Y., B., S.A., Skjelvan, I. (2014) Modelling ocean acidification in the Nordic and Barents Seas in present and future climate. Journal of Marine Systems.
Skogen, M.D., Svendsen, E., Berntsen, J., Aksnes, D., Ulvestad, K.B. (1995) Modeling the primary production in the north-sea using a coupled 3-dimensional physical-chemical-biological ocean model. Estuarine Coastal and Shelf Science, 41, 545-565.
Strand, E., Huse, G., Giske, J. (2002) Artificial evolution of life history and behavior. American Naturalist, 159, 624-644.
Utne K.R., Hjøllo S.S., Huse G., Skogen M. 2012. Estimating the consumption of Calanus finmarchicus by planktivorous fish in the Norwegian Sea using a fully coupled 3D model system. Marine Biology Research, 8:5-6, 527-547