Rapport frå Den bilaterale norsk-russiske arbeidsgruppa for arktiske fiskeri (JRN-AFWG) 2025
Den bilaterale norsk-russiske arbeidsgruppa for arktiske fiskeri (JRN-AFWG) hadde møte per korrespondanse 2.-3. desember 2025 for bestandsvurdering og kvoterådgjeving på barentshavslodde.
Den geografiske dekninga av loddebestanden under toktet i Barentshavet hausten 2025 var tilnærma fullstendig. Biomassen av totalbestanden blei berekna til 339 045 tonn, og den modnande biomassen (≥14 cm) til 123 641 tonn. Dette er den lågaste modnande biomassen målt sidan 1995.
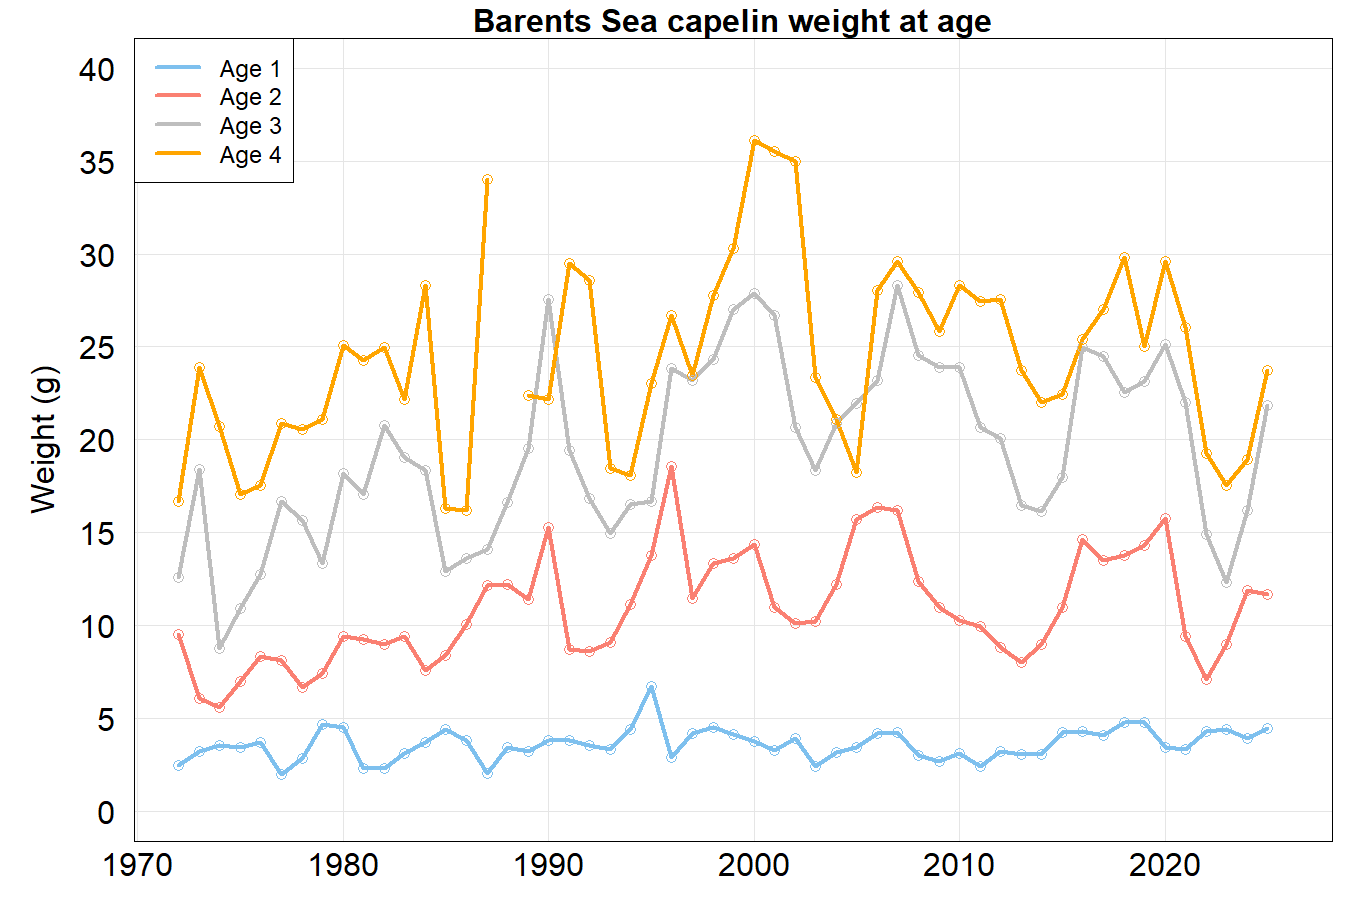
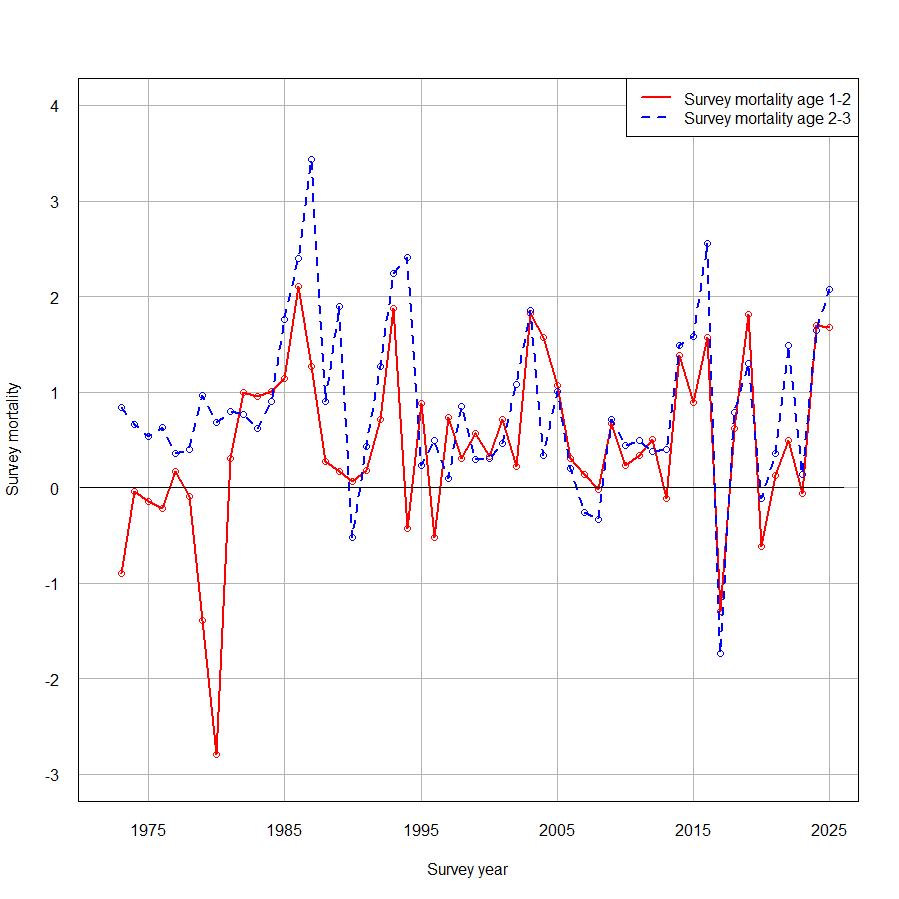
Toktresultata viser at overlevinga for både 2 og 3-åringar frå i fjor til i år har vore svært låg. Det berekna talet på rekruttar (1-åringar) frå årets tokt var også langt under langtidsmiddelet. Gjennomsnittsvekt ved alder i 2025 var høgare enn i 2024 for 3 og 4 år gammal fisk.
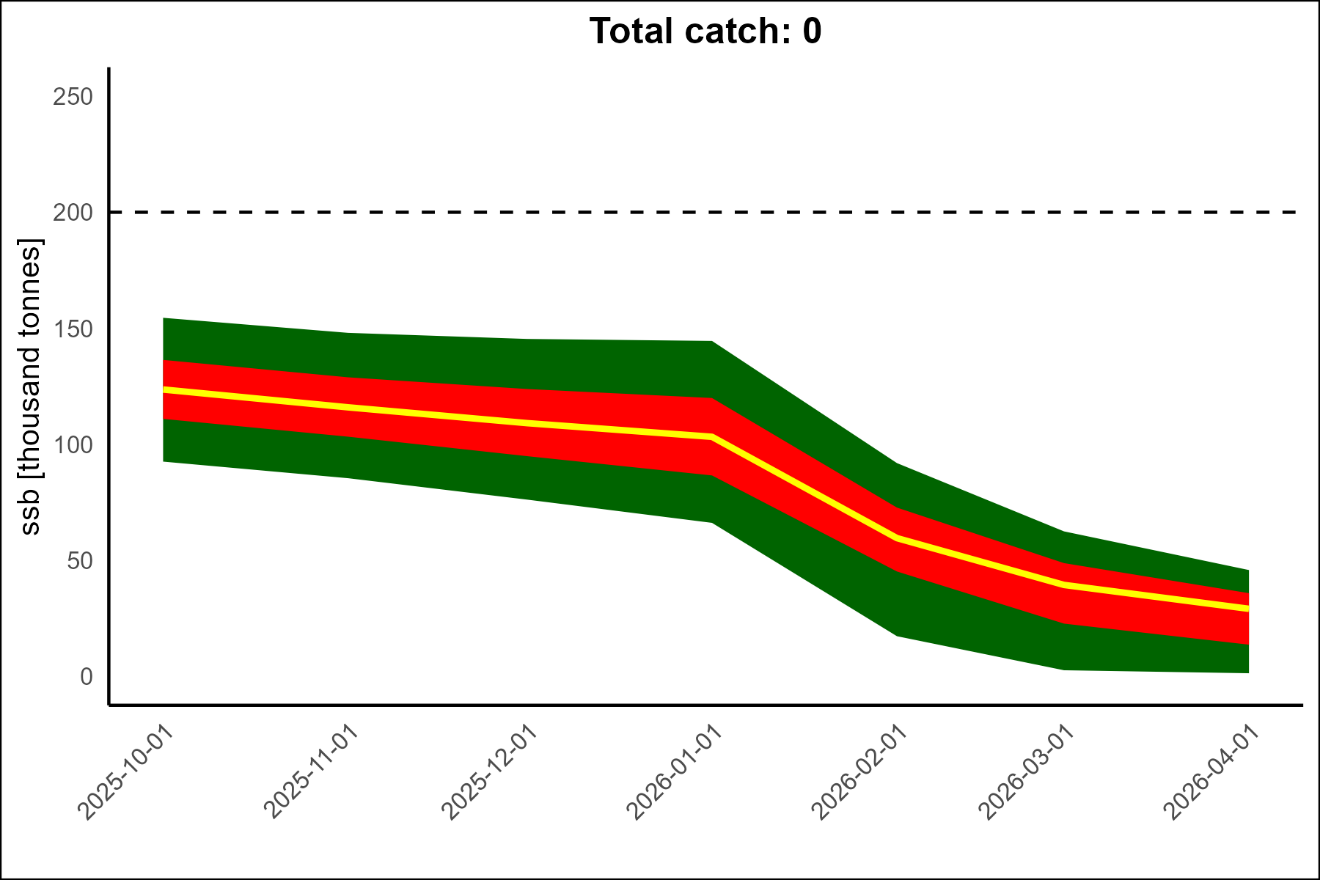
I bestandsrådgjevinga for lodde blir det gjennomført ei framskriving av den modnande loddebiomassen frå 1. oktober til 1. april (gytetidspunkt) året etter. Framskrivingsmodellen (bifrost) inneheld ein eigen modul for torskekonsum av lodde. I framskrivinga blei median gytebiomasse 1. april 2026 berekna til 29 000 tonn utan fangst (90% konfidensintervall: 1-46 000 tonn), og sannsynet for å ligga over referansepunktet (200 000 tonn) i haustingsregelen var 0%.
I tråd med haustingsregelen om at kvoten ikkje skal settast høgare enn at det er minst 95% sannsyn for at gytebiomassen er over referansepunktet, blei det tilrådd 0 fiske etter barentshavslodde for 2026-sesongen.
Summary
The Joint Norwegian-Russian Arctic Fisheries Working Group (JRN-AFWG) met by correspondence on 2-3 December 2025 to assess the stock and provide quota advice on the Barents Sea capelin.
The geographical coverage of the capelin stock during the Barents Sea autumn 2025 survey was almost complete. The biomass of the total stock was estimated at 339 045 tonnes, and the maturing biomass (≥14 cm) at 123 641 tonnes. This is the lowest maturing biomass estimated since 1995.
The survey results show that the survival of both 2- and 3-year-olds from last year to this year has been very low. The estimated number of recruits (1-year-olds) from this year's survey was also well below the long-term average. The average weight-at-age in 2025 was higher than in 2024 for 3- and 4-year-old fish.
In the stock advice for capelin, a projection of the maturing capelin biomass is made from 1 October to 1 April (spawning time) the following year. The projection model (bifrost) contains a separate module for cod consumption of capelin. In the projection, the median spawning biomass on 1 April 2026 was calculated to be 29 000 tonnes without catches (90% confidence interval: 1-46 000 tonnes), and the probability of being above the reference point (200 000 tonnes) in the harvest control rule was 0%.
In line with the harvest control rule that the quota should not be set higher than there is at least a 95% probability that the spawning biomass is above the reference point, 0 fishing for Barents Sea capelin was recommended for the 2026 season.
1 - Barents Sea Capelin
1.1 - Barents Sea Capelin
The Joint Russian-Norwegian Arctic Fisheries Working Group (JRN-AFWG) met by correspondence on 2-3 December 2025 to assess and give quota advice for the Barents Sea capelin stock.
Participants:
Bjarte Bogstad (Norway, Chair of meeting)
Stine Karlson (Norway)
Yury Kovalev (Russia)
Dmitry Prozorkevich (Russia)
Frøydis Rist (Norway)
Georg Skaret (Norway)
Sindre Vatnehol (Norway)
1.2 - Regulation of the Barents Sea Capelin Fishery
Since 1979, the Barents Sea capelin fishery has been regulated by a bilateral fishery management agreement between Russia (former USSR) and Norway. A TAC has been set separately for the winter fishery and for the autumn fishery. From 1999, no autumn fishery has taken place, except for a small Russian experimental fishery in some years and small by-catch in the northern shrimp fishery. A minimum landing size of 11 cm has been in force since 1979. Scientific advice is to carry out capelin fishery only on mature fish during the period from January to April.
1.3 - TAC and Catch Statistics (Table A1)
The Joint Norwegian-Russian Fishery Commission (JNRFC) set a TAC of 196 000 tonnes for 2024 and 0 tonnes for 2025. For both years, the quotas were in accordance with the advice. The international historical catch by country and season in the years 1965–2025 is given in Table A1. Russia caught 700 tonnes as by-catch in other fisheries in 2025.
A summary of the BESS capelin sampling included in the abundance estimation in 2025 is given below:
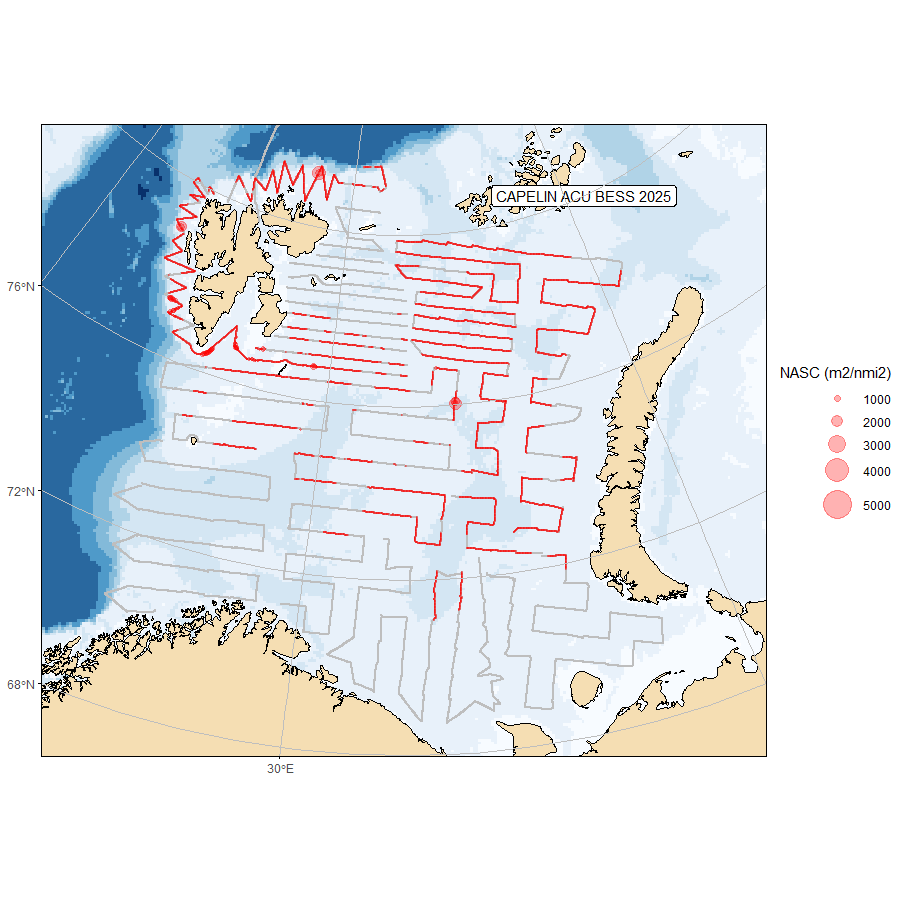
The geographical survey coverage of the Barents Sea capelin stock during the BESS in 2025 was close to complete and with very good coverage of the main distribution area. The geographical distribution of capelin in 2025 is shown in Figure A1.
The stock estimate (made in StoX v 4.1.1) from the area covered by the 2025 survey was 0.339 million tonnes (Table A2). About 36% (0.124 million tonnes) of the estimated stock biomass consisted of maturing fish (>14.0 cm). The mean weight at age increased from the 2024 to the 2025 survey for ages 1, 3 and 4 and decreased slightly for age 2 (Figure A2). Estimates of stock in number by age group and total biomass for the historical period are shown in Table A3. Survey mortalities for ages 1-2 and 2-3 from 2024 to 2025 were high as shown in Figure A3.
A fixed sampling variance expressed as Coefficient of Variation (CV) of 0.2 for all age groups has previously been applied as input for CapTool for the forecast in the capelin assessment (Tjelmeland 2002; Gjøsæter et al. 2002). The survey design and estimation software now allow for estimation of a direct CV by age group. CV estimates by age group for the years 2004-2021 and 2023-2025 are given in Table A4. It was found that age groups with very low abundance in the survey usually have very high CVs. That is expected since there are few observations in the survey for such age groups. Vice versa an abundant age group normally has much lower CV. WKCAPELIN recommended to use the average CV for each age group from the last five years with high-quality surveys in the stock projection. However, including age groups with very low abundance and accordingly high CV in the averaging is inappropriate.
Due to incomplete survey coverage in 2022, the CVs of that year were not included in the averaging. It was decided to use the unweighted average for the recent 5 years (2020-2021 and 2023-2025) for ages 1-3 and apply the value for age 3 also for the ages 4 and 5. The summary results are presented below:
CV
Age 1
Age 2
Age 3
Age 4
Average
0.236
0.227
0.287
0.576
2025
0.297
0.375
0.416
0.649
Value to use
0.236
0.227
0.287
0.287
A methodology for handling very small or very large CV values and abundance estimates of different orders of magnitude in the averaging should be explored, together with exploring using annual CVs. With a low CV there is a risk that sampling variance is not a good reflection of total uncertainty, since other sources of uncertainty could then dominate over sampling variance in the total uncertainty.
1.4.2 - Benchmark results
An ICES benchmark meeting joint for the Iceland East Greenland Jan Mayen capelin and Barents Sea capelin (WKCAPELIN) was held in Reykjavik 21-25 November 2022 (ICES, 2023). A summary of the changes to the assessment method following the benchmark is given in the 2023 capelin assessment report.
1.4.3 - Reference points
A Blim (SSBlim) management approach has been suggested for this stock (Gjøsæter et al., 2002). In 2002, the JNRFC agreed to adopt a management strategy based on the harvesting rule that no fishing is permitted if there is less than 95% probability that at least 200 000 tonnes of capelin are left to spawn. Consequently, 200 000 tonnes was used as a Blim. Alternative harvest control rules of 80, 85 and 90% probability of SSB > Blim were suggested by JNRFC and evaluated by ICES (ICES 2016). ICES considers these rules not to be precautionary. At its 2016 meeting, JNRFC decided not to change the adopted management strategy.
The Blim used up until present is based on SSB in 1989 (estimated to 96 000 tonnes) with an uncertainty buffer added (SSB + uncertainty buffer assumed to add up to 200 000 tonnes). The SSB in 1989 is the lowest in the time series which resulted in good recruitment.
In WKCAPELIN it was considered that Blim should not be based on years which are affected by the NSS-herring collapse in the Barents Sea, as was the case for the year 1989. Among the years included, 1990 had the lowest estimated SSB (68 000 tonnes) that still produced above average recruitment.
The procedure of including an uncertainty buffer to Blim like it was done previously, was not accepted by WKCAPELIN. Separate terms for the biological reference point (Blim) and the reference point used in the harvest control rule (Bescapement) were therefore introduced.
1.4.4 - Harvest control rule evaluation
Trochta et al. (2024) assessed harvest control rules for capelin in the Barents Sea using a management strategy evaluation (MSE), a modelling framework that simulates population and fishery responses to management actions. The form of the current escapement rule is retained and is defined by Bescapement, the biomass that must escape to spawn after fishing is accounted for. The MSE specifically tested four different Bescapement values (100 000, 150 000, 200 000 and 400 000 tonnes) with and without three alternative fixed minimum quotas (25 000, 50 000 or 75 000 tonnes). When assuming historical capelin productivity, accurate survey estimates and correctly estimated survey precision, all four Bescapement values without fixed minimum quotas maintained a low risk (<5%) of spawning biomass falling below Blim. However, a Bescapement equal to 100 000 tonnes showed notably higher risk (of SSB<Blim) if either the survey estimate is biased high or estimated survey precision is biased low. High probabilities of fishery closures resulted from Bescapement = 400 000 tonnes. All the alternative rules using fixed minimum quotas showed very high risk of SSB falling below Blim and the model framework projected reduced future recruitment to the extent of stock collapse over the long term. In general, average catch decreased and the number of years with closed fishery increased with higher Bescapement. There is also ongoing work exploring rules with minimum levels of quota (e.g. 25 000 or 50 000 tonnes) given that the projected spawning stock biomass is above Bescapement with zero catch.
When selecting a rule, managers should also consider the trade-offs with other consequences and potential impacts on the ecosystem given the critical role played by capelin as the key forage fish for various predators in the Barents Sea.
1.4.5 - Comparison of historical capelin advice using updated and original model configuration
As part of the 2022 capelin benchmark, the configuration of the forecast model for Barents Sea capelin, Bifrost, was reviewed and updated. Vatnehol and Skaret (2025) compared the quota advice for the advice years 2005-2023 based on forecasts with the updated and original model configurations, using the existing harvest control rule. The results show that the catch advice in general would have been higher with the updated configuration, but the years with no-fishery-advice were the same with the updated and original configuration. The comparison further showed that the changes in parameter settings of the cod consumption module in addition to the parameters set for natural capelin mortality in the autumn (1 October to 1 January) had the greatest impact on the advice. It must be noted that the model configuration is partly adapted to the current ecosystem state, so the comparison between configurations becomes less relevant the further back in time we go. Furthermore, some parameters including the natural capelin mortality in the autumn and the proportion of immature cod in the Svalbard area will be updated each year as part of the capelin assessment, so a direct comparison with historical advice will change each year.
1.4.6 - Stock assessment in 2025 (Table A3, Figures A4-A5)
All projections described below were based on a maturation and predation model as described in the 2023 WKCAPELIN Benchmark report (ICES, 2023), with parameters estimated by the model Bifrost and data on predicted cod number and weight at age in 2026 from the 2025 JRN-AFWG assessment (Howell et al. 2025). The methodology is described in the Benchmark report (ICES 2023).
With no catch, the estimated median spawning stock size on 1 April 2026 is 29 000 tonnes (90% confidence interval: 1-46 000 tonnes) (Figure A4), and the probabilities for the spawning stock to be above 150 000 and 200 000 tonnes are 0%. Summary plots for catch, stock size and recruitment are given in Figure A5.
This year’s headline advice is thus based on a Bescapement value of 200 000 tonnes, as in previous years, but we also provide information about what the quota advice would be for a Bescapement value of 150 000 tonnes, as this value was also found to be precautionary during the HCR evaluation. The catch options are given in the text table below.
Barents Sea capelin (ICES subareas 1 and 2, excluding Division 2.a west of 5°W). Annual catch scenarios. P = probability. All weights are in tonnes.
Basis
Total catch (2026)
Median SSB (2026)
P (SSB 2026 > Bescapement) in %
% TAC change*
% advice change**
ICES advice basis
MP harvest control rule, P (SSB > Bescapement=200 000 t) = 95%
0
29 000
0
N/A
N/A
Harvest control rule with P (SSB > Bescapement=150 000 t) = 95%
0
29 000
0
N/A
N/A
*TAC (2026) vs. TAC (2025).
**Advice (2026) vs. Advice (2025).
1.4.7 - Recruitment
No 0-group estimate was yet available for 2025. The 1-group abundance in 2025 in the area covered by the survey was 33.5 billion which is much lower than the long-term average (Table A3).
High abundance of young herring (mainly age groups 1 and 2) has been suggested to be an important but not a single factor causing recruitment failure in the capelin stock (Hjermann et al., 2010; Gjøsæter et al. 2016). In 2024, high abundance of age 2-3 herring was observed during the BESS, while the abundance of age 1 was low. The strength of these herring year classes (2021-2023) in BESS 2024 is consistent with the year class strength estimated by WGWIDE in 2025 (ICES, 2025).
1.5 - References
Gjøsæter, H., B. Bogstad, and S. Tjelmeland. 2002. Assessment methodology for Barents Sea capelin, Mallotus villosus (Müller). ICES Journal of Marine Science 59 :1086-1095.
Gjøsæter, H., Hallfredsson, E. H., Mikkelsen, N., Bogstad, B., and Pedersen, T. 2016. Predation on early life stages is decisive for year class strength in the Barents Sea capelin (Mallotus villosus) stock. ICES Journal of Marine Science 73(2):182-195.
Hjermann, D. Ø., B. Bogstad, G. E. Dingsør, H. Gjøsæter, G. Ottersen, A. M. Eikeset, and N. C. Stenseth. 2010. Trophic interactions affecting a key ecosystem component: a multi-stage analysis of the recruitment of the Barents Sea capelin. Canadian Journal of Fisheries and Aquatic Sciences 67 :1363-1375.
Howell, D. et al. 2025. Report of the Joint Russian-Norwegian Working Group on Arctic Fisheries (JRN-AFWG) 2024. IMR-PINRO Report Series 6-2025, 287 pp.
ICES. 2016. Report of the second Workshop on Management Plan Evaluation on Northeast Arctic cod and haddock and Barents Sea capelin, 25–28 January 2016, Kirkenes, Norway. ICES CM 2016/ACOM:47. 76 pp. https://doi.org/10.17895/ices.pub.5296.
ICES. 2024. Working Group on Widely Distributed Stocks (WGWIDE). ICES Scientific Reports. 6:81. 913 pp. https://doi.org/10.17895/ices.pub.26993227
Tjelmeland, S. 2002. A model for the uncertainty around the yearly trawl-acoustic estimate of biomass of Barents Sea capelin, Mallotus villosus (Müller). ICES Journal of Marine Science 59 :1072-1080.
Trochta, J., B. Bogstad, Y. Kovalev, D. Prozorkevich, G. Skaret, S. Vatnehol, and D. Howell. 2024. Report on evaluation of harvest rules for Barents Sea capelin in subareas 1 and 2 (Northeast Arctic), excluding Division 2.a west of 5°W - full report. IMR-PINRO Report Series 17-2024, 45 pp.
Vatnehol, S. and Skaret, G. 2025. Comparison of historical capelin quota advice using original and updated forecast model configuration. Report series: Rapport fra havforskningen 2025-5. https://hdl.handle.net/11250/3180911 .
Appendix
Year
Winter-Spring
Summer-Autumn
Total
Norway
Russia
Others
Total
Norway
Russia
Total
1965
217
7
0
224
0
0
0
224
1966
380
9
0
389
0
0
0
389
1967
403
6
0
409
0
0
0
409
1968
460
15
0
475
62
0
62
537
1969
436
1
0
437
243
0
243
680
1970
955
8
0
963
346
5
351
1314
1971
1300
14
0
1314
71
7
78
1392
1972
1208
24
0
1232
347
13
360
1591
1973
1078
34
0
1112
213
12
225
1337
1974
749
63
0
812
237
99
336
1148
1975
559
301
43
903
407
131
538
1441
1976
1252
228
0
1480
739
368
1107
2587
1977
1441
317
2
1760
722
504
1226
2986
1978
784
429
25
1238
360
318
678
1916
1979
539
342
5
886
570
326
896
1782
1980
539
253
9
801
459
388
847
1648
1981
784
429
28
1241
454
292
746
1986
1982
568
260
5
833
591
336
927
1760
1983
751
373
36
1160
758
439
1197
2357
1984
330
257
42
629
481
368
849
1477
1985
340
234
17
591
113
164
277
868
1986
72
51
0
123
0
0
0
123
1987-1990
0
0
0
0
0
0
0
0
1991
528
159
20
707
31
195
226
933
1992
620
247
24
891
73
159
232
1123
1993
402
170
14
586
0
0
0
586
1994-1996
0
0
0
0
0
0
0
0
1997
0
0
0
0
0
1
1
1
1998
0
2
0
2
0
1
1
3
1999
50
33
0
83
0
22
22
105
2000
279
94
8
381
0
29
29
410
2001
376
180
8
564
0
14
14
578
2002
398
228
17
643
0
16
16
659
2003
180
93
9
282
0
0
0
282
2004
0
0
0
0
0
0
0
0
2005
1
0
0
1
0
0
0
1
2006
0
0
0
0
0
0
0
0
2007
2
2
0
4
0
0
0
4
2008
5
5
0
10
0
2
0
12
2009
233
73
0
306
0
1
1
307
2010
246
77
0
323
0
0
0
323
2011
273
87
0
360
0
0
0
360
2012
228
68
0
296
0
0
0
296
2013
116
60
0
177
0
0
0
177
2014
40
26
0
66
0
0
0
66
2015
71
44
0
115
0
0
0
115
2016-2017
0
0
0
0
0
0
0
0
2018
129
66
0
195
0
0
0
195
2019-2021
0
0
0
0
0
0
0
0
2022
42
23
0
65
0
0
0
65
2023
38
23
0
61
0
0
0
61
2024
118
51
0
169
0
0
0
0
2025
0
1
0
1
Table A1. Barents Sea CAPELIN. International catch (‘000 t) as used by the Working Group.
Length (cm)
Age/year class
Sum (10⁹)
Biomass (10³ t)
Mean weight (g)
1
2
3
4
5
2024
2023
2022
2021
2020
6.0-6.5
0.004
0.004
0.004
1.00
6.5-7.0
0.264
0.264
0.264
1.00
7.0-7.5
1.792
1.792
2.516
1.40
7.5-8.0
1.483
1.483
1.892
1.28
8.0-8.5
2.386
0.410
2.796
5.909
2.11
8.5-9.0
2.705
0.021
2.726
6.957
2.55
9.0-9.5
2.496
2.496
7.669
3.07
9.5-10.0
3.841
0.142
3.984
14.475
3.63
10.0-10.5
3.827
0.066
3.894
16.864
4.33
10.5-11.0
4.114
0.278
4.393
21.513
4.90
11.0-11.5
4.331
0.508
4.839
27.889
5.76
11.5-12.0
3.281
0.651
3.932
27.992
7.12
12.0-12.5
1.228
0.712
1.940
15.743
8.12
12.5-13.0
1.239
0.966
2.205
21.012
9.53
13.0-13.5
0.357
1.260
0.012
1.628
17.659
10.85
13.5-14.0
0.151
1.970
0.011
2.133
27.047
12.68
14.0-14.5
0.031
1.127
0.029
1.187
16.739
14.10
14.5-15.0
1.549
0.086
0.006
1.641
25.674
15.64
15.0-15.5
0.607
0.157
0.129
0.894
15.585
17.44
15.5-16.0
0.502
0.310
0.053
0.007
0.873
16.383
18.77
16.0-16.5
0.146
0.339
0.113
0.036
0.633
13.460
21.26
16.5-17.0
0.422
0.151
0.573
13.662
23.83
17.0-17.5
0.123
0.109
0.027
0.259
6.778
26.16
17.5-18.0
0.166
0.334
0.500
13.666
27.31
18.0-18.5
0.042
0.007
0.049
1.477
30.12
18.5-19.0
0.007
0.007
0.195
28.47
19.0-19.5
0.001
0.001
0.022
29.00
TSN (109)
33.531
10.916
1.705
0.903
0.071
47.126
TSB (103 t)
150.895
127.728
37.259
21.402
1.762
339.045
Mean length (cm)
10.11
13.31
16.32
16.84
16.61
Mean weight (g)
4.50
11.70
21.85
23.71
24.83
7.19
SSN (109)
0.031
3.931
1.682
0.903
0.071
6.618
SSB (103 t)
0.441
63.093
36.943
21.402
1.762
123.641
Table A2. Barents Sea CAPELIN. Stock size estimation table. Estimated stock size (109) by age and length, and biomass (1000 tonnes) from the acoustic survey in August-October 2025. TSN: Total stock number. TSB: Total stock biomass. MSN: Maturing stock number. MSB: Maturing stock biomass.
Year
Stock in numbers (10⁹)
Biomass (10³ tonnes)
Age 1
Age 2
Age 3
Age 4
Age 5
Total N
Total BM
MSB
1973
528.5
375.0
39.8
17.1
0.2
960.5
5146.2
1349.7
1974
304.8
547.4
173.1
3.4
0.1
1028.8
5738.1
907.1
1975
190.4
348.1
295.7
86.4
0.3
920.8
7815.8
2915.7
1976
210.8
233.1
163.0
76.6
12.4
695.8
6420.4
3200.3
1977
359.8
174.8
98.5
40.3
7.3
680.8
4802.8
2676.2
1978
83.5
391.7
75.8
8.9
0.7
560.6
4247.5
1402.0
1979
12.0
333.4
113.8
4.9
0.1
464.1
4160.9
1226.6
1980
269.9
195.8
155.3
33.0
0.3
654.3
6723.5
3913.4
1981
402.6
195.3
48.0
13.8
0.3
659.9
3892.1
1551.5
1982
528.3
147.6
56.8
2.2
734.9
3778.2
1591.0
1983
514.9
200.2
38.1
0.4
753.5
4225.4
1328.7
1984
154.8
186.7
48.2
3.1
392.7
2964.3
1207.9
1985
38.7
48.3
20.7
0.9
108.6
857.4
285.1
1986
6.0
4.7
3.3
0.3
14.3
120.2
65.1
1987
37.6
1.7
0.1
0.0
39.4
100.1
16.9
1988
21.0
28.7
0.2
49.9
427.3
200.3
1989
189.2
17.7
2.5
0.0
209.5
868.9
173.6
1990
700.4
177.6
16.2
0.1
894.3
5837.8
2617.0
1991
402.1
580.2
32.9
1.2
1016.4
7281.8
2248.0
1992
351.3
196.3
128.8
1.3
677.7
5155.0
2228.3
1993
2.2
53.4
17.3
2.4
75.3
796.8
330.1
1994
19.8
3.4
4.3
0.2
27.7
199.1
94.4
1995
7.1
8.1
1.5
0.3
17.2
193.6
118.4
1996
81.9
11.5
2.1
0.1
95.6
502.1
248.4
1997
98.9
39.1
1.9
0.1
140.0
910.0
312.1
1998
179.0
72.6
10.5
0.6
0.1
262.9
2054.7
931.7
1999
155.9
101.5
26.5
0.9
284.8
2774.1
1717.8
2000
449.2
110.6
34.1
0.8
0.1
594.7
4273.8
2096.7
2001
113.6
218.7
30.5
1.1
0.1
363.9
3629.1
2018.8
2002
59.7
90.8
50.2
0.6
201.3
2208.7
1289.6
2003
82.4
9.6
11.0
1.4
104.4
533.6
279.6
2004
62.1
17.0
4.4
0.7
0.1
84.2
513.8
225.1
2005
22.7
21.3
3.6
0.3
0.0
47.9
497.9
354.7
2006
57.3
16.8
5.1
0.1
0.0
79.3
637.2
347.7
2007
195.1
50.1
5.8
0.3
251.3
1816.3
845.9
2008
292.4
198.1
24.1
0.5
515.1
3951.3
2185.6
2009
172.8
148.6
48.1
0.0
369.4
3247.1
1891.8
2010
243.6
137.1
67.1
1.6
449.5
3823.6
2247.7
2011
194.3
173.3
57.7
7.8
433.0
3603.6
2059.2
2012
176.1
117.0
88.3
3.0
384.4
3456.8
1996.3
2013
323.8
197.5
67.6
11.9
0.0
600.8
3972.8
1725.0
2014
103.1
81.0
37.4
1.9
223.4
1688.8
784.5
2015
37.8
42.4
12.9
1.0
94.0
878.5
434.0
2016
32.6
7.9
2.3
0.1
42.9
316.7
153.3
2017
115.4
119.0
14.0
0.3
248.7
2428.5
1546.8
2018
58.8
60.9
22.5
0.4
0.0
142.6
1641.0
1100.2
2019
18.0
9.6
6.8
1.2
0.0
35.7
413.3
302.4
2020
370.0
31.3
4.1
0.8
0.0
406.2
1890.4
542.4
2021
222.7
326.4
7.4
0.0
556.6
3987.1
1459.5
2022*
75.5
135.8
57.7
1.2
0.0
270.2
2173.7
817.5
2023
108.5
80.3
107.4
23.9
0.2
320.3
2951.7
1285.9
2024
58.6
19.8
13.4
11.1
1.5
104.5
886.7
533.5
2025
33.5
10.9
1.7
0.9
0.1
47.1
339.0
123.6
Average
179.8
134.1
44.5
7.0
0.4
365.9
2712.4
1198.2
Table A3. Barents Sea CAPELIN. Stock size in numbers by age, total stock biomass, biomass of the maturing component (MSB) at 1. October. The stock numbers for 2004-2021 are updated following the data evaluation workshop in 2021, and the subsequent WKCAPELIN benchmark in 2022. The comparison with previous estimates is presented in detail in Annex3 number BS0 in the WKCAPELIN benchmark report (ICES, 2023).
*Not adjusted for incomplete area coverage
Year
CV age 1
CV age 2
CV age 3
CV age 4
CV age 5
2004
0.253
0.235
0.225
0.513
2005
0.319
0.332
0.375
0.508
2006
0.301
0.240
0.344
0.705
2007
0.197
0.232
0.331
0.665
2008
0.228
0.198
0.302
0.634
2009
0.455
0.370
0.453
1.680
2010
0.163
0.224
0.199
0.288
2011
0.231
0.205
0.276
0.463
2012
0.210
0.314
0.335
0.605
2013
0.132
0.127
0.138
0.267
2014
0.237
0.213
0.237
0.331
2015
0.235
0.252
0.234
0.364
2016
0.167
0.237
0.305
0.491
2017
0.182
0.099
0.123
0.407
2018
0.288
0.255
0.276
0.441
2019
0.138
0.322
0.355
0.405
2020
0.241
0.269
0.338
0.501
2021
0.168
0.102
0.299
1.301
2022
2023
0.280
0.170
0.170
0.200
2024
0.196
0.218
0.211
0.230
0.336
2025
0.297
0.375
0.416
0.649
0.653
Table A4. Barents Sea CAPELIN. CV by age group of the acoustic estimates shown in Table A3, for the period 2004-2025.
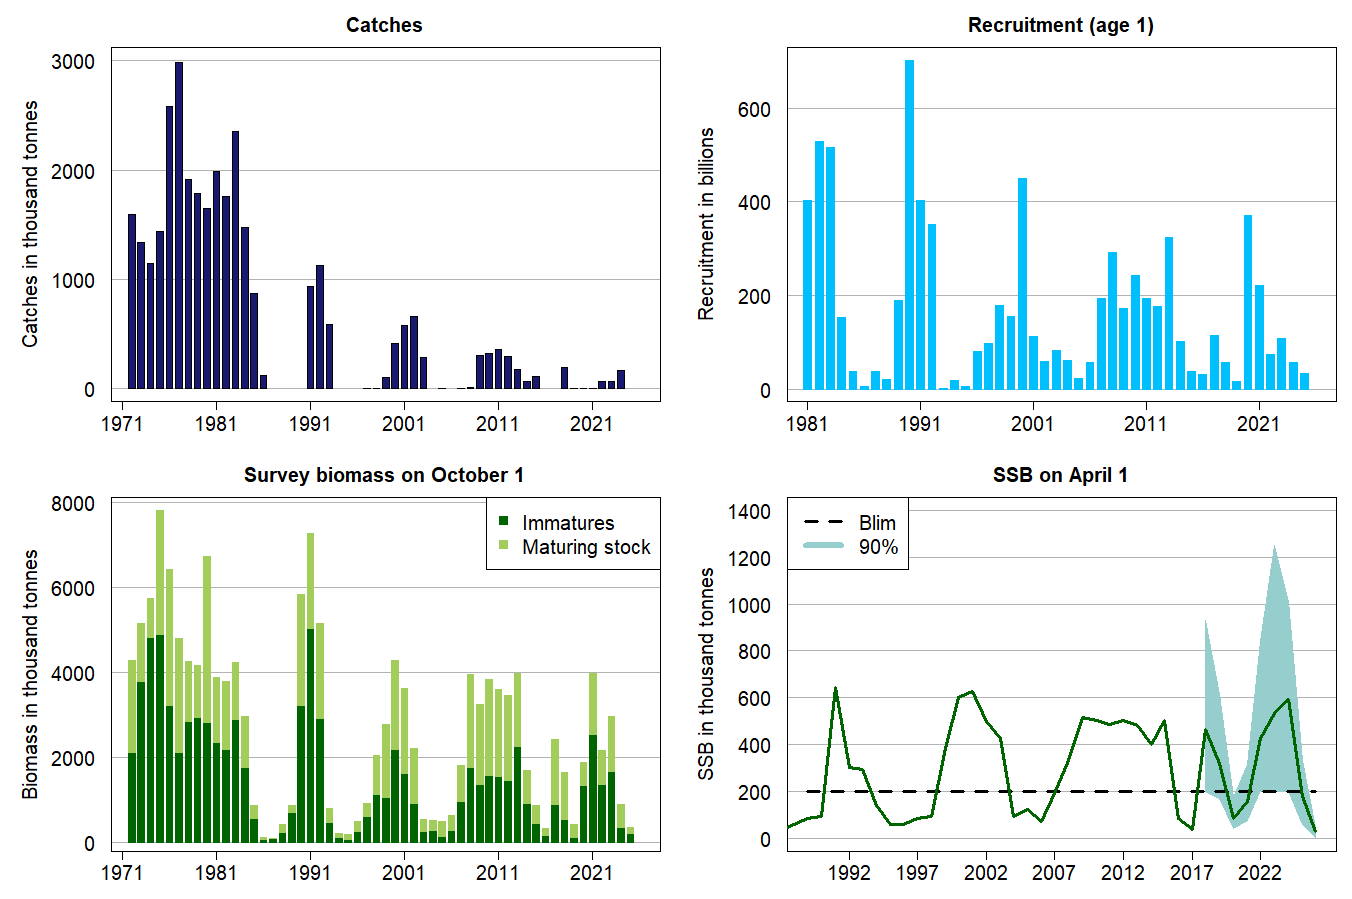
Figure A1. Survey coverage and geographical distribution of acoustic recordings of capelin in autumn 2025 and 2024. The size of the circles corresponds to nautical acoustic scattering coefficient (NASC; m2/nmi2) per 1 nautical mile.
Figure A2. Weight-at-age (grams) for capelin from the autumn survey.
Figure A3. Survey mortality by survey year. Survey mortality in year y+1 is calculated as -log((N age (a+1) in year (y+1) + catch immatures of age a in year y and year (y+1))/N immatures age a in year y). Capelin >14.0 cm are assumed to be maturing.
Figure A4. Probabilistic prognosis 1 October 2025—1 April 2026 for Barents Sea capelin maturing stock, with zero catch. Yellow line shows median, green area shows 25-75 percentiles and red area 5-95 percentiles. Bescapement is shown in black as a dashed line. Based on 50 000 simulations.
Figure A5. Capelin in subareas 1 and 2, excluding Division 2a west of 5°W (Barents Sea capelin). Catch, recruitment and summary of stock assessment (maturing and immature stock biomass October 1 and SSB April 1 in 1000 tonnes). The 2022 estimate of maturing and immature stock biomass is not corrected for incomplete survey coverage.