Report series:
Rapport fra havforskningen 2022-18ISSN: 1893-4536Published: 24.06.2022Updated: 27.10.2022Project No.: 15570On request by: FAO. Fisheries and Aquaculture Department, Food and Agriculture Organization of the United Nations, Rome, ItalyReference: Maria del Mar Mancha-Cisneros (Duke University, USA) and Giulia Gorelli (FAO, Italy) Research group(s):
Fisheries dynamics
Program:
Coastal Ecosystems Approved by:
Research Director(s):
Geir Huse
Program leader(s):
Jan Atle Knutsen
Det norske småskalafiskeriet og databidrag til FAO-Duke-WorldFish prosjekt
Denne rapporten beskriver norske fiskerier med fokus på norsk småskala fiskeri (SSF), definert som fiske med fartøyer mindre enn 15 meter innenfor 12 nautiske mil, og er en del av FAO-studien Illuminating Hidden Harvest (IHH). Rapporten beskriver norsk SSF og hvordan de norske dataene har blitt inkludert i IHH-databladene for årene 2013-2017. De samme fartøyene i denne flåten deltar i forskjellige fiskerier i løpet av året i forskjellige områder og ofte med ulike fiskeredskaper. Gjennomsnittsalderen for fartøyene i 2017 var om lag 23 år og gjennomsnittlig mannskap om bord på de minste fartøyene (<11m) var 1,6 personer og på de større fartøyene (11-14,99m) 2,7 personer. Fartøyer som ikke er registrert i “Merkeregister”, men med tillatelse til å fange og selge fisk for en verdi av 50 000 NOK per år, er referert til som NORFISHSUB009. Fangst for egen husholdning uten markedsverdi omtales som NORFISHSUB999. I Norge er planlagt «fangst og utsetting» forbudt, men tillatt hvis fisken er uskadd og under minimumsstørrelse.
Den norske totale årlige SSF-fangsten har vært ganske stabil, ca 222 000-256 000 tonn for 2013-2017 med et gjennomsnitt på 233 391 tonn som er omtrent 10% av den totale fangsten i det norske fiskeriet. Verdien av SSF-fangsten økte fra 2064 millioner kroner i 2013 til 3562 millioner kroner i 2017, med et gjennomsnitt på 2880 millioner kroner som er omtrent 18% av verdien av det totale norske fiskeriet. Det industrielle storskala fiskeriet med fartøyer over 15 meter er den dominerende delen av det norske fiskeriet både i volum og verdi.
Rapporten beskriver det norske småskala-fisket både med hensyn til artssammensetning, fangstkvantum og -verdi, fangstanvendelse, fartøyer, bemanning, redskaper og drivstofforbruk ("miljø fotavtrykk").
Summary
This report describes the Norwegian fisheries with a focus on Norwegian small-scale fishing (SSF), defined as fishing with vessels less than 15 meters within 12 nautical miles, and is part of the FAO-Duke-WorldFish project Illuminating Hidden Harvest (IHH). The report describes the Norwegian SSF and how the Norwegian data have been included in the IHH data sheets for the years 2013-2017. The same vessels in this fleet participate in different fisheries during the year in different areas and often with different fishing gear. The average age of the vessels in 2017 was about 23 years and the average crew on board the smallest vessels (<11m) was 1.6 people and on the larger vessels (11-14.99m) 2.7 people. Vessels that are not registered in the "Mark Register", but with permission to catch and sell fish worth NOK 50,000 per year, are referred to as NORFISHSUB009. Catch for own household without market value is referred to as NORFISHSUB999. In Norway, planned "catching and release" is prohibited, but permitted if the fish is undamaged and below the minimum size.
The Norwegian total annual SSF catch has been fairly stable, approximately 222,000-256,000 tonnes for 2013-2017 with an average of 233,391 tonnes, which is approximately 10% of the total catch in the Norwegian fisheries. The value of the SSF catch increased from NOK 2,064 million in 2013 to NOK 3,562 million in 2017, with an average of NOK 2,880 million which is approximately 18% of the value of the total Norwegian fishery. The large-scale industrial fishing with vessels over 15 meters is thus the dominant part of the Norwegian fishery both in volume and value.
The report describes Norwegian small-scale fishing both in terms of species composition, catch quantity and value, catch utilization, vessels, manning, gear and fuel consumption ("carbon footprint").
27.10.2022: Corrections: The word «extracted» has replaced the word “subtracted” several places in chapter 3.1.3, and a new sentence has been added in chapter 5.2 for clarification.
1 - Introduction
The present report covers the Norwegian small- and large-scale marine fisheries and is part of the FAO-Duke-WorldFish project Illuminating Hidden Harvest (IHH ). In 2012 the World Bank, FAO and WorldFish completed a study entitled “ HIDDEN HARVEST: The Global Contribution of Capture Fisheries (World Bank, 2012). This study provided essential information and estimates on the large role of small scale fisheries (SSF) within the world’s fisheries. However, many of the potential role of socio-economic contributions from these fisheries still remain underappreciated in helping to end poverty and hunger toward achieving the first two Sustainable Development Goals. Thereby leading to insufficient attention and support from policy makers for implementation of the SSF Guidelines. For this reason, FAO, WorldFish and Duke University collaborate on a new global study entitled “Illuminating Hidden Harvests (IHH). The Contribution of Small-Scale Fisheries to Sustainable Development” that aims to help fill this gap, and particularly to highlight the role that SSF could play in achieving the Sustainable Development Goals.
The new global study aims to investigate the social, environmental, economic and governance contributions of SSFs at local and global scales. The study will apply different methods to leverage local and global data to provide a broader perspective than what is currently available about the contributions and impacts of SSF to sustainable development. The study is based on three levels:
To provide the most accurate description to date of the SSF sector at country level for the years 2013-2017.
To leverage global datasets by correcting for misreporting and/or applying ratio estimates to disaggregate contributions from SSF and large-scale fisheries (LSF).
To develop and document a methodology to assess the contribution and impacts of small-scale fisheries to sustainable development that is suitable for each country’s context and data availability.
Norway was not a part of the 2012 study. The present report describes how Norway defines its SSF and how the Norwegian data have been collected and adapted to be included in the IHH datasheets for the years 2013-2017. The Norwegian SSF is described both in terms of species composition, catch quantity and value, catch utilization, vessels, manning, gear and fuel consumption ("carbon footprint").
2 - Definitions and fisheries
The definitions of the Small-Scale Fisheries (SSF) and Large-Scale Fisheries (LSF) in this report are:
SSF:
fishing vessels registered in the “Merkeregister” (The Norwegian Fishing Vessels Register/Register over merkepliktige norske fiskefartøy) participating in the Norwegian SSF with length overall (LOA) below 15-meter and fishing within the Norwegian 12. nautical miles zone.
The fishery is carried out in the Norwegian fjords and along the coast that stretches from the Swedish border in the south to the Russian border in the north covering parts of Skagerrak, the North Sea, the Norwegian Sea and the Barents Sea. The straight coastline is 26 700 km long and 83 300 km including the fjords and islands. The same vessels in this fleet take part in different fisheries during the year in different areas and often with other specific fishing gears. The average age of the vessels in 2017 was about 23 years and the average crew on board the smallest vessels (<11m) was 1.6 persons and on the larger vessels (11-14.99m) 2.7 persons.
fishing vessels with a registered number, but expired at the last day of fishing, below 15- meter LOA and fishing inside 12. nautical miles zone.
fishing vessels not registered in the “Merkeregister” but with a license to only fish with beach seines, vessels not registered in the “Merkeregister” but with the permit to catch and sell fish for a value of 50 000 NOK per year, fishing within the Norwegian 12 nautical miles zone and referred to as NORFISHSUB009 in IHH-sheet 1_ENV_catch_SSF (for IHH sheets see section 3.1).
Listed in IHH-sheet 1_ENV_catch_SSF , but not included as part of SSF in the sheet 2_ENV_ catch LSF , is the recreational fishing, that contribute significantly to the household supply. In Norway, planned fishing by “catch and release” is forbidden, but allowed if the fish is unhurt and below minimum size. Catch for household with no marked value is referred to as NORFISHSUB999.
Henriksen (2014) describes the Norwegian SSF fleet and fishery based on data and information from the Norwegian Directorate of Fisheries. The fleet is divided in three groups: <11m and 11-15m (as our definition) and 15-21m. Nedreaas et.al (2015, 2016) give a brief summary of the Norwegian fishery to the Sea Around Us project ( www.seaaroundus.org ).
All catches have to be sold through the sales organisation that has a regional sale’s monopoly and the right to grant permission for where to sell/land the catch in Norway or in a foreign country. All landings both in Norway and abroad have to be reported to and registered through the sale’s organisation and the Directorate of Fisheries. Cooperation between Norway and European countries with exchange of information on landings, gives a valuable control, conducted by the Directorate of Fisheries.
LSF:
all vessels registered in the “Merkeregister” above 15-meter LOA, fishing both outside and inside of 12 nautical miles.
all vessels below 15-meter LOA, fishing outside 12 nautical miles. However, there are only few vessels/occations of this kind and are therefore included in other SSF data.
The SSF fleet is certified to fish everywhere except beyond legal distance from coast (due to safety) and in protected areas. The LSF fleet has no such outer limits. However, they are limited by so called fjordliner north of 62 o . Fjordliner are outer limits of coastal areas where fisheries are limited or closed. The LSF fleet can use trawls and purse seines outside 12 nm, but in some areas and seasons they are allowed to fish with such gears into 4 nm if bycatch of undersized and protected species are kept below limits. For more details, we refer to the official Norwegian regulations (Forskrift om utøvelse av fiske i sjøen, see www.lovdata.no).
The Norwegian LSF fleet are mostly active in the ICES (International Council for the Exploration of the Sea) and the NAFO (North Atlantic Fisheries Organization) areas, but also in the CCAMLR (Commission for the Conservation of the Antarctic Marine Living Resources) area, and occasionally in joint ventures in other areas.
2.1 - The Norwegian Small Scale Fishery (SSF)
The only part of the Norwegian fishery that is so called hidden harvest is the recreational fisheries which do not enter into the market. This fishery, named NORFISHSUB99 in the Norwegian IHH study, is carried out by vessels/persons fishing for household supply for private consumption. A catch and release fishery might be part of hidden harvest, but this is so far forbidden in Norway. All other fisheries are regulated and included in the official Norwegian statistics.
The present study does not include the inland fishery that is managed by a different ministry and directorate. However, the catches are negligible. There are no official catch statistics from this fishery, but catches are estimated at 8 000-10 000 tons per year (Anon, 2010).
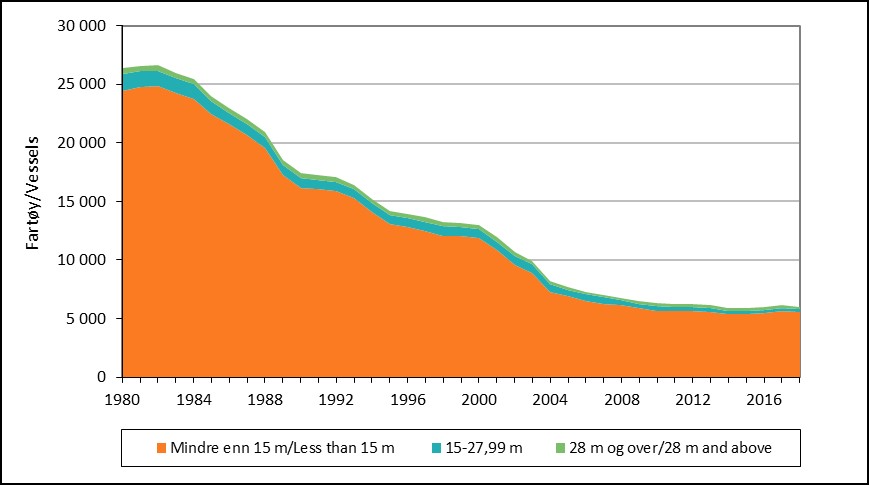
The SSF fleet totally outnumber the LSF fleet. At present about 5 000 vessels take part in the Norwegian SSF, and that is only 1/5 of the vessels participating in 1980 (Figure 1).
Figure 1. Number of Norwegian fishing vessels by length group (1980-2018).
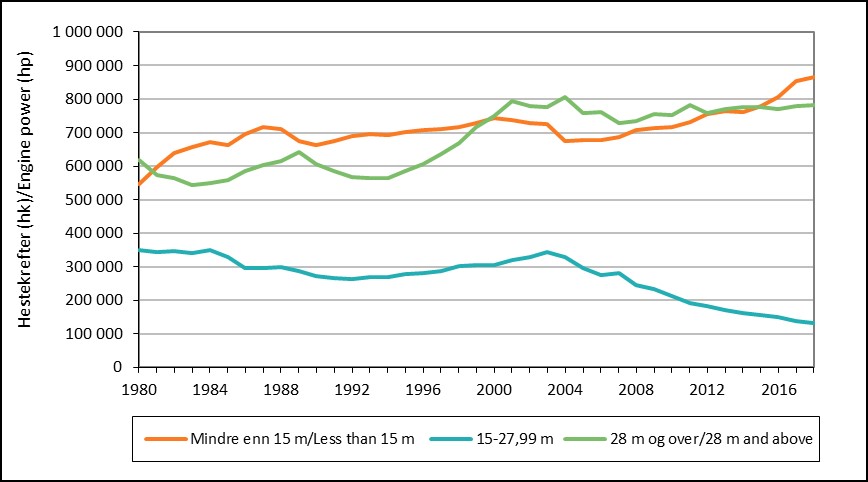
The development of the total engine power of the different Norwegian fleet segments are given in Figure 2.
Figure 2 . Total engine power (hp) by vessel length group (1980-2018).
The IHH requirements to convert information from stocks to FAO species codes, eliminates the possibility to elaborate information on stocks level, necessary to understand the Norwegian fishery management system. The management regulates the important fisheries according to stocks and if possible fishery data are also collected by stock. The Norwegian SSF exploits and lands about 70 different species. The same species can belong to different stocks that are managed individually by the Norwegian Directorate of Fisheries/Ministry of Fisheries. As an illustration, the FAO-code COD and HER represents fisheries in Norway that takes place on more than one stock:
COD : The North-East Artic Cod stock, defined as mostly located north of 62oN is of very high importance to the small-scale fisheries. This stock is in healthy condition. But the SSF fleet also catches cod from the North Sea- and the Coastal stocks, both in more serious conditions.
HER: The Norwegian Spring-spawning herring, North Sea herring, Western Baltic herring and local fjord stocks.
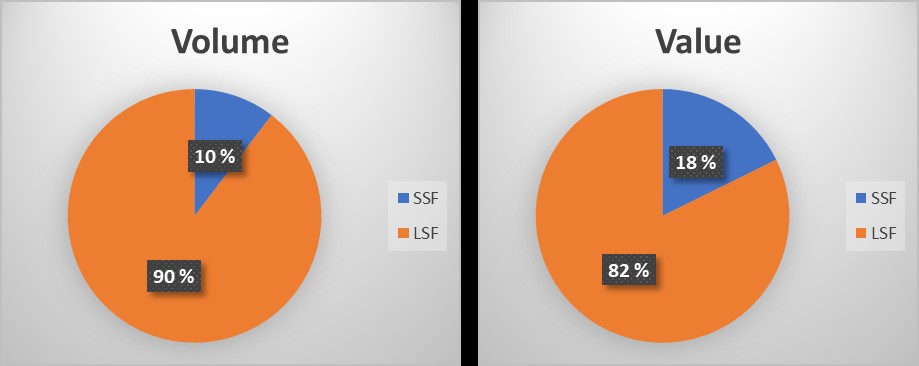
The total yearly SSF catch has been quite stable, about 222 000-256 000 tons for 2013-2017 (Table 1 and Figure 3) with an average of 233 391 tons which is about 10% of the total catch in the Norwegian fisheries. The value of the SSF catch increased from 2064 mill NOK in 2013 to 3562 mill NOK in 2017, with an average of 2880 mill NOK which is about 18% of the value of the total Norwegian fishery. The LSF fishery is the dominant part of the Norwegian fishery both in volume and value (Figure 3).
Table 1. Average catch (2013-2017) and average values (NOK) for the most important species in the SSF fishery and their relative importance to the total Norwegian fishery (SSF+LSF).
SSF % of total Norwegian
SSF
fishery (SSF+LSF)
Tons
Mill NOK
Catch
Value
Cod
129552
1394.6
5.8
8.6
Herring
22758
114 .9
1.0
0.7
Saithe
21142
155.8
0.9
1.0
Haddock
16116
143.4
0.7
0.9
Mackerel
12286
82.5
0.5
0.5
Crustaceans
7120
284.4
0.3
1.7
Shrimp
3592
174.3
0.2
1.1
Other fish
20826
529.7
0.9
3.3
Total
233391
2879.7
10.4
17.7
Figure 3 . The average volume (left) and value (right) of the small-scale fisheries (SSF) versus the large-scale fisheries (LSF) in the period 2013-2017.
The cod dominates the SSF fishery accounting for 5.8% of quantum and 8.6% of the value of the total Norwegian fishery. The SSF fleet catch on average 29.5% of the Norwegian catch of cod.
Herring is the second most important species in the Norwegian SSF and LSF fisheries. Cod and herring complement each other when it comes to nutrient content (Table 2). Herring is an oily species and thus a good source of the fatty soluble vitamins A and D, and the very long-chained polyunsaturated fatty acid docosahexaenoic acid (DHA). Cod is regarded a lean fish and a good source to iodine. All species are valuable sources of highly bioavailable proteins.
Table 2. Nutrient content (edible part, wet weight) in the seven most important species in the Norwegian small-scale fisheries (SSF). Values given as mg/100 g for all nutrients except proteins which are given as g/100 g.
Species
Latin name
Protein (crude)
Total fat
Vitamin A1
Vitamin D3
Vitamin B12
Calcium
Iron
Iodine
Zinc
DHA*
Cod
Gadus morhua
17.8
1.10
0.0051
< LoQ
1.01
ND
0.11
0.190
0.37
211
Herring
Clupea harengus
17.8
12.5
0.038
0.028
12.0
ND
1.0
0.017
0.66
688
Saithe
Pollachius virens
19.4
1.40
0.018
< LoQ
3.44
ND
0.36
0.790
0.45
307
Mackerel
Scomber scombrus
16.9
17.6
0.010
0.004
9.90
ND
0.84
0.019
0.57
2030
Edible crab
Cancer pagurus
15.2
0.97
ND
<LoQ
4.60
ND
0.35
0.11
7.60
51.5
Red king crab
Paralithodes camtschaticus
16.0
1.50
<LoQ
<LoQ
5.65
110
0.40
0.058
3.80
108
Shrimps
Pandalus borealis
23.2
2.00
<LoQ
<LoQ
3.26
ND
0.49
0.031
1.40
167
* Docosahexaenoic acid (very long-chained polyunsaturated fatty acid)
LOQ: Limit of quantification; ND: no data. Data retrieved from https://sjomatdata.hi.no/#search/
The average numbers of fishing days per vessel for the SSF fleet decreased from 150 days in 2013 to 108 days in 2017, while the daily fuel (diesel) consumption for the SSF fleet almost doubled from 106 400 liters to 207 200 liters in the same period.
Since the SSF is carried out by a variety of vessels with different gears on several species it is problematic to calculate a robust overall catch per unit effort (CPUE; Annex 2). Catch per liter diesel consumed by the conventional Norwegian SSF fleet is therefore probably a better proxy for CPUE than catch per fishing time unit (see Table 1 in ANNEX 2). The LSF CPUE for 2013-2017 varied between 4.2 and 5.2 kg/liter fuel, while the SSF catch per liter fuel was about 2-3 times higher and was reduced by about 30% from 2013 to 2017, from 14.4 kg/liter to 10.1 kg/liter (ANNEX 2).
The annual footprint defined as emission of CO2 for the SSF increased from 41 500 tons in 2013 to about 58 200 tons in 2017. The average annual footprint for the LSF was about 20 times higher than for the average annual SSF footprint and increased from 970 000 tons in 2013 to 1 172 000 tons in 2017 (ANNEX 2).
Scientists in ICES evaluate the stocks and give advice on the fishing pressure (fishing mortality) on different stocks. These advices are important and basic parts of governmental fishery management of regulations and their implementation. Most of the stocks caught by the Norwegian SSF are evaluated by ICES. Of the Norwegian SSF catches in 2017 were:
93.4% of the catch were from stocks evaluated as sustainable.
6% from stocks not evaluated.
0.6% from stocks evaluated as not sustainable.
About 90% of the Norwegian SSF are regulated by quotas and the rest by other regulations as minimum/maximum legal landing size, open/closed areas or seasons, by-catch and discard bans etc. by Norwegian authorities (ANNEX 1, and Gullestad et al. 2017).
2.2 - The Norwegian Subsistence Fishery
In the IHH project the subsistence fishery in Norway has been splitted in one commercial part entering the public market (NORFISHSUB009 or Subsistence Type 1) and one part including the Norwegians' own household fish (NORFISHSUB999 or Subsistence Type 2). The first part is included in the 1_ENV_catch_SSF , 2_ENV_catc h_ LSF and the 3_ENV_Catch_use spread sheets. The latter part is only shown as fishing unit NORFISHSUB999 in the spread sheet 1_ENV_catch_SSF .
A private Norwegian citizen, a vessel with several fishers, or a non-commercial event (like fishing competitions) are allowed to sell fish for up to NOK 50 000 per calendar year. North of 62 ° N, these fishers can fish and land a maximum of 2 000 kg of cod (round fish) for sale per calendar year. South of 62 ° N, they can fish and land a maximum of 1 000 kg of cod (round fish) for sale per calendar year.
Currently, the only survey of marine household fishing by Norwegian (i.e., subsistence fishery) was conducted in 2003 by Hallenstvedt and Wulff (2004). A representative sample of the Norwegian population over 15 years of age were interviewed and asked to give catch per trip and total annual catch by species. In this survey, 43% reported that they had fished in the sea last year, or about 1.5 million people nation-wide.
Data from Hallenstvedt and Wulff (2004) show that the Norwegian population caught approximately 48 000 tons in 2003 for personal-, family- and household-consumption. The eastern, western and central Norway regions caught approximately 10 000 tons each, in total 30 000 tons, while in northern Norway the catch was estimated at 18 000 tons.
All catches delivered to sales organizations by private Norwegian citizens not registered as commercial fishermen, are included in the officially reported landings statistics of the commercial fishery with a particular statistical code. These reported catches, amounted to 3 320 tons in 2002 and have to be subtracted from Hallenstvedt and Wulff’s estimate. This then gives approximately 45 000 tons in 2003 (all species) for non-commercial personal-, family- and household-consumption.
In Norway, each commercial fisher has the right to take home so called cooking fish for their own household consumption. This fish is not reported, and hence a hidden harvest. The value of fish from their own catch taken out privately is taxable income. Each commercial fisher is taxed with NOK 1 500 (2017) per household member. Based on responses from coastal fishermen, it seems that 100 kg per fisherman per year can be a representative figure. For the 4 360 vessels less than 11 meters with on average 1.5 fishers, this amounts to 654 tons, and likewise for the 642 vessels between 11-15 meters with on average 2 fishers on board, this amounts to 128 tons. We have hence rounded up the amount of cooking fish for the SSF to be 1 000 tons per year.
The not traded part of the Norwegian subsistence fishery, i.e. the real subsistence fishery, has in this project been set to 46 000 tons per year, including 1 000 tons "take home" fish by commercial fishers, hereof approximately 23 000 tons cod, 8 500 tons saithe, 8 500 tons mackerel and 6 000 tons others. This subsistence fishery will have impact on the Norwegian citizens’ purchase of fish in the market. These catches are not included in Table 1.
The vessels participating in the subsistence fishery are not licensed or registered in the fishing vessel register. The number of vessels in the Subsistence Type 1 fishery in 2017 was, according to the voluntary small vessel register, 1 800 which was 90% more than in 2013. The number of vessels in the first years of the time series are probably underestimated due to lack of vessel registered in the voluntary vessel register.
3 - Methodology to adapt Norwegian data to the IHH files
The Norwegian IHH files (EXCEL sheets) are stored in both the FAO/Duke/WorldFish- and IMR data banks. These data sheets can be made available upon request to IHH-Small-Scale-Fisheries@fao.org , one of the co-authors or postjournal@hi.no.
Customized SQL scripts were written for each task and run on the Directorrate of Fisheries' databases. Further information on definitions are given for each variable below.
All information is related to marine water including fjords. Harvests of seaweeds are not included.
The Norwegian marine SSF and LSF data have been filled in/converted to the IHH-format accordingly:
We have retrieved and adapted data available from the Norwegian Directorate of Fisheries, the Institute of Marine Research and data directly available in web sites of relevant institutions.
If data were not directly applicable, we have used proxies when we found it possible and relevant.
Where this has not been possible, we consider the work too extensive to collect and adapt the data and it might also involve new research and thereby outside the present scope of the IHH study. In thesecases and when no data exist we have used ND.
Our data only includes fisheries carried out by vessels (including beach seines) and fishers fishing. Subsistence fisheries Type 2 includes fishing from land.
The subsistence fishery in Norway is composed of one commercial part entering the public market (denoted as Subsistence Type 1) and one part including Norwegian’s own household (denoted as Subsistence Type 2).
Recreational catches by Norwegian citizens and foreign tourists are not included in this study.
The report includes 6 ANNEXES.
For the demersal fisheries the areas are divided according to north and south of the 62-degree latitude. This is useful for some of the species but do not for all. We have also given Fishing Unit name and areas name to illustrate different fisheries along the coast where the regional dimensions are important. The Fishing Units also takes into consideration four different gear groups.
3.1 - The Norwegian IHH-files
3.1.1 - Environmental
Species, landed catch, live weight equivalent catch (nominal catch) and conversion factors The species and catch information in ENVIRONMENTAL are extracted from a database at the Norwegian Directorate of Fisheries. This database contains the basis for producing the official Norwegian fisheries statistics, published through Statistics Norway.
Information on species are collected from the database at the Directorate of Fisheries. Each first-hand sales note is registered upon landing and sale and submitted electronically to the sales organisation with the geographic/ species monopoly covering the landing place. The fisheries statistics is based on live weight directly or by calculate live weight from product landed applying conversion factors.
The conversion factors for the most important shared stocks north of 62oN, are established through a cooperation program between Norway and Russia.
The established average conversion factors are based on data-collection from representative areas and seasons and gears. In relation to SSF catch, large part of the catch of cod takes place in the spawning season north of 62oN. The use of average conversion factors could therefor slightly underestimate the catch of cod for the SSF fleet defined in NORFISHDEM112.
The FAO species code PEL, GRO, CRU are used as explained in ANNEX 3.
A list of all species specified on year, vessel length groups, horsepower groups, intended use groups and FAO species gives more than 16 700 records and therefore have to be grouped.
Sheet 1_ENV_catch_SSF and Sheet 1_ENV_catch_log:
3.1.2 - Fishing Unit Unique ID
One of the characteristics of Norwegian fishery is the high degree of flexibility in the use of different types of gear and targeting different species by the same vessels, especially for the SSF fleet but also for the LSF fleet. Therefore one vessel most likely will by present within more than one Fishing Unit group. The number of vessels in sheet 1_ENV_catch_SSF will therefore not be unique and are not included for each fishing unit-ID but presented for length groups less than 11m and 11-14.99m.
The Norwegian Profitability study classifies each vessel in the study uniquely into one defined group. This will be too time consuming to do in this study. To exemplify the large flexibility of the fleet, the vessels classified in the study as below 11 meter , using conventional gear (i.e. passive gear and Danish seine) targeting cod, wrasses, king crab, haddock, prawns, Greenland halibut, pollock, halibut, herring, edible crab, and a lot of other species, listed according to value, with cod as the most important.
For the vessels between 11 and 14,99 meters, using conventional gear, targeted species are cod, prawns, herring, pollock, haddock, Greenland halibut, mackerel, ling, king crab, halibut and other species.
This illustrates the mixture of target species, using different gears and fishing for both demersal, pelagic and crustacean species by one vessel. This flexibility maintains the possibility to have a steady income, even in times where quotas on one species are reduced.
The Fishing Unit Unique ID also partly illustrate some important regulation aspects for different stocks. In Norway, the regulations are most often by stocks. Since FAO fish codes does not take stocks into consideration, the north/south division on demersal species, are the closest approximation.
3.1.3 - Taxonomic resolution
The Norwegian SSF fleet exploits 69 different species. It was impossible to treat all of them individually. The most important species both in tonnages and values are treated individually, but the others are treated in different taxonomic groups. These might be slightly different form year to year since some of the group’s species were not caught every year.
The SSF fisheries is divided into ten groups, with an additional group added for information:
The Norwegian management for fish species focus on both stock, gear used and vessels quotas are partly distributed according to vessel-size groups for the small scale fisheries.
The definitions of the Norwegian Fishing Units Unique ID are based on fishing groups, area, gears and target species :
The Unique code begins with NORFISH according to IHH.
Most important species group are then presented as PEL=pelagic, DEM=demersal, CRU= crustaceans, OTH= species not included in the previous, SUB=subsistence.
Of the three last digits the first illustrates the regulation along the coast, where stocks often differ between north and south of 62 o N. (0= no division of the coast, 1= north of 62 o N, and 2= south of 62 o N and 9=not specified).
The second digit refers to the gear groups (1= passive gears, 2= active gears, 3= seines, 4= others not included in the previous groups, 9=not specified). The gear groups with reference to FAO’s ISSCFG-codes are listed in NOR Attachment on Gear Description.
The third digit number refers to most important target species groups (1=Pelagic, 2= demersal, 3= crustaceans, 4= other target groups and 9=not specified).
NORFISHPEL001 : Vessels that primarily target pelagic species, with different types of gear. Small quantities of other types of species as bycatch. Information extracted from database at the Directorate of Fisheries.
NORFISHDEM022 : Vessels that primarily target demersal species with active types of gear. Small quantities of other types of species as bycatch. Information extracted from database at the Directorate of Fisheries.
NORFISHDEM112 : Vessels that primarily target demersal species with passive type of gear, fishing north of 62 degree north. Small quantities of other types of species as bycatch. Information extracted from database at the Directorate of Fisheries.
NORFISHDEM212 : Vessels that primarily target demersal species with passive type of gear, fishing south of 62 degree north. Small quantities of other types of species as bycatch. Information extracted from database at the Directorate of Fisheries.
NORFISHDEM032 : Vessels that primarily target demersal species with seines. The use of seines on demersal species are strictly regulated. Information extracted from database at the Directorate of Fisheries.
NORFISHCRU013 : Vessels that primarily target crustacean etc. with the use of passive gear. Small quantities of other types of species as bycatch. Information extracted from database at the Directorate of Fisheries.
NORFISHCRU023 : Vessels that primarily target crustacean etc. with the use of active gear. Small quantities of other types of species as bycatch. Information extracted from database at the Directorate of Fisheries.
NORFISHCRU043 : Vessels that primarily target crustacean etc. with the use of miscellaneous type of gears. Small quantities of other types of species as bycatch. Information extracted from database at the Directorate of Fisheries.
NORFISHOTH999 : Vessels fishing with miscellaneous type of gear, targeting demersal species and other type of species. Information extracted from database at the Directorate of Fisheries.
NORFISHSUB009 : Vessels fishing for miscellaneous types of species with passive gear. Information subtracted from database at the Directorate of Fisheries. Vessels/persons fishing as a source of additional income, limited to 50 000 NOK per year. Information extracted from database at the Directorate of Fisheries.
NORFISHSUB999 : Vessels/person fishing for household supply of fish. This is in Norway called recreational fisheries, and do not enter into the marked. Recreational fisheries are for private consumption, since catch and release is forbidden. Information is based on research conducted in 2003 and the catch is estimated. Not included in worksheet 2_ENV_catch_LSF and 3_ENV_catch_use but included in 1_ENV_catch_SSF. We have no proper species resolution to do this, and there are only data for 2003. FAO may however include this in 2_ENV_catch_LSF and 3_ENV_catch_use. New research to achieve better estimates of fish fished for own households by residents in Norway has been conducted since 2019, but results have hitherto not been published.
3.1.4 - Number of vessels
According to our definition there are 5004 registered SSF vessels, and several of these conduct mixed fisheries with different target species and gears. The criteria of unique counting of vessels in sheet 1_ENV_catch_SSF is hence not possible to accommodate. However, some more information is given in sheet 7 _ENV_effort_SS F.
To illustrate the problem, we have created rows with information on numbers of vessels participation in each Fishing Unit ID, but this will sum to a much higher number than the actual vessels defined as SSF, because of the multipurpose vessels, crossing the unique definitions.
Unique groupings are done in a profitability survey with vessels defined as “full-time” fishing vessels. The criteria in this study are defined as first-hand value of the landings above a given level, depending of the size of the vessel, and landing registered in minimum 25 weeks, with some exceptions, and addition classification according to licences. (Profitability survey on the Norwegian fishing fleet, (https://fiskeridir.no/Yrkesfiske/Statistikk-yrkesfiske/Statistiske-publikasjoner/Loennsomhets-undersoekelse-for-fiskefartoey).
3.1.5 - Species, landed catch, live weight equivalent catch (nominal catch) and conversion factors
The species and catch information in ENVIRONMENTAL are extracted from a database at the Norwegian Directorate of Fisheries. This database contains the basis for producing the official Norwegian fisheries statistics, published through Statistics Norway.
Information on species are collected from the database at the Directorate of Fisheries. Each first-hand sales note is registered upon landing and sale and submitted electronically to the sales organisation with the geographic/ species monopoly covering the landing place. The information is then forwarded electronically to the database at the Directorate of Fisheries for consistence control against other sources. The species classification is done by both the fishermen and buyer, and both must verify the information in the first-hand sales document by signature.
The sales notes also contain information with product description and the product weight upon landing. Each sales note is submitted to the Directorate of Fisheries as an XML-document. When updated in the database at the Directorate of Fisheries, the landed weight is calculated to live weight equivalent (nominal weight) by using measured average conversion factors.
The conversion factors for the most important shared stocks north of 62oN, are established through a cooperation in a measurement program between Norway and Russia. The conversion factors are collected and calculated using the established agreed method between Norway and Russia.
The receivers of fish have asked for codes for 77 different types of products, needed for a correct registration of landed fish products. Some of the products are “by-products” such as liver and roe, guts etc. that have a value, but the weight is already included in the conversion factor, and therefore gives a zero live weight in the tables. A list of conversion factors for the most important stocks are published on the web-site of the Directorate of Fisheries ( https://www.fiskeridir.no/Yrkesfiske/Statistikk-yrkesfiske/Omregningsfaktorer ).
The established conversion factors are measured both onboard vessels, and on land, in a designed survey, when receiving whole fish from vessels.
The established average conversion factors are based on data-collection from representative areas and seasons and gears. In relation to SSF catch, large part of the catch of cod takes place in the spawning season north of 62oN. The use of average all-seasons conversion factors could therefore slightly underestimate the catch of cod for the SSF fleet defined in NORFISHDEM112.
The FAO species code PEL, GRO, CRU are used as explained in ANNEX 3.
A list of all species specified by year, vessel length groups, horsepower groups, intended use groups and FAO species gives more than 16700 records and therefore have to be grouped.
3.1.6 - Value
Price and total value for each species, and product type on the sale-note (one line per product on the sales note) are registered before any taxes etc are calculated, except the fee to the sales organisation. The value expresses the first-hand value paid to the fishermen. In the table the value is given in NOK and in running prices. Value of all landed “by-products” are included.
Since the first-hand value are given exactly, there are no need to give the price for the diversity of different product landed. Actual value and nominal catch give the best information, without any additional calculations.
An average conversion from NOK to US$ for the year 2013 to 2017, could be calculated using the following currency rates NOK 5.87, 6.30, 8.07, 8.39, 8.26, respectively, for 1 US$. Source of information based on figures from “Norges Bank”.
In addition, a standardized comparison of values over time should be corrected for consumer price index. With year 2015 as 100, the consumer price index is 96.2 in 2013, 98.0 in 2014, 100.0 in 2015, 103.9 in 2016 and 105.8 in 2017. The source of information is Norway Statistics (https://www.ssb.no/).
We leave these calculations to IHH, FAO, to secure a standardized method.
The explanation for the "negative price" in the Norwegian data in sheet 1_ENV_catch_SSF is due to the underlying documents when trading fish in Norway. It is illegal for a fisher to sell fish if the quantities exceed the given quota for the fisher. It is also illegal to sell quota-regulated species if the fisher has not been assigned a quota.
The data from Norway are extracted from the database containing all transactions (each sales document) between the fishers and the buyers, handled by the sales organizations. The payment for the catch goes from the buyer to the sales organization and from the sales organization to the fisher.
The sales organizations have the duty to control the transactions, both the quantities of fish for each species and the price.
If the control is conducted after the payment has already been done to the fisher, the value is withdrawn from the fisher’s account. In these cases, the value will be negative in the database and in the reported data.
In these cases, the information is reported with actual catch, but with negative value.
If the control is conducted before the payment to the fisher, the payment will be stopped, and the payment will be zero (0.00).
Furthermore, the “CATCH EX-VESSEL PRICE (per tons)” is the price paid to the fisherman, i.e. the first-hand sales price. If later controls discover that a fisher have caught and delivered more fish than he had the right to do, he may subsequently have to pay back to the buyer, and therefore negative money values. In the other worksheets these data are more aggregated, and the negative values will hence not be visible but incorporated/subtracted.
Note that all values (money) statistics delivered to FAO in this project have been first-hand sales values, and not market values. Any fish caught unintended beyond the fisherman’s rights/quotas, and which the fisherman don’t get paid for, can the first-hand buyer sell further for full price.
3.1.7 - Gear
Information on gear is collected from the database of the sales note system, where the fishermen describe the gear used for each trip. For the SSF fleet in some cases more than one gear could have been used for one trip. 41 specific types of gear have been defined in total, but not all are relevant for SSF. The definition in passive, active, seins and other gears in relation to FAO gear codes, are given in an ANNEX 4.
Data about life span of fishing gears are given by Sundt et.al. (2018, Table 11).
3.1.8 - Overall vessel length and engine information
Information on vessel length overall and horsepower are extracted from the Register of fishing vessels. A vessel might change length within one year. In this study, we have used actual length, not the length at 31th of December.
All fishing vessels in both the Fishing vessels register and the Sales note register are assigned a unique identification number, i.e, a virtual “hull number” within the database.
The information from the Register of fishing vessels have been linked to the Sales note register, and these combined registers have been used in these tables.
Vessels not in the Fishing vessel register but only in the Catch register will lack information on length and horsepower.
3.1.9 - Number of crew members per vessel, and the fishermen register
The only information available about people on board vessels had to be derived from the yearly profitability surveys on “full-time” vessels, using conventional gear fishing for demersal species. Despite this is not an accurate figure for each Fishing Unit group, it is the best available data and is probable acceptable close to target.
The register of fishermen is established to secure social benefits for the fishermen. It is a register on individuals, identified with the personal number given at birth. This number gives date of birth and a gender code, and the number is not public. When registered as a fisher, the person is classified according to the intended income as full-time or part-time fisher. This register can be combined with the Fishing vessels owner register. In many cases the fishing regulations require a full-time skipper on the vessel. There is no information about employment on given fishing vessels. This means that the data cannot be used for classifying gender or crew separately for the SSF and LSF fleets.
3.1.10 - Ecosystem
The Ecosystem is defined as COAST since the fishery is taken place in coastal- (inside 12 n mile) and fjord areas.
Sheet 2_ENV_catch_LSF
Some species is only caught by the LSF vessels, and other species are only caught by the SSF vessels. To illustrate this, we have included all species caught by the fleets. The quantities are given in tons nominal catch and value in NOK. Additional comments were given in connection with sheet 1_ENV_catch_SSF .
The quantities in sheet 2_ENV_catch_LSF , the catch for the SSF fleet, is the same as in 1_ENV_catch_SSF , but without the estimated quantities of group NORFISHSUB999.
Relevant information for the SSF and LSF is extracted from the database at the Directorate of Fisheries.
Sheet 3_ENV_catch_use
3.1.11 - Intended use
The sales note system gives information of the buyer’s intended use on time of landing, but this intention could be altered.
3.1.12 - Domestic consumption
The information on domestic consumption is based on a household survey on consumption of fish. The national consumption of farmed salmon is high but not included in this study.
Data from the survey is only available through secondary sources and we do not know the proportion of fish from recreational fishing compared to the commercial fishing fleet. In this sheet the catch is derived from commercial data.
We have assumed that all subsistence catches are consumed domestically.
3.1.13 - Domestic non-consumption
There is explicit information about domestic use of fish landed for bait.
3.1.14 - Export
The exported quantities have been calculated from total catch of the SSF fleet including subsistence fisheries, but without recreational fisheries, and with the subtraction of domestic human and non-human consumption.
Norway is a major exporter of fish. For the wild marine fish, conventional products like dried and salted fish, makes a large part of the export. These conventional products are often exported later than the year of catch. The export statistics is a rather problematic source of information to be used when related to catch figures because:
lack of information of catch year in the export statistics.
lack of information on yield in the land-based industry.
lack of information on quantities stored from one catch year to the next.
Studies of salted cod products have established different results due to input factor being fresh or frozen fish, amount of salt, time of salting all dependent of the tradition of each firm.
Due to these factors we find our approach to be the most relevant.
Sheet 4_ENV_stock_status
Questions 4A and 4B
The Norwegian data cover 69 different species. The same species can belong to different stocks that are managed individually by the Norwegian Directorate of Fisheries/ Ministry of Fisheries. The herring fishery is harvesting several stocks, North Sea herring, Norwegian spring spawning herring, Skagerrak herring and several smaller local coastal stocks, that are managed individually.
In ANNEX 1 we have summarized stock statuses set by The Advisory Committee (ACOM) of ICES (ICES, http://www.ices.dk ) for the different species harvested by the Norwegian SSF.
100% of the Norwegian fisheries (both SSF and LSF) are managed by regulations, 90.1% by quotas, and the rest by other regulations (ANNEX 1).
Most vessels in the Norwegian SSF fleet are harvesting a mixture of species with different gears and are moving between fishing areas along the coast and fjords during the year. There are no traditional data to estimate catch per unit effort (CPUE) for each species or stock. We have used total catch (all species) per liter diesel consumed by the vessels as a proxy for the total CPUE for the SSF, see ANNEX 2.
Sheet 5_ENV_carbon
We have applied the diesel consumption by the SSF fleet as a proxy for the footprint. According to SINTEF (Winter et.al. 2009) one liter diesel is equivalent to 2.6 kg CO 2 emission for fishing vessels above 8 meters (Winter et.al. 2009). We have used this value for all vessels in the Norwegian SSF fleet. See ANNEX 1.
Sheet 6_ENV_SSF_fleet
A typical vessel below 11 meter is made of glass fiber, composite, aluminium, ferrocement or wood. A few small vessels are also built of steel. Most vessels were built from 1960 to 2009, but in 2016 and 2017, 228 new vessels below 10 meters were built. In the period 2013 to 2017 there were built 571 vessels below 15 meters. The fleet is very flexible, and can use more than one type of gear, and catches both demersal fish, pelagic fish and crustaceans.
Table 3. Data of length and motor power of the SSF fleet as published in Anon (2018b).
Size
Minimum length (m)
Maximum length (m)
Average length(m)
Minimum Hp
Maximum Hp
Average Hp
<11m
4.10
10.99
8.80
4
750
136
11-14.99m
11.30
14.99
13.42
100
1015
305
The typical fuel is diesel, but electrical motors are now being introduced.
Sheet 7_ENV_effort_SSF
The Norwegian data are explained in sheet 7_ENV_effort_log
In this worksheet the number of vessels is not double counted, as in sheet 1_ENV_catch_SSF . The number of fishing vessels, fishing inside the 12 nautical miles are retrieved from the database with a SQL- script.
Information from The Profitability survey is used to calculate the other figures in this sheet (Anon. 2015, 2016, 2017a,b, 2019) .
Estimated fishing days for the two size groups participating in the SSF are retrieved from Tables G10 and G11 from the Profitability survey on the Norwegian fishing fleet for each of the years 2013-2017 (Anon. 2015, 2016, 2017a,b, 2019).
The income to a Norwegian fisherman consists of two parts:
fixed salary.
a part derived from the value of the catch per trip (called “lott”).
Average (total) cost per vessel type, includes salary, cost for maintenance and repairs, average running costs per year (not per day) and are extracted directly from the Profitability survey; Tables G10 and G11 (Anon. 2015, 2016, 2017a, 2017b, 2019 ).
3.1.15 - Average fuel consumption per day fishing
There are no direct retrievable data for daily fuel consumption. Based on total cost of fuel and the average price of fuel/litre, the total consumed fuel per year was calculated (from unpublished data made available by the Norwegian Directorate of Fisheries). Total number of days fished by the two SSF fleets were weighted according to the number of vessels registered and given in yellow cells in the table below. The average daily consumption of fuel by the SSF fleet, also given in yellow cells in the table below, was calculated by dividing the total fuel consumption per year with the weighted average numbers of fishing days per year.
Table 4. Average fuel consumption by the SSF per year (million liters) and per day (liters) at sea. No information available on average fuel consumption per vessel size category, but only for vessels less than 15 meters as a group.
Vessel size (LOA
in meters)
Motor type
(hp)
Fuel
type
Number of vessels
Estimated number of days fishing
2017
2016
2015
2014
2013
2017
2016
2015
2014
2013
Less than 11 meters
<10-899
Diesel
4362
4132
4051
4017
4049
103
113
127
142
145
11 to 14.99 meter
100->900
Diesel
642
644
655
677
703
139
129
149
152
181
Total
5004
4776
4706
4694
4752
108
115
130
143
150
Average fuel consumption (million liters) per year at sea
Average fuel consumption (liters) per day at sea
2017
2016
2015
2014
2013
2017
2016
2015
2014
2013
Total for vessels less than 15 meters
22.3
17.6
20.9
20.3
16.0
207213
152834
160693
141520
106436
NOR_ECONOMICS
Sheet 1A_Econ_harvest
There are no data about numbers of fishers involved in the SSF fleet. For 2017 we have applied the average number of fishers per vessel as 1.6 and 2.7 persons respectively for vessels less than 11 m and 11-14.99m (Anon 2019). The total number of fishers in the SSF was estimated as the sum of the products of fishers and number of vessels. To estimate numbers of male and female fishers working full or part time we applied the percentages by genders of full and part time fishers in the Norwegian list of fishers. This list just gives the number of fishers without allocating them to the SSF- or LSF fleets. We have applied the percentages of males and females working as fishers all or part time in the SSF fleet to be the same as for the total fleet. There are no data about occasional participations. According to the Directorate of Fisheries 1 801 vessels participated in the subsistence fishery. As a proxy for the total fishers involved, we applied one person occasionally per vessel, totalling 1 801 persons. About 40% of the participants in the subsistence fishery (type 1 and 2) are females (Hallenstvedt and Wulff (2004).
Fiskeridirektoratet 2019. Lønnsomhetsundersøkelse for fiskeflåten 2017. ( Profitability survey on the Norwegian fishing fleet 2017). Directorate of Fisheries, ISSN 2464-3009, 128pp.
Answers are given as common answers for all 11 unique fishing units, and therefore presented only once (Section A in sheet).
Question 13 driver of change.
There are no known habitat loss/degradation caused by the Norwegian LSF.
NOR_SOCIAL
Sheet 1_SOCIAL_species
Limit of quantification (LoQ) is the lowest analyte concentration that can be quantitatively detected with a stated accuracy and precision. The analytical methods are given in Table 5. See also Moxness Reksten et al. (2020). Data are retrieved from the Seafood Data Base, https://sjomatdata.hi.no/#search/.
Table 5. Overview of analytical methods, LoQ (per 100 g sample), and measurement uncertainty (%).
Analyte
Method
LoQ/100g
Measurement uncertainty (%)
Proximate components
Total fat
Ethyl acetate
0.1 g
12 (0.1-5 g/100 g); 8 (5-15 g/100 g)
Protein
Determination with nitrogen analyser
0.1 g N
40 (0.1-0.7 g N/100 g); 12 (0.7-16 g N/100 g)
Vitamins
Vitamin A
HPLC-DAD
0.5 µg
20
Vitamin D
HPLC-UV
1.0 µg
20
Cobalamin
Microbiological analysis
0.1 µg
30
Mineralsa
Calcium
ICP-MS
3.5 mg
15
Iron
ICP-MS
0.01 mg
25 (40% LOQx10)
Selenium
ICP-MS
1 µg
25 (40% LOQx10)
Zinc
ICP-MS
0.05 mg
20 (40% LOQx10)
Iodine
ICP-MS
4 µg
40
Fatty acids
GLC-FID
1 mg, 0.1%
100 (0.1%), 50 (0.2-0.5%), 10 (0.6-100%) b
a LoQ by dry weight. Abbreviations : DAD: diode-array detector; FID: flame ionization detector; GLC: gas liquid chromatography; HPLC: high performance liquid chromatography; ICP-MS: inductively coupled plasma mass spectrometry; LOQ: limit of quantification, N: nitrogen; UV: ultraviolet detect.
bThe measurement uncertainty for fatty acids is divided into four levels, depending on the area percentage of the fatty acid. The area percentage is presented within the parentheses, and the corresponding measurement uncertainty is presented in front of the parentheses.
Sheets 2_SOCIAL_income, 3_SOCIAL_dependence
No Norwegian data available, need for further research.
Sheet 5_Social_protein
No Norwegian data available
A paper, “Small-scale fisheries contribution to food and nutrition security – a case study from Norway”, which is based on the present study, is being submitted for publication in an international journal (Kjellevold et al. 2022). The manuscript includes an estimation of the potential nutritional value of SSF and how these resources could benefit the Norwegian population in case of crises. The fish resources harvested by the SSF is of high importance for food and nutrition security in Norway.
NOR_GOVERNANCE
No further comments, see data sheets. References used:
No further comments, see data sheets. No references used/included.
3.1.16 - Acknowledgment and disclaimer
This work was undertaken within the context of the Illuminating Hidden Harvests study (IHH) conducted by FAO in partnership with WorldFish and Duke University. FAO is the source and copyright holder of the data produced within the Norway case study, which was commissioned with funding support from Norway.
The designations employed and the presentation of material in this information product do not imply the expression of any opinion whatsoever on the part of the Food and Agriculture Organization of the United Nations (FAO) concerning the legal or development status of any country, territory, city or area or of its authorities, or concerning the delimitation of its frontiers or boundaries. The views expressed in this information product are those of the authors and do not necessarily reflect the views or policies of FAO.
4 - References
Anon. 2010. Innlandsfiskeforvaltning 2010-2015. Oversikt over norsk innenlandsfiskeriforvaltning og naturforvaltningens strategier for 2010-2015. Direktoratet for Naturforvaltning (DN)-rapport 6-2010. ISSN (printed) 0801-6119, ISSN (pdf) 1890-761f. 42pp.
Anon. 2015. Profitability survey on the Norwegian fishing fleet 2013. Norwegian Directorate of Fisheries. ISSN 0809-8174. 119pp.
Anon. 2016. Profitability survey on the Norwegian fishing fleet 2014. Norwegian Directorate of Fisheries. ISSN 2464-3009. 109pp.
Anon. 2017a. Profitability survey on the Norwegian fishing fleet 2015. Norwegian Directorate of Fisheries. ISSN 2464-3009. 111pp.
Anon. 2017b. Profitability survey on the Norwegian fishing fleet 2016. Norwegian Directorate of Fisheries. ISSN 2464-3009. 111pp.
Anon. 2018a. Fiskespiseren. En innsiktsrapport om den norske sjømatkonsumenten - høst 2018. Norges Sjømatråd (Norwegian Seafood Council). 78 pp. In Norwegian.
Anon. 2018b. Norwegian fishing vessels, fishermen and licenses 2017. Norwegian Directorate of Fisheries. ISSN 2464-3084. 86pp.
Anon. 2019. Profitability survey on the Norwegian fishing fleet 2017. Norwegian Directorate of Fisheries. ISSN 2464-3009. 128pp.
Berg, H.S.F. 2019. Estimation of discard of cod ( Gadus morhua ) in Norwegian gillnet fisheries. Master thesis, University of Bergen. 71 pp . ANNEX 6.
Gullestad, P., Abotnes, A.M., Bakke, G., Mauritzen, M.S., Nedreaas, K., Søvik, G. 2017. Towards ecosystem-based fisheries management in Norway – Practical tools for keeping track of relevant issues and prioritising management efforts. Marine Policy. Vol 77, pages 104-110.
Hallenstvedt, H., Wulff, I. 2004. Fritidsfiske i sjøen 2003 (Norwegian household fishing in 2003). Norges Fiskerihøgskole/University of Tromsø, June 2004. In Norwegian.
Henriksen, E. 2014. Norwegian coastal fisheries. An overview of the coastal fishing fleet less than 21 meters. NOFIMA. Report 14/204. (ISBN 978-82-8296-176-9 (Pdf)).
Kjellevold, M., Kuhnle, G.A., Iversen, S.A., Markhus, M.W., Mancha-Cisneros, M del M., Gorelli, G. and Nedreaas, K. 2022. Small-scale fisheries contribution to food and nutrition security – a case study from Norway. Submitted.
Moxness Reksten, A., Bøkevoll, A., Frantzen, S., Lundebye, A-K., Kögel, T., Kolås, K., Aakre, I. and Kjellevold, M. 2020. Sampling protocol for the determination of nutrients and contaminants in fish and other seafood – The EAF-Nansen Programme. MethodsX. Volume 7 and 8. DOI: https://doi.org/10.1016/j.mex.2021.101363.
Nedreaas, K, Iversen, S, and Kuhnle, G 2015. Preliminary estimates of total removals by the Norwegian marine fisheries, 1950-2010. Fisheries Centre, University of British Columbia, Canada. Working Paper, 2015-94. 15 pp.
Nedreaas, K, Iversen, S, and Kuhnle, G 2016. Norway. Pages 355, 357 and 358 in D. Pauly and D. Zeller (eds.), Global Atlas of Marine Fisheries; A Critical Appraisal of Catches and Ecosystem Impacts . Island Press, Washington, DC.
Sundt, P., Briedis, R., Skogesal, O., Standal, E., Johnsen, H.R., Shulze, P.E. 2018. Underlag for å utrede produsentansvarsordning for fiskeri- og akvakulturnæringen. Miljødirektoratet. M-1052/2018. 175pp. In Norwegian.
Anon. 2018. Basis for studying producer's responsibility regime for fisheries and aquaculture. Directorate of
Environment, Project report MDIR-1310, 175 pp.
ICES. 2018. Report of the Working Group on Widely Distributed Stocks (WGWIDE). ICES C.M. 2018/ACOM:23.
576pp.
Richardsen, R. 2015. Verdiskapning og sysselsetting i norsk matproduksjon. Prosjektnotat. SINTEF.16pp. In Norwegian.
ANNEXES
ANNEX 1 Stock status and regulations (Sheet 4_ENV_4A_stock status).
ANNEX 2 Footprint and catch per unit effort in the Norwegian SSF (Sheet 4_ENV_4B_stock status).
ANNEX 3 Taxonomic groups (Sheet 1_ENV_catch_SSF).
ANNEX 4 Gear description (Sheet 7_ENV_effort).
ANNEX 5 Data used from the Profitability survey (Sheet 7_ENV_effort_SSF).
ANNEX 6 Answers to the methodology questions from the FAO group.
5 - Annex
5.1 - Annex 1 - Stock status and regulations
The International Council for the Exploration of the Sea (ICES) assesses and evaluates fish stocks on a yearly basis for most of the stocks harvested partly by the Norwegian SSF. The fractions taken by this fleet compared with the total international catches of these stocks are quite small. The ICES’ advicory committee (ACOM) makes scientific advices on total allowable catch (TAC). The TAC is set according to the size of the evaluated spawning stock size (B). This evaluation is done according to B is below or above the precautionary reference point Bpa. (http://www.ices.dk/publications/library/Pages/default.aspx#Default).This reference point is defined, based on historical data, as the spawning stock size that has relatively low probability of reduced recruitment. (https://doi.org/ 10.17895/ices.pub.4503).
The table below summarizes how the species fished by the Norwegian SSF are categorized in the red list system (http://www.artsdatabanken.no/Rodliste).
The different fisheries are managed by quotas or by: minimum/maximum legal size, open/closed areas or seasons, by-catch, discard bans etc. A fishing vessel has to be licensed to participate in the Norwegian SSF. The management regulations are given by the Norwegian Directorate of Fisheries (https://www.fiskeridir.no/).
Percentages of the total Norwegian SSF catch in tonnage and value in 2017 are summarized below according the red list categories, ACOM (below or above Bpa) and regulations.
Redlist
ACOM
REGULATIONS
Least Concern
Equal or >Bpa
<Bpa
XBpa2)
Quota
Other
Catch
Value
Catch
Value
Catch
Value
Catch
Value
Catch
Value
Catch
Value
99.41)
99.51)
93.5
84.5
0.6
0.8
6.0
14.4
90.1
90.7
9.9
9.3
1) The rest of the catch was taken from species evaluated as NT, VU, EN or CR ( i.e. Blue skate, Raja batis :
0.004% of SSF catch).
2) Bpa is unknown or not assessed.
5.2 - Annex 2 - Footprint and catch per unit effort (CPUE) in the Norwegian SSF
Catch per unit effort (CPUE)
There are several proxies for estimating CPUE-trends in the Norwegian SSF. Catch per liter diesel consumed by the conventional Norwegian SSF fleet is probably a better proxy for CPUE than fishing days and catch per day since time spent for searching or the use of energy is often not considered being part of the effort (Table A1). If catch per liter fuel consumed is applied as a proxy for the CPUE there has been a reduction by about 30% from 2013 to 2017 (Table A1).
We present in this report previously unpublished data from the Norwegian Directorate of Fisheries of kg/liter for the SSF and the conventional-, pelagic trawl-, purse seine- and bottom trawl LSF fleets (Table A1). The catches of these fleets provide on average 99% of the total LSF catch and the weighted values of kg/ liter fuel for the LSF fleet is therefore considered a robust estimate of the CPUE proxies for the total LSF fishery for each of the years 2013-2017. The difference in the LSF CPUE for 2013-2017 was negligible, while the SSF CPUE was reduced by 30% from 2013 to 2017.
Footprint
According to a SINTEF report from 2009 (Winter et al, 2009) it is possible to convert the fuel consumption by the fishing fleet to kg CO2 emission using the following relationship: One liter diesel is equivalent to 2.6 kg CO2 emission for fishing vessels >8m. This value is applied both for the SSF and the LSF fleets in the present evaluation.
Based on this the carbon footprint, as emission of CO2 , was calculated for each year for the Norwegian SSF and LSF fleets (Table A1). The footprint for the SSF increased by 27% from 41 500 tons in 2013 to average 52 700 tons per year for the period 2014-2017 or by 40% from 2013 to 58 200 tons in 2017 (Table A1). The average footprint (CO2 emission) for the LSF was about 20 times higher and increased by 21% from 970 000 tons in 2013 to 1 172 000 tons in 2017. Measured as kg fish catch per liter fuel, the LSF above 15 m has a 2-3 times higher carbon footprint than the SSF below 15 m.
Table A1. Data for catch per unit effort and footprint for the SSF- and LSF fleets.
Fleets and parameters
2013
2014
2015
2016
2017
SSF catch (tons)
229560
256109
233438
222158
225692
SSF number boats
4752
4694
4706
4776
5004
SSF catch per boat (tons)
48
55
50
47
45
SSF fuel liters/day
106436
141520
160693
152834
207213
SSF fish days
150
143
130
115
108
SSF catch per day (tons)
1530
1791
1796
1932
2090
SSF Total fuel mill liters
15965400
20237360
20890090
17575910
22379004
SSF kg catch/liter
14.38
12.66
11.17
12.64
10.08
SSF Ktons CO2
41.51
52.62
54.31
45.70
58.19
Convent. LSF fleet
Fleet liter diesel/kg
0.27
0.22
0.28
0.28
0.28
Catch
295606
285108
273345
290836
284966
kg/liter diesel
3.70
4.55
3.57
3.57
3.57
Mill liter diesel consumed
79.81
62.72
76.54
81.43
79.79
Ktons CO2
207.52
163.08
198.99
211.73
207.46
Pel. Trawl LSF fleet
Fleet liter diesel/kg
0.09
0.09
0.08
0.12
0.08
Catch
284217
460778
573742
390544
488950
kg/liter diesel
11.11
11.11
12.50
8.33
12.50
Mill liter diesel consumed
25.58
41.47
45.90
46.87
39.12
Ktons CO2
66.51
107.82
119.34
121.85
101.70
Purse seine LSF fleet
Fleet liter diesel/kg
0.09
0.09
0.10
0.11
0.09
Catch
782369
736270
652596
563196
730018
kg/liter diesel
11.11
11.11
10.00
9.09
11.11
Mill liter diesel consumed
70.41
66.26
65.26
61.95
65.70
Ktons CO2
183.07
172.29
169.67
161.07
170.82
Bottom trawl LSF fleet
Fleet liter diesel/kg
0.41
0.40
0.48
0.43
0.39
Catch
481997
557561
576524
580415
682330
kg/liter diesel
0.41
0.40
0.48
0.43
0.39
Mill liter diesel consumed
197.62
223.02
276.73
249.58
266.11
Ktons CO2
513.81
579.86
719.50
648.90
691.88
LSF data
SUM CATCH
1844190
2039718
2076206
1824991
2186264
Weigthed liter diesel/kg
0.20
0.19
0.22
0.24
0.21
kg/liter diesel
4.94
5.18
4.47
4.15
4.85
Mill liter diesel consumed
373.43
393.48
464.43
439.83
450.72
Ktons CO2
970.91
1023.05
1207.51
1143.56
1171.86
5.3 - Annex 3 - Taxonomic groups
Content of the Constructed Species Groups PEL, GRO, CRU, MZZ in Table Environment, Sheet 1_ENV_Catch , specified on Species Codes for each Fishing Unit Uniqe ID. Species identified with FAO codes and Latin name. Catch in tons. 0.0 means less than 0.04 tons. (English Decimal Point) Data for 2017 and 2016.
Fishing Unit Unique ID
NORFISHPEL001
ID name
Pelagic SSF fisheries and cartilage fishes, all gear
Catch year
Collected Group Name
FAO code
Latin name
Catch (tons live weight)
2017
PEL
ARG
Argentina spp.
0.0
2017
PEL
BFT
Thunnus thynnus
0.0
2017
PEL
BON
Sarda sarda
0.1
2017
PEL
BSS
Dicentrarchus labrax
0.0
2017
PEL
CMO
Chimaera monstrosa
2.4
2017
PEL
COE
Conger conger
0.8
2017
PEL
DCA
Deania calceus
0.1
2017
PEL
DGH
Squalidae Scyliorhinidae
0.0
2017
PEL
DGS
Squalus acanthias
181.3
2017
PEL
ETX
Etmopterus spinax
0.0
2017
PEL
GAR
Belone belone
0.1
2017
PEL
JOD
Zeus faber
0.1
2017
PEL
POA
Brama brama
0.0
2017
PEL
POR
Lamna nasus
3.5
2017
PEL
RJB
Dipturus batis
9.4
2017
PEL
RJC
Raja clavata
0.6
2017
PEL
RJO
Dipturus (Raja) oxyrinchus
0.0
2017
PEL
SAL
Salmo salar
6.1
2017
PEL
SAN
Ammodytes
0.0
2017
PEL
SHO
Galeus melastomus
0.3
2017
PEL
SKH
Selachimorpha (Pleurotremata)
0.1
2017
PEL
SPR
Sprattus sprattus
133.2
2017
PEL
SRX
Rajiformes
334.2
2017
PEL
TRS
Salmo trutta
0.1
2017
PEL SUM
672.5
2017
NORFISHPEL001 Total
38,796.2
Fishing Unit Unique ID
NORFISHPEL001
ID name
Pelagic SSF fisheries and cartilage fishes, all gear
Catch year
Collected Group Name
FAO code
Latin name
Catch (tons live weight)
2016
PEL
ARG
Argentina spp.
0.1
2016
PEL
BSS
Dicentrarchus labrax
0.0
2016
PEL
CMO
Chimaera monstrosa
1.1
2016
PEL
COE
Conger conger
0.4
2016
PEL
DCA
Deania calceus
0.0
2016
PEL
DGS
Squalus acanthias
232.5
2016
PEL
GAR
Belone belone
0.1
2016
PEL
JOD
Zeus faber
0.1
2016
PEL
POA
Brama brama
0.0
2016
PEL
POR
Lamna nasus
3.6
2016
PEL
RJB
Dipturus batis
9.6
2016
PEL
RJC
Raja clavata
1.4
2016
PEL
RJO
Dipturus (Raja) oxyrinchus
0.2
2016
PEL
SAL
Salmo salar
3.5
2016
PEL
SHO
Galeus melastomus
1.0
2016
PEL
SKH
Selachimorpha (Pleurotremata)
0.0
2016
PEL
SPR
Sprattus sprattus
919.3
2016
PEL
SRX
Rajiformes
305.4
2016
PEL
TRS
Salmo trutta
0.1
2016
PEL SUM
1,478.4
2016
NORFISHPEL001 Total
36,569.4
Fishing Unit Unique ID
NORFISHDEM022
ID name
Demersal SSF fisheries, active gear
Catch year
Collected Group Name
FAO code
Latin name
Catch (tons live weight)
2017
GRO
BLI
Molva dypterygia
0.5
2017
GRO
BLL
Scophthalmus rhombus
3.9
2017
GRO
CAA
Anarhichas lupus
14.6
2017
GRO
CAB
Anarhichas denticulatus
0.0
2017
GRO
CAS
Anarhichas minor
0.6
2017
GRO
DAB
Limanda limanda
0.8
2017
GRO
FLE
Platichthys flesus
0.4
2017
GRO
GAD
Gadiformes
0.0
2017
GRO
GFB
Phycis blennoides
0.1
2017
GRO
GHL
Reinhardtius hippoglossoides
1.4
2017
GRO
GUG
Eutrigla gurnardus
1.0
2017
GRO
HAL
Hippoglossus hippoglossus
18.8
2017
GRO
HKE
Merluccius merluccius
25.2
2017
GRO
LEM
Microstomus kitt
8.7
2017
GRO
LIN
Molva molva
37.3
2017
GRO
MON
Lophius piscatorius
64.4
2017
GRO
MZZ
Osteichthyes
14.5
2017
GRO
NOP
Trisopterus esmarkii
4.5
2017
GRO
PLA
Hippoglossoides platessoides
0.7
2017
GRO
PLE
Pleuronectes platessa
360.3
2017
GRO
PLZ
Pleuronectidae
0.1
2017
GRO
POL
Pollachius pollachius
72.4
2017
GRO
REG
Sebastes norvegicus
3.9
2017
GRO
RNG
Coryphaenoides rupestris
0.0
2017
GRO
SOL
Solea solea
0.8
2017
GRO
TBR
Ctenolabrus rupestris
0.3
2017
GRO
TUR
Scophthalmus maximus
3.8
2017
GRO
USB
Labrus bergylta
0.1
2017
GRO
USK
Brosme brosme
6.2
2017
GRO
WHG
Merlangius merlangus
7.0
2017
GRO
WIT
Glyptocephalus cynoglossus
10.9
2017
GRO
YFM
Symphodus melops
0.3
2017
GRO SUM
663.6
2017
NORFISHDEM022 Total
14,652.7
Fishing Unit Unique ID
NORFISHDEM022
ID name
Demersal SSF fisheries, active gear
Catch year
Collected Group Name
FAO code
Latin name
Catch (tons live weight)
2016
GRO
BLI
Molva dypterygia
0.5
2016
GRO
BLL
Scophthalmus rhombus
4.3
2016
GRO
CAA
Anarhichas lupus
17.3
2016
GRO
CAS
Anarhichas minor
1.4
2016
GRO
DAB
Limanda limanda
0.0
2016
GRO
GFB
Phycis blennoides
0.1
2016
GRO
GHL
Reinhardtius hippoglossoides
9.3
2016
GRO
GUG
Eutrigla gurnardus
0.0
2016
GRO
HAL
Hippoglossus hippoglossus
18.2
2016
GRO
HKE
Merluccius merluccius
86.5
2016
GRO
LEM
Microstomus kitt
9.2
2016
GRO
LIN
Molva molva
39.9
2016
GRO
MON
Lophius piscatorius
62.2
2016
GRO
MZZ
Osteichthyes
2.8
2016
GRO
NOP
Trisopterus esmarkii
1.4
2016
GRO
PLA
Hippoglossoides platessoides
0.1
2016
GRO
PLE
Pleuronectes platessa
327.9
2016
GRO
PLZ
Pleuronectidae
0.2
2016
GRO
POL
Pollachius pollachius
100.4
2016
GRO
REG
Sebastes norvegicus
4.8
2016
GRO
RNG
Coryphaenoides rupestris
0.1
2016
GRO
SOL
Solea solea
1.1
2016
GRO
TBR
Ctenolabrus rupestris
0.5
2016
GRO
TUR
Scophthalmus maximus
3.1
2016
GRO
USB
Labrus bergylta
0.5
2016
GRO
USK
Brosme brosme
8.3
2016
GRO
WHG
Merlangius merlangus
8.7
2016
GRO
WIT
Glyptocephalus cynoglossus
18.9
2016
GRO
YFM
Symphodus melops
1.2
2016
GRO SUM
728.7
2016
NORFISHDEM022 Total
12,693.3
Fishing Unit Unique ID
NORFISHDEM112
ID name
Passive gear, demersal SSF fisheries, northern areas
Catch year
Collected Group Name
FAO code
Latin name
Catch (tons live weight)
2017
GRO
BLI
Molva dypterygia
4.6
2017
GRO
BLL
Scophthalmus rhombus
0.0
2017
GRO
CAA
Anarhichas lupus
86.4
2017
GRO
CAB
Anarhichas denticulatus
15.6
2017
GRO
CAS
Anarhichas minor
228.1
2017
GRO
DAB
Limanda limanda
0.2
2017
GRO
FLE
Platichthys flesus
0.0
2017
GRO
GFB
Phycis blennoides
0.8
2017
GRO
GHL
Reinhardtius hippoglossoides
3,974.7
2017
GRO
HAL
Hippoglossus hippoglossus
2,124.5
2017
GRO
HKE
Merluccius merluccius
470.5
2017
GRO
LEM
Microstomus kitt
1.2
2017
GRO
LIN
Molva molva
2,790.2
2017
GRO
LUM
Cyclopterus lumpus
542.5
2017
GRO
MON
Lophius piscatorius
1,319.4
2017
GRO
MZZ
Osteichthyes
0.0
2017
GRO
PLA
Hippoglossoides platessoides
3.2
2017
GRO
PLE
Pleuronectes platessa
47.0
2017
GRO
PLZ
Pleuronectidae
0.0
2017
GRO
POL
Pollachius pollachius
748.6
2017
GRO
REB
Sebastes mentella
1.6
2017
GRO
REG
Sebastes norvegicus
1,014.8
2017
GRO
RHG
Macrourus berglax
0.2
2017
GRO
RNG
Coryphaenoides rupestris
0.1
2017
GRO
TBR
Ctenolabrus rupestris
92.8
2017
GRO
TUR
Scophthalmus maximus
4.0
2017
GRO
USB
Labrus bergylta
76.1
2017
GRO
USK
Brosme brosme
3,330.8
2017
GRO
WHG
Merlangius merlangus
14.6
2017
GRO
WIT
Glyptocephalus cynoglossus
0.2
2017
GRO
YFM
Symphodus melops
68.2
2017
GRO SUM
16,961.0
2017
NORFISHDEM112 Total
154,327.6
Fishing Unit Unique ID
NORFISHDEM112
ID name
Passive gear, demersal SSF fisheries, northern areas
GEAR USED BY VESSELS LESS THAN 11 METER OVERALL LENGTH:
GEAR TYPE GROUPS
ISSCFG-codes
English name 1
English name 2
01) PASSIVE GEAR
GN
Gillnets and entangling nets
Gillnet (not specified)
01) PASSIVE GEAR
GNS
Gillnets and entangling nets
Set gillnets
01) PASSIVE GEAR
LX
Hooks and lines
Hooks and lines not specified
01) PASSIVE GEAR
LLD
Hooks and lines
Drifting longlines
01) PASSIVE GEAR
LL
Hooks and lines
Longlines (not specified)
01) PASSIVE GEAR
LHP
Hooks and lines
Handlines and pole-lines
01) PASSIVE GEAR
LTL
Hooks and lines
Trolling lines
01) PASSIVE GEAR
LLD
Hooks and lines (auto)
Drifting longlines, automatice)
01) PASSIVE GEAR
FYK
Traps
Fyke nets
01) PASSIVE GEAR
FPO
Traps
Pots
02) ACTIVE GEAR
TBS
Bottomtrawl
Shrimp trawles
02) ACTIVE GEAR
TBN
Bottomtrawl
Nephrops trawls
02) ACTIVE GEAR
SDN
Seine nets
Danish seines
03) SEINES
PS
Seine nets
Purse seines
03) SEINES
SB
Seine nets
Beach seines
4) OTHER GEAR
MIS
Miscellaneous
"Scallop dredge"
4) OTHER GEAR
NK
Not given
Not given
GEAR USED BY VESSELS 11 TO 14,99 METER OVERALL LENGTH:
GEAR TYPE GROUPS
ISSCFG-codes
English name 1
English name 2
01) PASSIVE GEAR
GN
Gillnets and entangling nets
Gillnet (not specified)
01) PASSIVE GEAR
GNS
Gillnets and entangling nets
Set gillnets
01) PASSIVE GEAR
LX
Hooks and lines
Hooks and lines not specified
01) PASSIVE GEAR
LLD
Hooks and lines
Drifting longlines
01) PASSIVE GEAR
LL
Hooks and lines
Longlines (not specified)
01) PASSIVE GEAR
LHP
Hooks and lines
Handlines and pole-lines
01) PASSIVE GEAR
LTL
Hooks and lines
Trolling lines
01) PASSIVE GEAR
LLD
Hooks and lines (auto)
Drifting longlines, automatice)
01) PASSIVE GEAR
FYK
Traps
Fyke nets
01) PASSIVE GEAR
FPO
Traps
Pots
02) ACTIVE GEAR
TBS
Bottomtrawl
Shrimp trawles
02) ACTIVE GEAR
TBN
Bottomtrawl
Nephrops trawls
02) ACTIVE GEAR
SDN
Seine nets
Danish seines
03) SEINES
PS
Seine nets
Purse seines
03) SEINES
SB
Seine nets
Beach seines
4) OTHER GEAR
MIS
Miscellaneous
"Scallop dredge"
4) OTHER GEAR
NK
Not given
Not given
5.5 - Annex 5 - Data used from the Profitability survey
Data used from the Profitability survey (Sheet 7_ENV_effort_SSF)
Relationship between collected data form the survey and columns in Environment table marked with X.
Total list of variables in the survey
Information used in sheet 7_ENV_effort_SSF (marked with X or reference number)
Column reference in Sheet 7_ENV
PROFIT AND LOSS ACCOUNT
OPERATING INCOME:
R.01 Operating revenues
OPERATING EXPENDITURE:
R.02 Special tax (paid to the social security system)
R.03 Special tax (tax to finance fisheries research)
R.04 Labour wages and shares to the crew (included extra shares etc.)
R.04 =Average salary per year,
column T to X
R.05 Food expenses to crew
X
R.06 Social expenses
R.07 Contribution to pension scheme
R.08 Depreciation on vessel
R.09 Depreciation on fishing licenses and permits
R.10 Fuel and lubrication oil
X
R.11 Bait, ice, salt and packing
X
Sum R.05,R10,R11 = Average running cost per year
Column AP to AT
R.13 Maintenance/investment on gear
R.13 = Maintenance/investment cost
Column AX to BB
R.12 Maintenance on vessel
R.14 Insurance on vessel
R.15 Other insurances
R.16 Other operating and administrative expenses
Sum R.12,R.13,R.14,R.15,R.16 = Average annual cost of maintenance and repairs
Column AK to AO
R.17 Total operating expenses
R.17. = Average total cost per year
Column Z to AD
R.18 Driftsresultat Operating profit
FINANCE
R.19 Financial income
R.20 Agio, Profit on exchange
R.21 Total financial revenues
Total list of variables in the survey, continued
Information used in sheet 7_ENV_effort_SSF marked
Column reference in Sheet 7_ENV
R.22 Financial costs
R.23 Disagio, Loss on exchange
R.24 Total financial expenses
R.25 Result of financial items
R.26 Profit on ordinary activities before taxation
R.27 Total shares to the crew
BALANCE SHEET
ASSETS
B.01 Book value of fishing licenses and permits
B.02 Book value of vessel
B.03 Other fixed assets
B.04 Total fixed assets
B.05 Other current assets
B.06 Cash in hand and at bank
B.07 Total current assets
B.08 Total assets
B.09 Equity
B.10 Long-term liabilities
B.11 Current liabilities
B.12 Total equity and liabilities
OPERATING MEASURES
D.01 No. of days in operation
D.02 No. of days at sea (per year)
D.02 = No. of days at sea (per year)
Column J to N
VESSEL MEASURES
P.01 Over all length (o.a.l.)
P.02 Size GT
P.03 Size GRT
P.04 Vessel age
P.04 = Vessel Age
Column AF to AJ
P.05 No. of vessels in sample
P.06 No. of vessels in the population
KEY FIGURES
Operating Margin
Return on Total Assets
Current Ratio
5.6 - Annex 6 - Answers to the methodology questions from the FAO-Duke-Worldfish project coordinators
The answers are given in bold italic.
1) Catch figures
i. Of the catch figures you have provided us with (including both official and unofficial/estimated data), what is the estimated overall coverage (in terms of a percentage) for total catch in your country that your IHH catch data includes?
100% landed catch, no data on discards. Discarding is forbidden in Norway. For commercial species, discarding may occasionally occur due to damaged fish or illegal economic high-grading. For non-commercial species discarding may occur to a larger extent. Discards of cod in the demersal part of the SSF has been investigated and is negligible, less than 1% (Berg, 2019)
ii. Considering the catch figures that you have included in the worksheets that comes from unofficial/estimated data, is this already accounted for in the official data that you also provided (i.e., is there any double counting)?
No double counting
iii. Does adding up all of the ‘official’ catch data you have provided us with result in the national figure reported to FAO? Why or why not?
All except in NORFISHSUB999
2) Disaggregation between SSF and LSF:
i. Have you included disaggregated data for SSF according to your country’s definition of SSF?
YES
ii. If not, how did you calculate the split in the data between what comes from SSF?
iii. This split was done based on what metrics (e.g., species, gears, vessel types, areas landed/fished)?
3) Exclusions for catch data: The purpose of this document is to provide answers to some of the most frequently asked questions related to completing the country case study and filling out the Excel data files. This is a live document that will be updated periodically as new questions arise.
i. On a scale of 1 to 5 (1 = Not confident at all, 5 = Extremely confident), how confident are you in terms of excluding aquaculture data?
No data in the catch figures so 5, but in the processing industry data which usually include wild fish and farmed fish we cannot be certain so 3 for these categories.
ii. On a scale of 1 to 5 (1 = Not confident at all, 5 = Extremely confident), how confident are you in terms of excluding recreational fisheries data?
3
4) Exclusions for nutrition/consumption data:
i. On a scale of 1 to 5 (1 = Not confident at all, 5 = Extremely confident), how confident are you in terms of excluding consumption data from aquaculture sources?
Norwegian statistics does not split between wild fish and aquacultured fish regarding consumption, so 1
ii. On a scale of 1 to 5 (1 = Not confident at all, 5 = Extremely confident), how confident are you in terms of excluding consumption data from recreational fisheries sources?
3
iii. On a scale of 1 to 5 (1 = Not confident at all, 5 = Extremely confident), how confident are you in terms of excluding consumption data from exports?
i. Were you able to provide sex-disaggregated data for Employment? If not, explain why not.
Given where possible
ii. Is it possible to provide some kind of estimation using other methods?
Possible when adequate data
DATA SOURCES 2013 TO 2017
Subtract from the database at the Norwegian Directorate of Fisheries, Landing og sluttseddeldatabasen (sales-note system and Register over norske fiskefartøy (Register of Norwegian Fishing Vessels) in combination. Quality controlled data 2013 to 2017. Further references are given in the respective tables and text sections.
Data are also subtracted from the web-sites of The Central Bank of Norway, www.norges-bank.no and Statistics Norway, www.ssb.no.
Data on content of nutrients and food safety parameters are subtracted from the “Seafood data bease”, https://sjomatdata.hi.no/#search
NORWEGIAN FISHERS IMPACT ON FISHERY REGULATIONS
In particular, we would like to know more about cases in which fishers have the right to resource management but do not engage. Ultimately, we would like to understand the extent to which management rights coincide with fishers' power and involvement in decision-making. In many cases, you've indicated that fishers do have rights to resource management, but that none or only some engage. In these cases, does lack of fisher engagement reflect a lack of fishers' power and involvement in decision-making?
It is the fisheries organizations (both fishermen's- and sales-organizations) and not individual fishermen who have the right to participate in Norwegian regulatory meetings to submit proposals on the allocation of certain quotas (determined by the Fisheries Department) within the various fisheries and fleet groups. Most of the Norwegian fishermen are members of a fishermen organization. All fishers are, however, member of one or more sales organizations if they want to sell their fish, and automatically the fishers get a saying in these sales organizations, too. On top of this, the sales organizations are owned by the fishermen's organizations, based on business rules approved by the government.
The Norwegian Recreational- and Small-scale fisheries Association and the Norwegian Hunter's- and Fishermen's Association also participate in the Norwegian regulatory meetings. The same does journalists and environmental NGOs (e.g., Greenpeace, WWF, Norwegian Society for the Conservation of Nature).
The Director of Fisheries invites for two meetings during the year to discuss regulation of the fisheries (regulatory meeting) at the Directorate of Fisheries in Bergen, Norway. The Regulatory Meeting is an important arena for the Director of Fisheries to inform about developments in the fisheries in the current year, and to discuss proposals for future fisheries regulations. Only representatives of the organizations mentioned in an official list have access to ask at the meeting. Private individuals are not allowed to participate. If the enrollment of participants becomes large, it may be necessary for practical reasons to limit the number of participants from each organization. The Directorate of Fisheries does not cover the participants' expenses in connection with the meeting, and does not provide meeting remuneration. Input or suggestions for matters are sent to the Directorate of Fisheries within a set deadline.