Miljøovervåking ved Sør-Orknøyene i Sørishavet har blitt utført årlig siden 2011 av Havforskningsinstituttet. Hydroakustiske og trålbaserte data brukes til å beregne biomassen av antarktisk krill (Euphausia superba) og til å vurdere den romlige fordelingen og demografiske sammensetningen av krill, andre zooplankton og fisketaxa. Systematiske observasjonsdata av hval, pingviner og sel registreres langs transektene mens det er dagslys. I tillegg er datainnsamling fra sensorer forankret til havbunnen siden forrige års tokt en del av prosedyren. Denne rapporten presenterer undersøkelsesaktivitetene fra 2025 og gir foreløpige resultater.
Hovedresultatet fra årets undersøkelse var den estimerte krillbiomassen på 6,16 millioner tonn (CV: 0,74). Totalt ble 38 taksonomiske grupper identifisert fra trålfangstene, hvorav 18 ble bestemt til artsnivå. De største fangstvektene ble registrert i de nordligste og dypeste delene av studieområdet, med Salpa thompsoni som dominerende, mens større fangster av E. superba ble funnet på kontinentalskråningen. Tre arter av euphausiider ble identifisert: E. superba, E. triacantha og Thysanoessa macrura. Sifonoforen Diphyes antarctica var den hyppigst forekommende arten, funnet på 24 av totalt 28 stasjoner, etterfulgt av E. superba og T. macrura på henholdsvis 23 og 21 stasjoner. Gjennomsnittlig kroppslengde av E. superba var 42,6 mm (SD: 6,6), med en variasjon fra 25,3 til 59,4 mm. Den demografiske sammensetningen var dominert av voksne hanner (stadium M3B, 20,4%), hunner (stadium F3D, 22,3%) og juvenile (15%). Undersøkelsen i 2025 estimerte også tettheten av finnhval (Balaenoptera physalus) til 0,18 ind. m-2 (0,14-0,25 95% CI) og knølhval (Megaptera novaeangliae) til 0,07 ind. m-2 (0,04-0,12 95% CI).
Antarctic krill and ecosystem monitoring survey off the South Orkney Islands in 2025
Report series:
Toktrapport 2025-8
ISSN: 1503-6294
Published: 15.05.2025
Cruise no.: 2025223001
Project No.: 14246
On request by: Havforskningsinstituttet
Research group(s):
Plankton
,
Oseanografi og klima
,
Akustikk og observasjonsmetodikk
Subject:
Krill – Antarktisk krill
Program:
Global utvikling
Approved by:
Research Director(s):
Geir Huse
Program leader(s):
Ann-Lisbeth Agnalt
Norsk sammendrag
Summary
Environmental monitoring at the South Orkney Islands in the Southern Ocean has been conducted annually since 2011 by the Institute of Marine Research, Norway. Hydro-acoustic and net-derived data are utilized to calculate the biomass of Antarctic krill (Euphausia superba) and to assess the spatial distribution and demographic composition of krill, other zooplankton, and fish taxa. Systematic sighting data of cetaceans, penguins, and pinnipeds are recorded along the transects during daylight hours. Additionally, data acquisition from sensors anchored to the seabed since the previous year is part of the procedure. This report presents the survey activities from 2025 and provides preliminary results.
The main result from this year's survey was the estimated krill biomass of 6.16 million tons (CV: 0.74). A total of 38 taxonomic groups were identified from the trawl catches, with 18 determined to species level. The largest catch weights were recorded in the northernmost and deepest parts of the study area, with Salpa thompsoni dominating, while larger catches of E. superba were found on the shelf slope. Three species of euphausiids were identified: E. superba, E. triacantha, and Thysanoessa macrura. The siphonophore Diphyes antarctica was the most frequently occurring species, found at 24 of a total of 28 stations, followed by E. superba and T. macrura at 23 and 21 stations, respectively. The mean body length of E. superba was 42.6 mm (SD: 6.6), ranging from 25.3 to 59.4 mm. The demographic composition was dominated by adult males (stage M3B, 20.4%), females (stage F3D, 22.3%), and juveniles (15%). The 2025 survey also estimated fin whale (Balaenoptera physalus) density to 0.18 ind. m-2 (0.14-0.25 95% CI) and humpback whale (Megaptera novaeangliae) density to 0.07 ind. m-2 (0.04-0.12 95% CI).
1 - Introduction
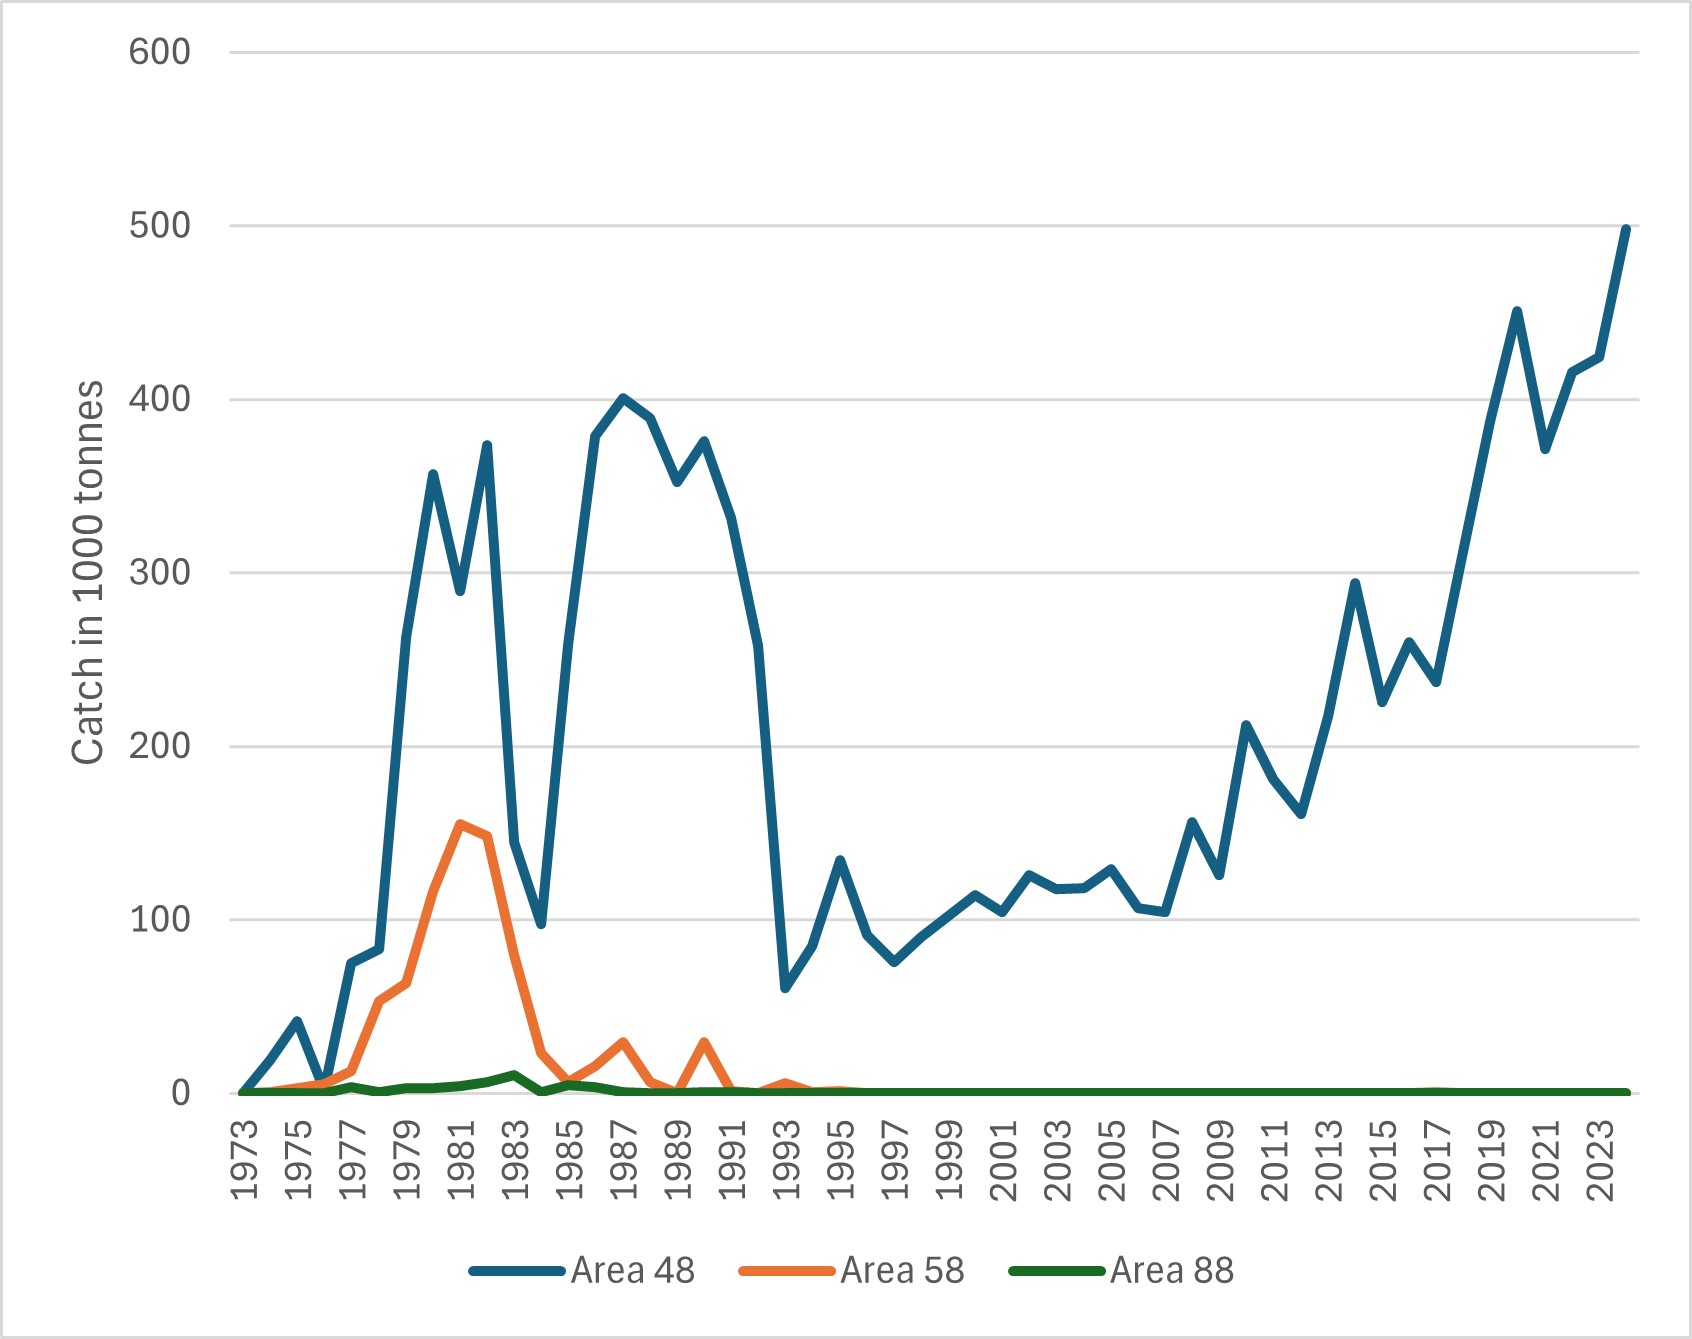
The Antarctic krill (Euphausia superba) fishery began in the early 1970s and peaked in the late 1980s, with catches up to around 500,000 tons per year, by USSR and Japanese vessels operating in various areas of the Southern Ocean. In response to the growing commercial interest in Antarctic krill resources, the Commission for the Conservation of Antarctic Marine Living Resources (CCAMLR) was established in 1982. As an international commission CCAMLR is responsible for the conservation of Antarctic marine ecosystems. This does not exclude harvesting as long as such harvesting is carried out in a sustainable manner and takes account of the effects of fishing on other components of the ecosystem. Fishing activity declined during the period when the USSR dissolved (formally dissolved in December 1991). Since 1997, the Antarctic krill fishery has primarily concentrated within the Southwest Atlantic sector of the Southern Ocean, specifically in CCAMLR subareas 48.1, 48.2, and 48.3. In 1991, CCAMLR established a fixed precautionary annual catch limit (trigger level) for the sector including subareas 48.1-4, set at 620,000 tons. Additionally, a total catch limit of 440,000 tons has been set for subarea 58.4.1, and 260,000 tons are available for fishing in subarea 58.4.2. Unless otherwise specified, an exploratory catch limit for any statistical subarea in the Southern Ocean is set at 15,000 tons.
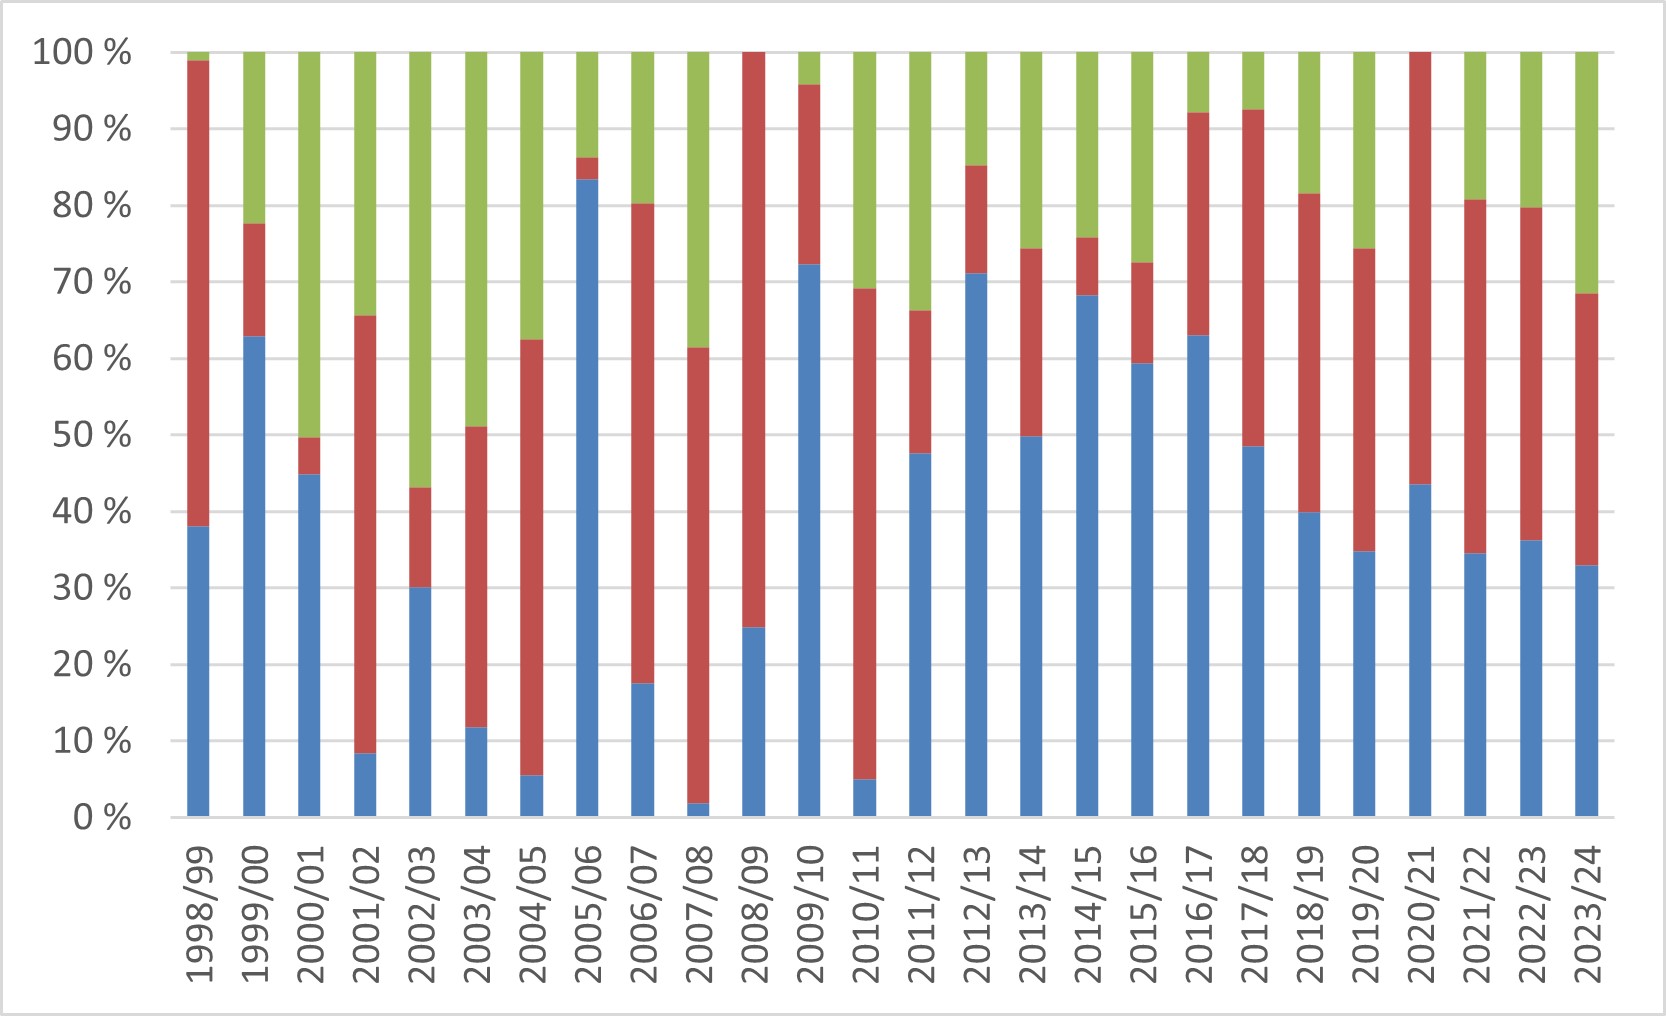
From the total krill catch of 498,350 tons in the 2023/24 season, 33% was harvested in subarea 48.1, 35% in subarea 48.2, and 31% in subarea 48.3 (Figure 2).
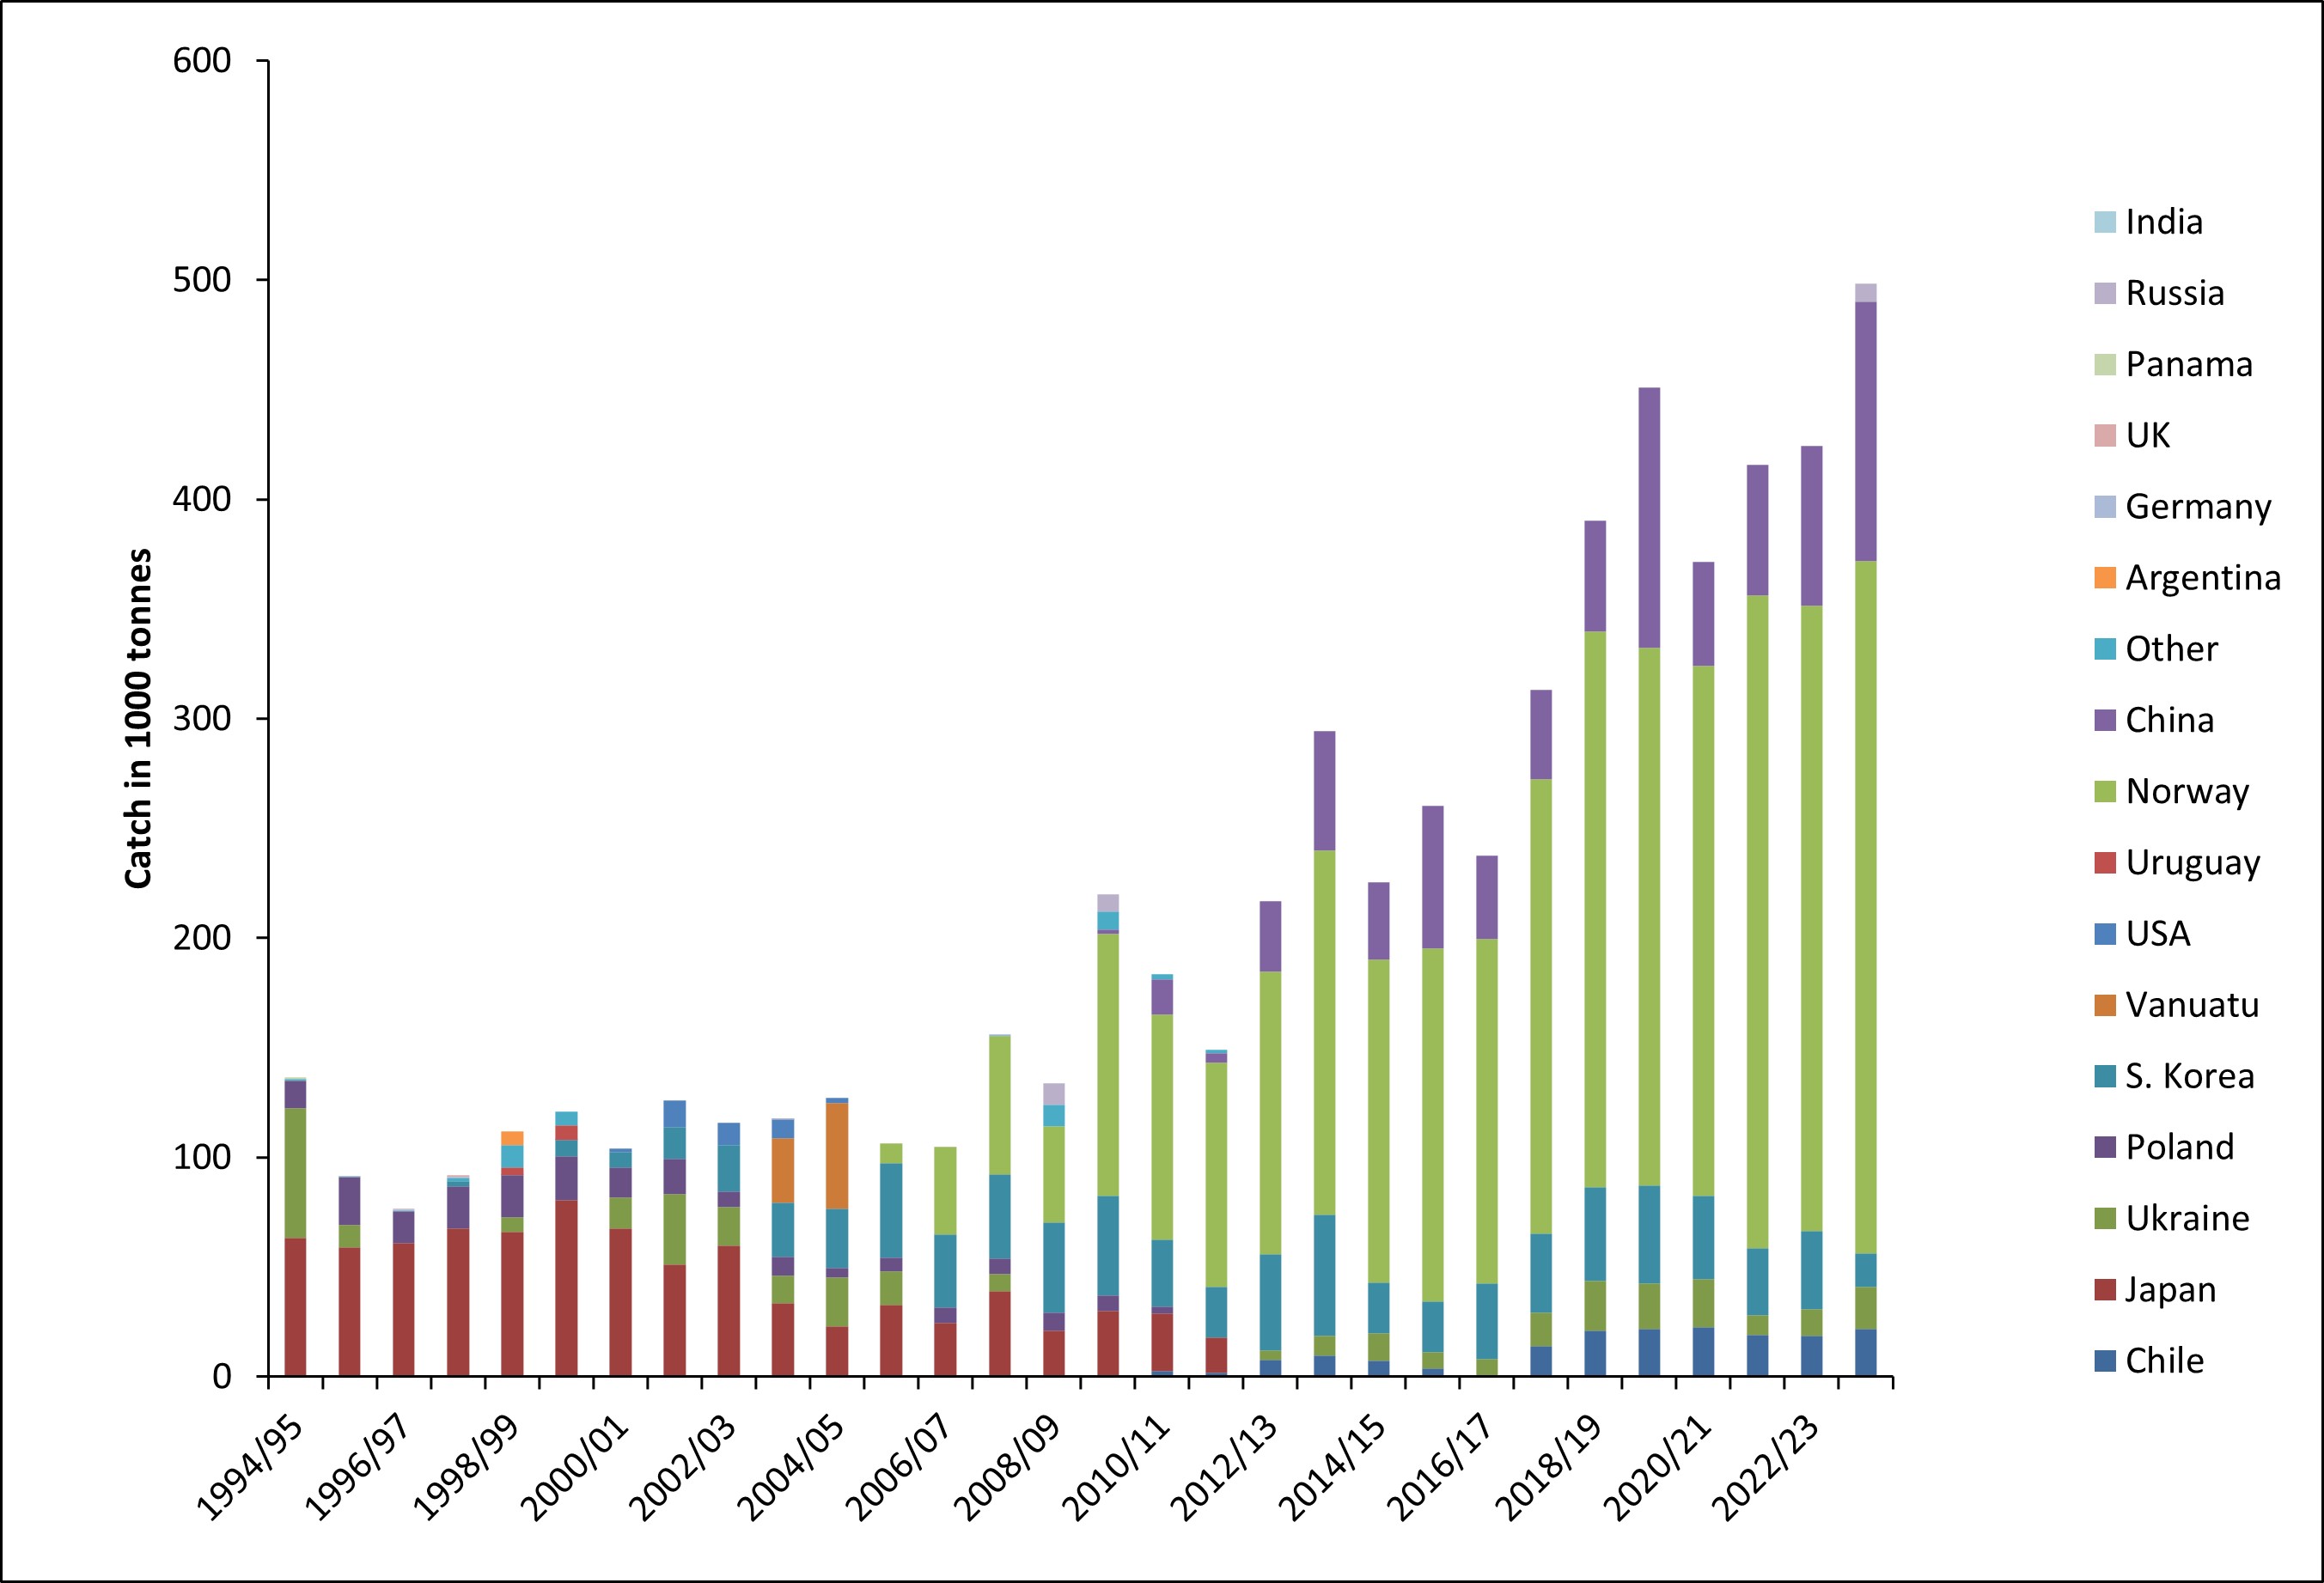
During the 2023/24 fishing season, the Norwegian krill industry accounted for 63% of the total catch, while Chinese vessels caught 24%. Chile and Ukraine each contributed 4%, South Korea 3%, and Russia 2% (Figure 3).
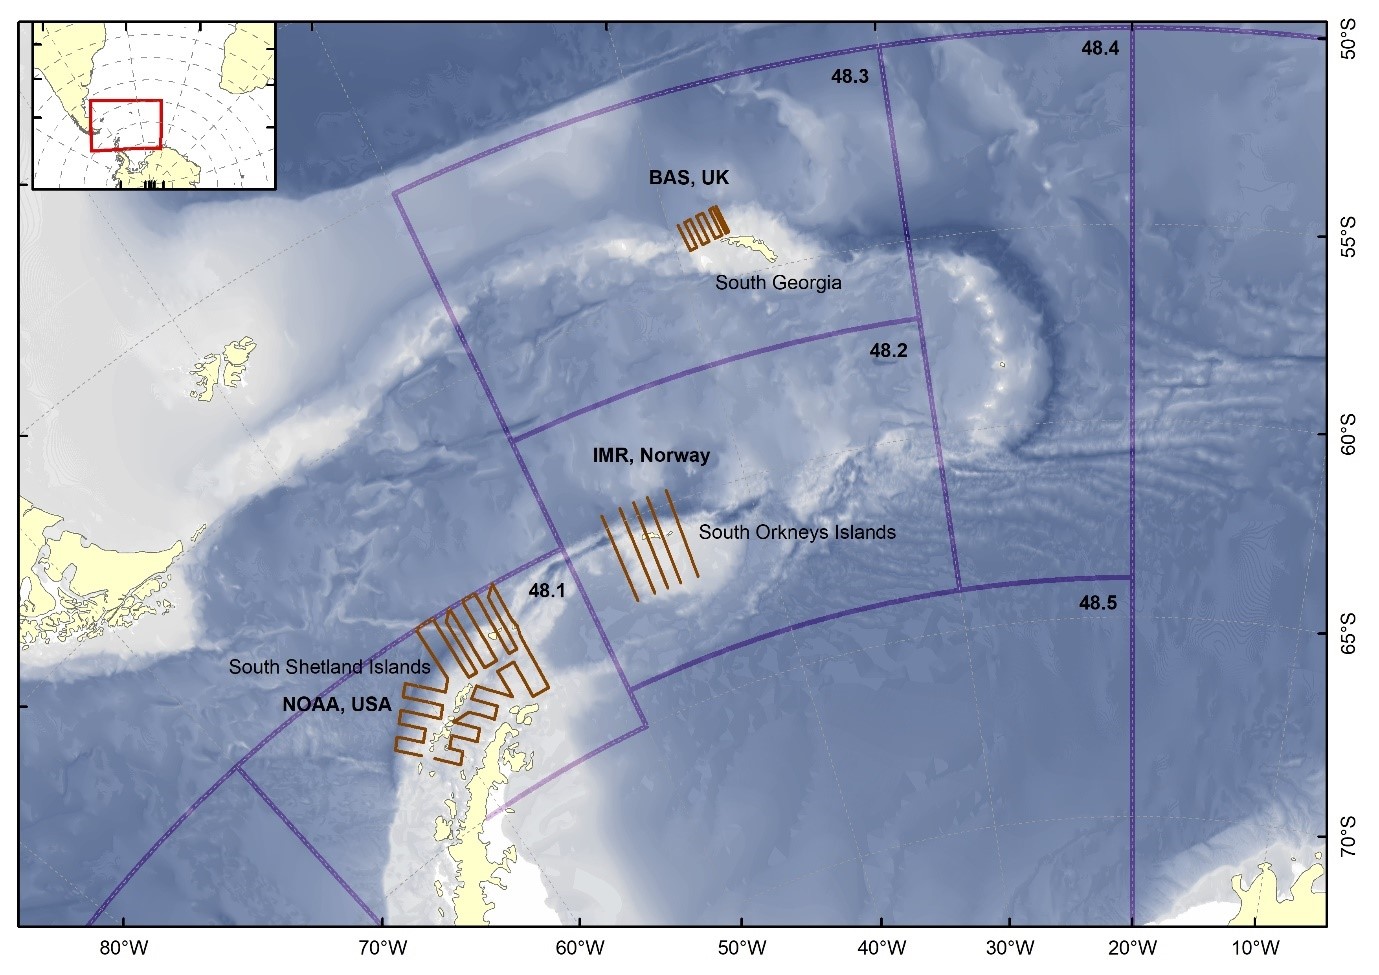
Two large-scale acoustic trawl surveys were conducted in the Southwest Atlantic sector of the Southern Ocean (subareas 48.1-48.4), estimating the total biomass of krill in these fishing areas to be 62.6 Mt in 2019 (Krafft et al., 2021), which was similar to the other synoptic survey in 2000 (60.3 Mt; CCAMLR, 2010). Regular meso-scale monitoring of krill distribution and demographic composition in these fishing areas has been carried out since 1996 in subarea 48.1 (Reiss et al., 2008, 2017; Yu et al., 2019; Krafft et al., 2021; Wang et al., 2021). Previously, these surveys were conducted during the austral summer, but they are now also performed during the austral winter. The British Antarctic Survey has been running an annual acoustic survey off the South Georgia Islands ("Western core-box" in subarea 48.3) since 1997 (Fielding et al., 2014) during the summer season.
In accordance with licensing conditions set by the Norwegian Directorate of Fisheries, Norwegian krill fishing companies must ensure the necessary logistical operations for conducting an annual krill monitoring survey. These conditions have been in effect since 2011 and will continue as long as they engage in commercial activities in the Southern Ocean (Jensen et al., 2010). Through discussions in CCAMLR WG-EMM (Working Group on Ecosystem Monitoring and Management) in 2010, it was agreed that the survey could be carried out in the CCAMLR statistical Subarea 48.2 according to similar standards as the annual scientific surveys undertaken in 48.1 and 48.3 and that the surveys should be executed by scientists from the Institute of Marine Research, Norway. The three surveys could form an integrated monitoring effort extending across the Scotia Sea (Figure 2), linking three of the areas with highest concentrations of krill and highest fishing activity. The results will help evaluate and develop the management of the krill fishery (Hill et al., 2016).
The first annual survey was conducted in January/February 2011 using the FV 'Saga Sea' (Aker Biomarine ASA). The results and study design from this survey were presented at the CCAMLR WG-EMM in 2011. The original survey design, suggested during WG-EMM 2010, consisted of six parallel north-south bound transects extending 100 nautical miles. During this first survey season, it was recognized that there was a need to extend the monitoring effort to cover the waters over the shelf edge, north of the South Orkney archipelago, where most krill in this region were observed to aggregate. During the WG-EMM meeting in 2011, it was agreed to extend the survey transects 20 nautical miles northwards and to omit the westernmost transect line from the 2011 survey. Before the survey in 2014, it was also agreed to extend the transect lines further to the south to cover the northern part of the Marine Protected Area south of the South Orkney Islands, and the design has remained unchanged since then (Figure 4).
Results and activities from these annual South Orkney surveys are reported to WG-EMM (e.g., Krafft et al., 2018b; Skaret et al., 2019) and are published in the primary literature (e.g., Krafft et al., 2018a, 2019; Skaret et al., 2023). This report presents the survey activities from the 2025 season off the South Orkney Islands, including results from acoustic recordings, taxonomic sorting of trawl catches, and krill predator sighting data collected during daylight hours along the transects. Given available funding and survey ship time, the implementation of various projects in addition to the prioritized core activities is possible in some survey years, as presented in this report.
2 - Material and Methods
2.1 - Survey Design, area and vessel
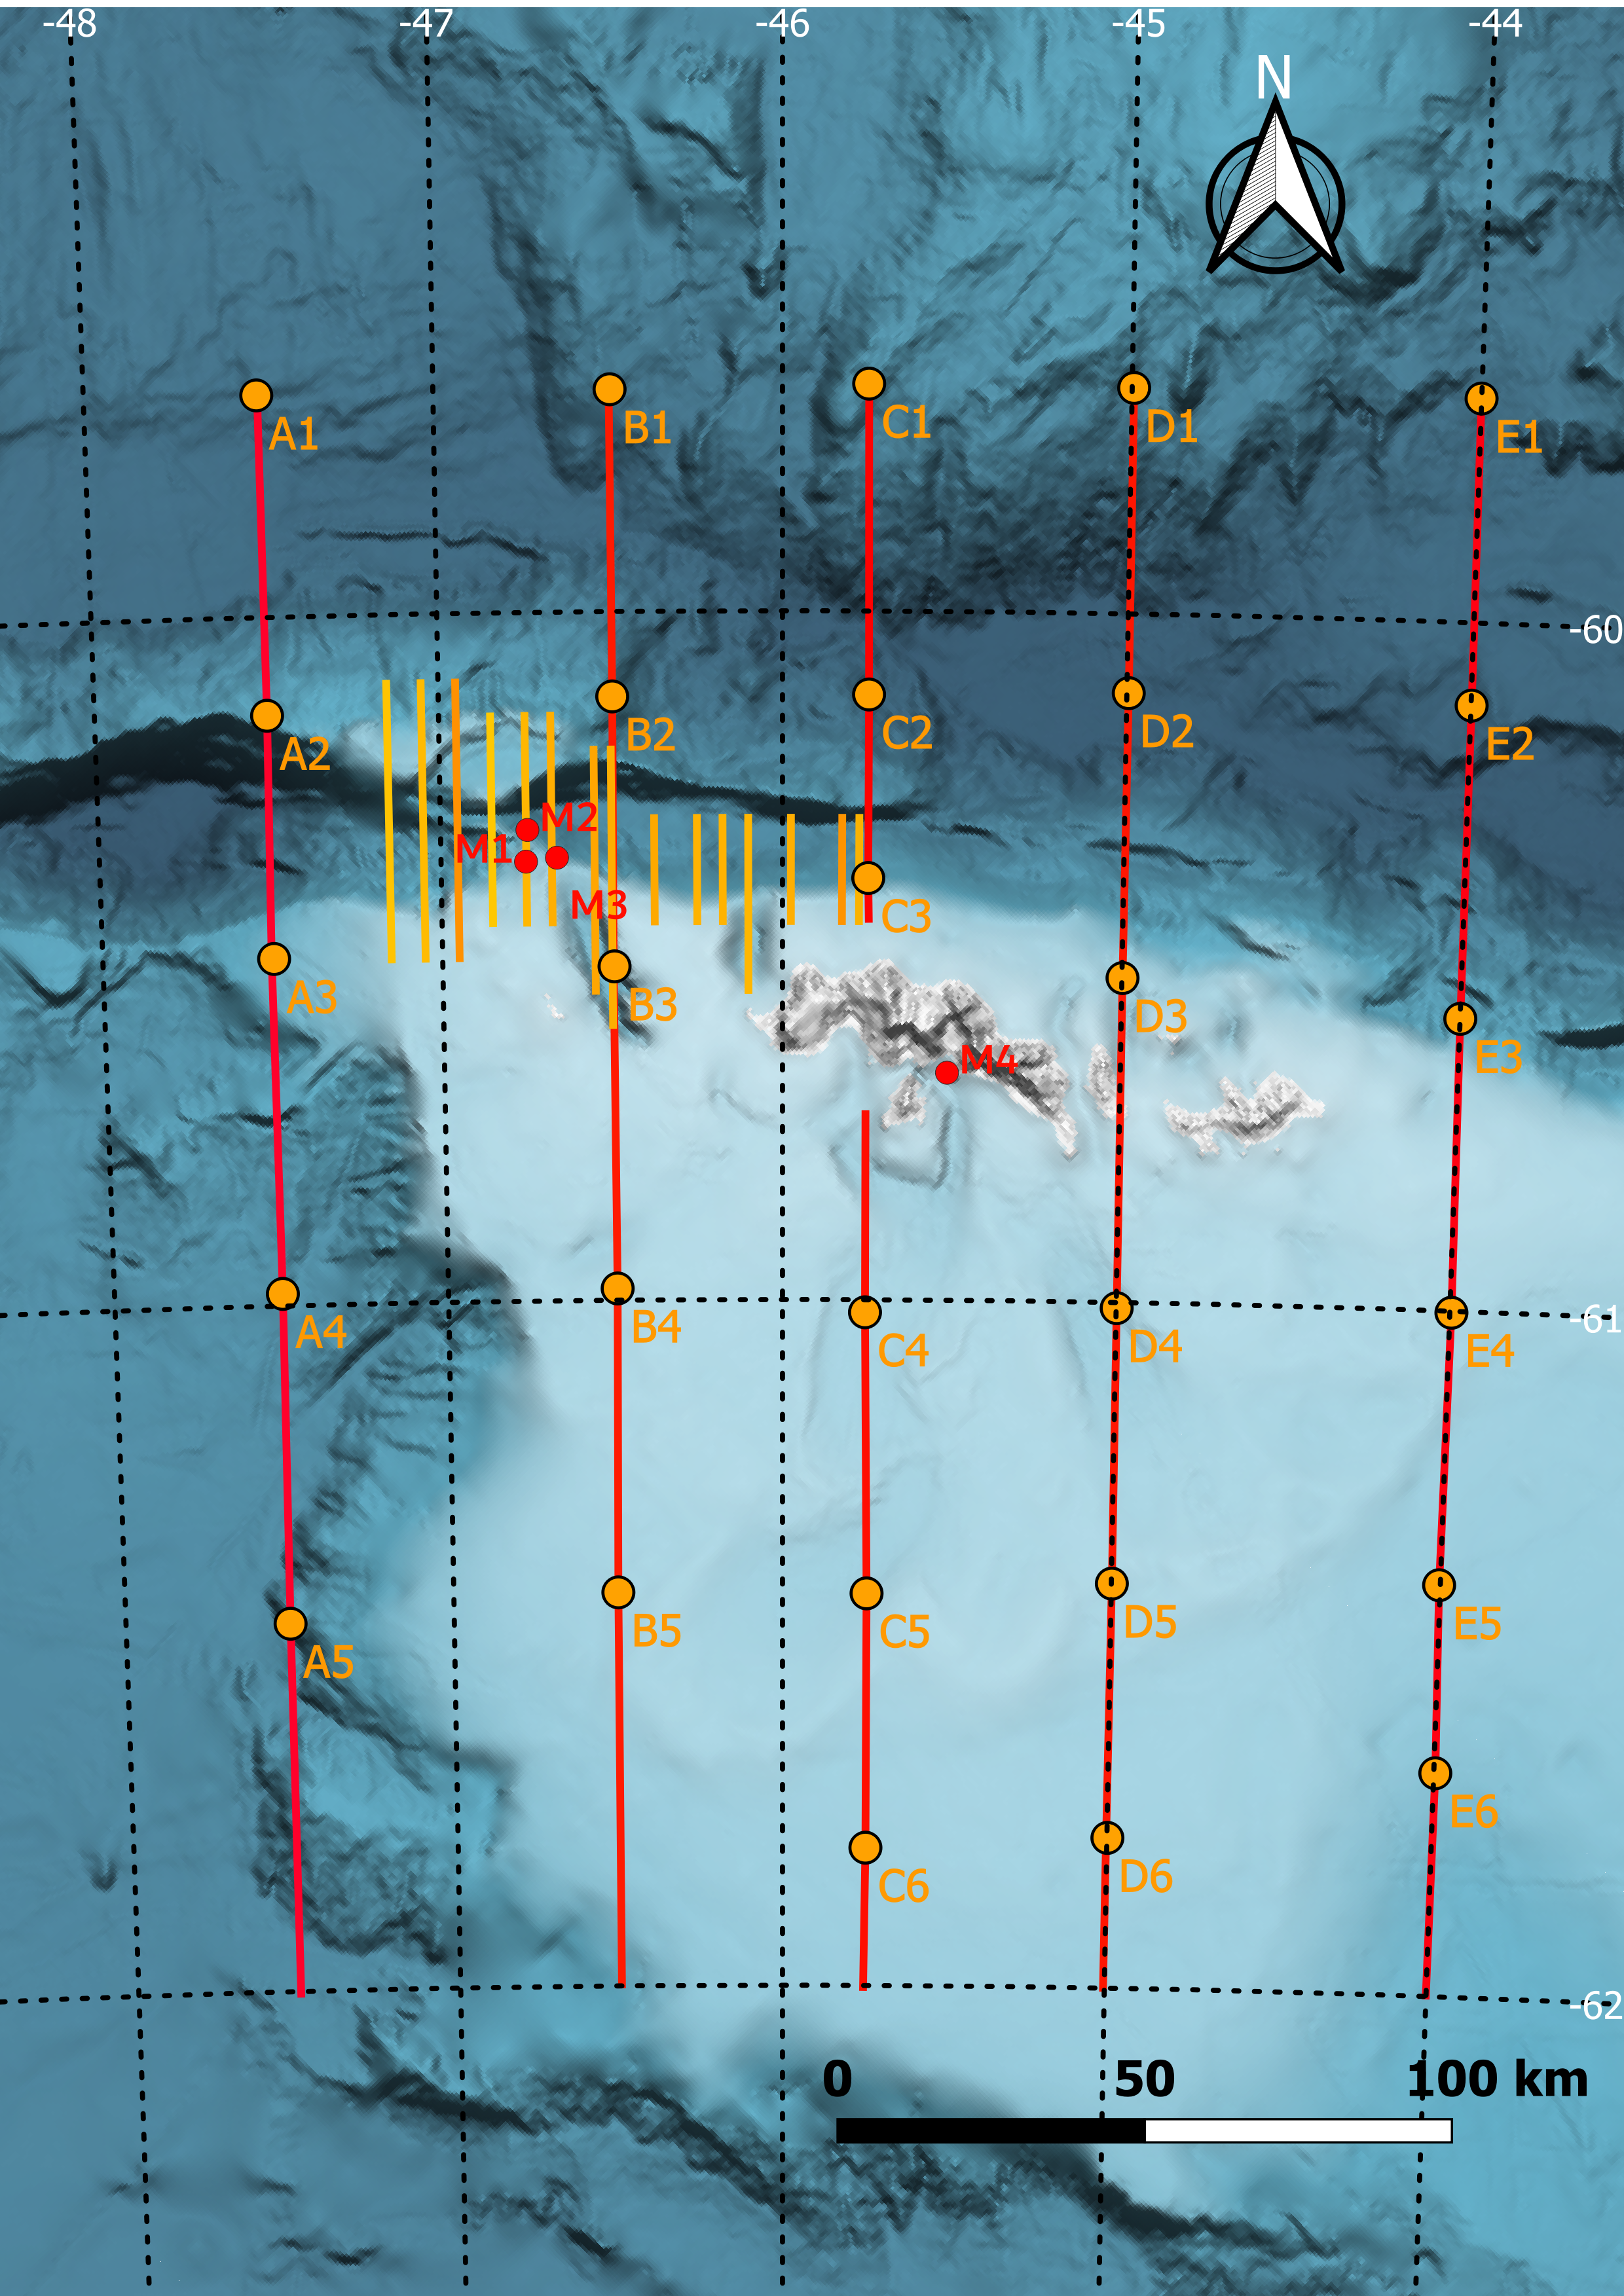
The Cargo vessel “Antarctic Provider” (Aker Biomarine AS) departed Montevideo, Uruguay, on the 19. January 2025. On the 24. February 2025, the survey ended by reaching port in Montevideo. The survey design covers 60 360 km2 of the waters around the South Orkney Islands and includes five parallel transects extending from the northernmost waypoints at 59.67°S and southernmost waypoint at 62.00°S. Longitudes for transects 1 through 5 are at 44°W, 45°W, 45.75°W, 46.5°W and 47.5° W, respectively.
In addition, a smaller Shelf edge stratum at 2368 km2 was covered with a denser transect grid. The Shelf edge stratum covers the locations with the highest historical krill catches. The acoustic sampling effort is higher than in the main strata, but otherwise, the design is the same (Figure 5).
2.2 - Acoustic data collection
2.2.1 - Vessel mounted echosounders
During the survey, ‘Antarctic Provider’ was equipped with Simrad EK80, 18 kHz and EK60 echo sounders operating at 38, 70, 120 and 200 kHz.
The echosounders were calibrated off Signy Island using the standard sphere calibration method (Foote et al., 1987). The echo sounder was operating with a ping interval at or close to 1 per second. Nominal vessel speed during surveying is 10 knots and could be kept during most of the survey. Acoustic data were collected down to 500 m on all five frequencies. Other transceiver settings are specified in Table 1.
| Transducer type | ES18 | ES38-7 | ES70-7C | ES120-7C | ES200-7C |
| Transmitted power (W) | 1600 | 2000 | 750 | 250 | 2000 |
| Pulse duration (ms) | 1.024 | 1.024 | 1.024 | 1.024 | 1.024 |
| Absorption coefficient (dB km-1) | 3.48 | 10.21 | 17.89 | 25.83 | 39.85 |
| Sound speed (ms-1) | 1452 | 1452 | 1452 | 1452 | 1452 |
| Sample distance (m) | 0.186 | 0.0348 | 0.186 | 0.186 | 0.186 |
| Two-way beam angle (dB) | -17 | -20.7 | -20.7 | -20.7 | -20.7 |
| Sv transducer gain (dB) | 21.07 | 26.99 | 26.62 | 26.56 | 25.97 |
| SA-correction | -0.47 | -0.12 | -0.33 | -0.36 | -0.33 |
2.2.2 - Acoustic moorings
Mooring recovery:
Mooring 1: Nortek Signature 100, CTD at S 60°21.900 and W 046°45.320W
Mooring 2: Nortek Signature 100, 2 CTDs, Aural M3 (PAM) at S 60°19.110 and W46°44.887
Mooring deployment:
Mooring 1: Nortek Signature 100, 2 CTDs at S 60°21.6814 and W 046°45.0552
Mooring 2: Nortek Signature 100, 2 CTDs, Aural M3 (PAM) at S 60°18.9248 and W46°44.7424
Mooring 3: ASL, 2 CTDs at S 60°21.3716 and W 046°39.6076
Mooring 4: Soundtrap ST600 at S 60°66928 and W 045°51249
2.3 - Acoustic data analyses
2.3.1 - Discrimination of targets
In this work, we applied the standard swarm-based technique for krill discrimination on 120 kHz data using an Echoview work template, which includes noise removal filters, a swarm detection filter and an integration module (CCAMLR, 2017). Swarm detection was implemented using the Large Scale Survey System (LSSS) computer program (Korneliussen et al., 2016).
2.3.2 - Target strength prediction
The NASC were converted to biomass density (g m-2) using the SDWBApackage2010 (Conti and Demer, 2006; SG-ASAM 2010; Calise and Skaret, 2011) according to the CCAMLR protocol. The model was parameterized according to Table 1, or if nothing else specified according to Calise and Skaret (2011).
The predicted target strengths were used to calculate weighted conversion factors (CF) from NASC-values to biomass density
![]()
where f is the frequency of a specific length group (i) and W(TL) is weight at total length, which was calculated following Hewitt et al. (2004):
![]()
σ(TL) is the backscattering cross-section at a specific total length and was calculated using the full SDWBA model.
2.4 - Estimation of biomass
Based on the average biomass density for each nautical mile, a weighted biomass density for each transect line could be calculated and the sampling variance from the averages of each transect line according to Jolly and Hampton (1990).
2.5 - Biological sampling
The survey design included trawl stations spaced ~20–25 nautical miles apart along the set parallel north-south oriented transect lines (Figure 5). The standard survey trawl used was 42 m long, with a 36 m2 mouth opening, constructed of 7 mm (stretched) diamond shaped meshes from mouth to rear, or a 3 mm light opening (Figure 6). The trawl was towed using a 6 m wide steel beam with 200 kg weights on each lower wing tip to ensure fast deployment to depth and the best possible geometric stability of the trawl during sampling.
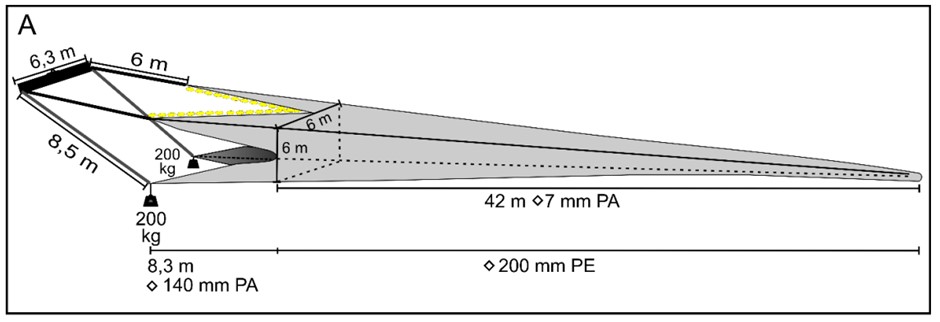
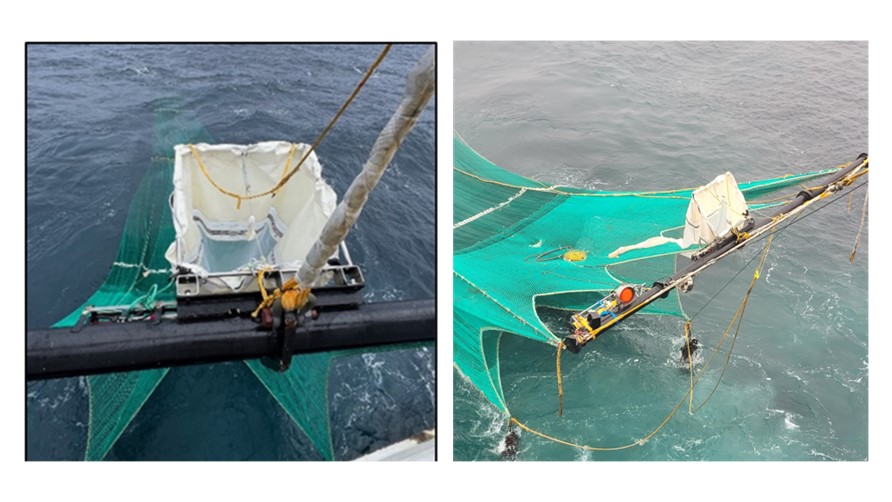
Attached on top of the steel beam was a 75x75 cm frame carrying a 180 µm meshed 3 m mesozooplankton net. A Hydro-Bios mechanical flowmeter was attached in the center of the mouth (Figure 7).
At each station the trawl was lowered vertically from surface to ~200 m depth (or ~20 m above bottom if the depth was < 200 m) and then hauled in at 1.5 - 2.0 knots, including vessel and wire speed. When landed on the trawl deck, the cod end was opened, and the catch was removed. Thereby the towing rig was hung from a crane and flushed on deck to wash out biological remains stuck in the net. The macrozooplankton and micronekton were sorted, identified to species or to the nearest possible taxonomic group, and weighed. For E. superba, the body length was measured (± 0.1 mm) from the anterior margin of the eye to the tip of telson excluding the setae, according to the “Discovery” method of Marr (1962). Sex and maturity stages of E. superba were determined on fresh material using the classification methods outlined by Makorov and Denys (1981). In brief, juveniles were classified due to their lack of visible sexual characteristics. Males were divided into three subadult stages: M2A1, M2A2 and M2A3 and two adult stages: M3A and M3B; and females were divided into one subadult stage: F2A and five adult stages: F3A, F3B, F3C, F3D and F3E (Krafft et al., 2015).
The catch sampled with the 180 µm net was split using a plankton splitter. One half was preserved in 4% buffered formaldehyde for onshore visual taxonomical analysis. The other half was blended in a 1000W mixer for 2-3 minutes until reaching complete homogeneity. Thereby, 2 ml homogenate were extracted using a 5 ml pipette, added to a cryovial pre-filled with TES buffer (Tris, EDTA and SDS solution) and preserved at -20°C. Two replicates were taken per homogenate. All cryovials were transported to an onshore lab for metabarcoding.
2.6 - Marine mammal and penguin observations
Observations of marine mammals and penguins were carried out by dedicated observers during daylight hours, whenever visibility was sufficient. The observer was located on the bridge and continuously scanned the starboard forward quarter (0 – 90°), binoculars were used for species identification. Angle were estimated using a drawn angle board. Distance estimation was aided by using the reticles in the binoculars that marked one milliradian per line. Together with the platform and observer height (20.3+1.7m), each reticles line from the horizon marked a known distance.
Observations were only recorded on straight sections of the vessel track with a nominal vessel speed of 10 knots. The vessel GPS track and logged effort were recorded with custom software on a windows tablet (DOI 10.5281/zenodo.10228669). For each observation the species, time, location, distance, angle, visibility and number of individuals were noted.
2.7 - Understanding krill trawl avoidance
Understanding the proportion of krill that avoids the trawl mouth is crucial for designing gear that minimizes escape rates, thereby ensuring a more efficient capture process. This can involve modifications to net design, mesh size, and trawl speed to reduce the likelihood of krill evading capture. Additionally, knowledge about krill responses to trawl gear enables the development of methods incorporating other stimuli to guide krill into the trawl. Accurate data on krill demographics (age, size, sex) are essential for ecological and population studies. If a significant portion of krill escapes, the samples collected may not accurately represent the population structure in the water column. Ensuring representative samples helps in making reliable assessments of krill biomass and population dynamics. Furthermore, effective gear and techniques that reduce escape rates contribute to sustainable fisheries management by providing more accurate data on krill populations. This information is vital for setting quotas and managing krill fisheries to prevent overexploitation.
During this survey, a self-contained scientific echosounder system (SIMRAD WideBand Autonomous Transceiver (WBAT); Simrad Kongsberg Maritime AS) was attached to the beam of the trawl with a 120 kHz transducer mounted forward-facing (see Figure 7). A similar study design have been used previously to describe the behavior of mesopelagic organisms in front of the trawl mouth (Underwood et al., 2020). With this setup, 10 tows aimed at large krill swarms were performed while logging acoustic data. Additionally, the total length of approximately 400 individual krill from each haul was measured following Marr (1962). This dataset will form the basis for future analyses of organism densities in front of the trawl, the vertical profiles of organism target strength, and the movement of organisms in front of the trawl.
3 - Results
3.1 - Acoustics
3.1.1 - Acoustic survey estimates of krill distribution and biomass
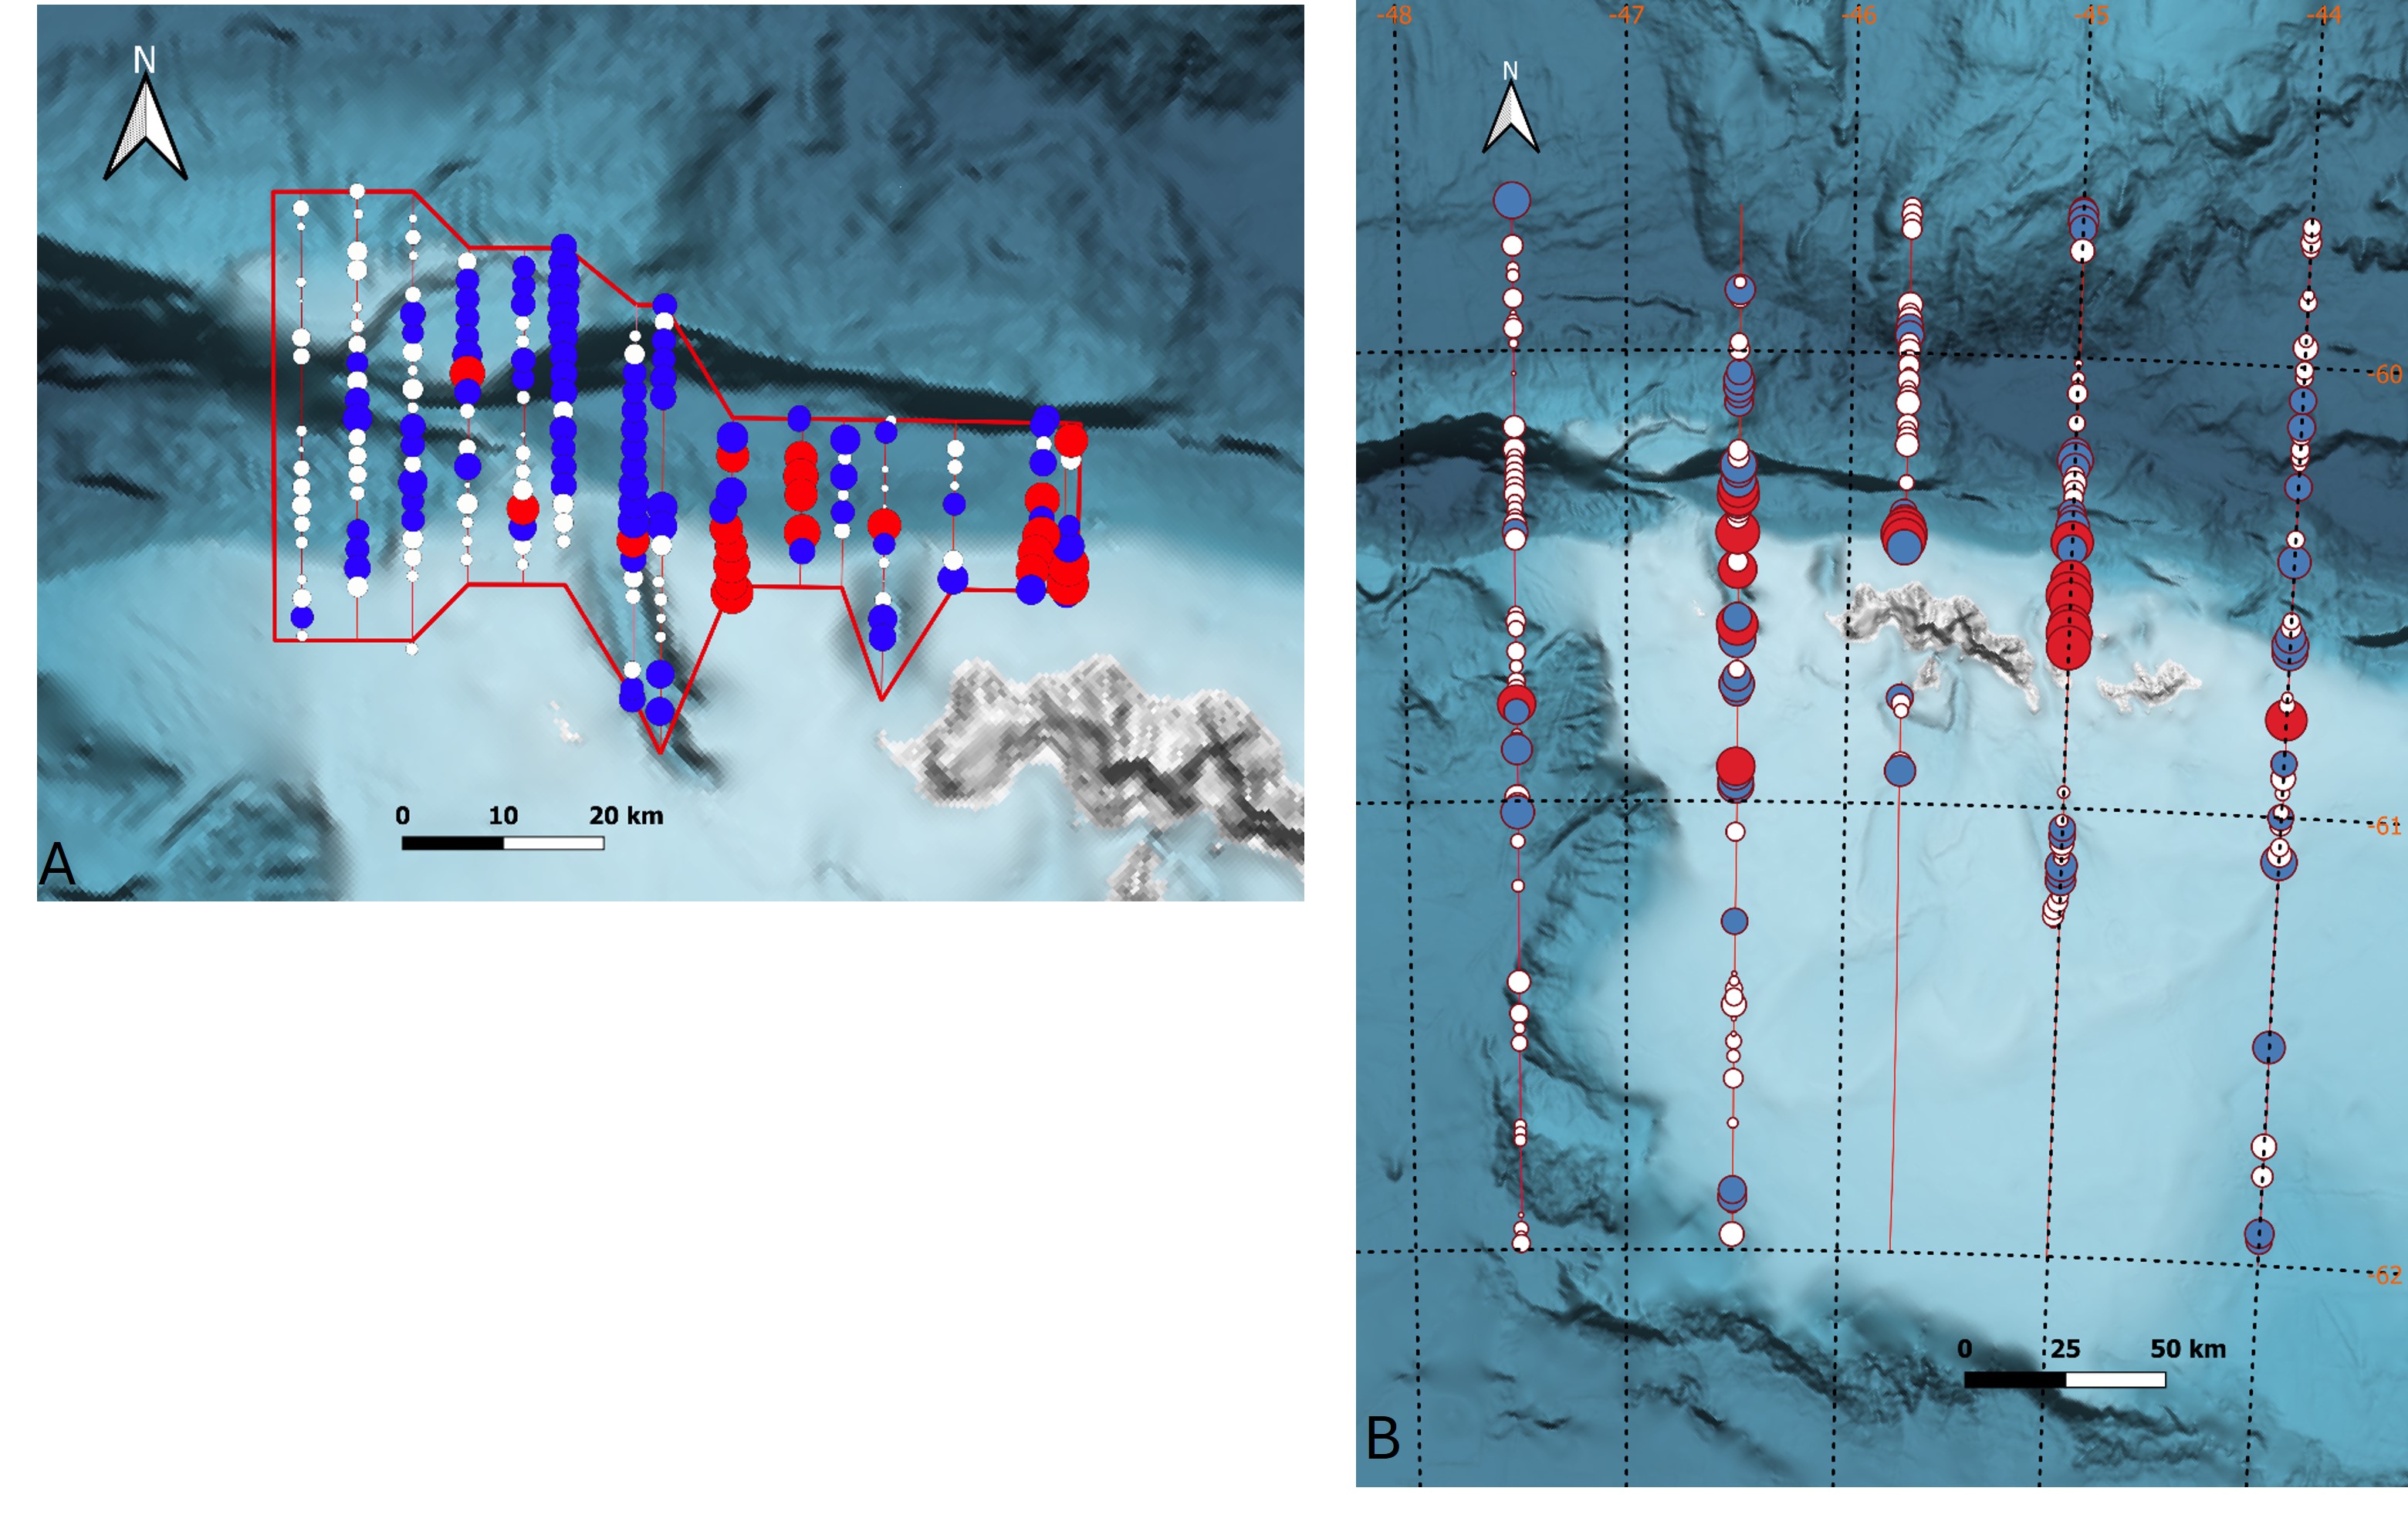
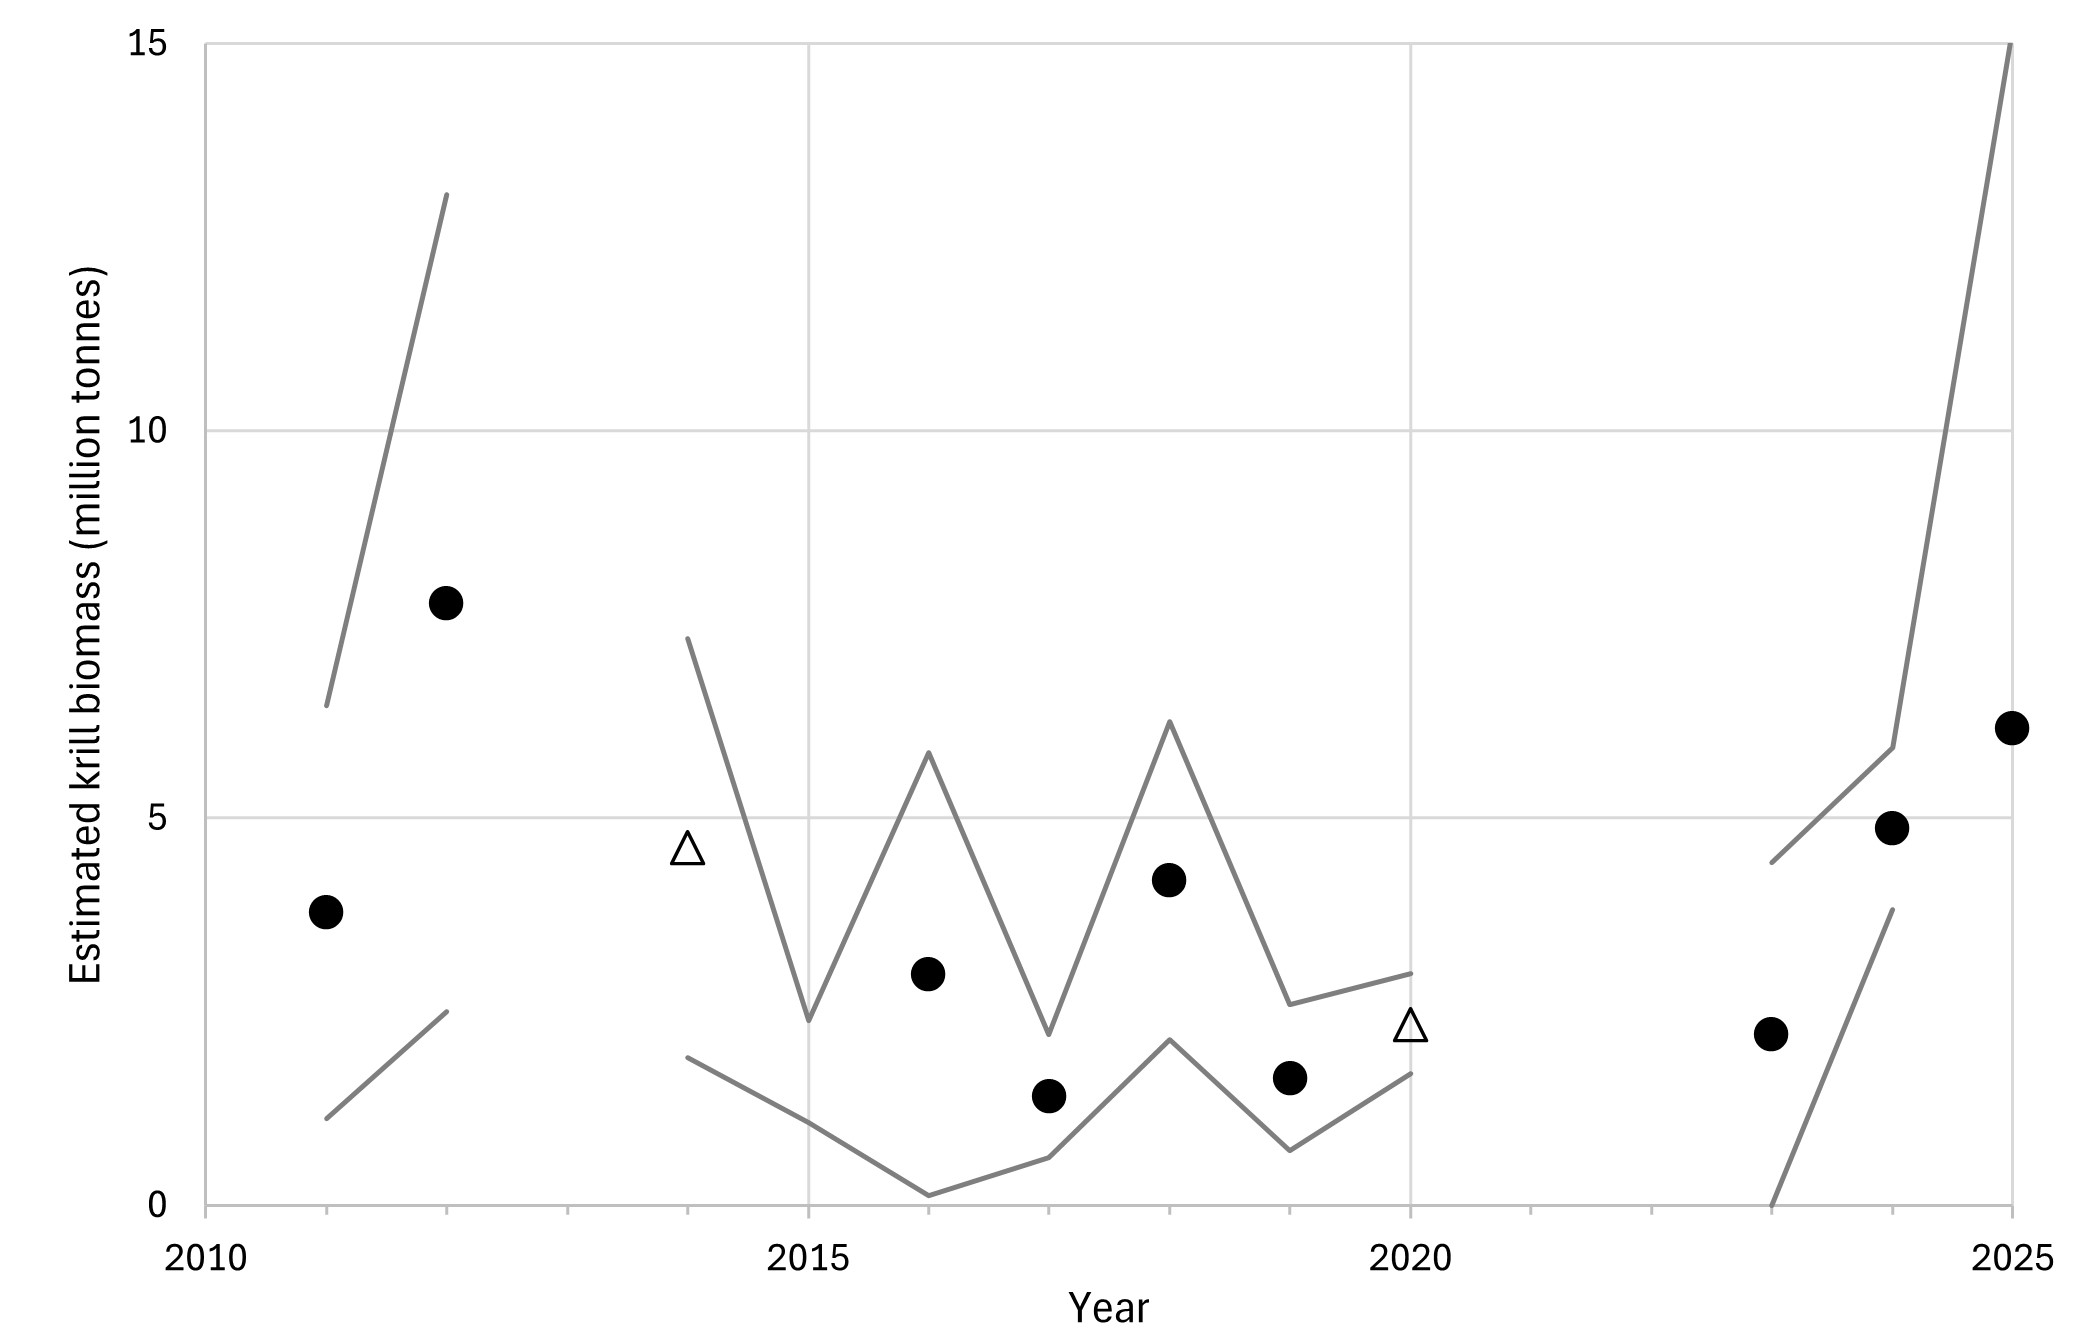
The distribution of acoustic backscatter allocated to krill is illustrated in Figure 8. The highest NASC-values allocated to krill were observed around the shelf edge and the South Orkney Islands Plateau. The biomass estimates for the small Shelf edge stratum are shown in Table 2 and for the overall stratum the density was 102.0 g/m-2, with 6.16 million tonn biomass (CV: 0.75, Figure 9).
| Year | Freq | Density (g/m2) | BM (mill. t) | CV |
| 2015 | 38 | 31.6 | 0.07 | 0.24 |
| 2019 | 120 | 217.6 | 0.52 | 0.19 |
| 2020 | 38 | 62,0 | 0.15 | 0.27 |
| 2023 | 120 | 202.9 | 0.48 | 0.23 |
| 2024 | 120 | 279.4 | 0.66 | 0.27 |
| 2025 | 120 | 142.4 | 0.34 | 0.32 |
3.2 - Biological sampling
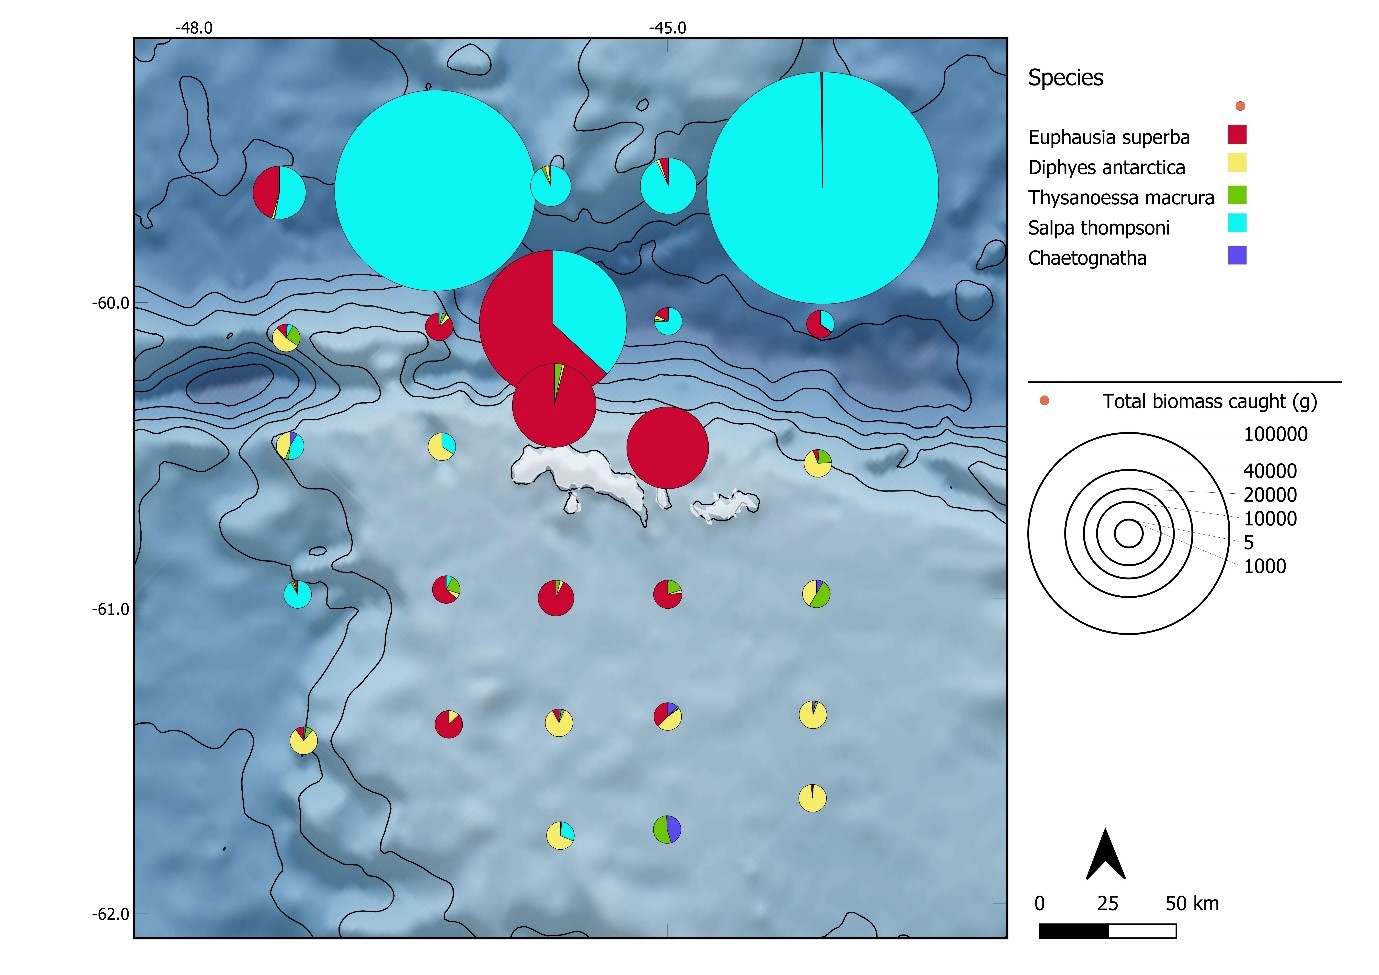
A total of 28 trawl stations were successfully completed during the survey. A total of 38 taxonomic groups were identified, with 18 to species level.
The largest catch weight was recorded in the northernmost and deeper stations of the study area. The maximum catch weight was 133,5 kg at station E1, being dominated by Salpa thompsoni (99.5%). Most of the salps were caught at the offshore stations, while the larger catches of E. superba were registered at the shelf slope. In total, three species of euphausiids were identified: E. superba, E. triacantha and Thysanoessa macrura. The siphonophore Diphyes antarctica was the most frequent occurring species and found at 24 stations, followed by E. superba and T. macrura which were recorded at 23 and 21 stations, respectively (Figure 10). Chaetognatha was found at 17 stations, but in low quantities.
Mesozooplankton were collected at 26 stations and processed as described in Materials and Methods.
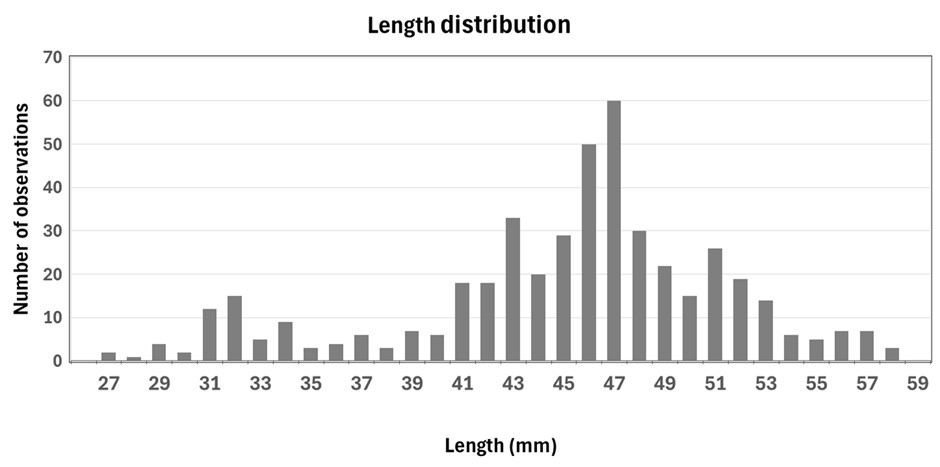
A total of 2247 individual E. superba were length measured and staged. The mean body length was 42.6 mm (SD: 6.6), with a range between 25.3 – 59.4 mm (Figure 11). The demographic composition was dominated by adult females F3D (22.3%), males M3B (20.4%), and juveniles (15%) (Table 3).
| Stage | N | Proportion | Mean TL ± SD |
| Juveniles | 336 | 15.0 | 33.5 ± 3.0 |
| F2B | 135 | 6.0 | 35.5 ± 3.3 |
| F3A | 98 | 4.4 | 39.8 ± 2.9 |
| F3B | 95 | 4.2 | 42.5 ± 2.9 |
| F3C | 89 | 4.0 | 44.1 ± 3.7 |
| F3D | 500 | 22.3 | 47.2 ± 4.4 |
| F3E | 5 | 0.2 | 41.4 ± 1.1 |
| M2A1 | 119 | 5.3 | 37.5 ± 4.5 |
| M2A2 | 239 | 10.6 | 40.8 ± 4.1 |
| M2A3 | 107 | 4.8 | 42.9 ± 3.2 |
| M3A | 65 | 2.9 | 45.8 ± 2.7 |
| M3B | 459 | 20.4 | 48.4 ± 3.5 |
3.3 - Krill predator observations
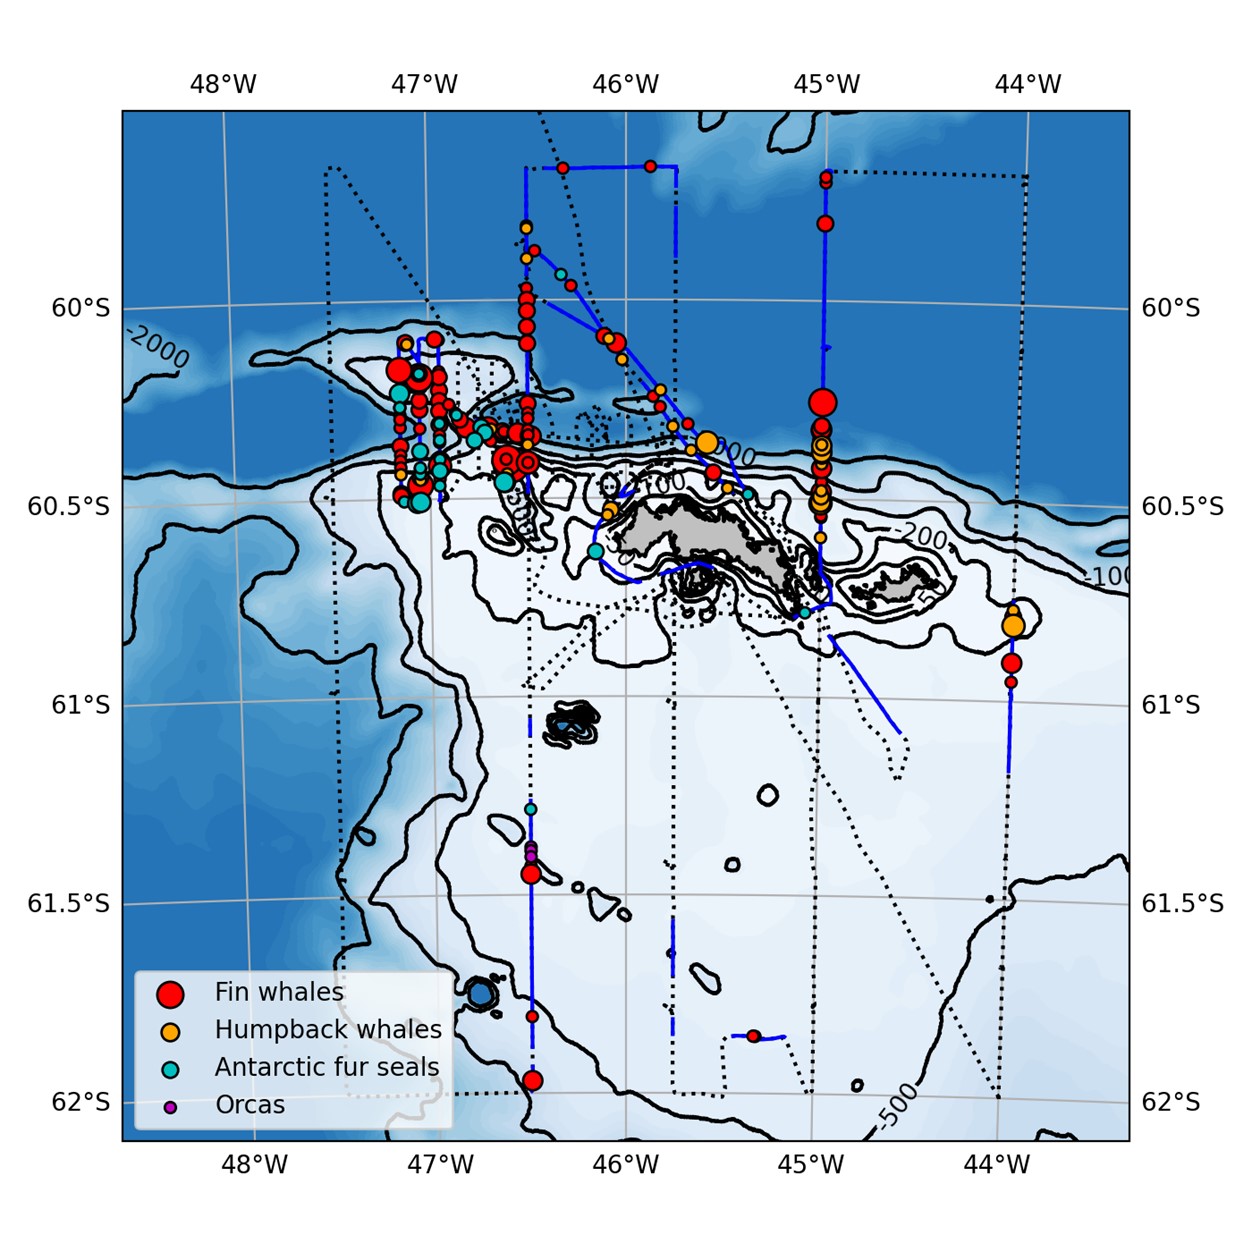
The observed species were Humpback whales (Megaptera novaeangliae), Antarctic fur seals (Arctocephalus gazella), Chinstrap penguins (Pygoscelis antarcticus), Fin whales (Balaenoptera physalus), and Orcas (Orcinus orca).
Table 4 lists the number of individuals observed per species, Figure 12 displays the location of the effort periods and observed marine mammals.
| Species | N |
| Unknown whale | 47 |
| Humpback whale | 54 |
| Antarctic fur seal | 45 |
| Chinstrap penguin | 402 |
| Fin whale | 239 |
| Unknown penguin | 4 |
| Orca | 3 |
| Unknown large odontocete | 3 |
Standard line transect distance sampling methods (Buckland et al., 2001) were used to analyze the fin and humpback whale sightings data using the Distance and mrds packages (Thomas et al., 2010, Miller et al., 2019) for the R language. We fitted a series of half-normal detection functions with a truncation distance of 4000 m to the observations from all survey years, setting year as co-variable. For the 2025 survey the effective strip width was 1148 m. Fin and humpback whale abundance was estimated using a Horvitz-Thompson estimator. For the 2025 survey the fin whale density in the overall stratum was estimated as 0.18 ind. m-2 (0.14 - 0.25 95% confidence intervals) and humpback whale density as 0.07 ind. m-2 (0.04 - 0.12 95% confidence intervals).
4 - Acknowledgements
This work is financed by the project KRILL (IMR, Ministry of Trade, Industry and Fisheries). We extend our gratitude to Aker Biomarine AS for providing ‘Antarctic Provider’ and its crew for disposal for this research survey free of charge. We are most grateful to the captain, officers, and crew on board for all the help provided during the survey.
5 - References
Buckland, S. T., Anderson, D. R., Burnham, K. P., Borchers, D. L., and Thomas, L. 2001. Introduction to Distance Sampling. Oxford University Press, Oxford, UK.
Calise, L. and Skaret, G. 2011. Sensitivity investigation of the SDWBA Antarctic krill target strength model to fatness, material contrasts and orientation. CCAMLR Science, Vol. 18 (2011): 97–122
CCAMLR (Convention on the Conservation of Antarctic Marine Living Resources). (2010) Report of the 29th meeting of the scientific committee, Hobart, TAS, Australia, 25-29th October, 2010. SC-CAMLR- XXIX. CCAMLR, Hobart, TAS, Australia.
Conti, S.G. and D.A. Demer. 2006. Improved parameterization of the SDWBA for estimating krill target strength. ICES Journal of Marine Science, 63 (5): 928-935.
Fielding, S., Watkins, J.L., Trathan, P.N., Enderlein, P., Waluda, C.M., Stowasser, G., Tarling, G.A. & Murphy, E.J. 2014. Interannual variability in Antarctic krill (Euphausia superba) density at South Georgia, Southern Ocean: 1997–2013. ICES Journal of Marine Science, 71: 2578–2588.
Foote, K.G., H.P. Vestnes, D.N. MacLennan and E.J. Simmonds. 1987. Calibration of acoustic instruments for fish density estimation: a practical guide. ICES Cooperative Research Report, 144, 69 pp.
Hewitt, R. P., Watkins, J., Naganobu, M., Sushin, V., Brierley, A. S., Demer, D., Kasatkina, S., Takao, Y., Goss, C., Malyshko, A., Brandon, M., Kawaguchi, S., Siegel, V., Trathan, P., Emery, J., Everson, I., and Miller, D. 2004. Biomass of Antarctic krill in the Scotia Sea in January/February 2000 and its use in revising an estimate of precautionary yield. Deep-Sea Research Part II-Topical Studies in Oceanography, 51: 1215-1236.
Hill SL, Atkinson A, Darby C, Fielding S, Krafft BA, Godø OR, Skaret G, Trathan P, Watkins J. 2016. Is current management of the Antarctic krill fishery in the Atlantic sector of the Southern Ocean precautionary? CCAMLR Science 23:31-51
Jensen N, Nicoll R, Iversen SA (2010) The importance of obtaining annual biomass information in CCAMLR Sub-area 48.2 to inform management of the krill fishery. WG-EMM-10/9, 5 pp
Jolly GM, Hampton I (1990) A stratified, random-transect design for acoustic surveys of fish stocks. Canadian Journal of Fisheries and Aquatic Sciences 47: 1282–1291.
Krafft BA, Macaulay GJ, Skaret G, Knutsen T, Bergstad OA, Lowther A, Huse G, Fielding S, Trathan P, Murphy E, Choi S-G, Chung S, Han I, Lee K, Zhao X, Wang X, Ying Y, Yu X, Demianenko K, Podhornyi V, Vishnyakova K, Pshenichnov L, Chuklin A, Shyshman H, Cox MJ, Reid K, Watters GM, Reiss CS, Hinke JT, Arata J, Godø OR, Hoem N. 2021. Standing stock of Antarctic krill (Euphausia superba Dana 1850 (Euphausiacea)) in the Southwest Atlantic sector of the Southern Ocean, 2019. 2021. Journal of Crustacean Biology. 41:1-17. https://doi.org/10.1093/jcbiol/ruab046
Krafft BA, Krag LA, Knutsen T, Skaret G, Jensen KHM, Krakstad JO, Larsen SH, Melle W, Iversen SA, Godø OR. 2018a. Summer distribution and demography of Antarctic krill (Euphausia superba) (Dana, 1852) (Euphausiacea) at the South Orkney Islands, 2011–2015. Journal of Crustacean Biology. P 1-7- Doi: 10.1093/jcbiol/ruy061
Krafft BA, Skaret G, Krag LA, Pedersen R. 2018b. Antarctic krill and ecosystem monitoring survey off the South Orkney Islands in 2018. WG-EMM CCAMLR 2018/04, 32 pp.
Makorov RR, Denys CJI (1981) Stages of sexual maturity of Euphausia superba. BIOMASS Handbook No. 11, pp 1-13
Marr J (1962) The natural history and geography of the Antarctic krill (Euphausia superba Dana). In: Discovery reports vol 32. National Institute of Oceanography, Cambridge University Press, Cambridge pp 33-464
Miller, D. L., Rexstad, E., Thomas, L., Laake, J. L., and Marshall, L. 2019. Distance sampling in R. Journal of Statistical Software, 89: 1–28.
Reiss C.S., A.M. Cossio, V. Loeb and D.A. Demer 2008. Variations in the biomass of Antarctic krill (Euphausia superba) around the South Shetland Islands, 1996-2006. ICES Journal of Marine Science. 65: 497-508.
Reiss C. S., A. Cossio, J. A. Santora, K. S. Dietrich, A. Murray, B. G. Mitchell, J. Walsh, E. L. Weiss, C. Gimpel, C. D. Jones, and G. M. Watters. 2017. Overwinter habitat selection by Antarctic krill under varying sea-ice conditions: Implications for top predators and fishery management. Marine Ecology - Progress Series 568:1-16.
SC-CAMLR. 2005. Report of the First Meeting of the Subgroup on Acoustic Survey and Analysis Method (SG-ASAM). In: Report of the Twenty-fourth Meeting of the Scientific Committee (SC-CAMLR-XXIV/BG/3), Annex 6. CCAMLR, Hobart, Australia: 564–585.
SG-ASAM. 2010. Report of the fifth meeting of the subgroup on acoustic survey and analysis method. Cambridge, UK, 1 to 4 June 2010. Submitted for: Report of the Twenty-ninth Meeting of the Scientific Committee (SC-CAMLR-XXIX/6). CCAMLR, Hobart, Australia: 23 pp.
Skaret G, Krafft BA, Macaulay G, Knutsen T, Bergstad OA. 2019. Results from the 2019 annual acoustic krill monitoring off the South Orkney Islands. CCAMLR WG-EMM-2019/69. 8 pp.
Skaret G, Macaulay GJ, Pedersen R, Wang X, Klevjer TA, Krag LA, Krafft BA.2023. Distribution and biomass estimation of Antarctic krill (Euphausia superba) off the South Orkney Islands during 2011-2020. ICES Journal of Marine Science, 2023, 0, 1–15 DOI: 10.1093/icesjms/fsad076
Thomas, L., Buckland, S. T., Rexstad, E. A., Laake, J. L., Strindberg, S., Hedley, S. L., Bishop, J. R. B., et al. 2010. Distance software: design and analysis of distance sampling surveys for estimating population size. Journal of Applied Ecology, 47: 5–14.
Underwood, M.J., García-Seoane, E., Klevjer, T. A., Macaulay, G. J., Melle, W. 2020. An acoustic method to observe the distribution and behaviour of mesopelagic organisms in front of a trawl, Deep Sea Research Part II: Topical Studies in Oceanography, Volume 180, 104873.
Wang X., X. Yu, X. Zhao, J. Zhang, G. Fan, Y. Ying and J. Zhu. 2021. Biomass estimates of Antarctic krill around the South Shetland Islands based on surveys conducted by a Chinese fishing vessel from 2013 to 2019. WG-ASAM-2021/13.
Yu X., X. Wang, X. Zhao, J. Zhang, G. Fan, Y. Ying and J. Zhu. 2019. Time series of Antarctic krill estimates around the South Shetland Islands from 2013 to 2019. SG-ASAM-2019/04 Rev. 1.