


Formålet med dette toktet var å hente inn hydrofon- og telemetri-riggene som ble satt ut i 2025 i områder planlagt for havvindutbygging i Nordsjøen. Utsettingen av disse riggene og samtidig merking av fisk har som mål å overvåke adferden til fisk og sjøpattedyr i to områder planlagt for havvindutbygging: Sørvest F og Vestavind F. Riggene ble satt ut basert på et kombinert BACI- og BAG-design, med sentrale påvirknings- og kontrollområder, samt at mottakere er plassert med større avstand for å overvåke langs en gradient eller transekt ut fra påvirkningsområdet. De 60 riggene ble satt ut i august 2025. Fisk ble merket i områdene i august og desember 2025. Under dette toktet ble riggene hentet inn, data ble lastet ned og batterier byttet, før de ble satt ut igjen. I tillegg ble det merket fisk i områdene.
Monitoring fish and marine mammal behaviour in areas planned for wind farm development
— Survey for maintenance of acoustic telemetry and hydrophone grid and fish tagging
Report series:
Toktrapport 2026-22
ISSN: 1503-6294
Published: 18.11.2026
Cruise no.: 2026200018
Project No.: 16152
Research group(s):
Akustikk og observasjonsmetodikk
Subject:
Havvind,
Merkede arter,
Biologisk lyd
Program:
Nordsjøen
Research group leader(s):
Rolf Korneliussen (Akustikk og observasjonsmetodikk)
Approved by:
Research Director(s):
Geir Huse
Program leader(s):
Henning Wehde og Lise Doksæter Sivle
Norsk sammendrag
Summary
The aim of this survey was to retrieve hydrophone and telemetry rigs that were set out in 2025, in areas planned for offshore wind development in the North Sea. Deployment of these rigs and concurrent fish tagging aims to monitor the behaviour of fish and marine mammals in two areas planned for offshore wind development: Sørvest F and Vestavind F. The rigs have been deployed following a combined BACI and BAG design, with core impact and core control areas, and more distantly spaced receivers deployed to monitor along a distance gradient/transect from the impact area. The 60 rigs were deployed in August 2025. Fish have been tagged in the areas in August and December 2025. During this survey, the rigs were retrieved, data offloaded, and batteries changed, and they were then set back out again. Additionally, fish were tagged in the areas.
1 - Background
The survey described in this report is part of the Institute of Marine Research (IMR)’s ecosystem monitoring of areas planned for offshore wind farm (OWF) development in Norway. OWFs have the potential to impact marine ecosystems at many levels and in various ways, and consistent long-term monitoring is required to better understand these impacts and to guide mitigation of any negative effects (de Jong et al., 2020). This includes impacts on marine mammals and fish, which may alter their distribution and behaviour following construction of offshore wind farms.
Acoustic telemetry and passive acoustic monitoring are methods that can be used for long-term, autonomous collection of data on presence and movement behaviours of tagged fish and vocalisations of marine mammals and fish. These methods can be used to investigate residency, connectivity, attraction or deterrence, swimming behaviours and vocalisation. As vocalisation may differ for example between feeding calls, mating, social and aggressive vocalisations, these may also indicate how these animals use the area. These methods can be particularly useful for monitoring OWF areas (e.g., Bicknell et al., 2025, Van Parijs et al., 2021), where it can be challenging to access and conduct traditional monitoring surveys (e.g., fishing and vessel based acoustic surveys) after OWF construction.
In Norwegian waters, the two areas planned to be developed first for OWF are Sørvest F, in the southern part of the North Sea close to the border to Denmark, and Vestavind F, also in the North Sea, in the Norwegian trench west of Utsira island. Sørvest F is expected to have bottom mounted wind turbines, while Vestavind F will have floating turbines. These two areas are currently the focus of IMR’s monitoring work.
To monitor the behaviour of fish and marine mammals at Sørvest F and Vestavind F, 60 rigs with acoustic monitoring equipment have been deployed following a combined before-after-control-impact (BACI) and before-after-gradient (BAG) design (Methratta 2020). The rigs include an acoustic telemetry receiver, which records information transmitted by acoustic tags in tagged fish, and most also include a hydrophone, which records sounds from biological (e.g., vocalisations of marine mammals and fish), environmental (e.g., weather) and anthropogenic sources (e.g., OWF construction activities and shipping). Eleven rigs are deployed within each of the areas planned for wind farm development (impact arrays) and eleven rigs are deployed in the same configuration at similar areas 100 km from the planned OWF sites (control arrays). Additionally, four receivers are deployed at further distances from the impact site in two directions, for monitoring along greater distances from the impact area (gradient/transect receivers). The equipment is planned to be deployed for 3 years before and 3 years after wind farm construction. This will allow us to gather data on how animals use the area before construction and how the installation of wind turbines will impact and potentially change this.
The rigs were first deployed during a survey with the research vessel GO Sars in August 2025 (survey number: 2025001025). Fish were tagged and released within the impact arrays during the same survey and an additional dedicated fish tagging survey with a chartered fishing vessel in December 2025 (survey number: 2025231001).
The purpose of this cruise was to retrieve the rigs deployed in August 2025, download the data, change the batteries, and redeploy. Additionally, more fish were to be captured and tagged.
2 - Cruise details
2.1 - Vessel
The cruise was conducted with a chartered fishing vessel. The vessel used was Hovden Viking, a fishing vessel, 46 m long and 12 m wide, rigged for fishing with Danish seine and purse seine. 6-7 crew were onboard for the survey.
2.2 - Timeline
The survey was conducted between 02.08.-24.08.2026, split into two legs. The first leg (02.08.-13.08.) focused on the Vestavind F area, the second (13.08.-24.08.) on the Sørvest F area. The start and end harbour was Bergen, with a port call in Haugesund for crew change between leg 1 and 2.
The timeline was as follows:
02.08.2026 – mobilisation in Bergen, transit to Vestavind F.
03.-05.08.2026 – retrieval and redeployment of rigs from Vestavind F impact and transit area and fishing
06.08.2026 – day spent in harbour at Skudeneshavn due to wind
07.-09.08.2026 – retrieval and redeployment of rigs from Vestavind F control area and fishing
10.08.2026 - day spent in harbour at Skudeneshavn due to wind
11.-12.08.2026 – fishing and tagging at Vestavind F
13.08.2026 –changeover day at Haugesund, then transit to Sørvest F
14.-16.08.2026 – retrieval and redeployment of rigs in Sørvest F impact and transect areas and fishing and tagging
17.-18.08.2026 – retrieval and redeployment of rigs and fishing in Sørvest F control area
19.-21.08.2026 – fishing and tagging in Sørvest F impact and transect areas
22.08.2026 - day spent at harbour at Skudeneshavn because of bad weather
23.-24.08.2026 - attempt to retrieve last rig from Vestavind F, fishing in the Vestavind F transect area
24.08.2026 – transit back to Bergen, demobilisation
2.3 - Weather conditions
There were mixed weather conditions during the survey. During the first leg, most days were around 2-3 on the Beaufort wind scale. The weather on 3rd of August was particularly calm (Beaufort 1), providing good conditions for retrieving rigs. There were two days of bad weather which required the boat to spend the day in port, on the 6th and the 10th of September. The decision to stay in port was made because we did not want to risk releasing the rigs and then not detecting them at the surface, or being able to pick them up, in relatively rough seas.
In the second leg, the weather was good between 13th-20th August, with wind speeds ranging from 4 - 8 m/s, wave height 1-2 m. On the 21st, the weather conditions began to worsen, and on the 22nd were forecast to be too poor for working (too much wind), so we left the study area and began travelling north, spending most of the 22nd in port. There is a long transit from Sørvest F to Bergen, so we expected to have to leave Sørvest F at the latest on the evening of the 23rd to reach Bergen by 25th (the last planned day of the survey). On the 23rd-24th the weather conditions were good in the Vestavind F area, so we spent some time working there before travelling back up to Bergen.
2.4 - Participants
-
Table 1: survey participants Participants Affiliation Role Survey leg Esben Moland Olsen IMR Cruise leader 1 Claudia Junge IMR Researcher 1 Frederike Boehm IMR Technician 1 Kaja Andersen IMR Technician 1 6 Hovden Viking Crew 1 Kate McQueen IMR Cruise leader 2 Lise Doksæter Sivle IMR Researcher 2 Sussie Dalvin IMR Researcher 2 7 Hovden Viking Crew 2
3 - Rig retrieval and deployment
3.1 - Updates to array design
During this survey the rigs from the Vestavind F control and impact arrays were redeployed in new positions, due to a change in the array design. This change involved shifting the impact array south, as it became known that the middle and bottom subareas within Vestavind F were most likely to be developed first, though it is not currently known which of these will be used first. The array design was therefore rotated ca. 90° so that there are rigs deployed in both of these areas. By shifting the array south, the rig in the lower right position of the gradient from the impact area would be overlapping with an area used for fishing. Therefore, it was decided to remove this rig from the array design, to avoid it getting lost or interfering with fishing activity. During the survey, an alternative position for this rig was found, and it was deployed in an area between the array and the coast, where fish suitable for tagging were caught (Figure 1).
The layout of the control area was also rotated so that the layout was similar to the impact array. The location was shifted to the east so that it did not overlap with an area planned for offshore aquaculture (Figure 1).
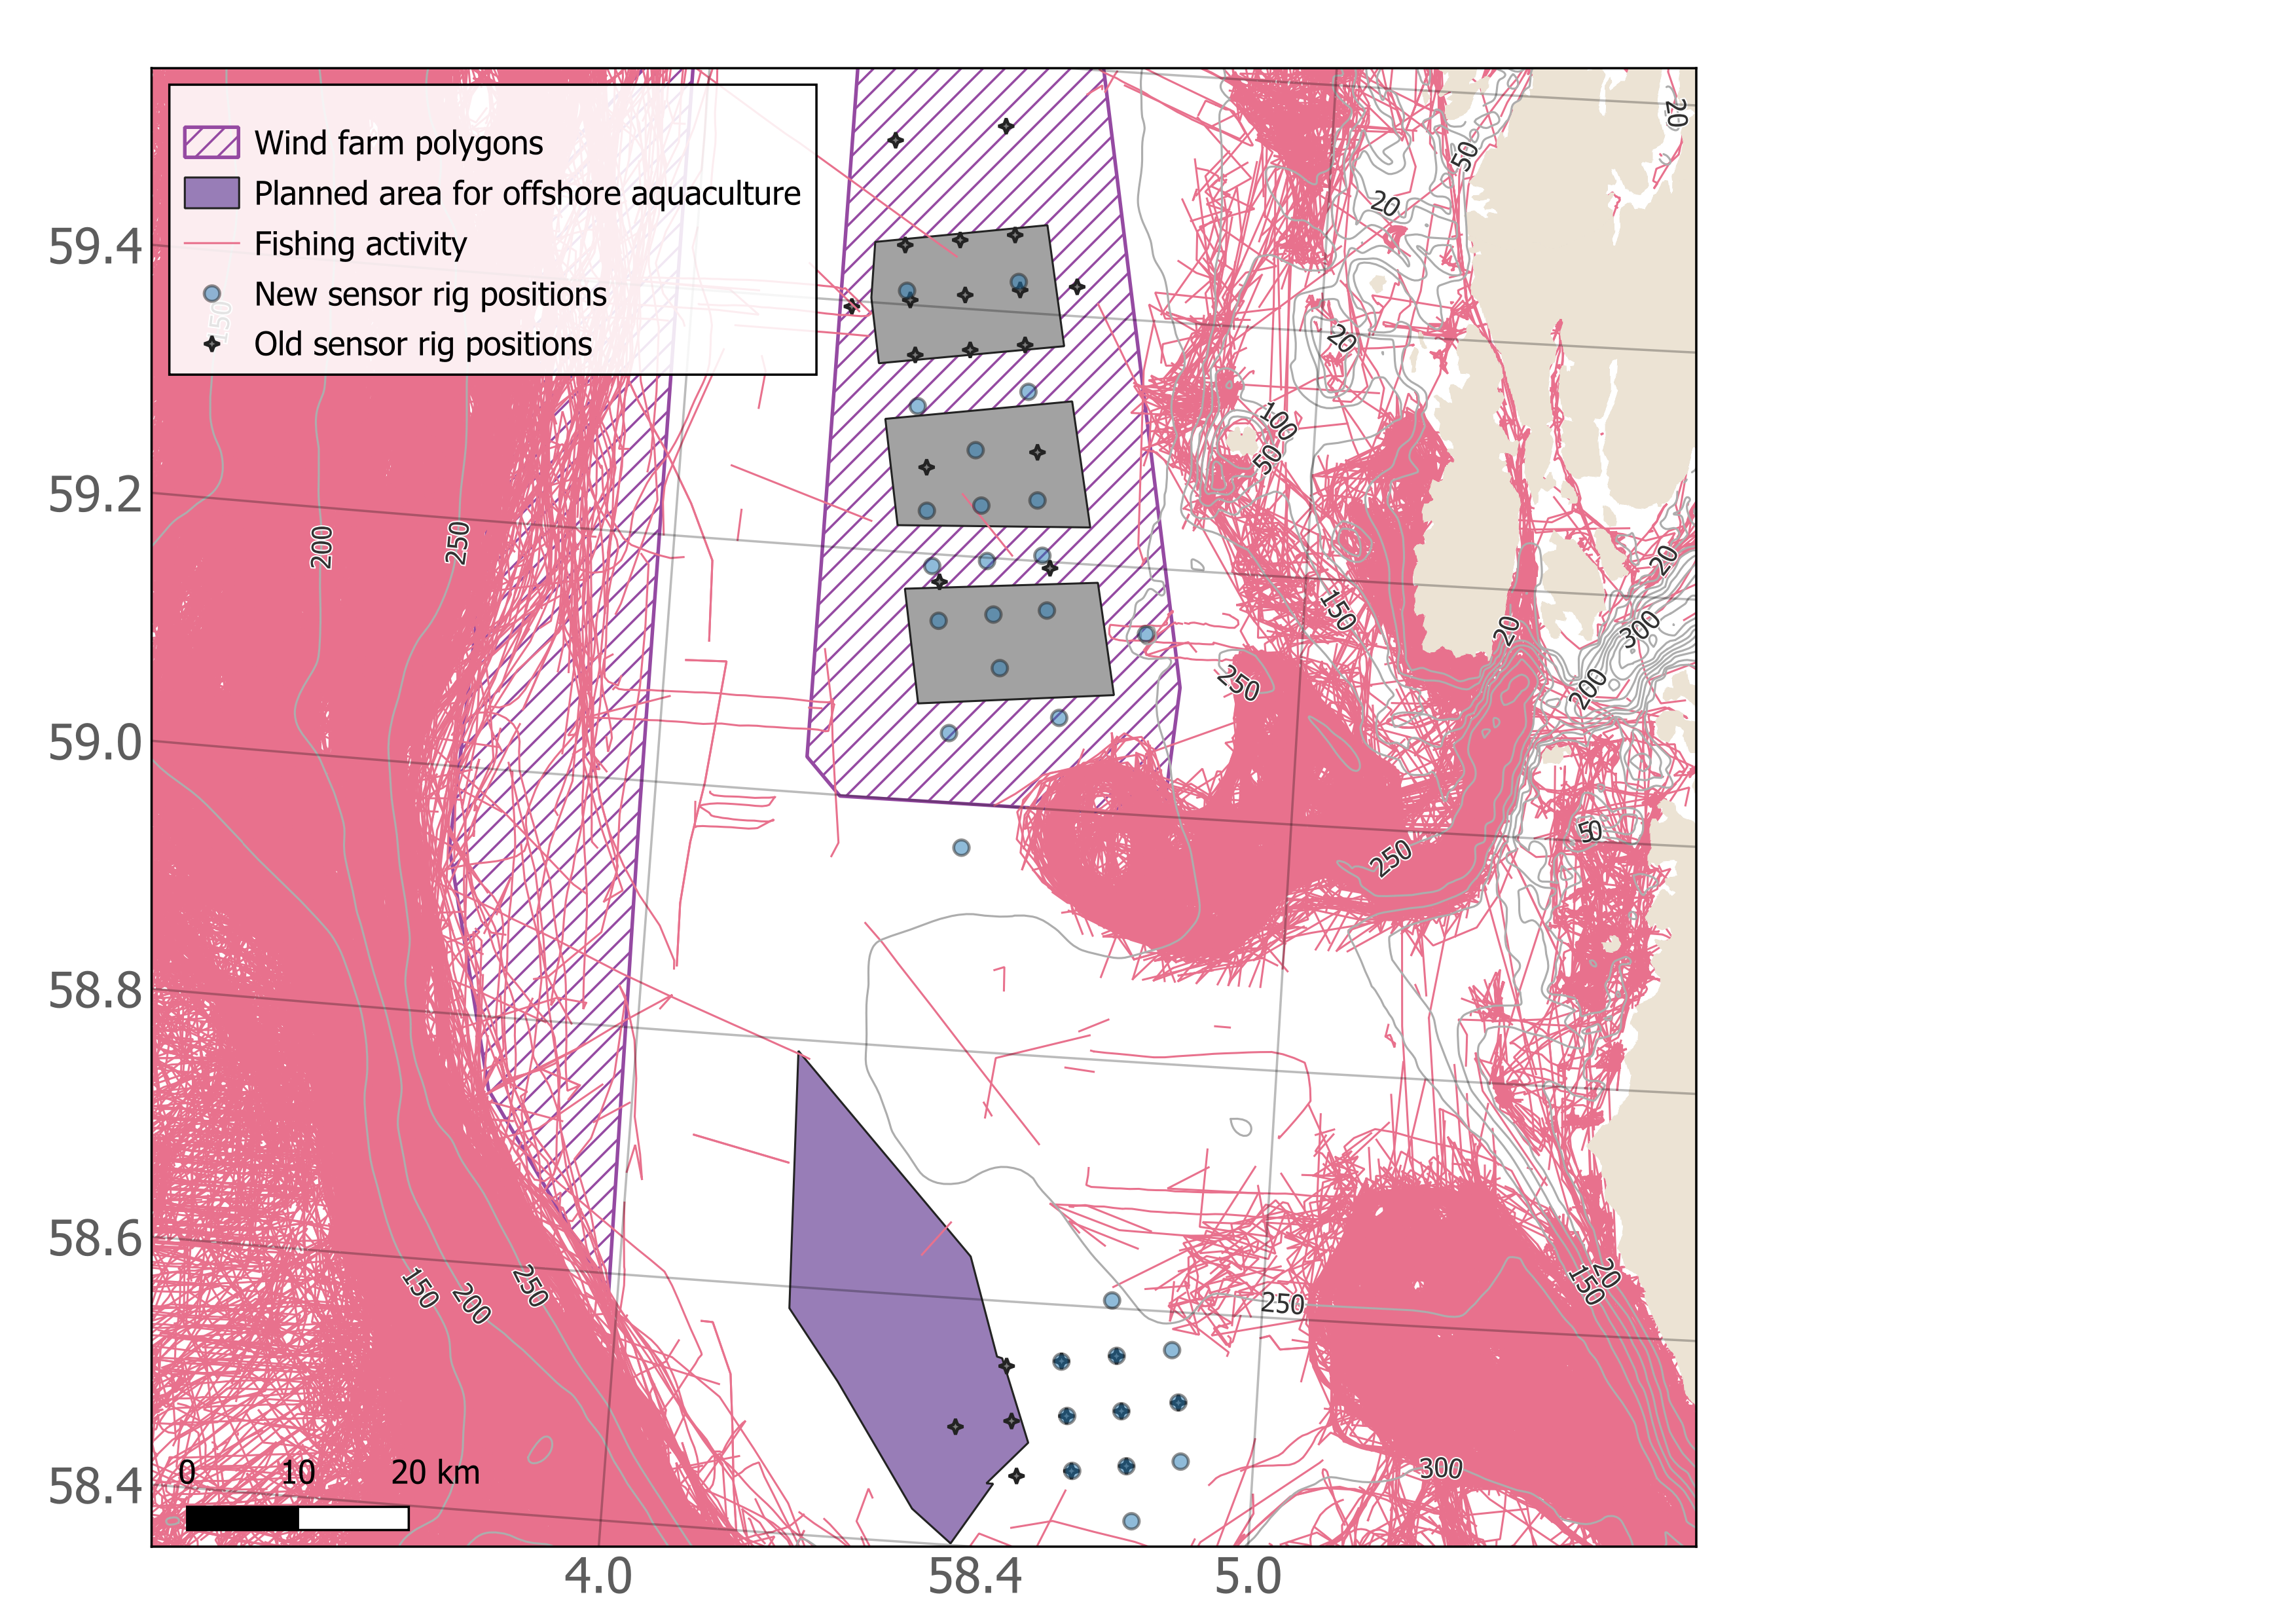
The rigs from the Sørvest F impact and control arrays were redeployed in the same positions as in 2025.
3.2 - Rig retrieval and redeployment method
To retrieve the rigs, the vessel first got in position where the rig had been deployed the previous year. A cabled hydrophone connected to a deck-box (Thelma Biotel) was lowered into the water. Connection was established with the receiver by sending a message (an acoustic signal) to the receiver serial number deployed at that station. Once the receiver replied with information about its distance from the transponding hydrophone, the release command was sent. After a few minutes, the buoys of the rigs arrived at the surface, and were spotted from the deck or the bridge. The vessel approached the buoys, and the rig was retrieved from the surface by the crew using a grappling hook or a boat hook. The yellow foam-filled buoy holding the receiver was relatively easy to spot at the surface, while the rope holding the hydrophone was used to hook the rig and bring it onboard. Once on board, the hydrophone and telemetry receivers were removed from the rig and cleaned using fresh water and brushes. Light biofouling was present, such as small shells, but was generally easy to remove.
The telemetry receivers and hydrophones were then taken inside for changing the batteries and retrieving the data. For the telemetry receivers, all data were downloaded, and the receiver was configured (all data erased) before redeployment. The configuration settings are shown in Figure 2. A new battery and a new release lug were installed. O-rings were checked and greased if needed. More details about the hydrophone processing are provided in a separate section below.

When ready, the sensors were reinstalled on the rigs, and new moorings were attached (50 kg anchor chain links). The mooring weight of the rig connected to the lug of the receiver by ca. 1-2 m rope. The telemetry receiver was installed in a yellow buoy (can be seen in Figure 3 &4). The hydrophone of the receiver points upwards. The receiver housing is attached by rope to a deepwater rated trawl buoy that floats approximately 2-3 m above the receiver. The hydrophone is attached to this rope using cable ties (more details below). Not all rigs have a hydrophone, a small subset only include a telemetry receiver (Table S1). The set up was similar as used for deployment in 2025.
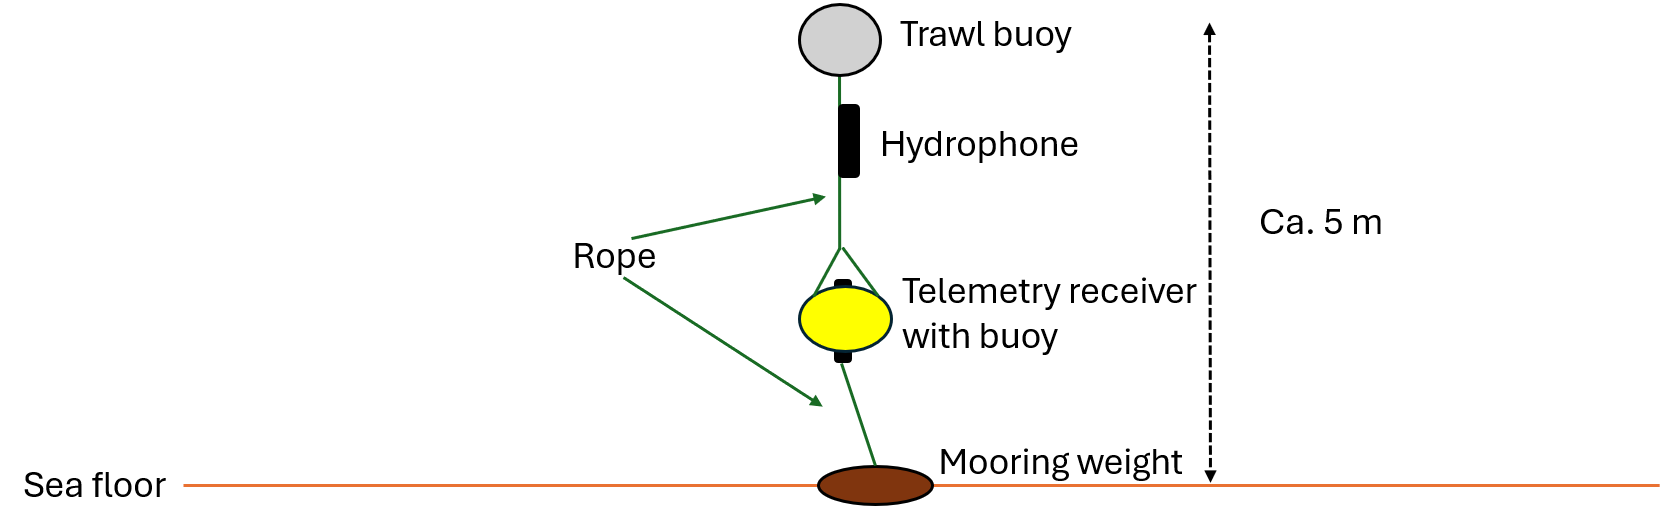
Deployment of each rig was done using the boat’s crane with a hook that could be released from deck by pulling a rope. To deploy the rigs in the correct position, the rig was lowered into the sea, taking care that the weight of the mooring was supported by the crane rather than the telemetry receiver. The boat then slowly travelled to the position, and the rig was released as the boat passed the planned deployment position.
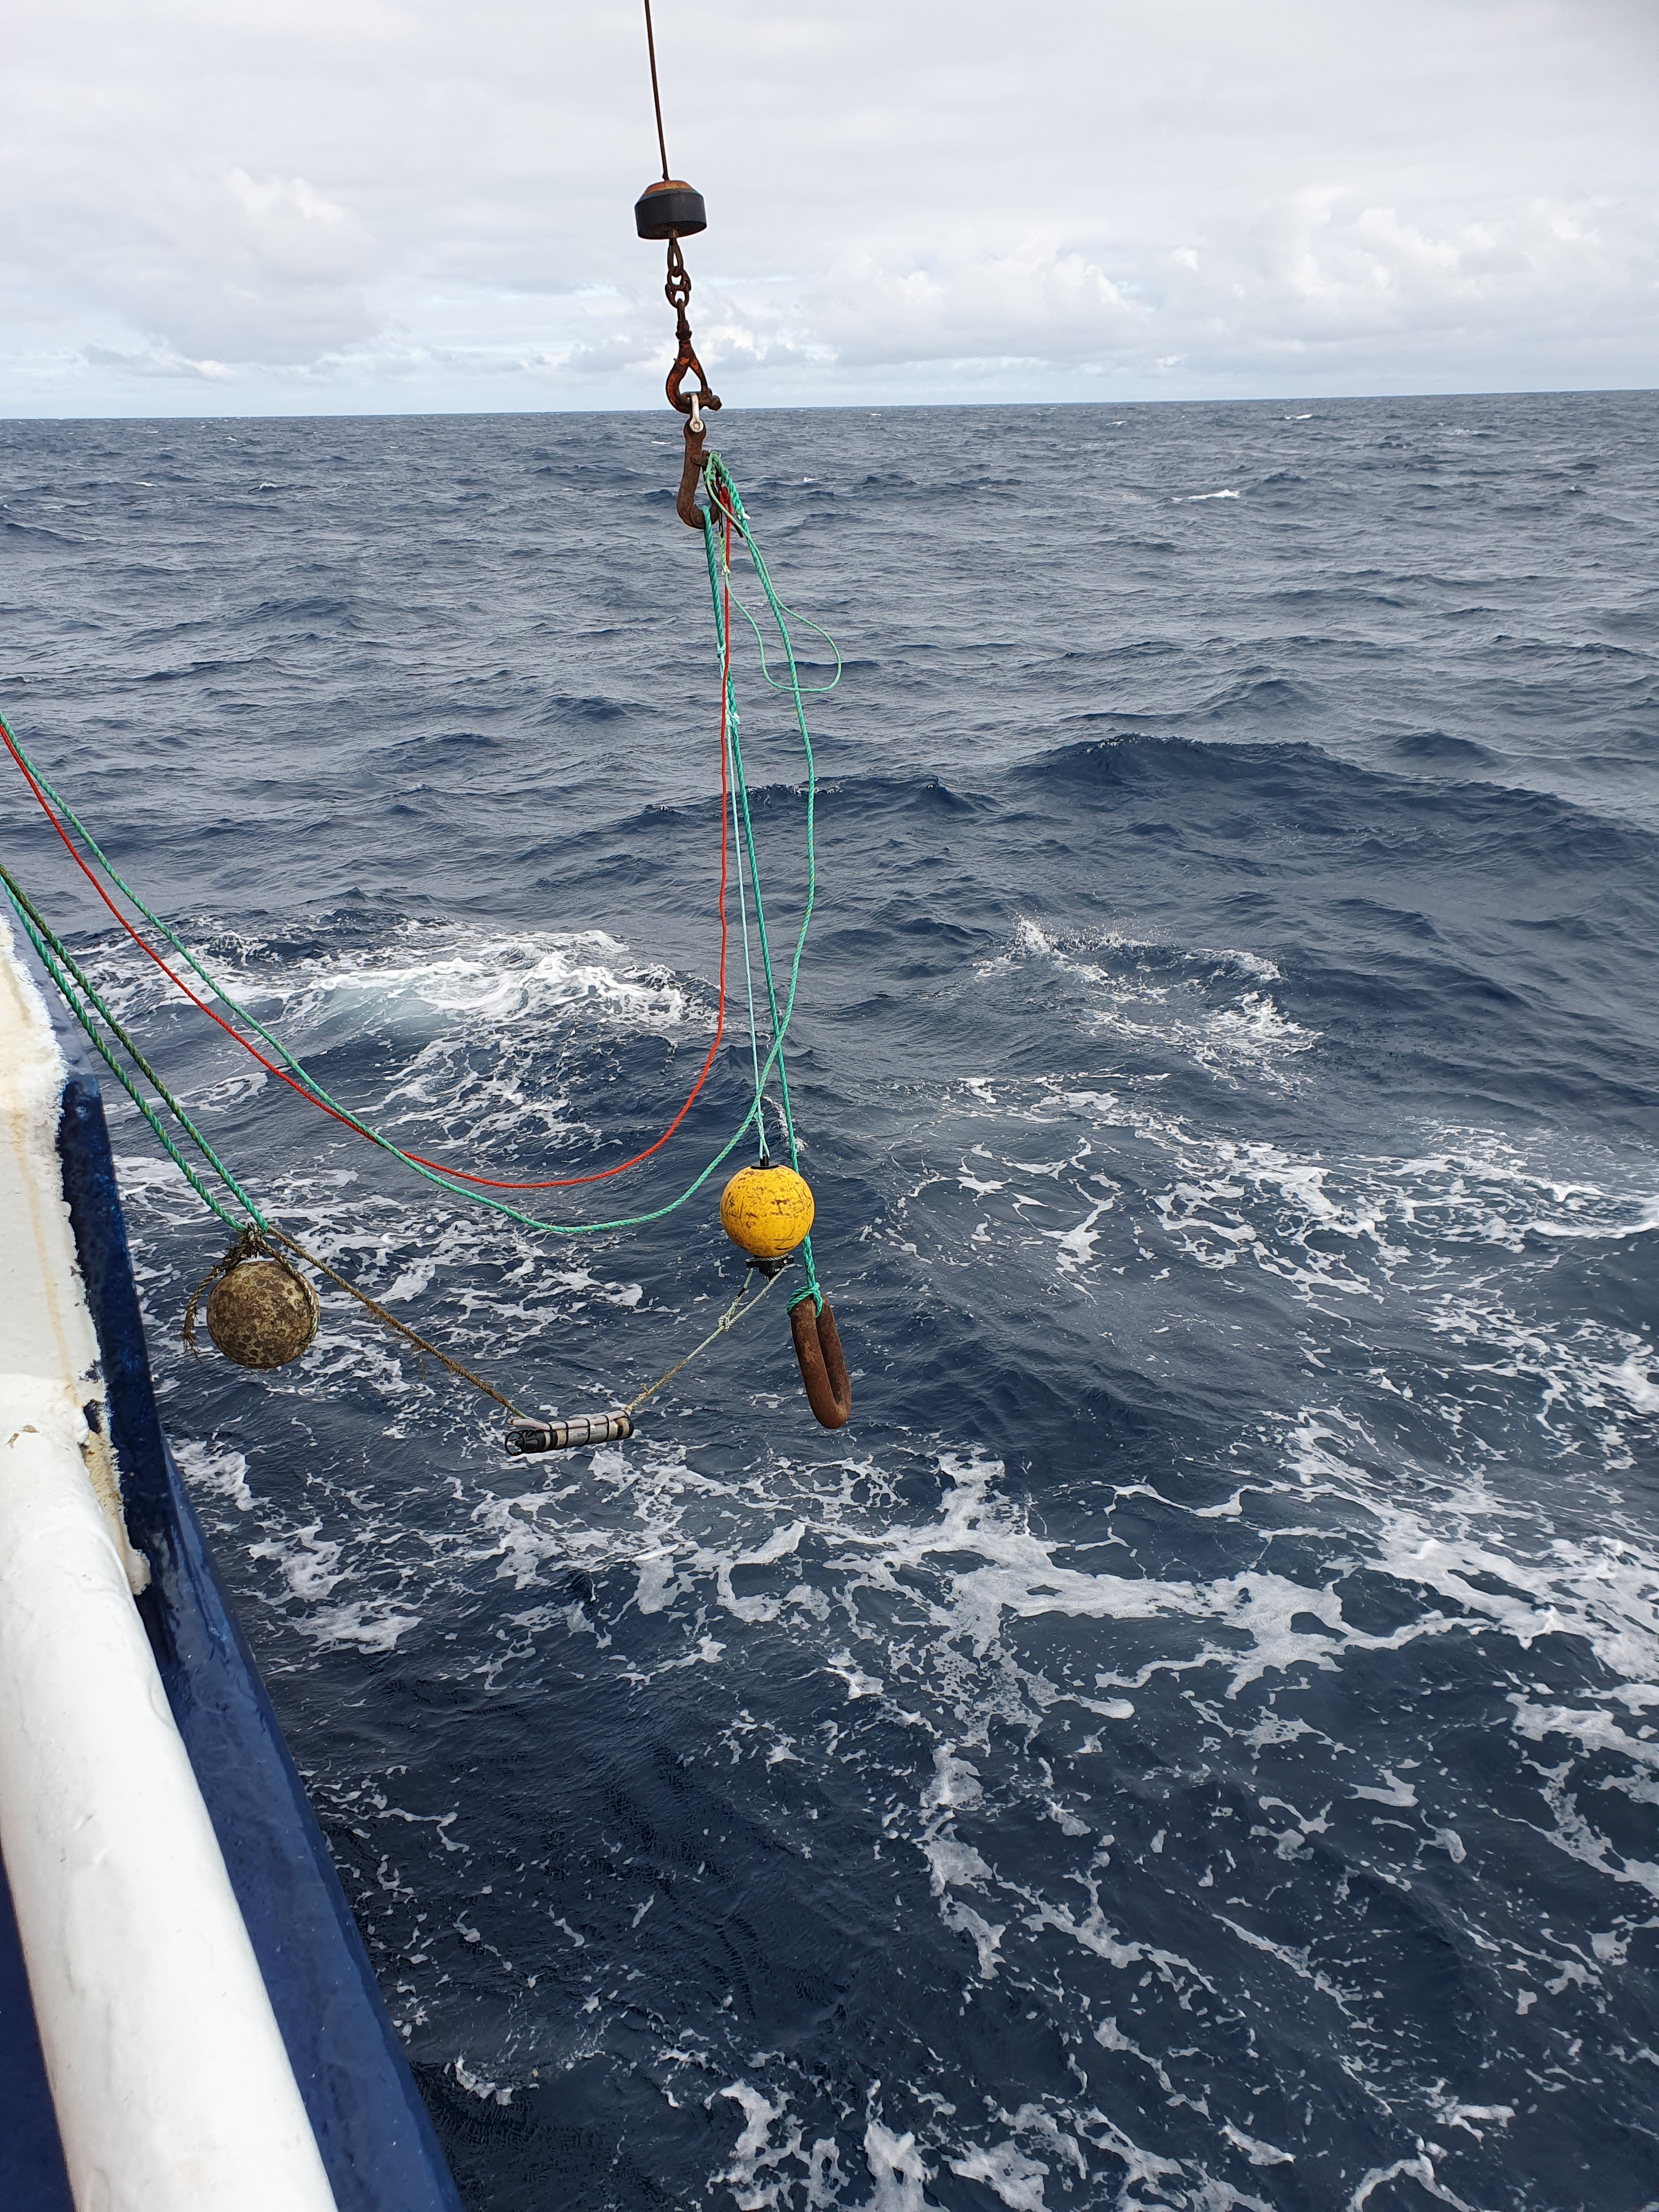
In Sørvest F, the entire process of retrieving the buoy, downloading data, changing batteries, reassembling the rig and setting it out again took ca. 1 h. In Vestavind F, the process took longer, because the deep depth of the receivers meant it was more difficult to establish connection with the receivers, and they took longer to arrive at the surface after release. In some cases it was not possible to establish a consistent enough connection to receive information about receiver distance, but the release command generally still worked.
3.2.1 - Hydrophone retrieval
Hydrophones were lifted on board by the ship’s crew along with the telemetry buoys. As instructed by the producer, additional safety precautions were taken for the Sound Trap from >200m depth which did not have pressure release valves (PRVs) installed. Metal clamps were quickly disassembled and cable ties removed, after which the Sound Trap was placed in a tub with fresh water. Biofouling varied, from very light to moderate (<1cm opaque shells, calcareous external housings potentially from small tube worms/polychaeta, bryozoa and layers of mud). They were first rinsed by running water and then placed in a tub with fresh water, where the biofouling was removed using a stiff brush on the housing and a toothbrush in the sensor area and around the base plug. Sound Traps were dried off with a towel before opening (slowly unscrewing the lock screw at the top, sensor end pointing down; if a unit was suspected to be pressurised the plug at the bottom of the unit was carefully opened first, to release any pressure).
Sound traps were then connected to the software “Sound Trap Host”, to first check the remaining battery status and microchip (SD card) usage. Then, all cards containing data were removed and placed in separate, labelled envelopes. All batteries were replaced with fully charged ones (insulation tape around the top two sets, elastic band around the lowest). At the start only new batteries were used and some of the used batteries from 2025 were recharged over the course of the survey, so they could be reused for the later redeployments. Empty microchips remained in the hydrophone. If 3 cards had been removed, one new was inserted, leaving all hydrophones with 2 empty cards. Via the Sound Trap Host software, the hydrophone was redeployed after confirming the configurations (screenshots were taken for documentation, correct settings shown in Figure 5).
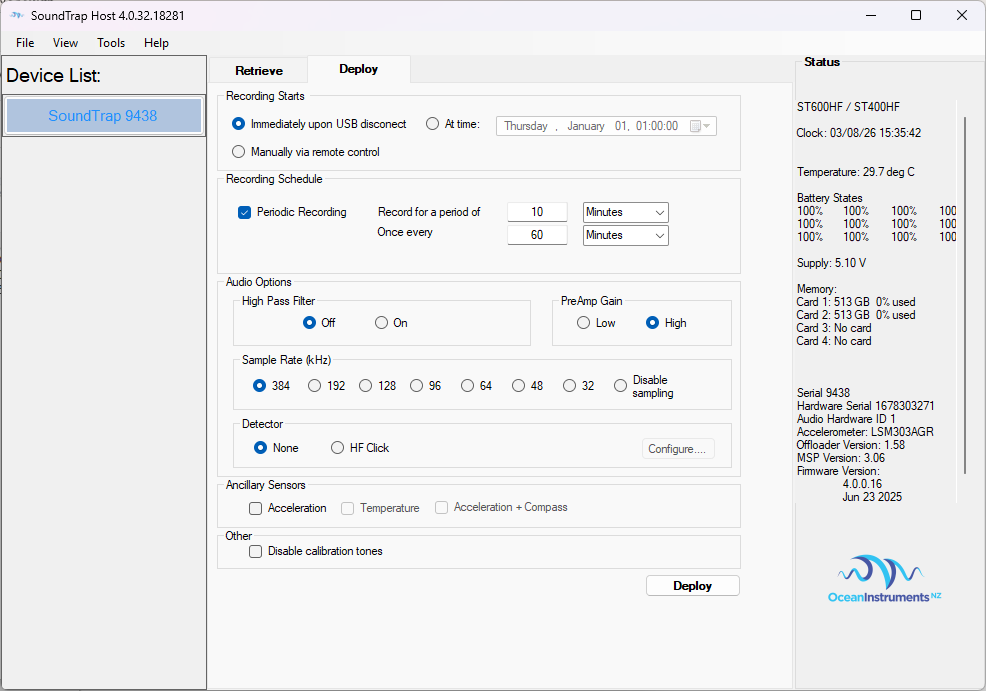
O-rings were assessed and if they were free of nicks or signs of wear, new silicon grease was applied and the housing re-sealed using the lock screw mechanism. For the hydrophones to be deployed >200 m depth, PRV O-rings were also checked and greased before exchanging the base plugs for PRVs.
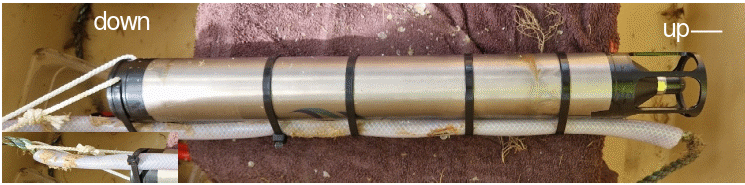
Due to signs of corrosion on hydrophone housings after the 2025 deployment, metal clamps were not reused in 2026. Instead, the hydrophones were mounted using five strong cable ties and one safety line ( Figure 6 )
3.3 - Rig retrieval and redeployment results
All retrieval and deployment positions, dates and times are provided in Table S1 in the Appendix.
All but one of the rigs were successfully retrieved and redeployed. One receiver in Vestavind F could not be retrieved. It was possible to establish communication with the receiver, and the receiver sent a message that it was released and pointing upwards (tilt angle close to zero), but did not come to the surface and reported that it was still at the same depth. It also gave an error warning that the battery voltage was low. The manufacturer advised that the release battery would recharge from the main battery, so retrieval was attempted again after a few days, and once more towards the end of the cruise, more than a week later. However, it was still unsuccessful. We assume the rig is either stuck on something, or the release mechanism is stuck. Retrieval should be attempted with an ROV, if possible.
Establishing communication with the receivers was generally faster in the shallow areas compared to the deep areas. In the deep area, two different types of receivers were used: (i) standard acoustic release receivers (TBR 800 release, ThelmaBiotel) and (ii) receivers with a deep release mechanism (TBR 800 Release Deep, ThelmaBiotel), with a stronger release function. The deep release receivers worked, non-surprisingly, better than the normal ones in the deep areas. Some normal receivers that were retrieved from the deep had difficulties connecting to a PC after retrieval, and often data could only be downloaded after hours of resting time on board (some overnight).
One of the hydrophones (ID 22, station 58) from Vestavind F was not redeployed, due to full SD cards, and no new ones available to be inserted at the time. As new SD cards were brought on board with leg 2, this hydrophone was deployed at one of the stations lacking a hydrophone in Sørvest F (station 18).
One telemetry receiver (4044, station 28) was not redeployed, as it would not close fully after battery replacement. A spare receiver (3891) was deployed at station 28 instead. Receiver 4044 was later fixed by installing a different release lug.
Rig retrieval was easiest in good weather. Waves with white caps can make it difficult to spot the buoy at the surface, and bad weather will also make it challenging to keep the vessel in position and to catch the buoy. Therefore, on days with good weather it was sometimes prioritised to retrieve as many rigs as possible, then re-deploy them on another day, as deployment is possible in worse conditions. We opted for this approach during one of the days of the Sørvest F leg, for example, and managed to retrieve 12 rigs on the same day. Another approach that we used at the Sørvest F control array was to wait at each position while preparing the rig and redeploy before moving to the next position. This approach was also effective, and allowed for fishing with handline by the boat’s crew while the rigs were being prepared for redeployment. Both approaches can be considered for future surveys, and the best option will depend on the number of good weather days.
4 - Fishing
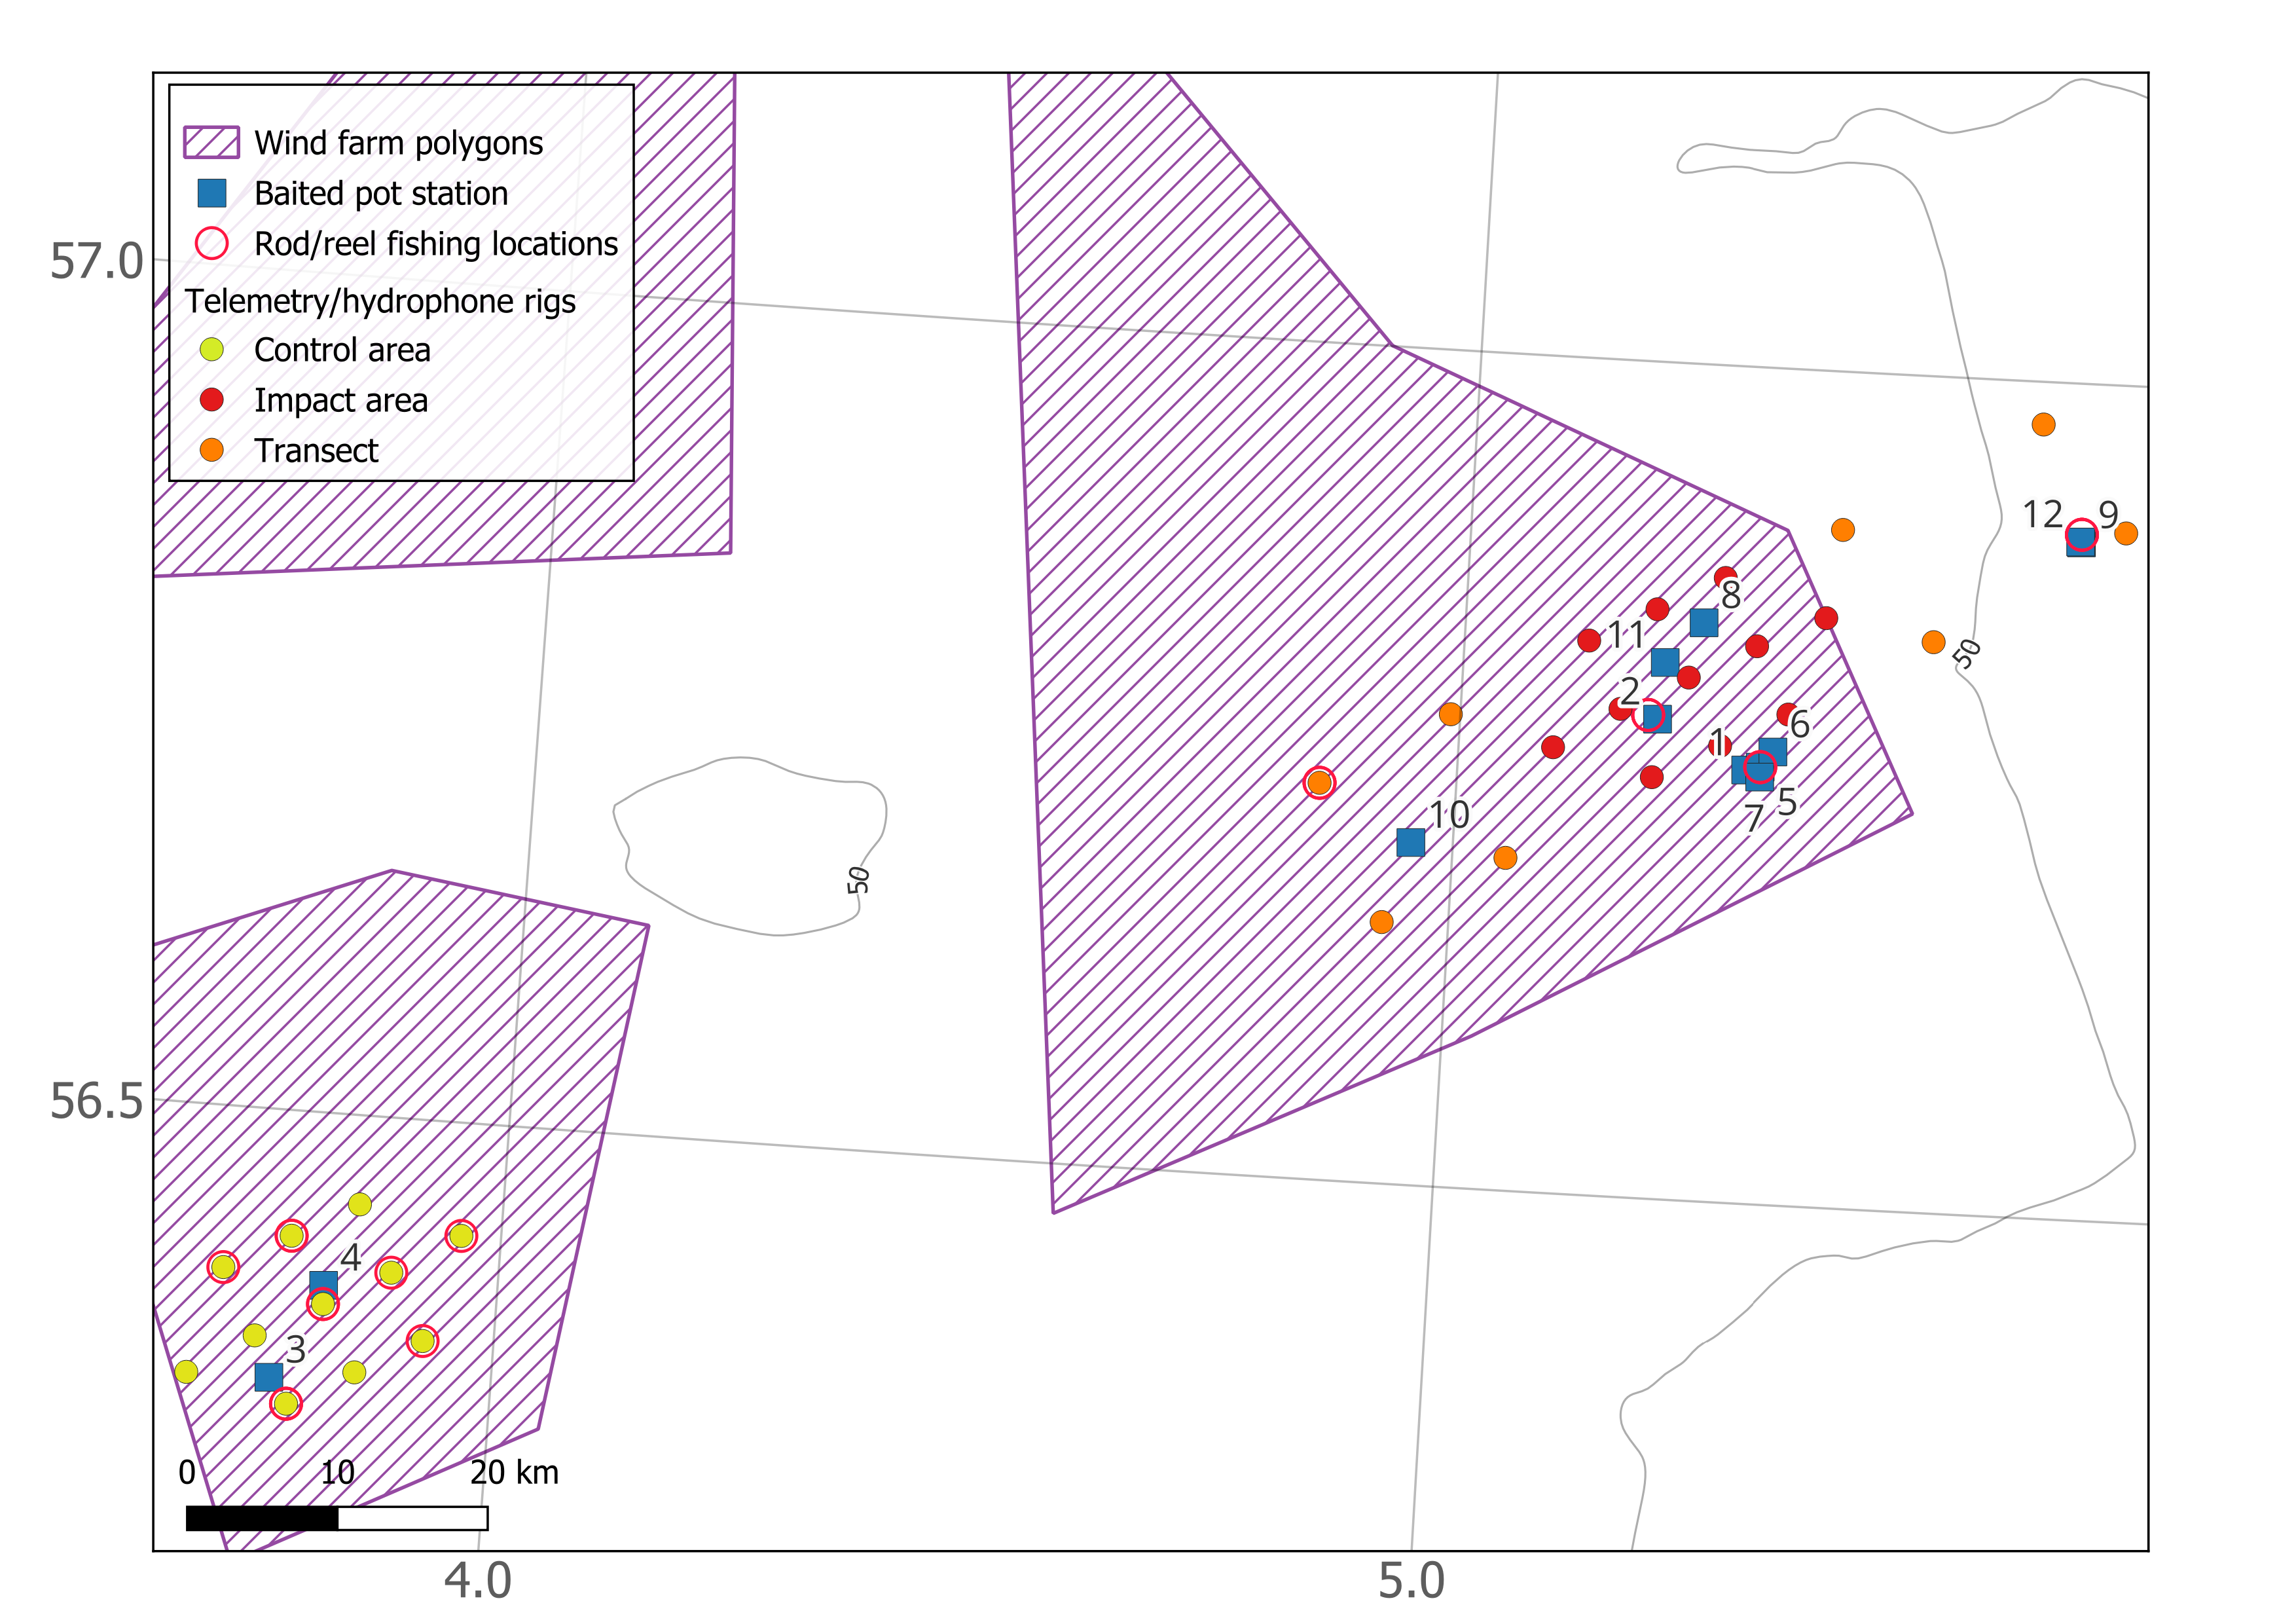
Fishing during the survey was mainly done with two-chamber baited pots. These were set in fleets of 10 to 21 pots set along the same rope. The pots were usually set in the afternoon or evening and hauled the next day, with soaking times ranging from ca. 12 to 24 h in Sørvest F, and ca. 12 to 45 h in Vestavind F (see Tables S2 and S3 in appendix). Fishing locations are shown in figures 7 and 8. Predatory behaviour was occasionally observed within the pots, with one ling (Molva molva) caught with a newly ingested whiting (Merlangius merlangus ) , and one small cod (Gadus morhua) with bite marks possible due to the presence of a 4 times larger cod in the same pot. In the deepwater stations at Vestavind F, depredation by isopods was observed. Additional fishing was done using rod/reel and line.
Immediately after capture, live fish were transferred to a tank filled with seawater. Generally, the catch for each pot was processed before the next pot in the fleet was brought on board. The catches were usually small, with only a few fish per pot. Fish that could not be used for tagging, due to size, condition at capture or species, were measured and recorded. If they were alive and in good condition, they were then released. Fish suitable for tagging were processed following the methods described in section 5.
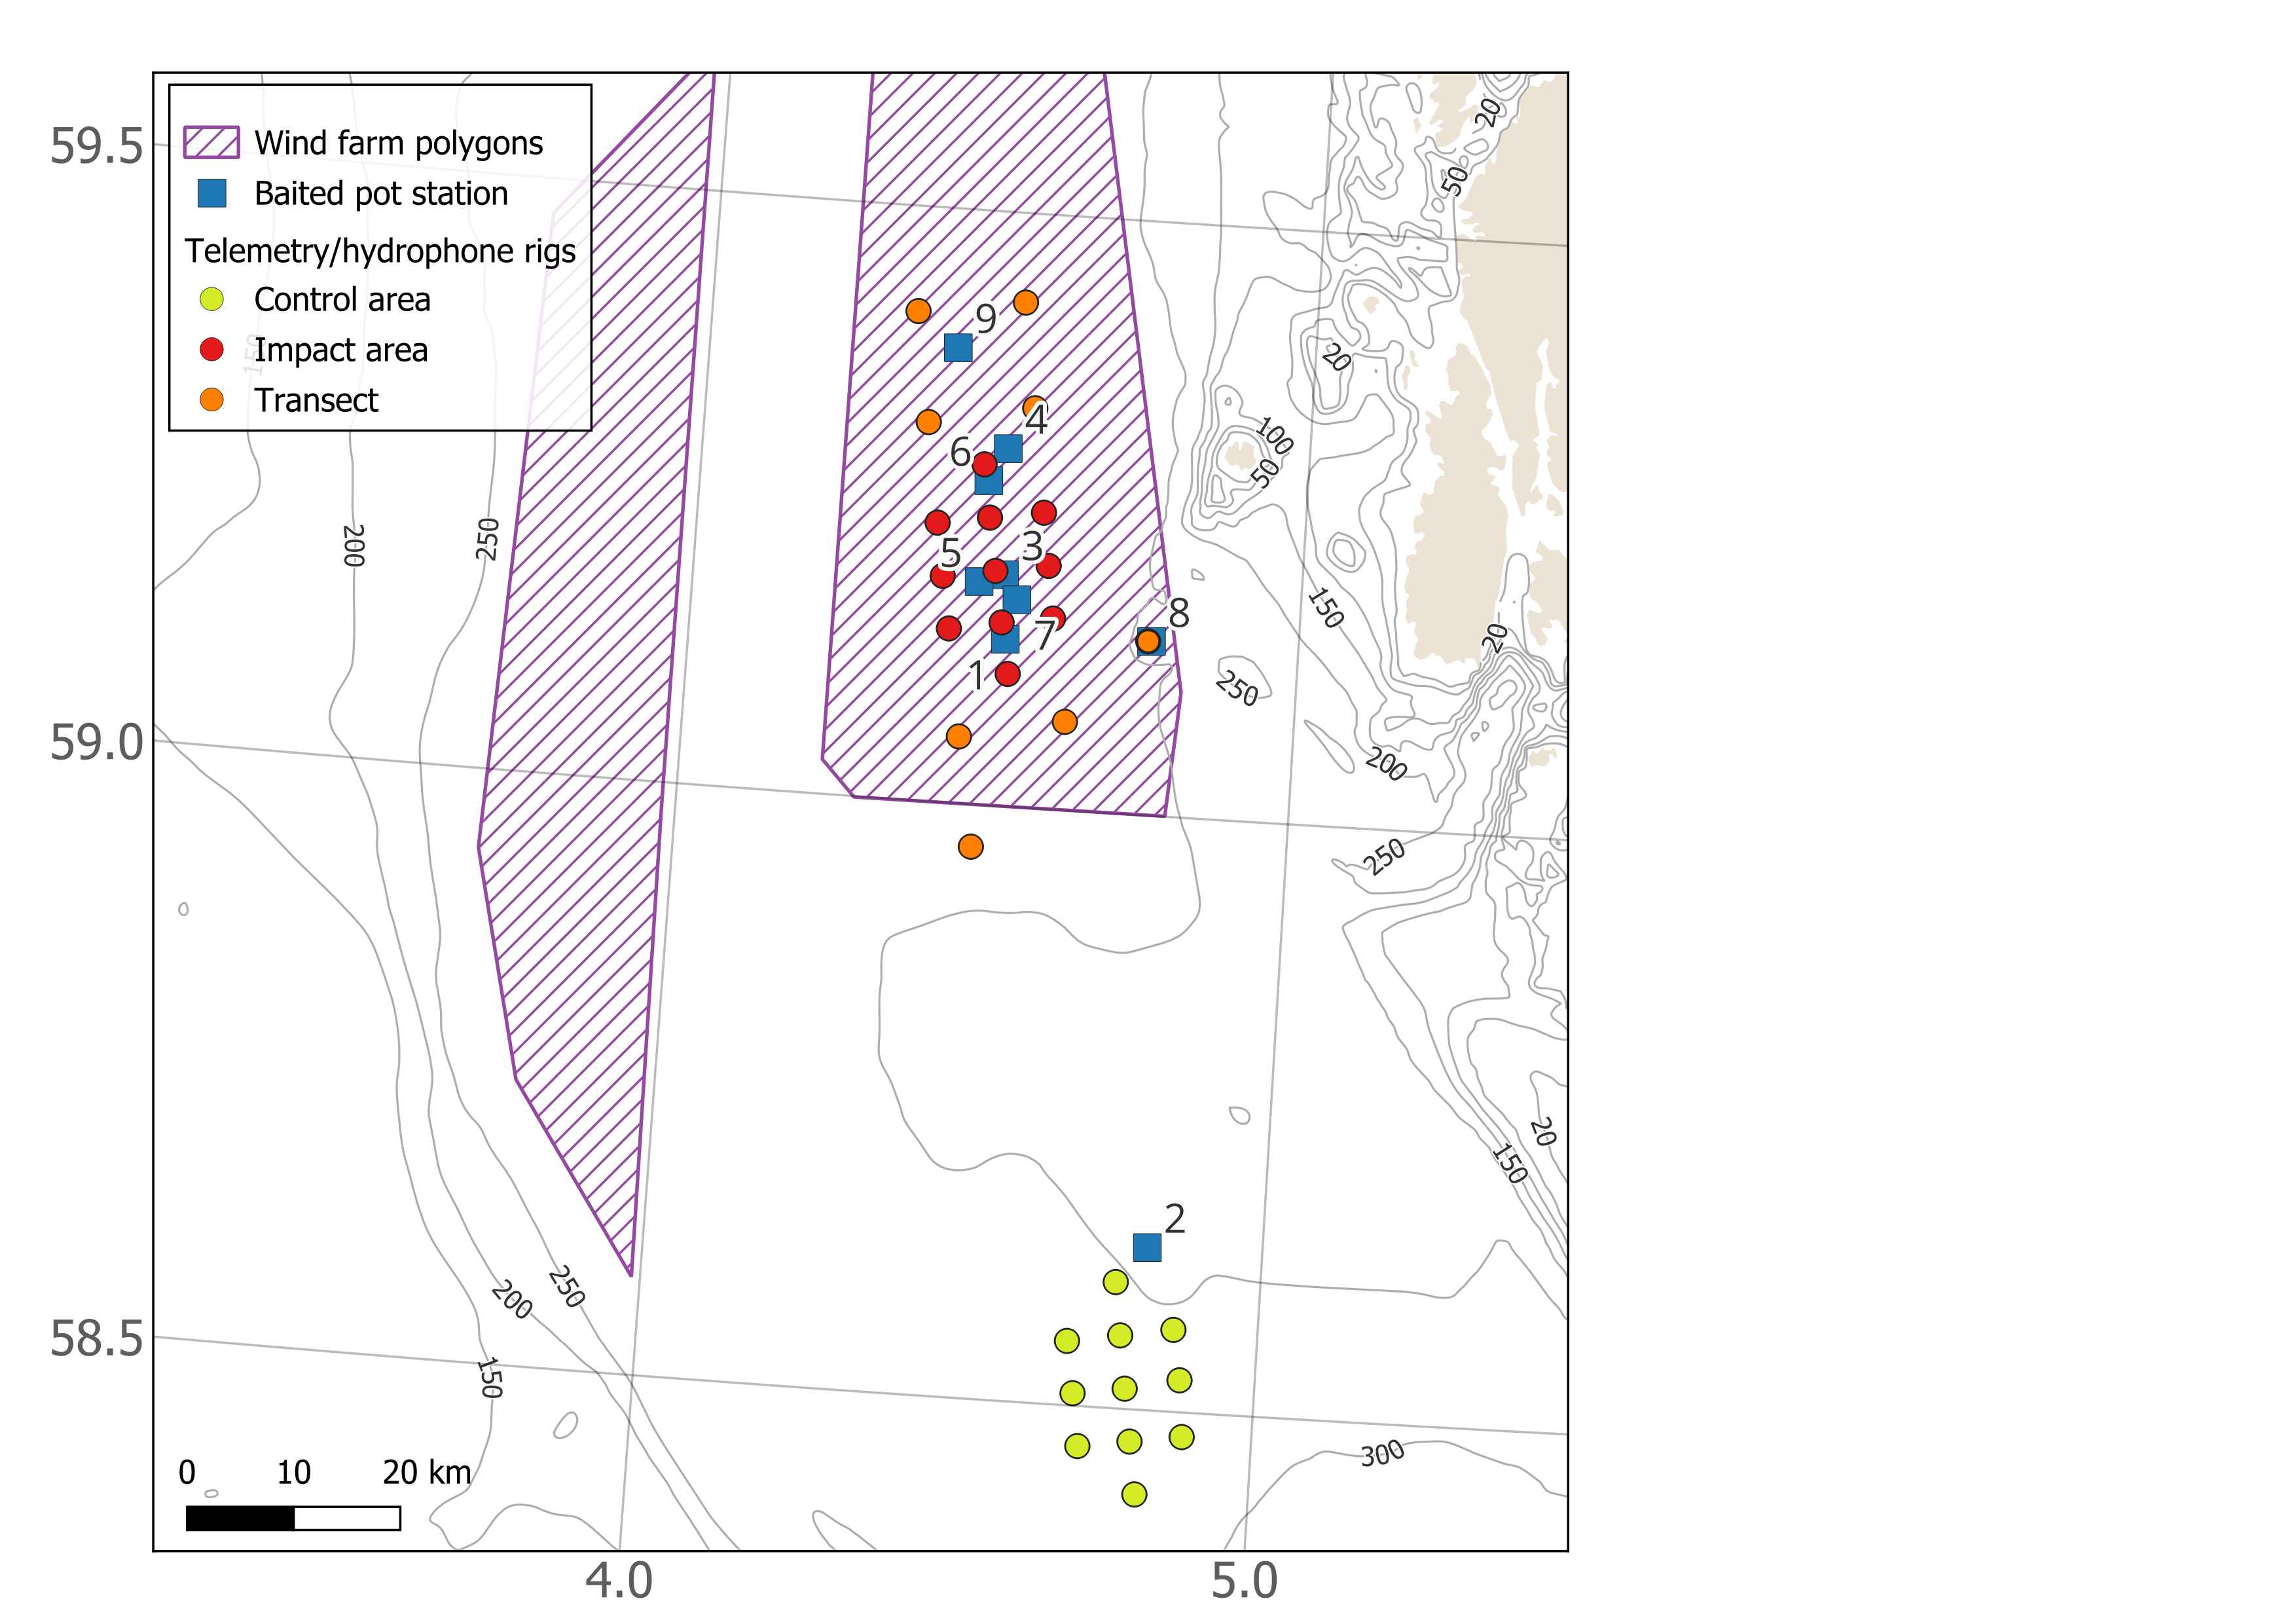
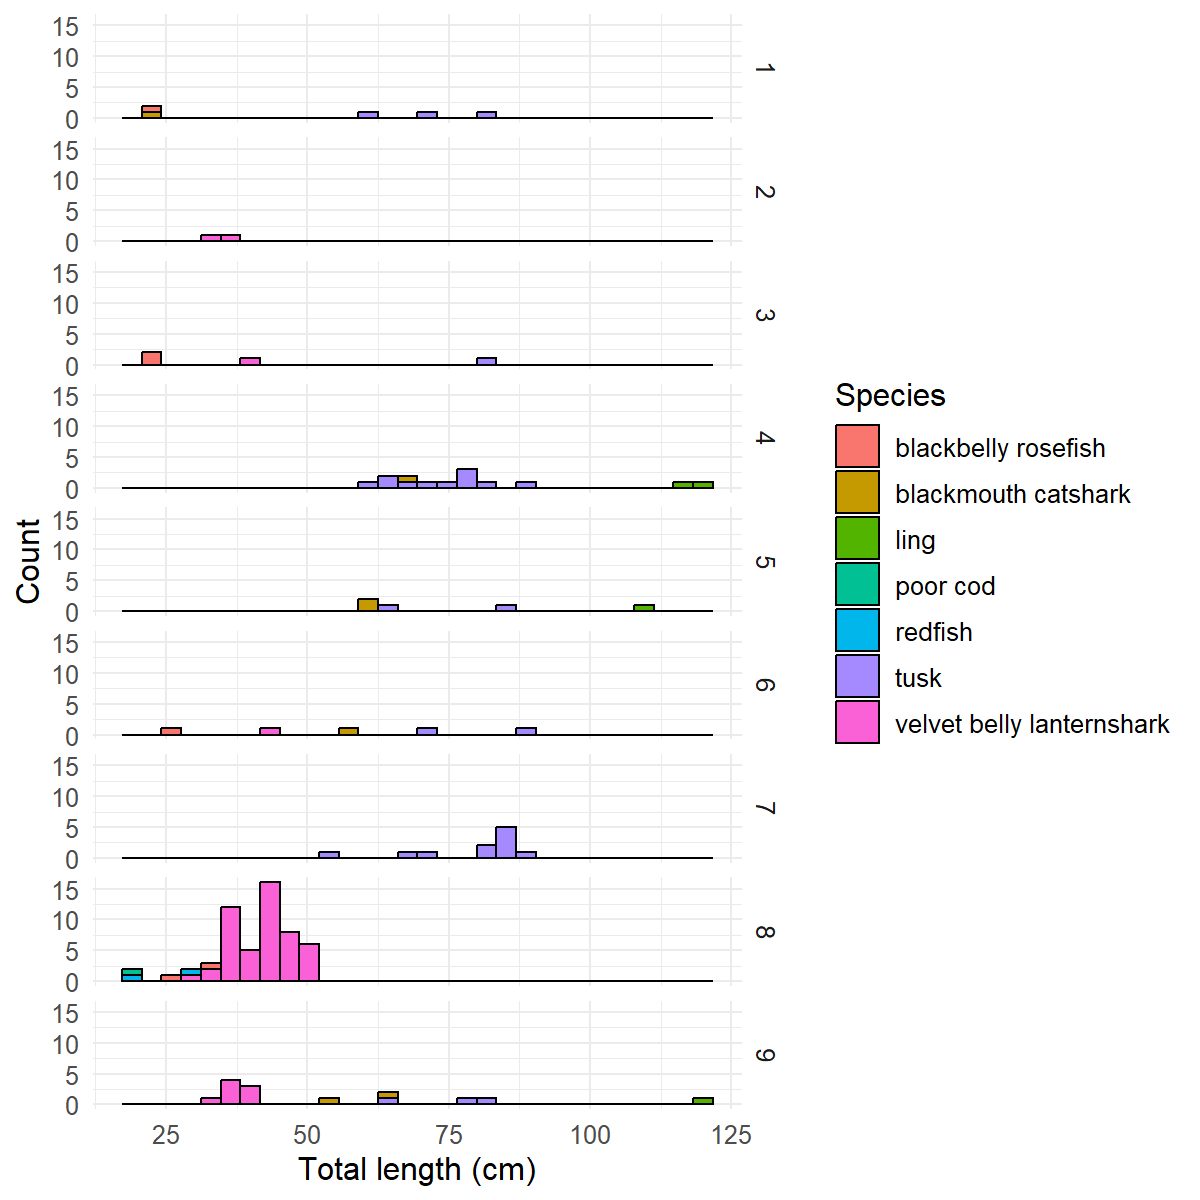
In Vestavind F, the fish species caught in the baited pots were blackbelly rosefish (blåkjeft) (Helicolenus dactylopterus), blackmouth catshark (hågjel) ( Galeus melastomus ), ling (lange) (Molva molva), tusk (brosme) (Brosme brosme), golden redfish (vanlig uer) (Sebastes norvegicus), poor cod (sypike) (Trisopterus minutus) and velvet-belly lanternshark (svarthå) ( Etmopterus spinax ) (Figure 9) . Several types of invertebrates were also caught, including gastropods, sponges, cushion stars, sea urchins, Norway lobster, Norway king crab, squat lobster and sea cucumber. Fishing was done at nine stations during the survey. Fishing effort with baited pots was mainly within the impact array. Station 2 was in the control area. Station 8 was at the new rig position between the array and the coast. Station 9 was in the transect array north of the main impact array. All other stations (1, 3-7) were within the main impact array. Additionally, several saithe (sei) (Pollachius virens) were caught with rod and line, close to the island of Utsira (see Section 5), and one blue whiting (kolmule) (Micromesistius poutassou) was caught with rod and line in the northern transect area.
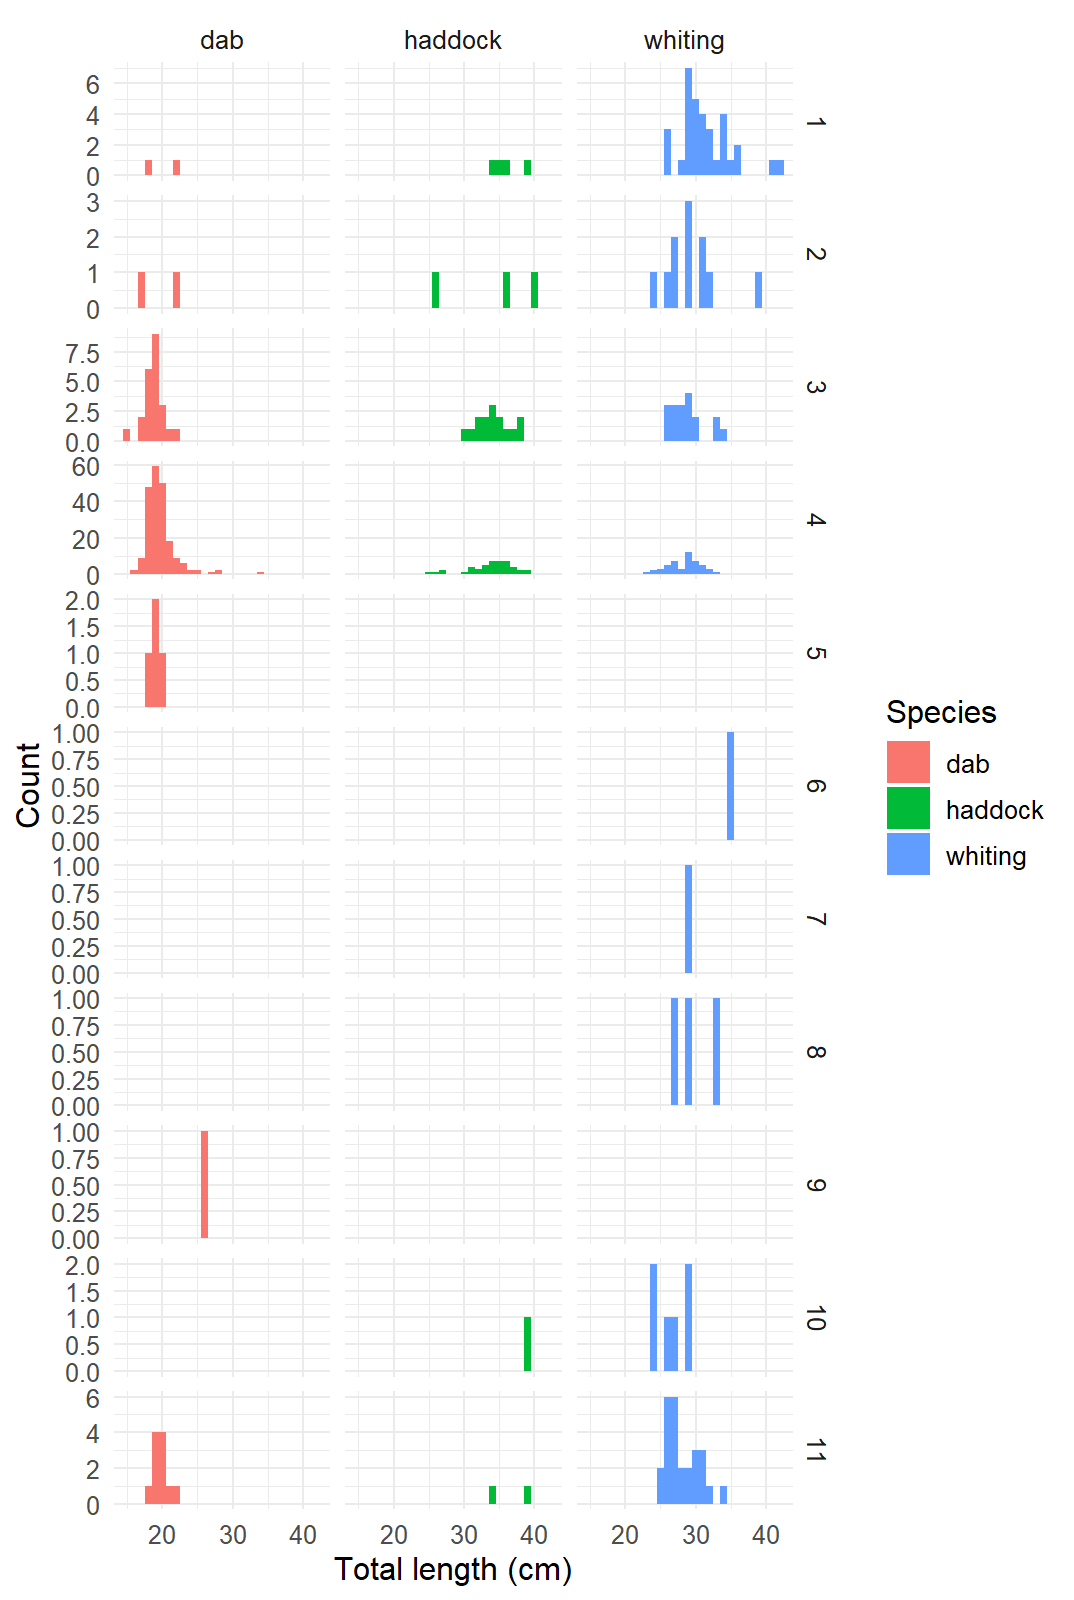
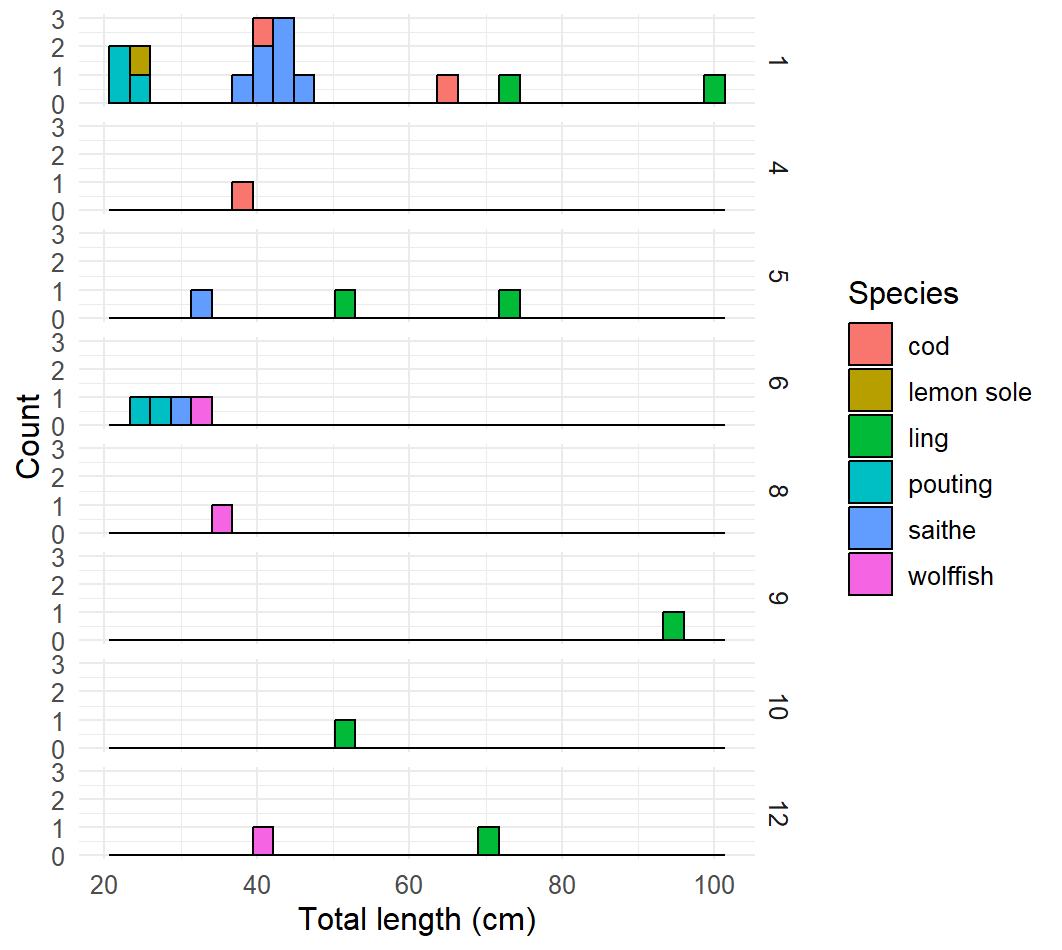
In Sørvest F, the most commonly caught species in the baited pots were dab (sandflyndre) (Limanda limanda), haddock (hyse) (Melanogrammus aeglefinus) and whiting (hvitting) (Merlangius merlangus) (Figure 10). None of the haddock were large enough to tag. Other fish species caught in the pots were cod (torsk) (Gadus morhua), lemon sole (lomre) (Microstomus kitt), ling (lange) (Molva molva), pouting (skjeggtorsk) (Trisopterus luscus), saithe (sei) (Pollachius virens) and wolfish (steinbit) ( Anarhichas lupus) (Figure 11). Invertebrates including edible crab (taskekrabbe) (Cancer pagurus), northern stone crab (trollkrabbe) (Lithodes maja) and gastropods were also caught. We distributed the fishing positions in an effort to catch larger individuals of species such as cod for tagging, as well to gain information about the species caught within the main arrays, with a total of 11 stations fished. Station 1, 5, 6 and 7 were near hard substrate to the south of the array, and were locations where cod suitable for tagging had been caught in previous cruises. These areas were not so successful this time, however. Station 2 was close to locations in the centre of the array that had been sampled using baited pots in the GO Sars survey in August 2025. Stations 3 and 4 were in the control area and were selected because they were close to underwater pipelines where fish might be expected to aggregate. Stations 8 and 11 were likewise selected because they were within the main grid, and close to pipelines. Stations 9, 10 and 12 were close to shipwrecks in the transect part of the array, where large fish could be expected to aggregate.
Fishing with rod/reel was attempted at several locations in the Sørvest F area (Figure 8). Fish caught with the fishing rod/reel included cod and saithe, many of which were tagged, as well as haddock, whiting, pollock (lyr) (Pollacius pollacius), ling and mackerel (makrell) (Scomber scombrus).
5 - Fish tagging
For this project, we have permission to tag a variety of different species that we expected to catch in these areas: cod, haddock, saithe, spiny dogfish, small-spotted catshark and thornback ray (FOTS ID 31476). This year we also got permission to tag additional species based on fishing experience in the study areas (FOTS ID 31476, granted on 17th August 2026), and can also tag monkfish (Lophius piscatorius), tusk (Brosme brosme), blackbelly rosefish ( Helicolenus dactylopterus ), rabbitfish (Chimaera monstrosa) and blackmouth catshark (Galeus melanostomus). The tags used during this survey have a diameter of 13 mm, include depth and temperature sensors, are programmed to transmit at a rate of between 210-270 s, and are expected to continue transmitting for >4 years. They transmit at 69 kHz and use open protocol (OPs).
Fish of these target species were tagged if they were in good condition after capture, and large enough for the tag burden. We aimed to tag fish where the tag would be a maximum of 2% of the fish’s body weight. For the tags used on this survey, this means the fish should be 715 g or larger.
Fish suitable for tagging were transferred one at a time from the holding tank (tank filled with ca 400 l seawater) to a basin containing a sedative (Aqui-S, 2-3mg/l). Once the fish was sedated, it was taken out of the basin for the tagging procedure. The fish was wrapped in a towel soaked in seawater during tagging. A small incision was made on the ventral side of the fish using a scalpel and the tag was inserted into the body cavity. The incision was closed with two absorbable sutures. A fin clip was taken for later genetic analysis. The fish was measured (total length, cm). When possible, the fish was also weighed, but this was not always practically possible as we worked out on deck and the wind and movement of the vessel sometimes made the scale unstable and unusable. The fish was then placed in a separate tank of similar size to the holding tank to recover from the procedure. When the fish had recovered and was swimming normally it was released. For release, the fish was placed in a net on a rope, which was used to lower the fish to the sea surface. If the fish did not recover from the tagging procedure then it was killed following the protocol in the animal experimentation plan.
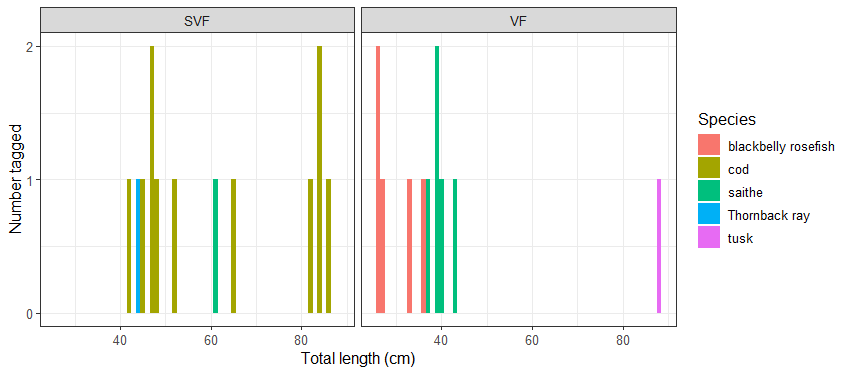
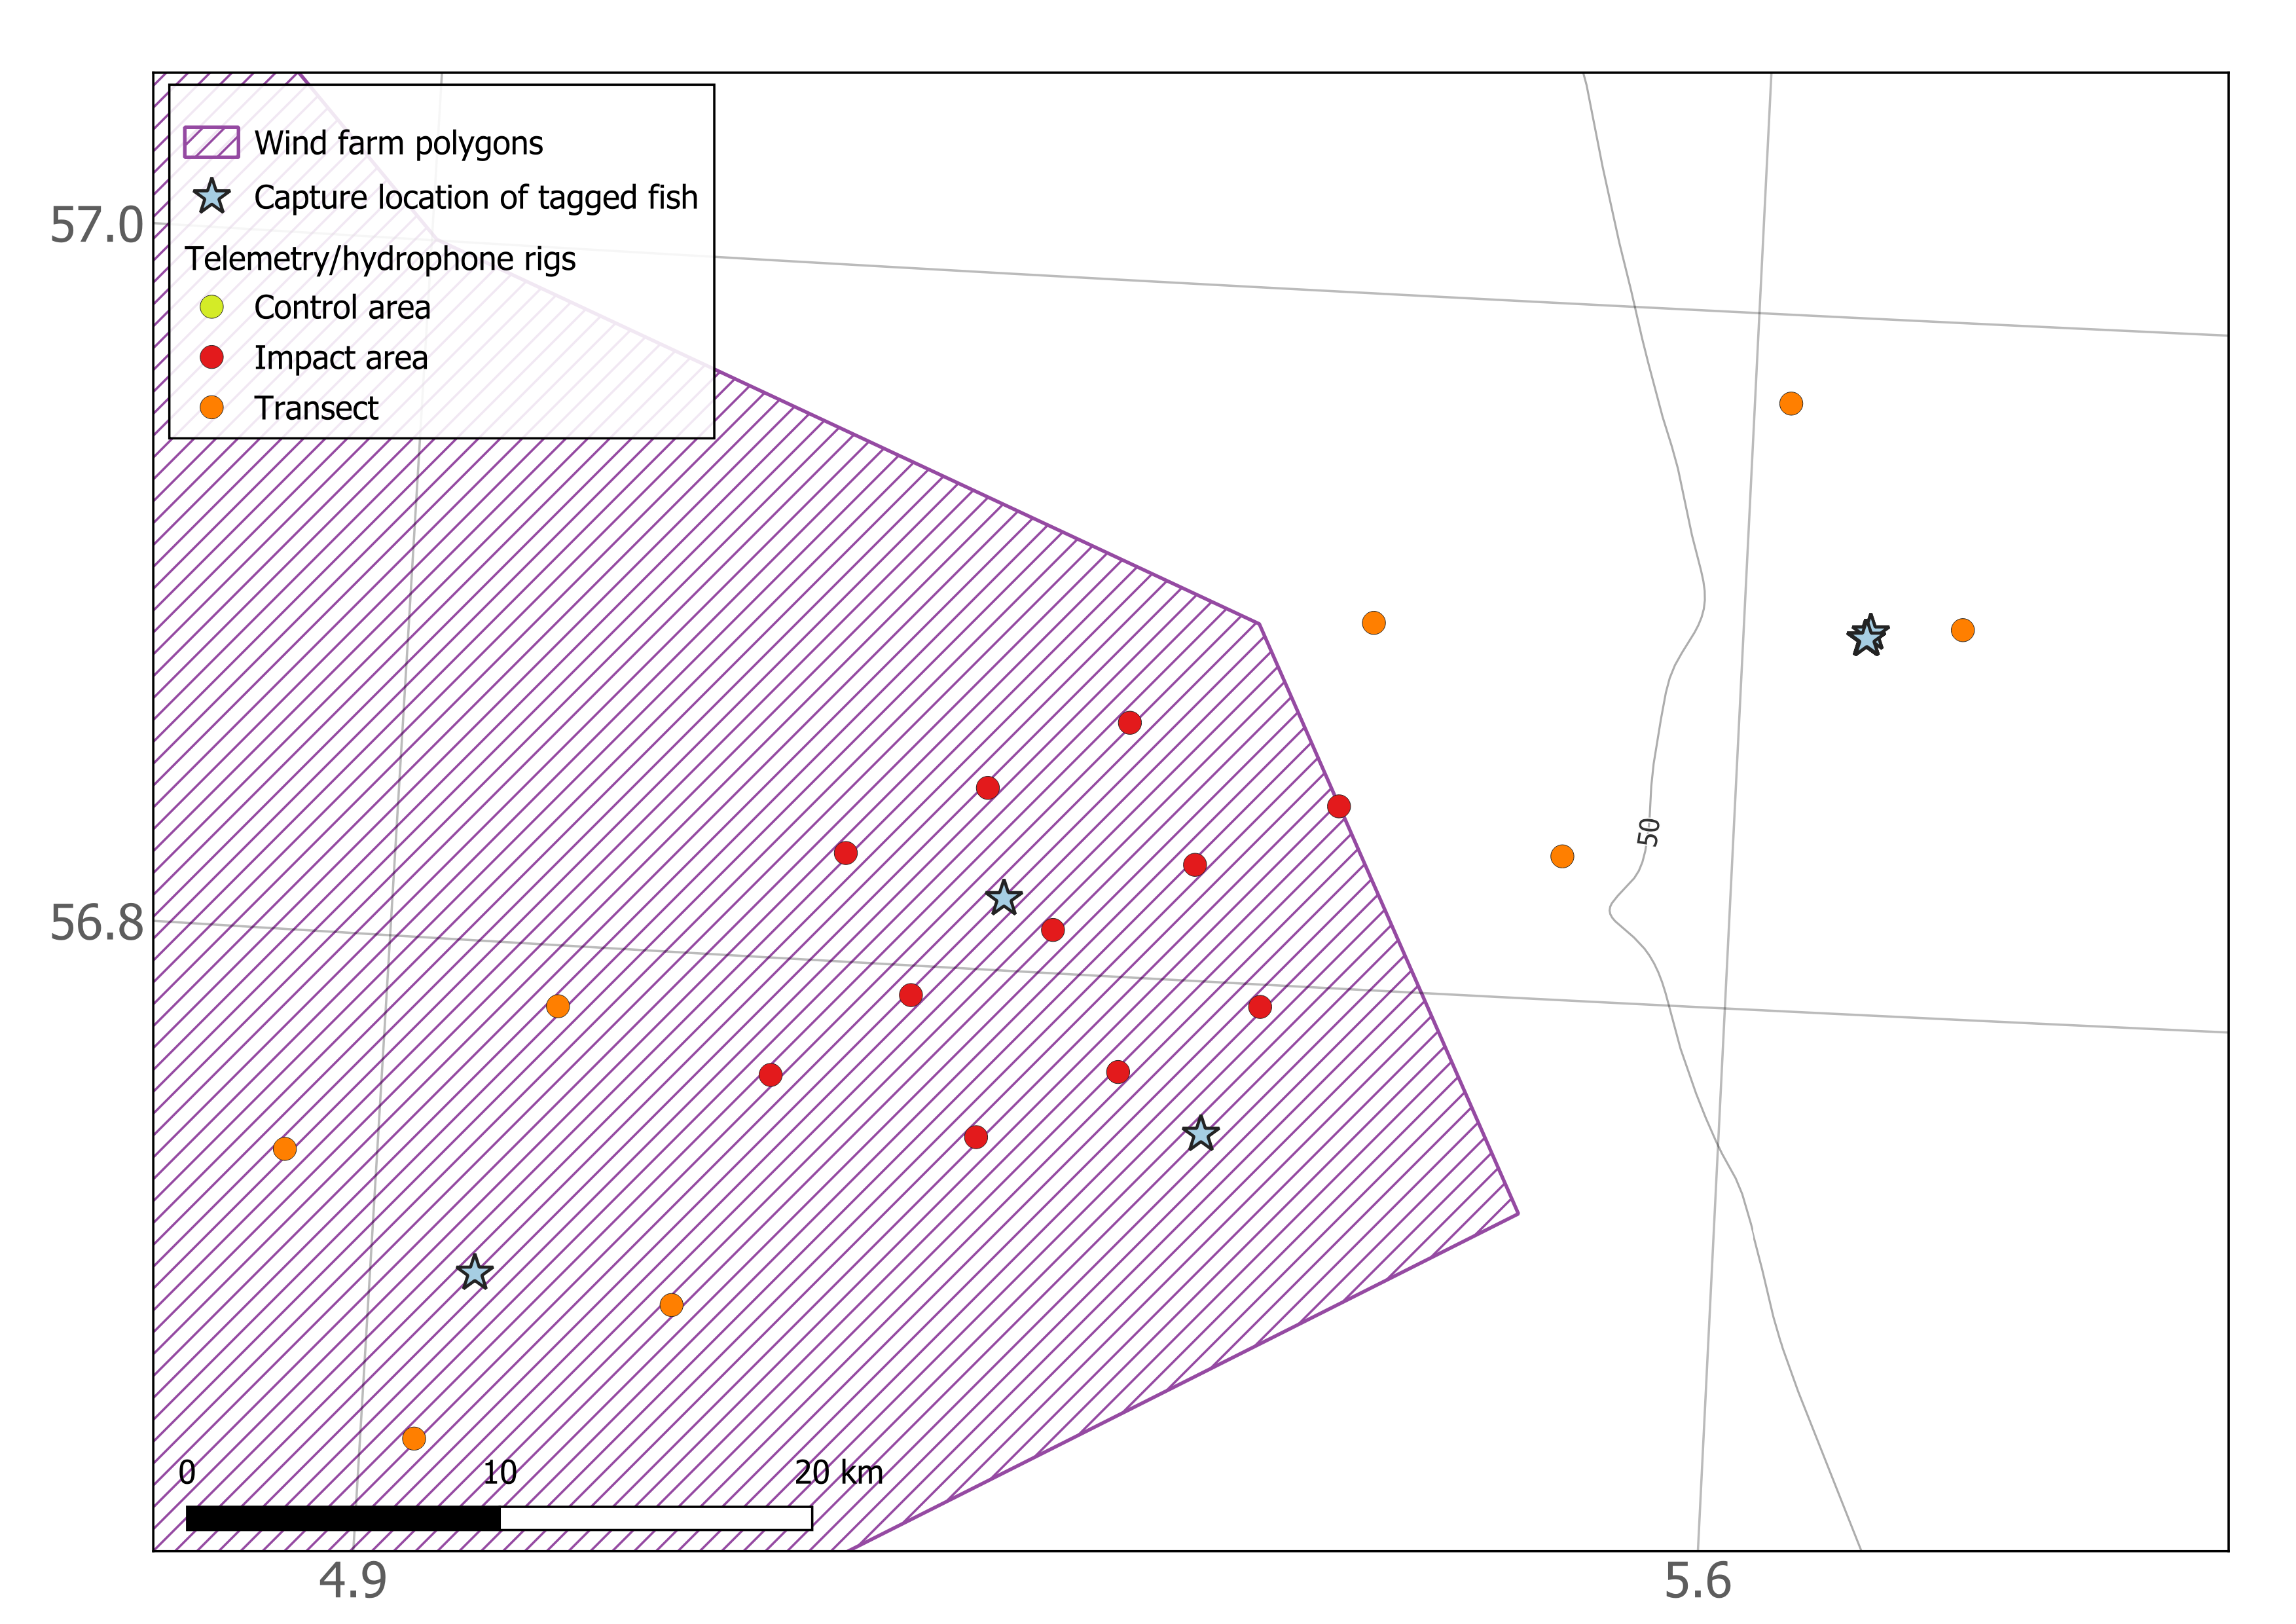
In Vestavind F, 5 blackbelly rosefish, 1 tusk and 5 saithe were tagged and released. In Sørvest F, 11 cod, 2 saithe and 1 skate were tagged and released (Figure 12). The majority of fish caught during the survey were either not the target species, too small to tag, or not in good enough condition after capture (mainly due to barotrauma or predation) for the tagging procedure. Most of the fish suitable for tagging were caught with fishing rod at locations close to wrecks (Sørvest F), or at areas east of the main impact array at Vestavind F (Figures 13 & 14).

6 - Data collected
6.1 - Hydrophone data
For the hydrophones, all memory cards with data were removed and stored. Due to security reasons, these need first to be checked and cleared by the Norwegian Defence Research Establishment (FFI) before we can open and use the data. Therefore, no hydrophone data are shown at this stage.
However, just looking at the file names and file sizes we can have an impression of the performance of the hydrophones. To have batteries lasting for a full year, hydrophones are set to record for 10 min every hour. None of the hydrophones ran out of batteries during the year of deployment, indicating that with this recording interval the battery capacity was not an issue.
All hydrophones were equipped with 4 SD cards with 513 GB memory. Most of the devices had used one full SD card and 60-80% of the second one. A few had used 2 full cards and around 50% of the third. Those devices clearly had larger file sizes (~230MB compared to ~100MB for those with only 2 cards being used). We do not know why certain devices had such large file sizes, as their settings (duty cycle and sampling interval) were the same as the rest.
The time stamp on the hydrophones is given by the computer that they were set up with. However, some clock drift is expected when the device is left without updates for an entire year. Observations of clock drift from individual instruments showed that this varies from 3 to less than one minute.
6.2 - Telemetry data
All telemetry data, including animal tagging, receiver deployment, and animal detection files, were uploaded to the European Tracking Network database (ETN, https://www.lifewatch.be/etn/). This database uses the FAIR data principles for data storage, management, and sharing. Here, data is licensed under the CCby 4.0 license (https://www.vliz.be/en/imis?module=dataset&dasid=9029). The project, including all telemetry information in this project, can be found under: IMR_OWF: Long term acoustic tracking of marine fish species in Norwegian Offshore Wind development areas.
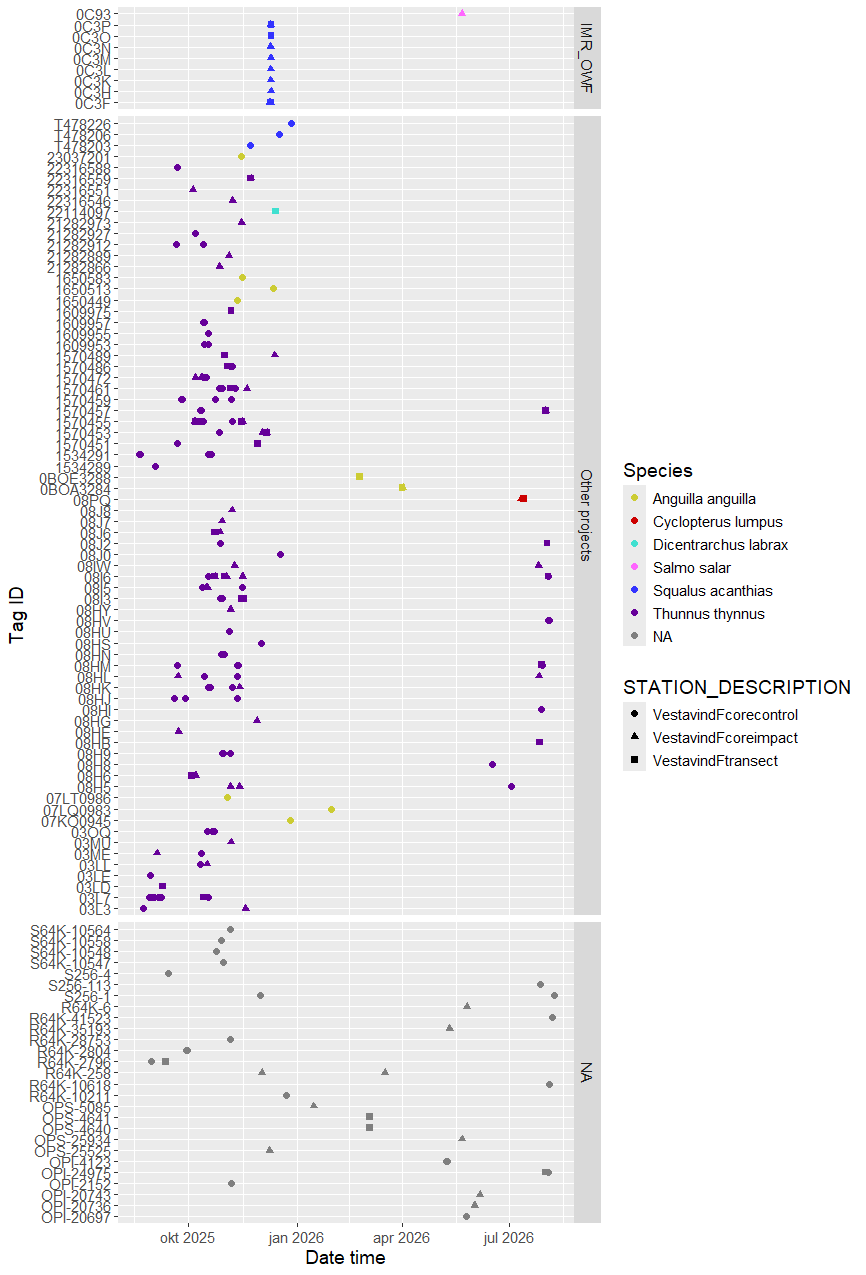
The data from the telemetry receivers were combined with fish tagging information from 2025 to investigate detections of tagged fish within the grid. Tag IDs that were only detected once in the dataset were filtered out before plotting, as these may be being false detections. This approach may also filter out real detections. Alternative filtering approaches are available for use with acoustic telemetry, and we will consider which approach to use for future analysis of these data.
At the Vestavind F arrays, eight spiny dogfish were detected in the array around the time of tagging in December 2025 (Figure 15). All were detected over a period of less than 48 h, indicating that they left the detection area of the receivers soon after tagging. One salmon that was tagged at the coast was also detected briefly (over a period of less than 12 h) in May. Additionally, there were detections of 101 other unknown tags (Figure 15). This includes tag IDs transmitting on the same protocol as we have used (OPs-69kHz), and other protocols (OPi-69kHz, R64K-69kHz, S256-69kHz, S64K-69kHz).
In Sørvest F, three cod were detected around the time of tagging (one in August and two in December), and one more was detected several months after tagging (tagged in December, detected in April) (Figure 16). The period over which cod were detected varied from < 1 h (2 cod), to 48 h (1 cod) to a period of 9 days (1 cod). Three spiny dogfish were also detected on Sørvest F receivers, each for a period of < 12 h in December, shortly after tagging. There were fewer unknown tag IDs detected in Sørvest F than Vestavind F, with 42 unknown IDs recorded during the 12-month deployment (Figure 16).
Using the ETN database, we were able to identity 80 of the unknown tag ID detected in Vestavind F and Sørvest F. Tags that had only one single detection were filtered out as those could be false detections. This left 1 brown trout, 1 Atlantic salmon, 1 lumpfish, 3 spiny dogfish, 3 European seabass, 10 European eels from two different projects, and 61 Atlantic bluefin tuna from two different project (Table 2, Figures 15&16).
| ETN project | Species | Common name | Number of individuals | Number of detections |
| 1 | Anguilla anguilla | European eel | 4 | 125 |
| 2 | Thunnus thynnus | Atlantic bluefin tuna | 45 | 824 |
| 3 | Dicentrarchus labrax | European seabass | 3 | 41 |
| 4 | Salmo trutta | Brown trout | 1 | 2 |
| 5 | Cyclopterus lumpus | Lumpfish | 1 | 75 |
| 6 | Anguilla anguilla | European eel | 6 | 321 |
| 7 | Squalus acanthias | Spiny dogfish | 3 | 75 |
| 8 | Salmo salar | Atlantic salmon | 1 | 24 |
| 9 | Thunnus thynnus | Atlantic bluefin tuna | 16 | 675 |

7 - Discussion
The rig retrieval during this cruise was successful. All rigs were found in the position where we had deployed them. The acoustic release mechanism worked well for all but one rig. Five days are probably sufficient to collect all rigs from one area (i.e. 30 rigs divided between the control and impact areas). However, good weather is needed to be able to retrieve the rigs. This should be considered when planning the duration of future cruises.
Our experience from this survey was that it was challenging to catch many fish suitable for tagging. The areas where we were fishing are deep in Sørvest F (40-70 m), and very deep in Vestavind F (>200 m). Fish with swimbladders are particularly sensitive to the pressure change during capture, showing signs of barotrauma such as inflated body cavities or inability to right themselves and swim away from the surface while in the holding tank. However, this did not affect all captured fish, and we also caught cod, haddock, saithe and other species in Sørvest F, as well as saithe in an area east of Vestavind F, that were not visibly suffering from the pressure change.
A consideration for planning future surveys is the time of year and water temperature. The telemetry receivers contain a temperature sensor, and we observed from the retrieved data that water temperature near the seafloor was 7-9°C in Sørvest F at the time of retrieval. The holding tanks on deck were filled using a hose that pumped seawater in from near the sea surface. We tested the temperature inside the holding tank using a receiver and found that it ranged between 17-19°C. The temperature change that the captured fish experience when being brought up from depth is therefore an additional stressor. After testing the water temperature in the holding tank, we added seawater cooled/frozen in the ship’s freezer to the tank to lower the temperature. This lowered the temperature until it was similar to the seafloor temperature. However, we should consider whether future tagging efforts should be conducted mainly in the autumn or winter, when the water column is more mixed and the water temperatures cooler. Although weather conditions will be more challenging for fieldwork, the conditions could be better for fish survival.
The optimal fishing gear for catching fish for tagging should also be evaluated. We had mixed success with the baited pots during this cruise. An advantage of this gear is that the catches were generally quite small, and therefore manageable for taking care of fish for tagging. We expect that is a relatively gentle capture method, as the fish can stay alive and swim around inside the pot until hauling. We used short soak times, usually overnight, to improve survival. However, fish were still impacted by the pressure change, even with slow hauling of the pots. In some areas, we also got a lot of bycatch of small fish unsuitable for tagging. Due to the nature of the fishing gear, even a relatively short soak time overnight could lead to scavenging and predation within the pots. Rod and line fishing seemed to be a good option for catching fish for tagging. When used in areas where large fish were present, we were able to catch fish in good condition for tagging. However, this method is quite time intensive and only feasible in relatively shallow water. We considered also trying Danish seine during this survey. In Vestavind F the captain considered it too deep to use. In Sørvest F, we considered using it on one of the good weather days. However, as we had already set several fleets of baited pots, we knew that the area had a lot of small whiting and haddock which were not suitable for tagging. We expected that if we used the Danish seine, we would end up catching a lot of these non-target fish. We therefore rather focused on using the fishing rod and reel in areas where we were having some success at catching large fish suitable for tagging (mainly close to shipwrecks). Other gears that could be considered for future tagging could be gillnets or longline. During the fish tagging survey in December 2025, gillnets seemed to be an effective method to catch live spiny dogfish in Vestavind F region.
Finally, smaller tags could be purchased to be able to tag more of the fish caught in the Sørvest F region. The area has quite a lot of haddock, but most are too small to tag with the 13 mm tags, as we aim for the tag weight to be at most 2% of the fish weight. Smaller tags will have shorter battery lives and possibly weaker signals, but would allow more of the fish in that region to be tagged.
Preliminary data analysis suggests that the fish that have been tagged so far in 2025 did not spend a lot of time close to the telemetry receivers. This is still a relevant result, as the site attachment of the various species in this baseline period can be compared to data collected after the OWF are built. Further tagging and data collection over subsequent years is required to address the aim of gathering a representative dataset of presence and spatial behaviours of different fish species at these sites.
There were a lot of unknown tag IDs registered on the telemetry receivers. Using the ETN database we were able to identify 80 of those as tagged fish from eight other projects. This highlights that both areas are used by a variety of migratory fish species tagged around the North Sea areas, and that collaboration between telemetry studies is important to elevate data use and insights.
Acknowledgements
Thanks to the captains and crews of Hovden Viking for good cooperation on the survey.
8 - References
Bicknell, A. W. J., Gierhart, S., Newton, M., Main, R., Thompson, P., and Witt, M. J. (2025). The role of acoustic telemetry to assess the effects of offshore wind infrastructure on fish behaviour, populations and predation. Renewable and Sustainable Energy Reviews, 212: 115306.
De Jong, K., Steen, H., Forland, T.N., Wehde, H., Nyqvist, D., Utne Palm, A.C., Nilssen, K.T., Albertsen, J., Falkenhaug, T., Biuw, M., Buhl-Mortensen, L., Sivle, L.D., (2020). Potensielle effekter av havvindanlegg på havmiljøet. Rapport fra havforskningen 2020-42 ISSN: 1893-4536.
Methratta, E. T. (2020). Monitoring fisheries resources at offshore wind farms: BACI vs. BAG designs. ICES Journal of Marine Science, 77(3), 890–900.
Van Parijs, S. M., Baker, K., Carduner, J., Daly, J., Davis, G. E., Esch, C., ... & Staaterman, E. (2021). NOAA and BOEM minimum recommendations for use of passive acoustic listening systems in offshore wind energy development monitoring and mitigation programs. Frontiers in Marine Science, 8, 760840.
9 - Appendix
| STATION_NAME | STATION_DESCRIPTION | RECEIVER | SOUND_TRAP_ID | SOUND_TRAP_SERIAL | DEPLOY_DATE_TIME | LONGITUDE | LATITUDE | RECOVER_DATE_TIME | BOTTOM_DEPTH |
| 1 | SørvestFcoreimpact | 3896 | 36 | 9447 | 2026-08-15T10:54:00Z | 5,3926 | 56,8523 | 2026-08-14T12:18:00Z | 56 |
| 2 | SørvestFcoreimpact | 3897 | 29 | 9311 | 2026-08-16T09:15:00Z | 5,21213 | 56,7517 | 2026-08-15T15:21:00Z | 59 |
| 3 | SørvestFcoreimpact | 3998 | 30 | 9446 | 2026-08-15T12:57:00Z | 5,28447 | 56,7727 | 2026-08-14T15:02:00Z | 56 |
| 4 | SørvestFcoreimpact | 3999 | 31 | 9449 | 2026-08-15T12:25:00Z | 5,35689 | 56,7935 | 2026-08-14T14:26:00Z | 56 |
| 5 | SørvestFcoreimpact | 4000 | 28 | 9308 | 2026-08-16T08:50:00Z | 5,17397 | 56,7915 | 2026-08-15T14:49:00Z | 60 |
| 6 | SørvestFcoreimpact | 4001 | 32 | 9448 | 2026-08-15T13:25:00Z | 5,24637 | 56,8124 | 2026-08-14T15:34:00Z | 54 |
| 7 | SørvestFcoreimpact | 4002 | 35 | 9451 | 2026-08-15T12:01:00Z | 5,31884 | 56,8333 | 2026-08-14T13:40:00Z | 55 |
| 8 | SørvestFcoreimpact | 4003 | 34 | 9445 | 2026-08-15T14:22:00Z | 5,13573 | 56,8312 | 2026-08-14T16:55:00Z | 63 |
| 9 | SørvestFcoreimpact | 4004 | 33 | 9444 | 2026-08-15T13:54:00Z | 5,20818 | 56,8521 | 2026-08-14T16:11:00Z | 57 |
| 10 | SørvestFcoreimpact | 4005 | 37 | 9305 | 2026-08-15T11:34:00Z | 5,28071 | 56,873 | 2026-08-14T13:04:00Z | 55 |
| 11 | SørvestFcoreimpact | 4006 | 27 | 9307 | 2026-08-16T98:52:00Z | 5,10301 | 56,7663 | 2026-08-15T16:04:00Z | 62 |
| 13 | SørvestFtransect | 4008 | 51 | 9457 | 2026-08-16T10:28:00Z | 4,98982 | 56,7825 | 2026-08-15T16:47:00Z | 60 |
| 14 | SørvestFtransect | 4010 | 50 | 9289 | 2026-08-16T12:04:00Z | 5,05818 | 56,6987 | 2026-08-16T11:17:00Z | 65 |
| 15 | SørvestFtransect | 4011 | no hydrophone | 2026-08-16T15:36:00Z | 4,85164 | 56,7369 | 2026-08-16T14:36:00Z | 59 | |
| 16 | SørvestFtransect | 4012 | 49 | 9288 | 2026-08-16T13:47:00Z | 4,92808 | 56,656 | 2026-08-16T12:53:00Z | 63 |
| 17 | SørvestFtransect | 4013 | 52 | 9286 | 2026-08-15T09:20:00Z | 5,40583 | 56,9055 | 2026-08-14T10:48:00Z | 53 |
| 18 | SørvestFtransect | 4014 | 22 | 9553 | 2026-08-15T10:03:00Z | 5,51094 | 56,8413 | 2026-08-14T11:36:00Z | 50 |
| 19 | SørvestFtransect | 4015 | no hydrophone | 2026-08-14T09:40:00Z | 5,61909 | 56,9745 | 2026-08-14T07:15:00Z | 57 | |
| 20 | SørvestFtransect | 4036 | no hydrophone | 2026-08-14T09:02:00Z | 5,71503 | 56,9119 | 2026-08-14T08:00:00Z | 53 | |
| 22 | SørvestFcorecontrol | 4038 | 43 | 9291 | 2026-08-17T07:05:00Z | 3,95714 | 56,4324 | 2026-08-17T06:13:00Z | 65 |
| 23 | SørvestFcorecontrol | 4039 | 48 | 9295 | 2026-08-17T16:31:00Z | 3,78231 | 56,3246 | 2026-08-17T15:49:00Z | 72 |
| 24 | SørvestFcorecontrol | 4040 | 46 | 9298 | 2026-08-17T15:24:00Z | 3,85303 | 56,3464 | 2026-08-17T14:44:00Z | 72 |
| 25 | SørvestFcorecontrol | 4041 | 47 | 9300 | 2026-08-17T08:28:00Z | 3,92384 | 56,3681 | 2026-08-17T07:41:00Z | 67 |
| 26 | SørvestFcorecontrol | 4042 | 45 | 9294 | 2026-08-18T16:06:00Z | 3,7431 | 56,3639 | 2026-08-18T15:23:00Z | 64 |
| 27 | SørvestFcorecontrol | 4043 | 44 | 9296 | 2026-08-17T14:16:00Z | 3,81388 | 56,3857 | 2026-08-17T13:34:00Z | 65 |
| 28 | SørvestFcorecontrol | 4044 | 42 | 9290 | 3,88473 | 56,4074 | 2026-08-17T09:00:00Z | ||
| 28 | SørvestFcorecontrol | 3891 | 42 | 9290 | 2026-08-17T10:13:00Z | 3,88473 | 56,4074 | 64 | |
| 29 | SørvestFcorecontrol | 4045 | 38 | 9310 | 2026-08-18T13:34:00Z | 3,70381 | 56,4032 | 2026-08-18T12:47:00Z | 66 |
| 30 | SørvestFcorecontrol | 4091 | 39 | 9304 | 2026-08-17T12:38:00Z | 3,77464 | 56,425 | 2026-08-17T12:00:00Z | 68 |
| 31 | SørvestFcorecontrol | 4092 | 40 | 9306 | 2026-08-17T11:32:00Z | 3,84554 | 56,4467 | 2026-08-17T10:47:00Z | 65 |
| 32 | SørvestFcorecontrol | 4093 | 41 | 9450 | 2026-08-18T14:57:00Z | 3,67269 | 56,3391 | 2026-08-18T14:15:00Z | 66 |
| 33 | VestavindFcoreimpact | 3200 | 6 | 9293 | 4,60897 | 59,4238 | 2026-08-04T08:27:00Z | ||
| 34 | VestavindFcoreimpact | 3898 | 13 | 9442 | 4,35965 | 59,3599 | 2026-08-04T12:30:00Z | ||
| 35 | VestavindFcoreimpact | 3899 | 12 | 9285 | 4,44611 | 59,367 | 2026-08-04T11:56:00Z | ||
| 36 | VestavindFcoreimpact | 4094 | 11 | 9461 | 4,53261 | 59,374 | 2026-08-04T10:41:00Z | ||
| 37 | VestavindFcoreimpact | 3901 | 9 | 9460 | 4,34566 | 59,404 | 2026-08-03T17:21:00Z | ||
| 38 | VestavindFcoreimpact | 3902 | 8 | 9462 | 4,43222 | 59,4111 | 2026-08-04T06:40:00Z | ||
| 39 | VestavindFcoreimpact | 3903 | 7 | 9458 | 4,51883 | 59,4182 | 2026-08-04T07:25:00Z | ||
| 40 | VestavindFcoreimpact | 3904 | 5 | 9302 | 4,33162 | 59,4481 | 2026-08-03T15:50:00Z | ||
| 41 | VestavindFcoreimpact | 3905 | 4 | 9440 | 4,41829 | 59,4553 | 2026-08-03T15:20:00Z | ||
| 42 | VestavindFcoreimpact | 3906 | 3 | 9437 | 4,50501 | 59,4623 | 2026-08-03T12:30:00Z | ||
| 43 | VestavindFcoreimpact | 3907 | 10 | 9441 | 4,2538 | 59,3954 | 2026-08-03T16:37:00Z | ||
| 44 | VestavindFtransect | 3886 | no hydrophone | 4,47899 | 59,5498 | 2026-08-03T11:44:00Z | |||
| 45 | VestavindFtransect | 3887 | no hydrophone | 4,39003 | 59,2697 | 2026-08-04T13:24:00Z | |||
| 46 | VestavindFtransect | 3888 | 14 | 9436 | 4,56356 | 59,2879 | 2026-08-04T14:21:00Z | ||
| 47 | VestavindFtransect | 3889 | 15 | 9292 | 4,4228 | 59,1779 | 2026-08-04T17:14:00Z | ||
| 48 | VestavindFtransect | 3890 | 4,59545 | 59,1948 | 2026-08-04T15:17:00Z | ||||
| 50 | VestavindFtransect | 3892 | 1 | 9438 | 4,45206 | 59,6382 | 2026-08-03T07:50:00Z | ||
| 51 | VestavindFtransect | 3893 | 2 | 9439 | 4,30458 | 59,5322 | |||
| 52 | VestavindFtransect | 3894 | 4,27473 | 59,6247 | 2026-08-03T09:06:00Z | ||||
| 54 | VestavindFcorecontrol | 4076 | 19 | 9299 | 4,87904 | 58,5266 | 2026-08-07T09:10:00Z | ||
| 55 | VestavindFcorecontrol | 4078 | 26 | 9301 | 4,63605 | 58,4592 | 2026-08-07T16:50:00Z | ||
| 56 | VestavindFcorecontrol | 4079 | 25 | 9456 | 4,72036 | 58,4661 | 2026-08-07T11:09:00Z | ||
| 57 | VestavindFcorecontrol | 4080 | 24 | 9455 | 4,80471 | 58,4729 | 2026-08-07T10:18:00Z | ||
| 58 | VestavindFcorecontrol | 4081 | 22 | 9453 | 4,6229 | 58,5034 | 2026-08-07T16:14:00Z | ||
| 59 | VestavindFcorecontrol | 4082 | 21 | 9452 | 4,70731 | 58,5102 | 2026-08-07T12:05:00Z | ||
| 60 | VestavindFcorecontrol | 4083 | 20 | 9287 | 4,79176 | 58,5171 | 2026-08-07T09:46:00Z | ||
| 61 | VestavindFcorecontrol | 4084 | 18 | 9454 | 4,6097 | 58,5475 | 2026-08-07T13:14:00Z | ||
| 62 | VestavindFcorecontrol | 4085 | 17 | 9459 | 4,69421 | 58,5544 | 2026-08-07T12:36:00Z | ||
| 63 | VestavindFcorecontrol | 4086 | 16 | 9297 | 4,77877 | 58,5612 | 2026-08-07T08:13:00Z | ||
| 64 | VestavindFcorecontrol | 4087 | 23 | 9443 | 4,53682 | 58,4958 | 2026-08-07T14:38:00Z | ||
| 101 | VestavindFTransect | 3901 | 1 | 9438 | 2026-08-03T19:40:00Z | 4,33957 | 59,4112 | 260 | |
| 102 | VestavindFTransect | 3904 | 4 | 9440 | 2026-08-04T07:35:00Z | 4,5158 | 59,4246 | 264 | |
| 103 | VestavindFTransect | 3894 | 3 | 9437 | 2026-08-04T11:02:00Z | 4,5428 | 59,3363 | 266 | |
| 104 | VestavindFTransect | 3200 | no hydrophone | 2026-08-04T12:51:00Z | 4,36917 | 59,3185 | 257 | ||
| 105 | VestavindFImpact | 3902 | 5 | 9302 | 2026-08-04T13:46:00Z | 4,46555 | 59,2862 | 254 | |
| 106 | VestavindFImpact | 3899 | 10 | 9441 | 2026-08-04T14:41:00Z | 4,5685 | 59,249 | 266 | |
| 107 | VestavindFImpact | 3898 | 9 | 9460 | 2026-08-04T15:25:00Z | 4,582 | 59,2045 | 260 | |
| 108 | VestavindFImpact | 3892 | 8 | 9462 | 2026-08-04T15:54:00Z | 4,59495 | 59,1605 | 261 | |
| 109 | VestavindFTransect | 3903 | 12 | 9285 | 2026-08-05T06:28:00Z | 4,48565 | 58,9647 | 253 | |
| 110 | VestavindFTransect | 3886 | no hydrophone | 2026-08-05T07:17:00Z | 4,45398 | 59,0561 | 251 | ||
| 111 | VestavindFImpact | 3907 | 6 | 9293 | 2026-08-05T08:05:00Z | 4,42559 | 59,1462 | 251 | |
| 112 | VestavindFImpact | 3900 | 7 | 9458 | 2026-08-05T08:32:00Z | 4,4095 | 59,1902 | 252 | |
| 113 | VestavindFImpact | 3906 | no hydrophone | 2026-08-05T08:56:00Z | 4,39514 | 59,2345 | 255 | ||
| 114 | VestavindFImpact | 3905 | 14 | 9436 | 2026-08-05T09:23:00Z | 4,4805 | 59,2418 | 252 | |
| 115 | VestavindFImpact | 3889 | 11 | 9461 | 2026-08-05T09:50:00Z | 4,49517 | 59,1973 | 252 | |
| 116 | VestavindFImpact | 3890 | 13 | 9442 | 2026-08-05T10:48:00Z | 4,51113 | 59,1543 | 253 | |
| 117 | VestavindFImpact | 3887 | no hydrophone | 2026-08-05T11:17:00Z | 4,52687 | 59,1113 | 255 | ||
| 118 | VestavindFTransect | 3888 | 15 | 9292 | 2026-08-05T11:58:00Z | 4,62533 | 59,0743 | 264 | |
| 119 | VestavindFControl | 4081 | 18 | 9454 | 2026-08-07T17:47:00Z | 4,77905 | 58,5615 | 266 | |
| 120 | VestavindFControl | 4087 | 17 | 9459 | 2026-08-07T18:12:00Z | 4,76647 | 58,606 | 257 | |
| 121 | VestavindFControl | 4085 | 23 | 9443 | 2026-08-08T06:21:00Z | 4,86417 | 58,5689 | 259 | |
| 122 | VestavindFControl | 4082 | 20 | 9287 | 2026-08-08T06:44:00Z | 4,87893 | 58,5269 | 273 | |
| 123 | VestavindFControl | 4084 | 21 | 9452 | 2026-08-08T07:11:00Z | 4,88802 | 58,4792 | 280 | |
| 124 | VestavindFControl | 4079 | 24 | 9455 | 2026-08-08T07:48:00Z | 4,7916 | 58,5169 | 271 | |
| 125 | VestavindFControl | 4083 | 25 | 9456 | 2026-08-08T08:14:00Z | 4,80473 | 58,476 | 276 | |
| 126 | VestavindFControl | 4086 | 16 | 9297 | 2026-08-08T08:40:00Z | 4,81782 | 58,4285 | 282 | |
| 127 | VestavindFControl | 4076 | no hydrophone | 2026-08-08T09:17:00Z | 4,72147 | 58,4662 | 275 | ||
| 128 | VestavindFControl | 4078 | 19 | 9299 | 2026-08-08T09:42:00Z | 4,7083 | 58,5103 | 270 | |
| 129 | VestavindFControl | 4080 | 26 | 9301 | 2026-08-08T10:05:00Z | 4,69397 | 58,554 | 266 | |
| 130 | VestavindFCoast | 4007 | 2026-08-12T12:16:00Z | 4,7532 | 59,1466 | 200 |
| Date setting | Time setting (local) | Latitude (setting, start) | Longitude (setting, start) | Latitude (setting, stop) | Longitude (setting, stop) | Depth (setting, start) | Depth (setting, stop) | Number of pots | Date hauling | Time hauling start | Station number |
| 14.08.2026 | 20:22 | 56,7590667 | 5,31368333 | 56,7561 | 5,32951667 | 56 | 60 | 21 | 15.08.2026 | 08:55 | 1 |
| 15.08.2026 | 20:45 | 56,78655 | 5,2149 | 56,7887333 | 5,20441667 | 59,6 | 62 | 21 | 16.08.2026 | 08:30 | 2 |
| 17.08.2026 | 18:50 | 56,3396 | 3,76181667 | 56,3373667 | 3,75333333 | 62 | 62 | 15 | 18.08.2026 | 10:42 | 3 |
| 17.08.2026 | 15:20 | 56,3968667 | 3,81303333 | 56,3923 | 3,79878333 | 65 | 65 | 21 | 18.08.2026 | 13:06 | 4 |
| 19.08.2026 | 00:28 | 56,76125 | 5,329333 | 56,77107 | 5,328417 | 59 | 59 | 21 | 19.08.2026 | 12:50 | 5 |
| 19.08.2026 | 00:47 | 56,77068 | 5,342233 | 56,77633 | 5,3415 | 57 | 56 | 15 | 19.08.2026 | 14:10 | 6 |
| 19.08.2026 | 15:28 | 56,7553 | 5,32935 | 56,75662 | 5,321217 | 59 | 59 | 10 | 20.08.2026 | 08:22 | 7 |
| 19.08.2026 | 16:26 | 56,84557 | 5,25975 | 56,84775 | 5,2669 | 57 | 55 | 11 | 20.08.2026 | 09:41 | 8 |
| 19.08.2026 | 18:16 | 56,90495 | 5,66675 | 56,9098 | 5,6668 | 47 | 49 | 15 | 20.08.2026 | 12:33 | 9 |
| 20.08.2026 | 18:15 | 56,70452 | 4,954633 | 56,70867 | 4,956317 | 62 | 62 | 11 | 21.08.2026 | 08:10 | 10 |
| 20.08.2026 | 10:34 | 56,82063 | 5,219833 | 56,82273 | 5,219767 | 57 | 57 | 10 | 21.08.2026 | 10:04 | 11 |
| 20.08.2026 | 15:13 | 56,90545 | 5,665783 | 56,91027 | 5,6658 | 48 | 48 | 15 | 21.08.2026 | 12:40 | 12 |
| Date setting | Time setting (local) | Latitude (hauling) | Longitude (hauling) | Depth | Number of pots | Date hauling | Time hauling | Station number |
| 04.08.2026 | 18:30 | 59,140516667 | 4,519116667 | 250 | 12 | 05.08.2026 | 16:30 | 1 |
| 07.08.2026 | 09:20 | 58,636733333 | 4,814016667 | 220 | 12 | 07.08.2026 | 21:15 | 2 |
| 08.08.2026 | 17:00 | 59,19465 | 4,510633333 | 260 | 15 | 09.08.2026 | 10:20 | 3 |
| 08.08.2026 | 18:00 | 59,3008 | 4,5029 | 268 | 20 | 09.08.2026 | 16:40 | 4 |
| 09.08.2026 | 17:15 | 59,187483333 | 4,469833333 | 250 | 20 | 11.08.2026 | 12:00 | 5 |
| 09.08.2026 | 18:15 | 59,27275 | 4,4745 | 258 | 15 | 11.08.2026 | 15:00 | 6 |
| 11.08.2026 | 16:15 | 59,17425 | 4,533766667 | 255 | 21 | 12.08.2026 | 11:20 | 7 |
| 11.08.2026 | 17:30 | 59,14655 | 4,7586 | 190 | 15 | 12.08.2026 | 13:40 | 8 |
| 23.08.2026 | 12:03 | 59,382683 | 4,409383 | 261 | 15 | 14.08.2026 | 08:20 | 9 |