Incorrectly listed biomass for immature stock in 2022 in table 9 was corrected on 08.11.2022.
Advice on fishing opportunities for Barents Sea capelin in 2023
— ICES subareas 1 and 2 excluding Division 2.a west of 5°W
Report series:
IMR-PINRO 2022-7
Published: 18.10.2022
Updated: 08.11.2022
Approved by:
Research Director(s):
Geir Huse
Program leader(s):
Summary
Stock Name: Barents Sea capelin (ICES subareas 1 and 2 excluding Division 2.a west of 5°W)
Advice on fishing opportunities
The Joint Russian-Norwegian Working Group on Arctic Fisheries (JRN-AFWG) advises that when the Joint Norwegian–Russian Fisheries Commission management plan is applied, catches in 2023 should be no more than 62 000 tonnes.
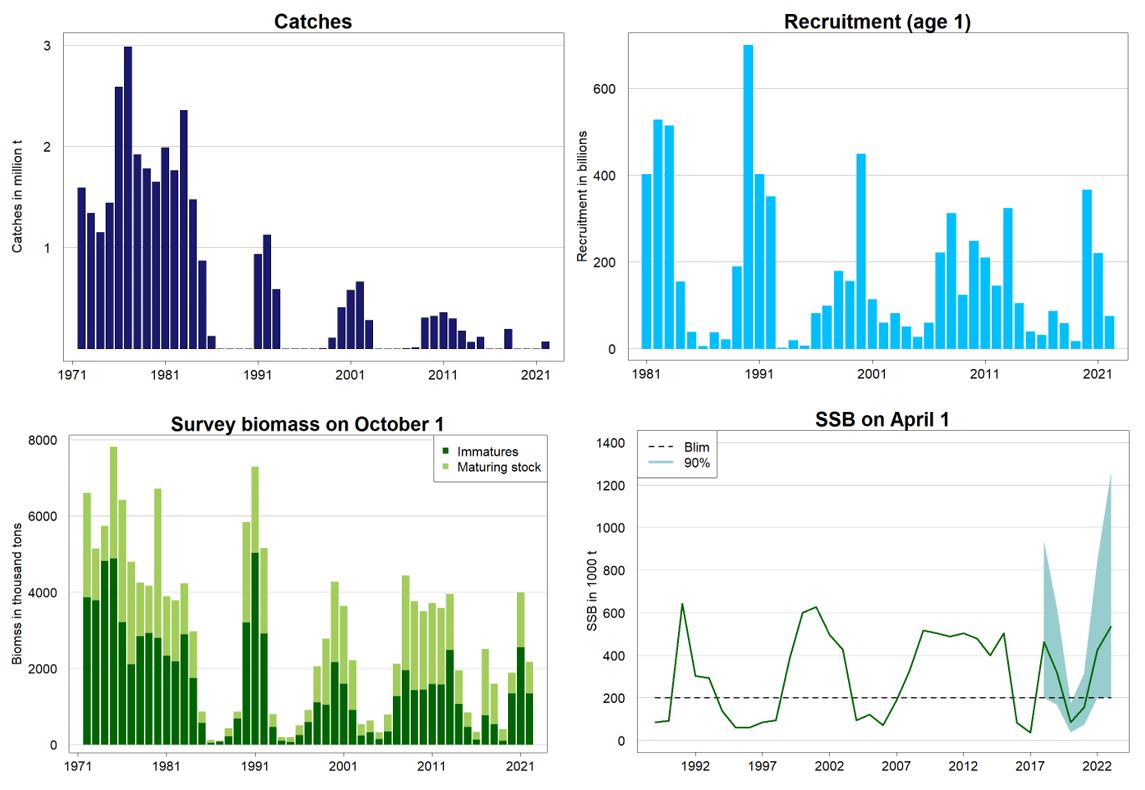
Stock development over time
Spawning‑stock size is above Blim . No reference points for fishing pressure have been defined for this stock.
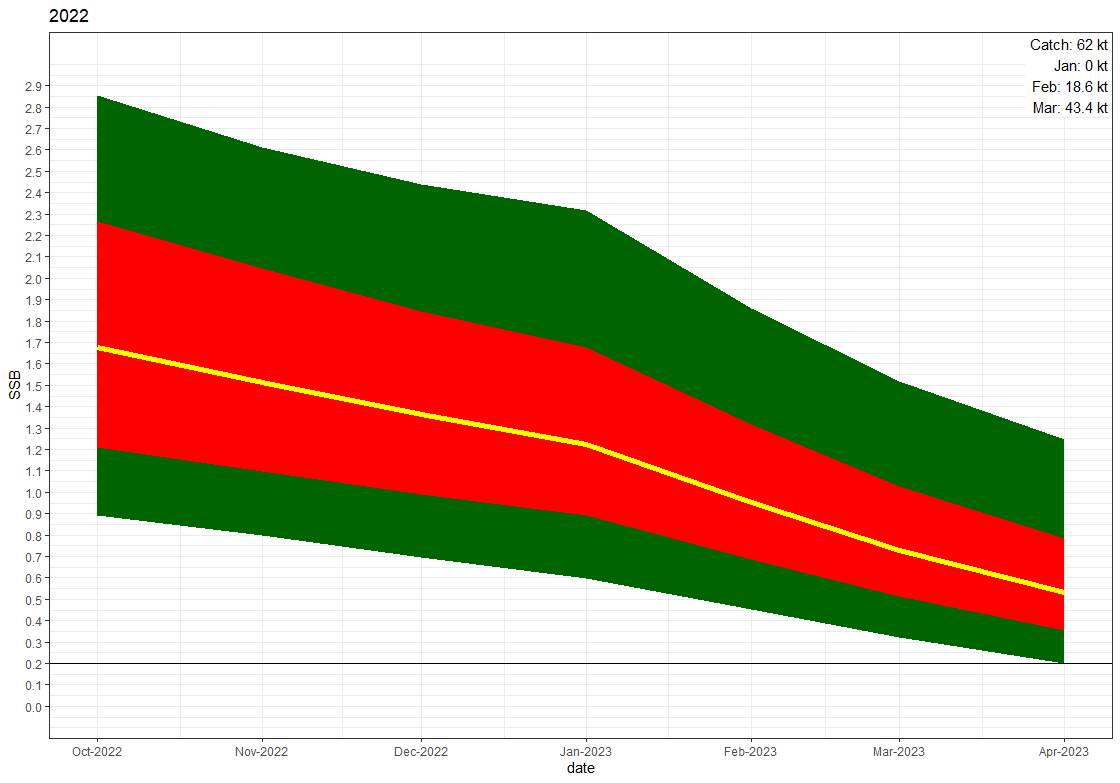
Catch scenarios
Calculations of catch scenarios are based on a forward projection from the autumn acoustic survey. It involves that SSB for April 2023 is calculated by taking into account predation by immature cod and other sources of natural mortality. A catch scenario that results in SSB greater than 200 000 tonnes with 95% probability corresponds to the JNRFC Management Plan.
| Variable | Value | Notes |
|---|---|---|
| Maturing stock biomass 2022 | 1 680 000 | Median biomass of fish above the length‑at‑maturity (14 cm), estimated based on the autumn acoustic survey 1 October 2022 with compensation for incomplete spatial coverage. These fish will be spawning in April 2023; tonnes. |
| Predation by immature cod January–March 2023; from the predation model | 627 000 | Based on the prediction of cod abundance in 2023 from the 2022 cod stock assessment (Anon, 2022a); tonnes. |
| Basis | Total catch (2023) | Median SSB (2023) | P (SSB 2023 > 200 000 t) in % | % TAC change * | % advice change * * |
|---|---|---|---|---|---|
| ICES advice basis | |||||
| MP harvest control rule, P (SSB > 200 000 t) = 95% | 62 000 | 534 000 | 95 | -11 | -11 |
| Other scenarios | |||||
| F=0 | 0 | 586 000 | 98 | -100 | -100 |
| Other approaches for compensating for incomplete spatial coverage and applying management plan | |||||
| Area adjustment drawn from 9 (2007-2013, 2017 and 2021) instead of 5 years, i.e. including years with high biomass of maturing capelin, but different age compositions in the stock | 21 000 | 440 000 | 95 | -70 | -70 |
| Predicting from 2021 survey with added uncertainty buffer | 31 000 | 439 000 | 95 | -56 | -56 |
| Predicting from 2021 survey without added uncertainty buffer | 72 000 | 413 000 | 95 | +3 | +3 |
| No compensation (survey estimate from Norwegian vessels only used) | 0 | 278 000 | 82 | -100 | -100 |
* TAC (2023) vs. TAC (2022).
** Advice (2023) vs Advice (2022)
Basis of the advice
| Advice basis | Management plan |
|---|---|
| Management plan | In 2002, the Joint Norwegian–Russian Fisheries Commission (JNRFC) adopted the following harvest control rule (HCR) for Barents Sea capelin: ‘ The TAC for the following year should be set so that, with 95% probability, at least 200 000 tonnes of capelin (B lim ) will be allowed to spawn ’. ICES evaluated this HCR as well as alternative HCRs suggested by JNRFC in 2016 (ICES, 2016), and only the existing HCR was found to be precautionary. Following ICES evaluation, the JNRFC decided to maintain the existing HCR (JNRFC, 2016) but decided that the HCR should be evaluated again in 2021. Such an evaluation has not yet been conducted. |
Quality of the assessment
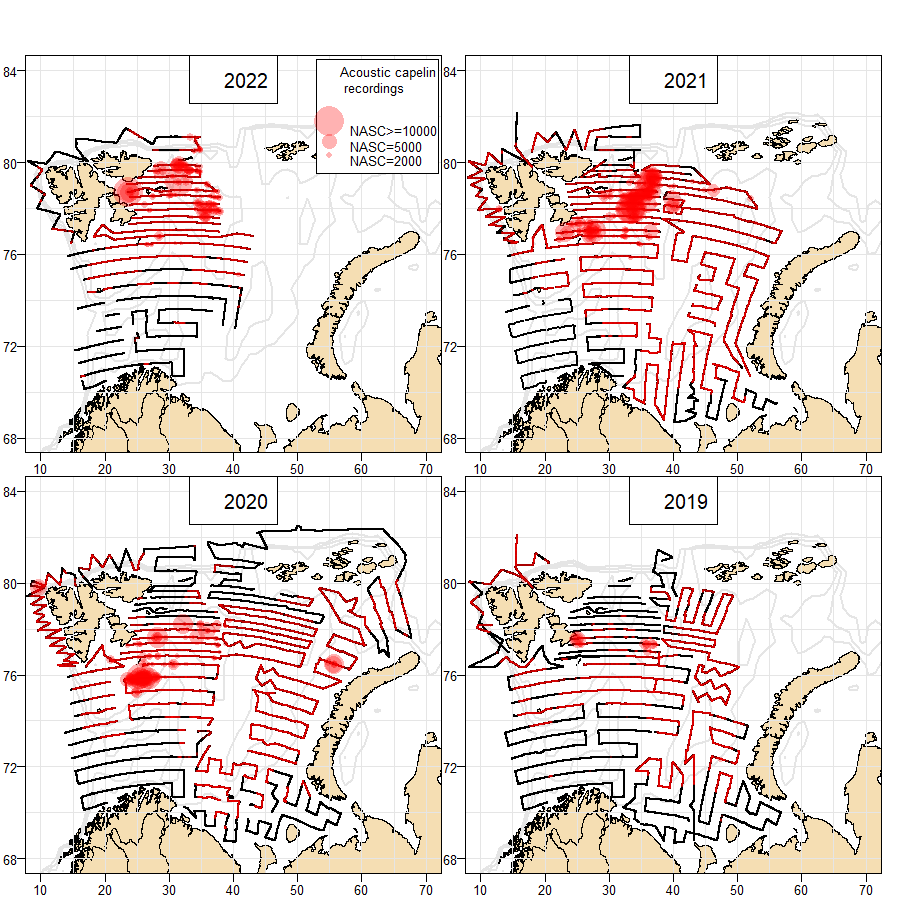
The survey coverage in the autumn of 2022 was incomplete with no coverage of the Russian EEZ (Fig 3). Two approaches were explored to compensate for the incomplete spatial coverage. The spatial distribution of capelin varies considerably between years, depending on the stock size and composition as well as climate. In 2014, a large part of the core capelin area was covered with ice, and the distribution in comparable years with complete spatial coverage was used to compensate for the incomplete survey coverage. The approach chosen here is consistent with the 2014 compensation approach.
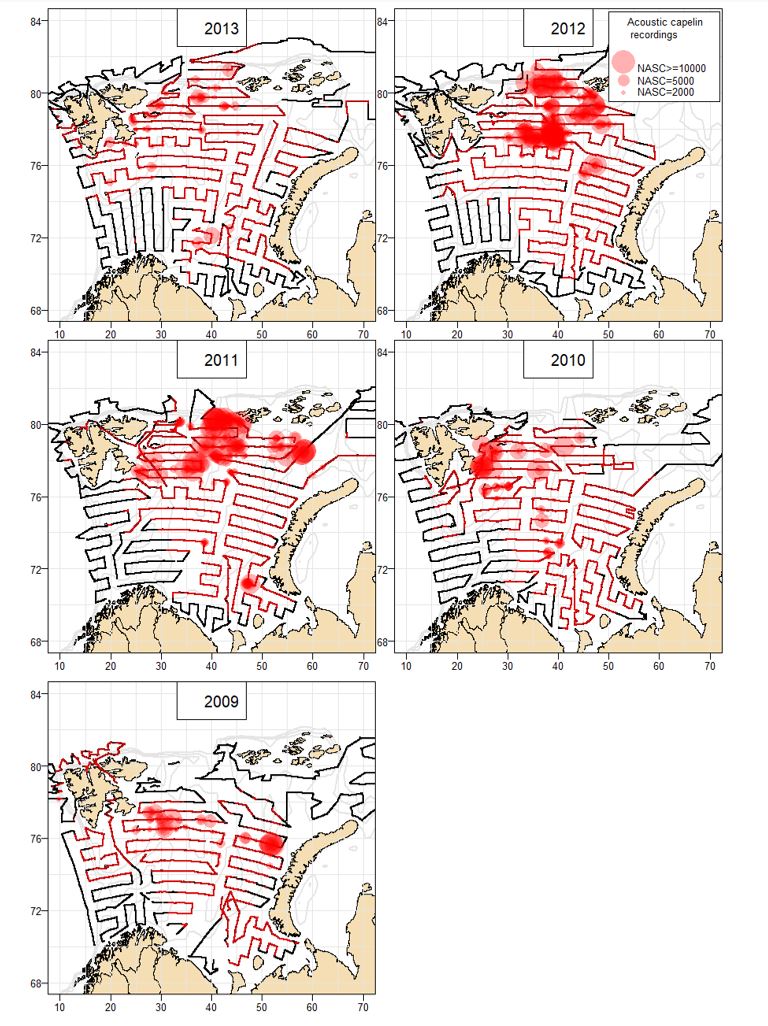
The biomass of maturing fish from the survey was scaled based on the proportion in the covered area in previous years with both comparable stock biomass and age composition. For these comparable years (2009-2013, distributions shown in Fig. 4), the proportion of maturing capelin biomass in the Norwegian and Russian EEZs from the survey was estimated. The fraction of the biomass of maturing capelin in the Norwegian EEZ was used as a scaling factor. In the projections used in the assessment, this scaling factor was drawn randomly from the comparable years.
This approach gave median biomass at October 1 2022 of 1.68 million tonnes and gave a quota advice of 62 000 tonnes, corresponding to a 95% probability of SSB> Blim on 1 April 2023.
The alternative approach was to make a prediction from the 2021 estimate to 2022 and use that as a starting point for the simulations. This approach gave a similar stock biomass and yielded quota levels from 31 000 to 72 000 tonnes depending on different uncertainty assumptions and data used. We also explored the first approach including years with high biomass of maturing capelin, but different age composition (i.e. years 2007-2013, 2017 and 2021 were included). This scenario gave a quota level of 21 000 tonnes. Without compensating for the incomplete survey coverage, the advice will be 0 tonnes. Details of these runs are given in Table 4.
| Basis | Total catch (2023) | Median biomass of maturing capelin 1 October 2022 | Median SSB ( 1 April 2023) , no catch | 5% percentile of SSB 1 April 2023 , no catch |
|---|---|---|---|---|
| Advice basis, i. e. area adjustment drawn from 5 years, (2009-2013), years with high biomass of maturing capelin and similar age composition | 62 000 | 1 628 000 | 586 000 | 250 000 |
| Area adjustment drawn from 9 instead of 5 years, (2007-2013, 2017, 2021) i. e. including years with high biomass of maturing capelin but with different age compositions | 21 000 | 1 260 000 | 455 000 | 215 000 |
| Predicting from 2021 survey with added uncertainty | 31 000 | 1 350 000 | 464 000 | 225 000 |
| Predicting from 2021 survey without added uncertainty | 72 000 | 1 380 000 | 471 000 | 256 000 |
| No compensation for incomplete area coverage (survey estimate from Norwegian zone only used) | 0 | 833 000 | 278 000 | 148 000 |
Issues relevant for the advice
Due to the temporary suspension of Russian scientists from ICES, this assessment was conducted by a Joint Russian-Norwegian working group on Arctic Fisheries (JRN-AFWG) consisting of scientists from VNIRO (Russia) and IMR (Norway) (Anon., 2022b). This advice has been conducted outside ICES and should not be considered as ICES advice. However, this assessment and advice has been produced following the methodology agreed at the ICES benchmark in 2015 (ICES, 2015).
The maturing year classes (2019 and 2020) are relatively abundant. However, owing to a low mean weight at age this has not led to a high maturing biomass and catch advice.
Reference points
| Framework | Reference point | Value | Technical basis | Source |
|---|---|---|---|---|
| MSY approach | MSY Btrigger | |||
| FMSY | ||||
| Precautionary approach | Blim | 200 000 | Value set above SSB 1989 , which was the lowest SSB that has produced a good year class. SSB estimated on April 1; tonnes | ICES (2001), Gjøsæter et al . (2002). |
| Bpa | ||||
| Flim | ||||
| Fpa | ||||
| Management plan | Bmgt | No specific value | The B mgt used in the HCR corresponds to 95% probability of the SSB being above B lim (200 000 tonnes) | JNRFC (2016) |
| Fmgt |
Basis of the assessment
| ICES stock data category | 1 ( ICES, 2021b ). |
|---|---|
| Assessment type | Model based on acoustic survey and prediction six months ahead to calculate spawning biomass. Target escapement strategy used. |
| Input data | Norwegian–Russian acoustic survey in September. Model estimates of maturation based on survey data. Natural mortalities from multispecies model (predation by immature cod on prespawning capelin based on information on cod distribution, abundance and stomach content data) . |
| Discards and bycatch | All catches are assumed to be landed. The amount of bycaught capelin in other fisheries is very low. |
| Indicators | None. |
| Other information | Latest benchmark was in 2015 (ICES, 2015). |
| Working group | Joint Russian-Norwegian working group on Arctic Fisheries (JRN-AFWG). |
History of the advice, catch, and management
| Year | ICES advice | Catch corresponding to advice | Agreed TAC | ICES catch |
|---|---|---|---|---|
| 1987 | Catches at the lowest practical level | 0 | 0 | 0 |
| 1988 | No catch | 0 | 0 | 0 |
| 1989 | No catch | 0 | 0 | 0 |
| 1990 | No catch | 0 | 0 | 0 |
| 1991 | TAC | 1000000 | 900000 | 933000 |
| 1992 | SSB > 400 000–500000 t | 834000 | 1100000 | 1123000 |
| 1993 | A cautious approach, SSB > 400 000–500 000 t | 600000 | 630000 | 586000 |
| 1994 | No fishing | 0 | 0 | 0 |
| 1995 | No fishing | 0 | 0 | 0 |
| 1996 | No fishing | 0 | 0 | 0 |
| 1997 | No fishing | 0 | 0 | 1000 |
| 1998 | No fishing | 0 | 0 | 3000 |
| 1999 | SSB > 500 000 t | 79000 | 80000 | 101000 |
| 2000 | 5% probability of SSB < 200 000 t | 435000 | 435000 | 414000 |
| 2001 | 5% probability of SSB < 200 000 t | 630000 | 630000 | 568000 |
| 2002 | 5% probability of SSB < 200 000 t | 650000 | 650000 | 651000 |
| 2003 | 5% probability of SSB < 200 000 t | 310000 | 310000 | 282000 |
| 2004 | No fishing | 0 | 0 | 0 |
| 2005 | No fishing | 0 | 0 | 1000* |
| 2006 | No fishing | 0 | 0 | 0 |
| 2007 | No fishing | 0 | 0 | 4000* |
| 2008 | No fishing | 0 | 0 | 12000* |
| 2009 | 5% probability of SSB < 200 000 t | 390000 | 390000 | 307000 |
| 2010 | 5% probability of SSB < 200 000 t | 360000 | 360000 | 323000 |
| 2011 | 5% probability of SSB < 200 000 t | 380000 | 380000 | 360000 |
| 2012 | 5% probability of SSB < 200 000 t | 320000 | 320000 | 296000 |
| 2013 | 5% probability of SSB < 200 000 t | 200000 | 200000 | 177000 |
| 2014 | 5% probability of SSB < 200 000 t | 65000 | 65000 | 66000 |
| 2015 | 5% probability of SSB < 200 000 t | 6000 | 120000 | 115000 |
| 2016 | Zero catch | 0 | 0 | 0 |
| 2017 | Zero catch | 0 | 0 | 0 |
| 2018 | 5% probability of SSB < 200 000 t | 205000 | 205000 | 194520 |
| 2019 | Zero catch | 0 | 0 ** | 53* |
| 2020 | Management plan | 0 | 0** | 31* |
| 2021 | Management plan | 0 | 0** | 10* |
| 2022 | Management plan | ≤ 70000 | 70000 | 6524 6*** |
| 2023 | Management plan *** | ≤ 62000 |
* Research catch and bycatches in other fisheries
** Up to 500 tonnes was allowed for research survey catches.
*** In 2022 assessment and advice was carried out by the Joint Russian-Norwegian working group on Arctic Fisheries (JRN-AFWG) which compiled catches for 2022 and gave advice for 2023.
History of catch and landings
| Year | Winter | Summer–Autumn | Year total | |||||
|---|---|---|---|---|---|---|---|---|
| Norway | Russia | Others | Total | Norway | Russia | Total | ||
| 1965 | 217000 | 7000 | 0 | 224000 | 0 | 0 | 0 | 224000 |
| 1966 | 380000 | 9000 | 0 | 389000 | 0 | 0 | 0 | 389000 |
| 1967 | 403000 | 6000 | 0 | 409000 | 0 | 0 | 0 | 409000 |
| 1968 | 460000 | 15000 | 0 | 475000 | 62000 | 0 | 62000 | 537000 |
| 1969 | 436000 | 1000 | 0 | 437000 | 243000 | 0 | 243000 | 680000 |
| 1970 | 955000 | 8000 | 0 | 963000 | 346000 | 5000 | 351000 | 1314000 |
| 1971 | 1300000 | 14000 | 0 | 1314000 | 71000 | 7000 | 78000 | 1392000 |
| 1972 | 1208000 | 24000 | 0 | 1232000 | 347000 | 13000 | 360000 | 1591000 |
| 1973 | 1078000 | 34000 | 0 | 1112000 | 213000 | 12000 | 225000 | 1337000 |
| 1974 | 749000 | 63000 | 0 | 812000 | 237000 | 99000 | 336000 | 1148000 |
| 1975 | 559000 | 301000 | 43000 | 903000 | 407000 | 131000 | 538000 | 1441000 |
| 1976 | 1252000 | 228000 | 0 | 1480000 | 739000 | 368000 | 1107000 | 2587000 |
| 1977 | 1441000 | 317000 | 2000 | 1760000 | 722000 | 504000 | 1226000 | 2986000 |
| 1978 | 784000 | 429000 | 25000 | 1238000 | 360000 | 318000 | 678000 | 1916000 |
| 1979 | 539000 | 342000 | 5000 | 886000 | 570000 | 326000 | 896000 | 1782000 |
| 1980 | 539000 | 253000 | 9000 | 801000 | 459000 | 388000 | 847000 | 1648000 |
| 1981 | 784000 | 429000 | 28000 | 1241000 | 454000 | 292000 | 746000 | 1986000 |
| 1982 | 568000 | 260000 | 5000 | 833000 | 591000 | 336000 | 927000 | 1760000 |
| 1983 | 751000 | 373000 | 36000 | 1160000 | 758000 | 439000 | 1197000 | 2357000 |
| 1984 | 330000 | 257000 | 42000 | 629000 | 481000 | 368000 | 849000 | 1477000 |
| 1985 | 340000 | 234000 | 17000 | 591000 | 113000 | 164000 | 277000 | 868000 |
| 1986 | 72000 | 51000 | 0 | 123000 | 0 | 0 | 0 | 123000 |
| 1987 | 0 | 0 | 0 | 0 | 0 | 0 | 0 | 0 |
| 1988 | 0 | 0 | 0 | 0 | 0 | 0 | 0 | 0 |
| 1989 | 0 | 0 | 0 | 0 | 0 | 0 | 0 | 0 |
| 1990 | 0 | 0 | 0 | 0 | 0 | 0 | 0 | 0 |
| 1991 | 528000 | 159000 | 20000 | 707000 | 31000 | 195000 | 226000 | 933000 |
| 1992 | 620000 | 247000 | 24000 | 891000 | 73000 | 159000 | 232000 | 1123000 |
| 1993 | 402000 | 170000 | 14000 | 586000 | 0 | 0 | 0 | 586000 |
| 1994 | 0 | 0 | 0 | 0 | 0 | 0 | 0 | 0 |
| 1995 | 0 | 0 | 0 | 0 | 0 | 0 | 0 | 0 |
| 1996 | 0 | 0 | 0 | 0 | 0 | 0 | 0 | 0 |
| 1997 | 0 | 0 | 0 | 0 | 0 | 1000 | 1000 | 1000 |
| 1998 | 0 | 2000 | 0 | 2000 | 0 | 1000 | 1000 | 3000 |
| 1999 | 50000 | 33000 | 0 | 83000 | 0 | 22000 | 22000 | 105000 |
| 2000 | 279000 | 94000 | 8000 | 381000 | 0 | 29000 | 29000 | 410000 |
| 2001 | 376000 | 180000 | 8000 | 564000 | 0 | 14000 | 14000 | 578000 |
| 2002 | 398000 | 228000 | 17000 | 643000 | 0 | 16000 | 16000 | 659000 |
| 2003 | 180000 | 93000 | 9000 | 282000 | 0 | 0 | 0 | 282000 |
| 2004 | 0 | 0 | 0 | 0 | 0 | 0 | 0 | 0 |
| 2005 | 1000 | 0 | 0 | 1000 | 0 | 0 | 0 | 1000 |
| 2006 | 0 | 0 | 0 | 0 | 0 | 0 | 0 | 0 |
| 2007 | 2000 | 2000 | 0 | 4000 | 0 | 0 | 0 | 4000 |
| 2008 | 5000 | 5000 | 0 | 10000 | 0 | 2000 | 2000 | 12000 |
| 2009 | 233000 | 73000 | 0 | 306000 | 0 | 1000 | 1000 | 307000 |
| 2010 | 246000 | 77000 | 0 | 323000 | 0 | 0 | 0 | 323000 |
| 2011 | 273000 | 87000 | 0 | 360000 | 0 | 0 | 0 | 360000 |
| 2012 | 228000 | 68000 | 0 | 296000 | 0 | 0 | 0 | 296000 |
| 2013 | 116000 | 60000 | 0 | 177000 | 0 | 0 | 0 | 177000 |
| 2014 | 40000 | 26000 | 0 | 66000 | 0 | 0 | 0 | 66000 |
| 2015 | 71000 | 44000 | 0 | 115000 | 0 | 0 | 0 | 115000 |
| 2016 | 0 | 0 | 0 | 0 | 0 | 0 | 0 | 0 |
| 2017 | 0 | 0 | 0 | 0 | 0 | 0 | 0 | 0 |
| 2018 | 128520 | 66000 | 0 | 194520 | 0 | 0 | 0 | 194520 |
| 2019 | 5 | 0 | 0 | 0 | 0 | 0 | 0 | 53 |
| 2020 | 9 | 0 | 0 | 9 | 0 | 21 | 0 | 31 |
| 2021 | 2 | 0 | 0 | 2 | 0 | 8 | 0 | 10 |
| 2022 | 42597 | 22646 | 0 | 65243 | 0 | 3* | 3* | 65246* |
* Bycatch in other fisheries; values are preliminary.
Summary of the assessment
| Year | Predicted SSB assuming catch = ICES advised catch, 1 April | Recruitment from autumn acoustic survey, 1 October | Stock biomass from autumn acoustic survey, 1 October | Catch | |||
|---|---|---|---|---|---|---|---|
| Median | 5th percentile | 95th percentile | Immature | Maturing biomass | |||
| tonnes | Age 1, thousands | tonnes | |||||
| 1972 | 3873000 | 2727000 | 1591000 | ||||
| 1973 | 3794000 | 1350000 | 1337000 | ||||
| 1974 | 4826000 | 907000 | 1148000 | ||||
| 1975 | 4890000 | 2916000 | 1441000 | ||||
| 1976 | 3217000 | 3200000 | 2587000 | ||||
| 1977 | 2120000 | 2676000 | 2986000 | ||||
| 1978 | 2845000 | 1402000 | 1916000 | ||||
| 1979 | 2935000 | 1227000 | 1782000 | ||||
| 1980 | 2802000 | 3913000 | 1648000 | ||||
| 1981 | 402600000 | 2344000 | 1551000 | 1986000 | |||
| 1982 | 528300000 | 2188000 | 1591000 | 1760000 | |||
| 1983 | 514900000 | 2901000 | 1329000 | 2357000 | |||
| 1984 | 154800000 | 1756000 | 1208000 | 1477000 | |||
| 1985 | 38700000 | 575000 | 285000 | 868000 | |||
| 1986 | 6000000 | 55000 | 65000 | 123000 | |||
| 1987 | 37600000 | 84000 | 17000 | 0 | |||
| 1988 | 21000000 | 228000 | 200000 | 0 | |||
| 1989 | 84000 | 189200000 | 689000 | 175000 | 0 | ||
| 1990 | 92000 | 700400000 | 3214000 | 2617000 | 0 | ||
| 1991 | 643000 | 402100000 | 5039000 | 2248000 | 933000 | ||
| 1992 | 302000 | 351300000 | 2922000 | 2228000 | 1123000 | ||
| 1993 | 293000 | 2200000 | 466000 | 330000 | 586000 | ||
| 1994 | 139000 | 19800000 | 106000 | 94000 | 0 | ||
| 1995 | 60000 | 7100000 | 75000 | 118000 | 0 | ||
| 1996 | 60000 | 81900000 | 255000 | 248000 | 0 | ||
| 1997 | 85000 | 98900000 | 597000 | 312000 | 1000 | ||
| 1998 | 94000 | 179000000 | 1124000 | 932000 | 3000 | ||
| 1999 | 382000 | 156000000 | 1057000 | 1718000 | 105000 | ||
| 2000 | 599000 | 449200000 | 2175000 | 2098000 | 410000 | ||
| 2001 | 626000 | 113600000 | 1611000 | 2019000 | 578000 | ||
| 2002 | 496000 | 59700000 | 919000 | 1291000 | 659000 | ||
| 2003 | 427000 | 82400000 | 253000 | 280000 | 282000 | ||
| 2004 | 94000 | 51200000 | 334000 | 294000 | 0 | ||
| 2005 | 122000 | 26900000 | 150000 | 174000 | 1000 | ||
| 2006 | 72000 | 60100000 | 350000 | 437000 | 0 | ||
| 2007 | 189000 | 221700000 | 1275000 | 844000 | 4000 | ||
| 2008 | 330000 | 313000000 | 1960000 | 2468000 | 12000 | ||
| 2009 | 517000 | 124000000 | 1442000 | 2323000 | 307000 | ||
| 2010 | 504000 | 248200000 | 1449000 | 2051000 | 323000 | ||
| 2011 | 487000 | 209600000 | 1592000 | 2115000 | 360000 | ||
| 2012 | 504000 | 145900000 | 1589000 | 1997000 | 296000 | ||
| 2013 | 479000 | 324500000 | 2485000 | 1471000 | 177000 | ||
| 2014 | 399000 | 105100000 | 1076000 | 873000 | 66000 | ||
| 2015 | 504000 | 39500000 | 467000 | 375000 | 115000 | ||
| 2016 | 82000 | 31600000 | 147000 | 181000 | 0 | ||
| 2017 | 37000 | 86400000 | 783000 | 1723000 | 0 | ||
| 2018 | 462000 | 200000 | 930000 | 58600000 | 541000 | 1056000 | 194520 |
| 2019 | 317000 | 168282 | 613733 | 17455060 | 109533 | 301615 | 53 |
| 2020 | 85110 | 38830 | 171850 | 366430000 | 1351470 | 532820 | 31 |
| 2021 | 156376 | 75197 | 314559 | 220850000 | 2559660 | 1437960 | 10 |
| 2022 | 423751 | 201897 | 838670 | 75460000* | 1356191* | 817480* | 6524 6 |
| 2023 | 534000 | 201000 | 1250000 | ||||
*Not adjusted for incomplete survey coverage
References
Anon. 2022 a . Report of the Joint Russian-Norwegian Working Group on Arctic Fisheries (JRN-AFWG) 2022. IMR-PINRO report series 6-2022, 213 pp.
Anon. 2022b. Report of capelin assessment by the Joint Russian-Norwegian Working Group on Arctic Fisheries (JRN-AFWG) 2022 . IMR-PINRO report series 8-2022, xx pp.
Gjøsæter, H., Bogstad, B., and Tjelmeland, S. 2002. Assessment methodology for Barents Sea capelin, Mallotus villosus (Müller). ICES Journal of Marine Science, 59(5): 1086–1095. https://doi.org/10.1006/jmsc.2002.1238.
ICES. 2001. Barents Sea capelin (Subareas I and II, excluding Division IIa west of 5°W). In Report of the Advisory Committee on Fishery Management, 2001, Part 1, Section 3.1.8, pp. 65–70. ICES Cooperative Research Report No. 246. 921 pp. https://doi.org/10.17895/ices.pub.5383.
ICES. 2015. Report of the Benchmark Workshop on Arctic Stocks (WKARCT), 26–30 January 2015, Copenhagen, Denmark. ICES CM 2015/ACOM:31. 126 pp. https://doi.org/10.17895/ices.pub.5295 .
ICES. 2016. Report of the second Workshop on Management Plan Evaluation on Northeast Arctic cod and haddock and Barents Sea capelin, 25–28 January 2016, Kirkenes, Norway. ICES CM 2016/ACOM:47. 76 pp. https://doi.org/10.17895/ices.pub.5296.
JNRFC. 2016. Protocol of the 46th Session of the Joint Norwegian–Russian Fisheries Commission, Annex 12. Translated from Norwegian to English. For an accurate interpretation, please consult the text in the official languages of the Commission (Norwegian and Russian) at https://www.jointfish.com/content/download/501/6352/file/46-norsk.pdf (Norwegian) and https://www.jointfish.com/rus/content/download/502/6357/file/46-russisk.pdf (Russian).