Increased and updated knowledge of reproductive strategies of fish is crucial to optimize the temporal and spatial planning for conducting seismic surveys; in order to reduce its potential negative ecosystems impacts. The overall goal of this study is to improve our general knowledge about spawning areas of major North Sea fish stocks, including their spawning behavior and spawning period.
This report describes the methodology, preliminary results and experiences gained during the data sampling period August 2017 to December 2019. Molecular barcode and traditional visual taxonomic analyses were performed on eggs and larvae, systematically collected with plankton nets along a south to north axis in the North Sea. In total, 201 samples have been analysed from which 35 different fish taxa are identified. Based on historic data and previously published literature, our results agree with the expected number of the most prevalent fish species breeding in the North Sea. Both the taxonomic and molecular methods used, demonstrate robust and similar results in the identification of taxonomic groups. The results further demonstrate that the molecular taxonomic approach is more appropriate for identification to species levels for most taxonomic groups, whilst the identification of egg and larvae developmental stages can only be performed using the visual taxonomic method. The two techniques have the potential of complementing each other to provide a detailed description of the annual fish spawning cycle for the main North Sea species.
Our results demonstrate that the fish species diversity increase northwards, but here the spawning season is more concentrated. We have also identified new species spawning in the area, traditionally found more to the south or west of our study area.
To improve the spatial and temporal statistical data resolution required for achieving sufficient scientific evidence as basis for producing robust advice in timing of seismic surveys, modifications to the sampling protocol and equipment was made during 2019. Expectantly, this potential proves to work over the coming annual reproduction cycle. Our study also confirms that the study area represents a highly dynamic environment, thus we strongly recommend considering extending the time period for data collection, beyond what is planned so far (due out August 2020) and an expansion of the geographical coverage to include regions also further north and west.
2 - Introduction
Spawning behaviour in marine fish have demonstrated to be disturbed by high-energy acoustic sources, such as those produced from geological surveys where seismic methods are applied (Sundby et al., 2017). In the North Sea, more than 140 different fish species have been described. The most economically important fish species account for less than 10 % of the total number of species comprising around 80 % of the total North Sea fish catch in terms of biomass (Sundby et al., 2017). Despite the increased amount of studies and scientific information available concerning the biology and ecology of fish species in the North Sea, literature on spawning fish is still not very comprehensive with a distinct lack of information.
The project KINO-1 (“Dynamic Mapping of North Sea Spawning”) collected historic information from various databases about fish species spawning time in the North Sea (Sundby et al., 2017). This project demonstrated the need for detailed information including recent data from this dynamic and complex environment. Also, increased temperatures in the Northern part of the Atlantic Ocean over the last decades, likely affect distribution and abundance patterns of some fish species such as cod, haddock, whiting saithe and Norway pout in the North Sea (Sundby et al., 2017). These species display a decrease in biomass and a shift in the distribution towards the east, while other species such as sardine and anchovy have recently started to migrate towards the North Sea from the English Channel increasing in abundance. Consequently, these changes have altered the traditional preferred areas for feeding and spawning. Regular up to date assessments of the North Sea spawning is highly needed.
As an extension of KINO1, subsequent preparations were implemented including providing sampling equipment and the training of crew onboard supply vessels for sample collection procedures of fish eggs and larvae, during spring 2017. Test collection of samples from the supply vessels for the KINO-2 project initiated during August 2017. Financing and official initiation of the KINO-2 project, started 1. May 2018. KINO-2 aims to improve knowledge about spawning areas and timing for the main fish species reproducing in the North Sea during 2017-2020. This knowledge will be crucial for producing robust management advice for timing and location of seismic surveys to minimize potential negative effects on reproduction and development of early life stages of the North Sea fishes.
3 - Materials and Methods
Study site
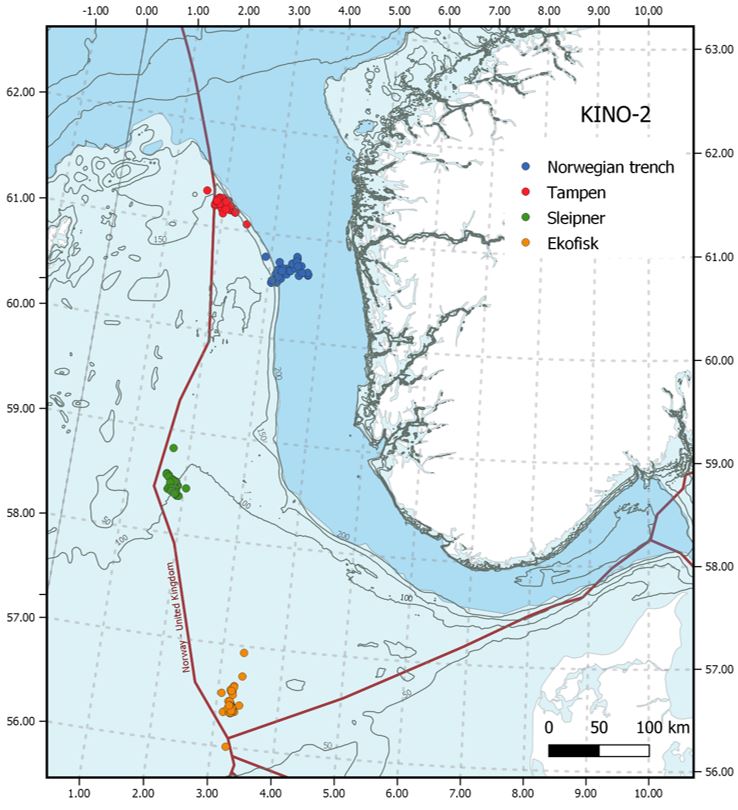
Figure 1. Map of the four different sampling sites: Ekofisk, Sleipner, Tampen and the Norwegian trench.
Sampling sites were located within 10 nautical miles (the preferred distance is 5 nautical miles) of four different locations along a south-north latitudinal axis in the North Sea (Figure 1); Ekofisk (the southernmost location), Sleipner (the middlemost location), Tampen and the Norwegian trench (the northernmost locations). The locations were selected due to: i) previous data availability for comparative purposes with the results from the former “KINO-1” project, and ii) their spatial importance for the oil industry activities.
Sample collection
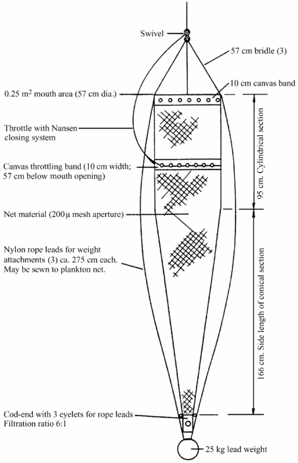
Samples have been collected by four different supply vessels managed by Equinor. Skandi Hugen collected samples at Ekofisk, Esvagt Bergen at Sleipner, Stril Herkules and Stril Merkur both at the locations Tampen and the Norwegian trench. The samples were scheduled to be collected once per week per sampling site using a double WP2 net with a mesh size of 500 µm and a mouth opening of 0.57m (0.25 m 2 ) (Figure 2). The double WP2’s was hauled two times on each site to increase the number of samples. Plankton sampling was performed by a vertical net-haul from 10 m above bottom at a wire speed of 0.5 m sec -1 to surface. The net configuration was chosen due to its ease of use and its resistance when used in relatively harsh weather conditions (Hassel et al., 2017). For shallow areas (Ekofisk and Sleipner) a CastAway CTD (Sontek, CA, USA) was attached to the net during each haul providing depth profiles of temperature and salinity. On more deeper areas (Tampen and Norwegian trench) a RBR concerto3 CTD was used during each haul for better coverage of data. In addition, all vessels were equipped with a Starmon TD logger (Star Oddi, Iceland) permanently attached between the double nets and continuously logging with an interval of 10 seconds.
Figure 2. Diagram of a WP2 net (from Gjøsæter et al., 2000).
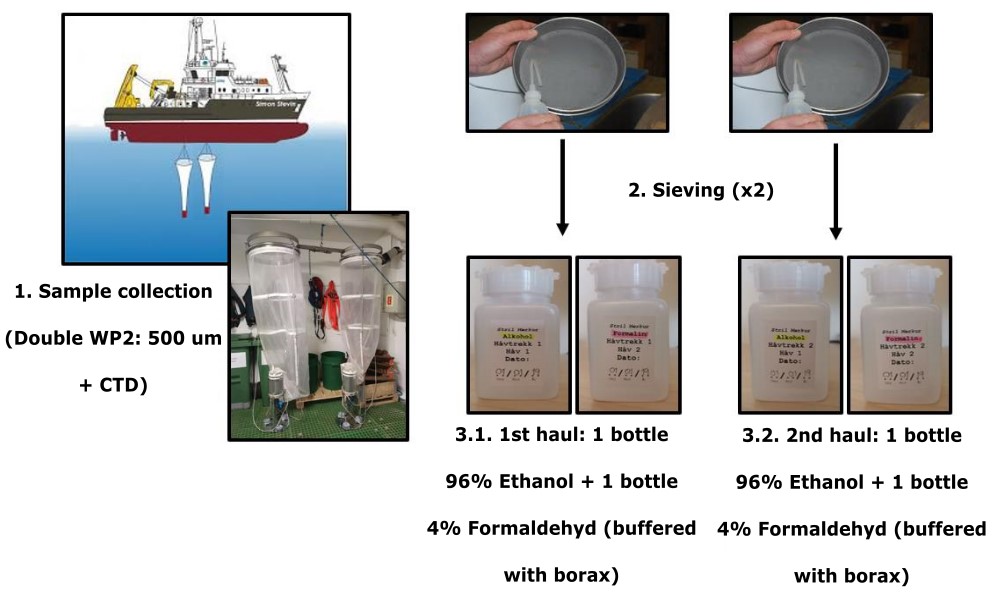
Samples from both hauls were sequentially poured from the cod-end through a 180 μ m meshed sieve and transferred into a 100 mL square plastic bottle (Figure 3) for fixation. In the first haul samples from one net was preserved in 96% ethanol for the molecular taxonomic analyses, whereas samples from the second net was preserved in seawater borax buffered 4% formalin concentration for on shore visual taxonomic identification (Figure 3). This same procedure was repeated for the second haul.
Figure 3. Diagram of the steps followed for sample collection.
Once in the laboratory, samples were poured into plankton counting chambers and the fish eggs and larvae were separated from visual inspections using a Leica M80 stereomicroscope with focusing arm ( Leica Microsystems, Germany ).
Visual taxonomic method
Fish eggs and larvae sorted from the samples preserved in seawater, borax buffered 4% formalin were identified to the lowest taxonomic level possible under binocular microscope following procedures described in previous studies (Russell 1976 and Munk 2005) . Larval morphometry (e.g. standard length) was measured using a Leica M80 stereomicroscope with focusing arm ( Leica Microsystems) using a millimeter paper.
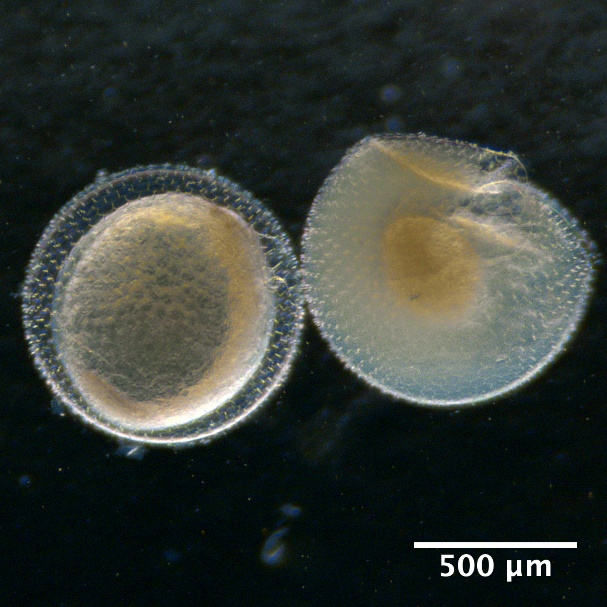
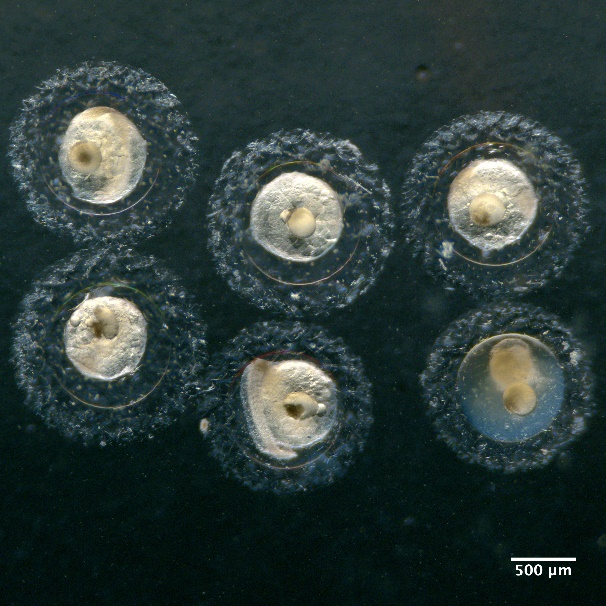
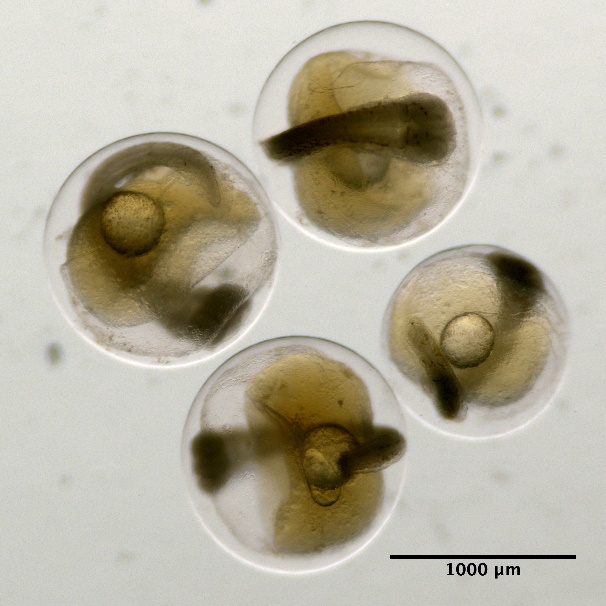
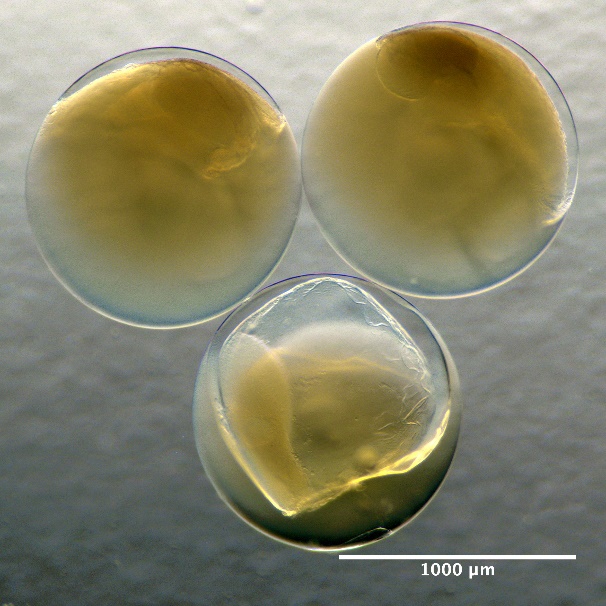
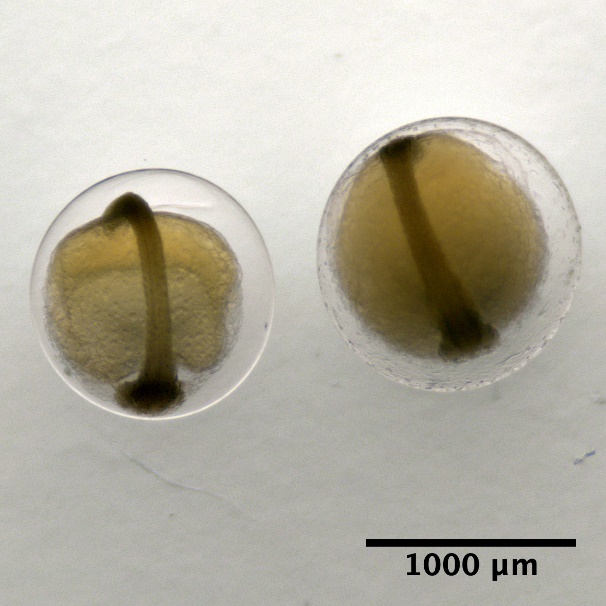
The eggs were photographed under an Olympus SZX16 stereomicroscope (Olympus, Japan) with a 0.4575 pixels µm -1 resolution and subsequently measured using the open source image analysis program Image J (https://imagej.nih.gov/ij/) with the plugin ObjectJ (https://sils.fnwi.uva.nl/bcb/objectj/) and the Cindy's Fish Eggs project (https://sils.fnwi.uva.nl/bcb/objectj/examples/CindysFisheggs/Manual-Cindy-6.htm ) (see Appendix).
Egg identification was performed following the parameters described in Russel (1976) and the two main categories described in Ahlstrom and Geoffrey (1980) . Briefly, eggs were classified according to: i) independent characters of the embryo (i.e. presence or absence of oil globules, egg size, egg shape, character of yolk, and width of the perivitelline space) and; ii) dependent characters of the embryo (mainly pigment patterns). Furthermore, egg staging was determined based on the criteria followed in previous studies (Thompson and Riley 1981 and Riley 1973).
Molecular taxonomic method
The eggs and larvae separated from the individual ethanol preserved samples were transferred collectively into a 24 mL scintillation bottle containing abundant pure ethanol (99%) and stored in the fridge at 4°C until further processing. For DNA isolation, single eggs or larval eyes were placed in individual wells of the 200 µL 96 well-plates (Axygen Scientific, CA, USA) containing 75 µL of a solution 5% Chelex 100 Resin (BioRad, CA, USA) and 15 µL of Proteinase K (Qiagen, Germany). The 96 well-plates were then incubated at 56°C for 1 h followed by 10 min at 96°C. After a brief centrifugation the supernatant containing the nucleic acids were transferred into new 96 well-plates.
Following DNA isolation, PCR amplification targeting the MT-CO1 gene was performed in 12 µL reactions containing 2.4 µL 5x buffer, 1 µL of MgCl 2 [25 mM], 1.92 µL dNTPs [1.25 mM], 1.44 µL 10 µM primer pair combination (Table 1), 0.07 µL GoTaq G2 DNA polymerase (Promega, WI, USA), 3.17 µL dH 2 O and 2 µL template DNA. The PCR conditions were i) an initial denaturation of 2 min at 95°C, followed by ii) 38 cycles of amplification (denaturation 30 s at 94°C, annealing at 52°C for 30 s and an extension of 1 min at 72°C), and iii) a final extension of 10 min at 72°C. Clean-up of the PCR products were performed mixing 5 µL of the PCR product and 2 µL ExoSap-IT PCR product Cleanup (ThermoFisher, MA, USA) followed by an incubation at 37°C for 15 min and 80°C for 15 min. Finally, sequencing was performed using 1 µL of M13F primer [0.35 µM] (Table 1) at the sequencing facility at the University of Bergen (http://www.seqlab.uib.no). Sequence analysis were performed in Geneious v8.0.5 (Kearse et al., 2012). To confirm sequence identity, they were used as queries for BLASTn (Altschul et al., 1990) against the NCBI database (http://www.ncbi.nlm.nih.gov/blast).
Table 1. List of primers used in the study.
Primer
Sequence
Amount added (µL)
Reference
LepF1_t1
TGTAAAACGACGGCCAGTATTCAACCAATCATAAAGATATTGG
0.12
Ivanova et al. (2007)
VF1_t1
TGTAAAACGACGGCCAGTTCTCAACCAACCACAAAGACATTGG
0.12
Ivanova et al. (2007)
VF1d_t1
TGTAAAACGACGGCCAGTTCTCAACCAACCACAARGAYATYGG
0.12
Ivanova et al. (2007)
VF1i_t1
TGTAAAACGACGGCCAGTTCTCAACCAACCAIAAIGAIATIGG
0.36
Ivanova et al. (2007)
LepRI_t1
CAGGAAACAGCTATGACTAAACTTCTGGATGTCCAAAAAATCA
0.12
Ivanova et al. (2007)
VR1d_t1
CAGGAAACAGCTATGACTAGACTTCTGGGTGGCCRAARAAYCA
0.12
Ivanova et al. (2007)
VR1_t1
CAGGAAACAGCTATGACTAGACTTCTGGGTGGCCAAAGAATCA
0.12
Ivanova et al. (2007)
VR1i_t1
CAGGAAACAGCTATGACTAGACTTCTGGGTGICCIAAIAAICA
0.36
Ivanova et al. (2007)
M13F (-21)
CAGGAAACAGCTATGAC
1
Messing (1983)
4 - Results
Since the beginning of the experiment in August 2017 until November 2019 a total of 201 samples have been collected at an irregular timing, especially at the beginning of the project (Figure 4). At Ekofisk, the southernmost location, a total of 59 different samples were collected. Although at Sleipner 50 samples were retrieved only the samples collected until September 2019 have been analysed. At the two southernmost location, Tampen and the Norwegian trench, only 63 and 29 samples were collected, respectively (Figure 4).
Figure 4. Distribution of the samples collected per week. Absence of colour indicates weeks where sampling was not conducted. The asterisk indicates samples collected more than once within the same week.
2017
August
September
October
November
December
Week number
31
32
33
34
35
36
37
38
39
40
41
42
43
44
45
46
47
48
49
50
51
52
Ekofisk
Sleipner
Tampen
*
NT
2018
January
February
March
April
May
June
Week number
1
2
3
4
5
6
7
8
9
10
11
12
13
14
15
16
17
18
19
20
21
22
23
24
25
26
Ekofisk
Sleipner
Tampen
*
NT
2018
July
August
September
October
November
December
Week number
27
28
29
30
31
32
33
34
35
36
37
38
39
40
41
42
43
44
45
46
47
48
49
50
51
52
Ekofisk
Sleipner
Tampen
NT
2019
January
February
March
April
May
June
Week number
1
2
3
4
5
6
7
8
9
10
11
12
13
14
15
16
17
18
19
20
21
22
23
24
25
26
Ekofisk
*
*
*
Sleipner
Tampen
*
NT
*
2019
July
August
September
October
November
December
Week number
27
28
29
30
31
32
33
34
35
36
37
38
39
40
41
42
43
44
45
46
47
48
49
50
51
52
Ekofisk
*
Sleipner
Tampen
*
NT
*
In total 5541 individuals have been analysed. 2746 (2228 eggs and 518 larvae) following the visual taxonomic approach and 2795 (2420 eggs and 375 larvae) for the molecular taxonomic approach. Overall altogether the individuals were assigned to 35 different species (Table 2).
Table 2. List of the species found in this study.
Latin name
Common name
Argentina silus
Greater argentine
Argentina sphyraena
Lesser argentine
Arnoglossus laterna
Scaldfish
Benthosema glaciale
Glacier lantern fish
Brosme brosme
Tusk
Callionymus lyra
Dragonet
Callionymus maculatus
Spotted dragonet
Crystallogobius linearis
Cristal goby
Enchelyopus cimbrius
Four-bearded rockling
Eutrigla gurnardus
Grey gurnard
Gadiculus argenteus
Silvery pout
Gadus morhua
Cod
Gaidropsaurus vulgaris
Three-bearded rockling
Glyptocephalus cynoglossus
Witch
Hippoglossoides platessoides
Long-rough dab
Lepidorhombus boscii
Four-spot megrim
Lepidorhombus whiffiagonis
Megrim
Limanda limanda
Dab
Maurolicus muelleri
Pearlside
Melanogrammus aeglefinus
Haddock
Merlangius merlangus
Whiting
Merluccius merluccius
European hake
Microstomus kitt
Lemon sole
Molva molva
Ling
Phrynorhombus norvegicus
Norwegian topknot
Pleuronectes platessa
Plaice
Pollachius pollachius
Pollack
Pollachius virens
Saithe
Scomber scombrus
Mackerel
Sebastes fasciatus
Acadian redfish
Sebastes viviparus
Norway redfish
Scophthalmus maximus
Turbot
Trachurus trachurus
Atlantic horse mackerel
Trisopterus esmarkii
Norway pout
Trisopterus minutus
Poor cod
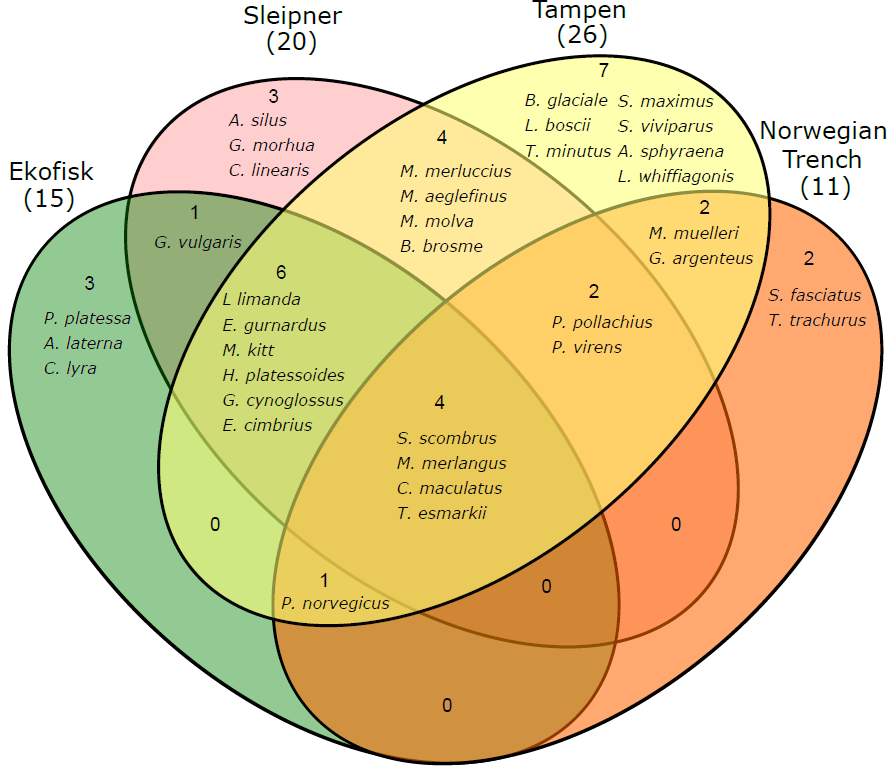
The majority of the species were found at Tampen with 26 including 7 species that were only detected at this location, Tampen was followed by Sleipner with 20 different species and three location specific species. At Ekofisk only 15 different species were found with also three species found just in this location and finally at the Norwegian trench only 11 different species were found, probably due to the lower number of samples collected at this location compared to the other sampling sites. However, there were two species found only at the Norwegian Trench. Furthermore, four species ( S. scombrus, M. merlangus, C. maculatus and T. esmarkii ) were detected in all four sampling sites (Figure 5).
Figure 5. List of species found in this study per sampling site.
4.1 - Visual taxonomic analyses
Within the visual taxonomic approach, for the 2746 individuals analysed, 854 individuals (727 eggs and 127 larvae) were found at Ekofisk. At Sleipner a total of 1017 individuals (856 eggs and 161 larvae) were retrieved, while 778 individuals (556 eggs and 222 larvae) were found at Tampen and 87 individuals (79 eggs and 8 larvae) at the Norwegian trench.
4.1.1. Fish larvae
Within the 518 larvae processed, 436 were assigned to 19 different species: Greater argentine ( Argentina silus), Silver fish ( Argentina sphyraena ), Crystal goby ( Crystallogobius linearis ), Four-bearded rockling ( Enchelyopus cimbrius ), Grey gurnard ( Eutrigla gurnardus ), Witch ( Glyptocephalus cynoglossus ), Long-rough dab ( Hippoglossoides platessoides ), Megrim ( Lepidorhombus whiffiagonis ), Dab ( Limanda limanda ), Haddock ( Melanogrammus aeglefinus ), Whiting ( Merlangius merlangus ), European hake ( Merluccius merluccius ) , Lemon sole ( Microstomus kitt ), Ling ( Molva molva ), Plaice ( Pleuronectes platessa) , Pollack ( Pollachius pollachius ) Saithe ( Pollachius virens ), Mackerel ( Scomber scombrus ) and Norway pout ( Trisopterus esmarkii ). 82 larvae were assigned to 9 families (as species identification was not possible due to damage in the larvae or difficulties in larval identification) and 1 overall general grouping named “flatfish”: Ammodytidae, Argentinidae, Callionymidae, Gadidae, Gobiidae, Phycidae, Pleuronectidae, Soleidae and Triglidae. Furthermore, taxonomic classification was not possible for 10 individuals which were assigned as Undetermined.
Overall, the most abundant species were the flatfish species Dab and Mackerel with 110 and 77 individuals, respectively (Table 3). Furthermore, the family Gobiidae were found at all four sampling locations, whereas the species L.limanda, M.merlangus, H.platessoides, M.kitt, P.pollachius, G.cynoglossus and the family Triglidae were all found in same three stations; Ekofisk, Sleipner and Tampen.
Table 3. All fish larvae identified using the visual taxonomic approach in this study.
Latin name
Ekofisk
Sleipner
Tampen
Norwegian Trench
Total
L. limanda
83
26
1
110
S. scombrus
54
23
77
T. esmarkii
6
45
51
M. merlangus
7
9
22
38
P. virens
30
4
34
Callionymidae
2
29
31
M. aeglefinus
18
6
24
H. platessoides
6
7
8
20
Gadidae
7
9
2
19
M. molva
1
14
15
M. merluccius
4
8
12
M. kitt
9
1
1
11
P. pollachius
1
8
2
11
Gobiidae
3
1
6
1
10
Undetermined
4
5
1
10
G. cynoglossus
1
5
1
7
Pleuronectidae
2
4
6
Triglidae
1
3
1
5
E. gurnardus
4
4
Phycidae
2
2
4
Flatfish
3
3
L. whiffiagonis
3
3
P. platessa
3
3
A. sphyraena
1
1
2
Soleidae
2
2
Ammodytidae
1
1
Argentinidae
1
1
A. silus
1
1
C. linearis
1
1
E. cimbrius
1
1
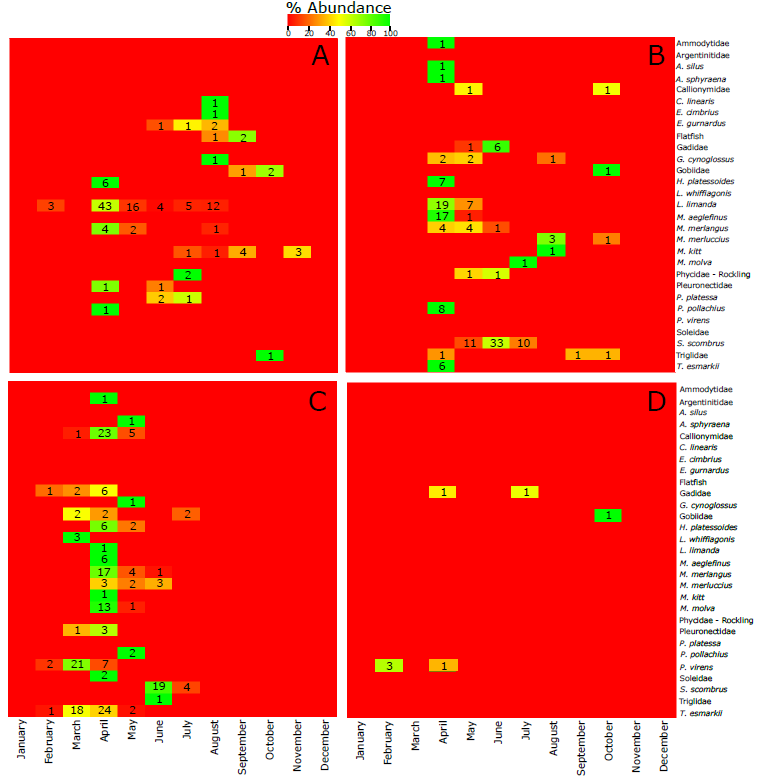
4.1.1.1. Ekofisk Although 10 different species were found at Ekofisk, it has the highest number of individuals of Dab ( L.limanda) with 83 individuals (Figure 6). Four species is only found at this location; Crystal goby ( C.linearis ), Four-bearded rockling ( E.cimbrius ), Grey gurnard ( E.gurnardus) and Plaice ( P.platessa) .
Figure 6. Heatmap showing the % of abundance of the larvae from different species per month. Absolute number of species retrieved each month is indicated within the boxes. A refers to Ekofisk, B to Sleipner, C to Tampen and D to Norwegian Trench.
4.1.1.2. Sleipner
The species Greater argentine ( A.silus) and the family Ammodytidae were only found at this location and was found first time in April 2019. The most abundant species is Mackerel ( S.scombrus ) with 54 individuals (Figure 6).
4.1.1.3. Tampen The highest number of larval species were found at Tampen with 14 different species. Megrim ( L.whiffiagonis) and the family Soleidae were only found at this location (Figure 6).
4.1.1.4. Norwegian trench The lowest number of larval individuals and species were found at the Norwegian trench with a total of 8 individuals and only half of these were determined to one species ( P.virens ). However, the total number of samples collected at this area is rather low compared to the other locations (Figure 6).
4.1.2 Fish eggs
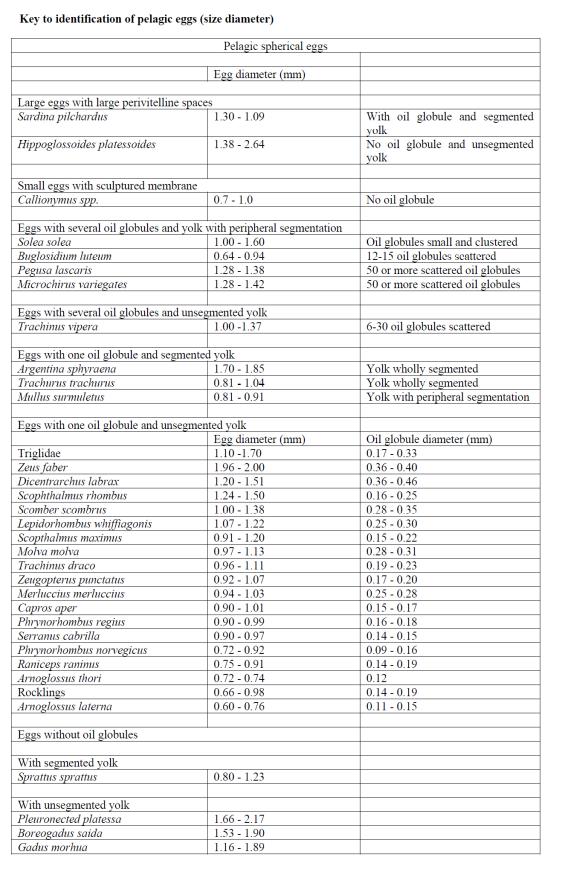
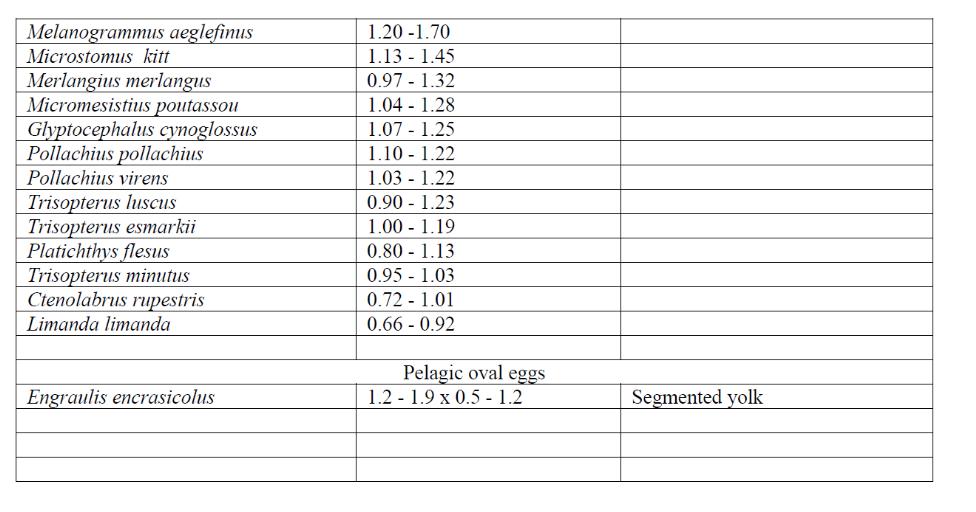
Only a few species have been determined to species with a high certainty. Therefore, to still get a sense of the distribution, the eggs were categorized in different groups following the parameters described in Russel (1976) and the two main categories described in Ahlstrom and Geoffrey (1980) (Table 4).
Table 4. Groups of the different eggs found in this study.
Group
Ekofisk
Sleipner
Tampen
Norwegian Trench
Total
Eggs without oil globules and unsegmented yolk
619
424
264
22
1329
Eggs with one oil globule and unsegmented yolk
58
345
100
16
518
Unknown
25
65
49
4
143
Eggs with one oil globule and segmented yolk - M.muelleri
1
49
36
86
Small eggs with sculptured membrane and no oil globule - Callionymidae
76
76
Large eggs with large perivitelline space - H.plattesoides
5
18
14
36
Eggs with one oil globule and unsegmented yolk - S.scombrus
7
7
Eggs with one oil globule and segmented yolk
1
1
Eggs with several oil globules and yolk with peripheral segmentation
Eggs with several oil globules and unsegmented yolk
Pelagic oval eggs
The species Long-rough dab ( H. platessoides ), Pearlside ( M. muelleri ), Mackerel (S. scombrus ), and the family Callionymidae have clear characteristics, and therefore the species identification based on the taxonomy criteria’s can be made with a high certainty. However, for gadoids and many other species the identification is difficult if all species are spawning in the same area and thus a grouping on a higher level is necessary.
The group with the highest number of eggs with a total of 1329 is the “eggs without oil globules and unsegmented yolk” with a high number on all locations; 619 eggs at Ekofisk, 424 eggs at Sleipner, 264 eggs at Tampen and 22 eggs at the Norwegian trench. This is a diverse group including many gadoid species such as Cod ( G. morhua ), Saithe (P.virens ) and other common species such as Dab ( L.limanda ). The same is also true for the group “eggs with one oil globule and unsegmented yolk”, which is diverse and include many common species such as Mackerel ( S.scombrus) and European hake ( M.merluccius ). This group have high numbers of eggs with a total of 518 and is also found in all locations; 345 eggs in Sleipner, 100 in Tampen, 58 in Ekofisk and 16 at the Norwegian trench.
Eggs of the family Callionymidae and the species Mackerel ( S. scombrus ) has only been found in the Tampen location. The species Pearlside ( M. muelleri) has been found in the northermost locations, Tampen and the Norwegian trench, with 49 and 16 eggs, while only 1 egg have been found in the Ekofisk location.
4.2 - Molecular taxonomic analyses
For the molecular taxonomic approach, the 2795 individuals were divided into 818 (732 eggs and 85 larvae) at Ekofisk, 1153 (1032 eggs and 121 larvae) at Sleipner, 731 (565 eggs and 166 larvae) at Tampen and 94 (91 eggs and 3 larvae) at the Norwegian Trench. The individuals analysed following the molecular method altogether were classified into 34 different species, meaning that all the species detected in this study except one, A. silus , were found using molecular barcoding (Table 5). Overall, the most abundant species were L. limanda , S. scombrus and M. merlangus with 880, 377 and 189 individuals respectively. Furthermore, 312 individuals (11% of the total) could not be assigned to any taxa.
Table 5. List of species found in this study per sampling site following the molecular taxonomic approach.
Latin name
Ekofisk
Sleipner
Tampen
Norwegian Trench
Total
Argentina sphyraena
10
10
Arnoglossus laterna
1
1
Benthosema glaciale
2
2
Brosme brosme
2
4
6
Callionymus lyra
1
1
Callionymus maculatus
2
2
78
6
88
Crystallogobius linearis
1
1
Enchelyopus cimbrius
3
39
4
46
Eutrigla gurnardus
35
54
11
100
Gadiculus argenteus
1
8
9
Gadus morhua
17
17
Gaidropsaurus vulgaris
2
2
4
Glyptocephalus cynoglossus
9
26
5
40
Hippoglossoides platessoides
19
40
27
86
Lepidorhombus boscii
2
2
Lepidorhombus whiffiagonis
9
9
Limanda limanda
615
263
2
880
Maurolicus muelleri
102
35
137
Melanogrammus aeglefinus
27
21
48
Merlangius merlangus
24
89
73
3
189
Merluccius merluccius
67
8
75
Microstomus kitt
27
12
9
48
Molva molva
9
93
102
Phrynorhombus norvegicus
7
5
1
13
Pleuronectes platessa
3
3
Pollachius pollachius
2
10
1
13
Pollachius virens
1
76
6
83
Scomber scombrus
43
237
71
26
377
Sebastes fasciatus
1
1
Sebastes viviparus
2
2
Scophthalmus maximus
1
1
Trachurus trachurus
1
1
Trisopterus esmarkii
1
9
65
4
79
Trisopterus minutus
9
9
4.2.1. Fish eggs
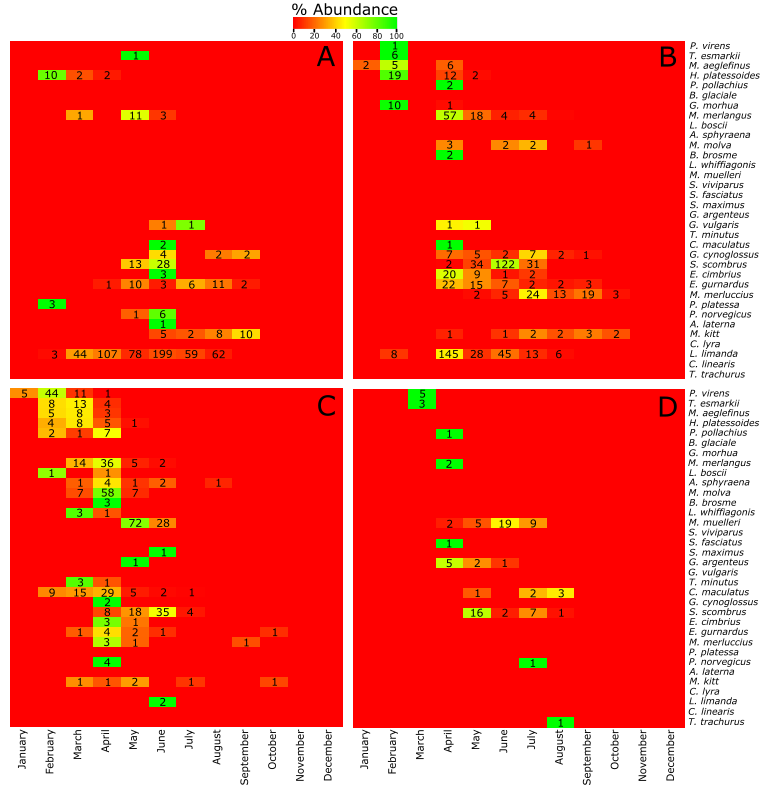
4.2.1.1. Ekofisk Within the samples collected at Ekofisk there was a high dominance of L. limanda (Table 5). More than 75% of the individuals retrieved at this location were members of this genus which showed a spawning period between February and August with a spawning peak between March and April (Figure 7). Although at Ekofisk no samples from January have been collected, H. platessoides and P. platessa showed a spawining peak at the beginning of the year in February. However, most of the species found at this sampling site, including S. scombrus , E. gurnardus and G. cynoglossus , had a spawning peak in June. Finally, after summer, in September it was observed a spawning peak for M. kitt . In addition, none of the species have been observed to spawn at the end of the year from October to December (Figure 7).
Figure 7. Heatmap showing the % of abundance of the eggs from different species per month. Absolute number of species retrieved each month is indicated within the boxes. A refers to Ekofisk, B to Sleipner, C to Tampen and D to Norwegian Trench.
4.2.1.2. Sleipner At Sleipner within the 19 different species found at this location there were two species that were shared the dominance, L. limanda and S. scombrus with 263 and 237 individuals, respectively (representing around 45% of the total number of individuals; Table 5). L. limanda showed the same pattern as in the previous location with a spawning period between February and August and a spawning peak in April, while the spawning peak of S. scombrus was narrower, between April and July with a peak in June (Figure 7). At Sleipner, there was more variation in the spawning peaks of the different species compared to Ekofisk, where they were mainly spawning in June. T. esmarkii , M. aeglefinus , H. platessoides and G. morhua showed a spawning peak at the beginning of the year in February. They were followed by M. merlangus , E. cimbrius , E. gurnardus among others with a spawning peak between April and May, and G. cynoglossus , M. merluccius and M. kitt later from July to September (Figure 7). As in Ekofisk it was observed that none of the species spawned at the end of the year in November and December. In addition, at Sleipner no samples were collected in March (Figure 7).
4.2.1.3. Tampen At Tampen, despite the highest number of different species found at this location (26) the spawning pattern was very different compared to the two previous locations. Here, although M. muelleri and M. molva were slightly more abundant than the other species, there was not a clear dominance (Table 5). Furthermore, the spawning periods of the different species were very narrow with almost no spawning after July (Figure 7). The first species to spawn was P. virens with a spawning peak in February, followed by T. esmarkii , M. aeglefinus , H. platessoides and L. whiffiagonis with a spawning peak in March. Several species had a spawning peak in April, among them P. pollachius , M. molva and C. maculatus . Finally, M. muelleri and S. scombrus showed a spawining peak in May and June, respectively (Figure 7).
4.2.1.4. Norwegian Trench At the last sampling site, the Norwegian Trench, the spawning period of the different fish species were also very narrow but in this case the reason could be due to the fewer amount of samples collected (around half than the other three sampling sites). In addition, no samples from the Norwegian Trench were collected in January and February. At this location there was a dominance of M. muelleri and S . scombrus with 35 and 26 individuals (65% of the individuals), respectively (Table 5).
The spawning results at this location should be treated carefully due to the limited number of individuals. It was observed that P. virens and T. esmarkii spawned in March, and a spawning peak of S. scombrus , M. muelleri and C. maculatus in May, June and August, respectively (Figure 7).
4.2.2. Fish larvae
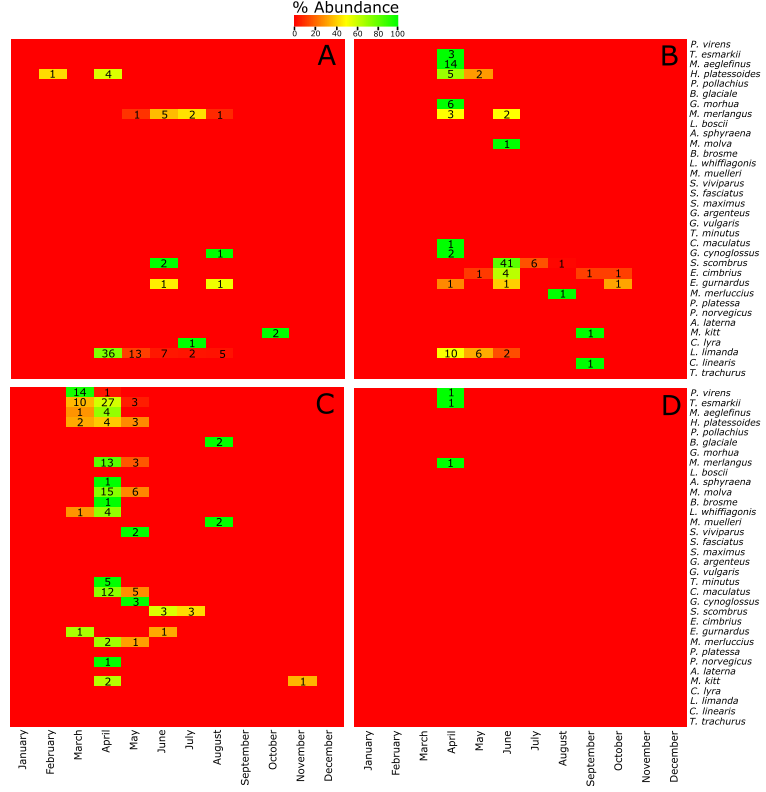
Although the pattern followed by the eggs was used for the results about the spawning periods and peaks described above, the pattern followed by the larvae was in agreement with the eggs. However, it was less accurate due to the lower number of larvae compared to the eggs. The main difference was the presence of B. glaciale, S. viviparus, C. linearis and C. lyra that were not found in the eggs. At Ekofisk there was a dominance of L. limanda with a peak in the larvae in April. At Sleipner, just taking into account the larvae found, S. scombrus was more dominant than L. limanda , with the same spawning peaks as the eggs in June and April, respectively. At Tampen, almost all the species showed a spawning period between March and May. Moreover, at this location a M. kitt larvae was found in November. Finally, only 3 larvae assigned to P. virens, T. esmarkii , and M. merlangus collected in April were found at the Norwegian Trench (Figure 8).
Figure 8 . Heatmap showing the % of abundance of the eggs from different species per month. Absolute number of species retrieved each month is indicated within the boxes. A refers to Ekofisk, B to Sleipner, C to Tampen and D to Norwegian Trench.
5 - Discussion
The use of the two different approaches for ichthyoplankton identification allowed for inter-comparisons of their applicability. Overall, it was observed that the use of the molecular taxonomic method allowed for reaching a more detailed taxonomic level vs. the visual taxonomic method. Although using the visual taxonomic method 82% of the larvae were assigned to species level and 16% to family level, we have encountered difficulties to assign the eggs to species level using the visual taxonomic method. Several of the classifying parameters, such as egg size or presence and number of oil globules overlaps between different species or even families (Markle et al., 1984). Furthermore, some of the embryonic characters, such as pigmentations on the embryo, are only applicable in late stages of the egg development. Therefore, only the eggs of H. platessoides, M. muelleri, S. scombrus and the family Callionymidae could be identified. On the other hand, using the molecular taxonomic approach 89% of the individuals were assigned to species level. However, most of the individuals present in the samples from June 2018 at Ekofisk could not be assigned to any species. Since this was an isolated event at the same time and location where the samples were taken by the same boat, it could be reasonable to think that some issues could have happened during the sample handling. When removing these results 98% of the larvae and 94% of the eggs were assigned to species level. Even though molecular barcoding is more effective and precise in taxonomic identification of both eggs and larvae to species level, only the visual method could provide information about the ichthyoplankton developmental stages.
Overall, based on the material collected during the beginning of the experiment, 35 species have been identified spawning in the North Sea system, that means 13 more species that the last years report. In addition, we have added one more sampling site, the Norwegian Trench. Generally, it was observed that the spawning patterns at the southernmost locations, Ekofisk and Sleipner, was broader than the northernmost locations, Tampen and the Norwegian Trench, but it needs to be kept in mind that fewer samples have been collected at the latter sampling site. The reason for the difference in the spawning patterns could be due to the shorter duration in the northern subregion compared to the central subregion of the North Sea. Towards lower latitudes, in regions with less extreme seasonal cycles for the all-important zooplankton, winter production of zooplankton is high enough to sustain herbivorous feeding throughout the year, and therefore, the spawning period for all fish species are prolonged. Interestingly, in none of the sampling sites individuals were retrieved at the end of the year between November and December, with the exception of a single M. kitt larva collected in November at Tampen.
The high frequency sampling of the eggs found at the northern and central subregions of the North Sea performed in this study allowed us to determine with high precision the spawning periods of different fish species at these locations. For some of the species we can have a good idea about the spawning patterns at the different locations across the year. That is the case of dab (L. limanda) with a spawning time between February and August and a peak in March/April. These results are in good concordance with dab being one of the most dominant flatfish species in the North Sea (Daan et al., 1990). Interestingly, dab was almost absent in the northern subregion of the North Sea, only two eggs were found at Tampen, probably due to the negative correlation between early stages of dab and seawater temperature, as reported previously (Henderson 1998). Mackerel (S. scombrus ) was the second most abundant species in our dataset, the short spawning period between April and August, with a spawning peak in June, correlates well with the higher affinity of mackerel with warmer waters for reproduction and feeding (Jansen and Gislason 2011; Jansen et al., 2012). Mackerel was followed in abundance by whiting (M. merlangus ) that although it showed a spawning peak in April along the three locations the spawning period varied from March to May at Tampen, and from April to August at Sleipner. Whiting starts the spawning period during January in the English Channel, in the North Sea the spawning period ranges from March to July (Hislop et al., 2015).
Other species with lower abundances were the grey gurnard (E. gurnardus) which increases in spawning period from four months at Tampen, to six months in the south at Ekofisk. The Grey gurnard had different spawning peaks along the different regions of the North Sea as it varied from April in the north to July in the south, probably due to their preference for higher water temperatures (Daan et al., 1990). Saithe (P. virens) which is one of the most abundant species at Tampen, it was not present in the southernmost location, Ekofisk. The long-rough dab (H. platessoides) showed a similar spawning period and peak across the different sampling sites in agreement with previous studies (Goldsmith et al., 2015).
For some of the species the number of individuals is very poor, of the 35 species for 20 of them we have found less than 20 individuals (taking into account eggs and larvae). Although this is not something unexpected, data about these species needs to be treated carefully as a larger number of individuals are required for a more realistic determination of their spawning periods and peaks. In addition, the collection of more eggs and larvae at the Norwegian Trench is needed before drawing any conclusions about the spawning time of the fish species at this location.
6 - Challenges and Improvements
As demonstrated in the results section, there are several weaknesses in the database mainly due to time gaps and dislocation of sampling positions. It is important to be at the right place at the right time. From research standpoint, it is essential that the sampling is done as evenly as possible, that the samples are treated equally, and that the method is the same, even though different personnel perform the task. A similar method of sampling allows us to reduce the possibility of variations in the results.
Samples must be taken regularly and every week as agreed. This allows us to assess the annual development of eggs and larvae. If there are gaps in the time series, the statistical basis will be too weak to say anything about developments during the year or between years - i.e. the advice for timing seismic surveys becomes uncertain and consequently conservative. The areas to be sampled are selected based on various criteria. We lose the comparative value when samples are taken at different locations throughout the year – again the advice becomes uncertain and consequently conservative.
We have kept our industry partners informed about these conditions on an ongoing basis. To improve the methodology, we have held refresher courses for crew in sampling procedures by visiting the vessels and explained the importance of following the sampling protocol. We have improved and simplified the description of the sampling procedures as well as simplified reporting forms. Also, the labeling of the sample containers are now prefilled to reduce chances of making mistakes. These actions will hopefully help to minimize the possibility of sampling errors and provide better quality of the samples.
It must also be mentioned that the industry has introduced a very effective sampling reward system onboard the vessels, and we can observe that the samples have been taken more systematically than before.
Other actions taken; a new vessel, the “Stril Merkur”, was equipped with sampling gear, to fill in for Stril Herkules to increase sampling success at the Tampen station which has not been sampled sufficiently well due to several logistical, technical and meteorological issues.
To substitute the traditional splitting (using a “Motoda-plankton splitter”) of samples we initiated the use of a double WP2 net on all vessels during the summer of 2019, instead of the single WP2 net, as outlined in the annual report from 2018. This net-configuration will also increase the amount of eggs and larvae obtained per haul and most importantly; increase the accuracy for statistical comparative analyses of the results from the two taxonomic identification techniques. Additionally, each net has a depth sensor (Starmon TD logger) attached to it- programmed to log automatically for more than 12 months.
We have also experienced issues with the CTD data recordings; most are either data-empty or just contain one measurement point during the depth profile. The reason for these missing data must be due to deviations from the sampling procedure, as the CTD unit needs to receive proper satellite fix which takes several minutes after it has been switched on before deployment into water, it also needs to stay in the surface waters for some minutes before the descend. Two new CTDs (RBR concerto3 ) was purchased and equipped to the net frames used at Tampen, these are switched on automatically when in contact with saltwater. The use of these sensors has proven to be successful and we will now purchase and equip all vessels with these new automated CTDs.
Regular surveys are also conducted by IMR visiting the areas near Ekofisk, Sleipner and Tampen and these will give us the opportunity to include data collected during these surveys to optimize the dataset and results. We are currently coordinating such efforts with the responsible IMR personnel.
7 - Future Perspectives
During this study period so far, we have gained a great deal of experience, both on the analysis side but also in order to carry out the collection of raw data in an efficient and representative way.
Laboratory analyses are robust and of the highest quality. We are also investigating the possibility of developing and improving the methods, both with our own experimentation, but also by keeping ourselves informed with the professional society.
We are confident that the data collection method now starts to become manageable for non-professional technical personnel after some training. The equipment should need little maintenance and appears to be user friendly. With motivated crew on the supply vessels, this would serve as an excellent base as research platform for this purpose, also in the future.
The environmental conditions in the North Sea have changed significantly over the past 50 years. Future predictions demonstrate that this process will escalate over the next coming years. The effects that this will pose on reproductive success for different species and their distribution is highly uncertain.
In this study, we describe the current spawning patterns for fish species representing the period in and between 2017-2020. The North Sea system is as mentioned, highly dynamic and enters an uncertain future prospective. In order of ensuring that future advice for timing of seismic surveys will be carried out in a most considerate way, we strongly recommend planning of a continuation of the collection and analyses of material even after the determination of the KINO 2 project, in December 2020!
8 - Publications
International peer reviewed journals
Mateos-Rivera A, Skern-Mauritzen R, Dahle G, Sundby S, Mozfar B, Thorsen A, Wehde H, Krafft BA. 2019. Comparison of visual and molecular taxonomic methods to identify ichttyoplankton in the North Sea. Submitted to Limnology and Oceanography methods
Dahle G, Mateos-Rivera A, Mozfar B, Skern-Mauritzen R, Thorsen A, Sundby S, Wehde H, Isari S, Krafft BA. Determining temporal spawning patterns of fish species in the Northern and Central subregions of the North Sea – molecular species identification of egg samples. Submitted Marine Ecology Progress Series
Articles & Reports
Mateos-Rivera A, Mozfar B, Skern R, Dahle G, Wehde H, Kleppe L, Sundby S, Thorsen A, Breistein B, Asplin l, Ezequiel G, Isari S and Krafft B. 2019. Mapping of fish spawning in the North Sea. Report of the KINO-2 project for 2018. Rapport fra Havforskningen 2019-2. 80 pp.
International conference presentations
Mateos-Rivera A, Mozfar B, Skern-Mauritzen R, Dahle G, Thorsen A, Sundby S, Glover K, Kleppe L, Wehde H, Krafft BA (2018) Assessment of the spawning time for the major North Sea fish stocks. ICES Working Group on Atlantic Larvae and Egg Survey (WGALES) - Technical University of Denmark, Copenhagen, October 2018.
Mateos-Rivera A, Mozfar B, Skern-Mauritzen R, Dahle G, Thorsen A, Sundby S, Glover K, Kleppe L, Wehde H, Krafft BA (2018) Assessment of the spawning time for the major North Sea fish stocks. Northern North Sea Planktonic Ecosystem Working Group (NNSPEWG). Institute of Marine Research, Bergen, October 2018.
Mateos-Rivera A, Mozfar B, Skern-Mauritzen R, Dahle G, Thorsen A, Sundby S, Glover K, Wehde H, Krafft BA. (2019). Determining spawning in the North Sea using visual and molecular taxonomic methods. 43 rd Larval Fish conference, Palma de Mallorca (Spain)
9 - Acknowledgements
The KINO-2 project is financed by Equinor Energy AS, Conoco Philips Scandinavia AS and Aker BP ASA. We thank all vessel crew and personnel involved in data collection and logistics.
10 - References
Ahlstrom H, Geoffrey H (1980) Characters useful in identification of pelagic marine fish eggs. CalCOFI Rep. XXI.
Altschul SF, Gish W, Miller W, Myers EW, Lipman DJ (1990) Basic local alignment search tool. Journal of Molecular Biology215 : 403-410.
Daan N, Bromley P, Hislop J, Nielsen N (1990) Ecology of North Sea fish. Netherlands Journal of Sea Research26 : 343-386.
Gjøsæter H, Dalpadado P, Hassel A, Skjoldal HR (2000) A comparison of performance of WP2 and MOCNESS. Journal of Plankton Research 22 : 1901-1908.
Goldsmith D, Rijnsdorp A, Vitale F, Heessen H (2015) Long rough dab – Hippoglossoides platessoides Fabricius, 1780. In: H.J.L. Heessen, N. Daan, and J.R. Ellis, editors. Fish Atlas of the Celtic Sea, North Sea, and Baltic Sea. Pp. 454-456. Wageningen Academic Publishers and KNNV Publishing, Wageningen, Netherlands (572 pp). ISBN: 97890-8686-266-5.
Hassel A, Endresen B, Martinussen MB, Knutsen T, Johanessen ME (2017) Håndbok for plankton. Prøvetaking og analyse. Havforskningsinstituttet.
Henderson PA (1998) On variation in the dab, Limanda limanda , recruitment: a zoogeographic study. J. Sea Res.40 : 131-142.
Hislop J, Bergstad OA, Jakobsen T, Sparholt H, Blasdale WP, Kloppmann M, Hillgruber N, Heessen H (2015) Whiting – Merlangius merlangus Linnaeus, 1758. In: H.J.L. Heessen, N. Daan, and J.R. Ellis, editors. Fish Atlas of the Celtic Sea, North Sea, and Baltic Sea. Pp. 198-201. Wageningen Academic Publishers and KNNV Publishing, Wageningen, Netherlands (572 pp). ISBN: 978-90-8686-266-5.
Ivanova NV, Zemlak TS, Hanner RH, Hebert PDN (2007) Universal primer cocktails for fish DNA barcoding. Molecular Ecology Notes7 : 544-548.
Jansen T, Campbell A, Kelly CJ, Hátún H, Payne M (2012) Temperature migration and fisheries of North East Atlantic mackerel ( Scomber scombrus ) in autumn and winter. PLOS One7 : e51541.
Jansen T, Gislason H (2011) Temperature affects the timing of spawning and migration of North Sea mackerel. Cont Shelf Res31 : 64-72.
Kearse M, Moir R, Wilson A, Stones-Havas S, Cheung M, Sturrock S, et al . (2012) Geneious Basic: an integrated and extendable desktop software platform for the organization and analysis of sequence data. Bioinformatics28 : 1647-1649.
Lelievre S, Vaz S, Martin CS, Loots C (2014) Delineating recurrent fish spawning habitats in the North Sea. Journal of Sea Research91 : 1-14.
Lelievre S, Verrez-Bagins V, Jerome M, Vaz S (2010) PCR-RFLP analyses of formalin-fixed fish eggs for the mapping of spawning areas in the Eastern Channel and Southern North Sea. Journal of Plankton Research 32 : 1527-1539.
Markle DF, Frost LA (1985) Comparative morphology seasonality, and a key to planktonic fish eggs from the Nova Scotian shelf . Canadian Journal of Zoology63 : 246-257.
Messing J (1983) New M13 vectors for cloning. Methods in Enzymology101 : 20-78.
Munk PN, Jørgen G (2005) Eggs and larvae of North Sea fishes. Frederiksberg, Denmark biofolia.
Russell FS (1976) The eggs and planktonic stages of British marine fishes. London Academic Press.
Sundby S, Kristiansen T, Nash RDM, Johannessen T (2017) Dynamic Mapping of North Sea Spawning: report of the “KINO” project. Fisken og Havet2 : 183.
Thompson BM, Riley JD (1981) Egg and larval development studies in the North Sea cod ( Gadus morhua L.). Rapports et Procès-verbaux des Réunions Conseil International pour l'Exploration de la Mer 178 : 553-559
11 - Appendix
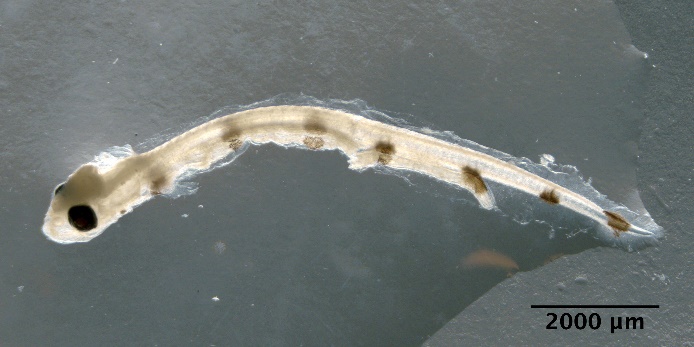
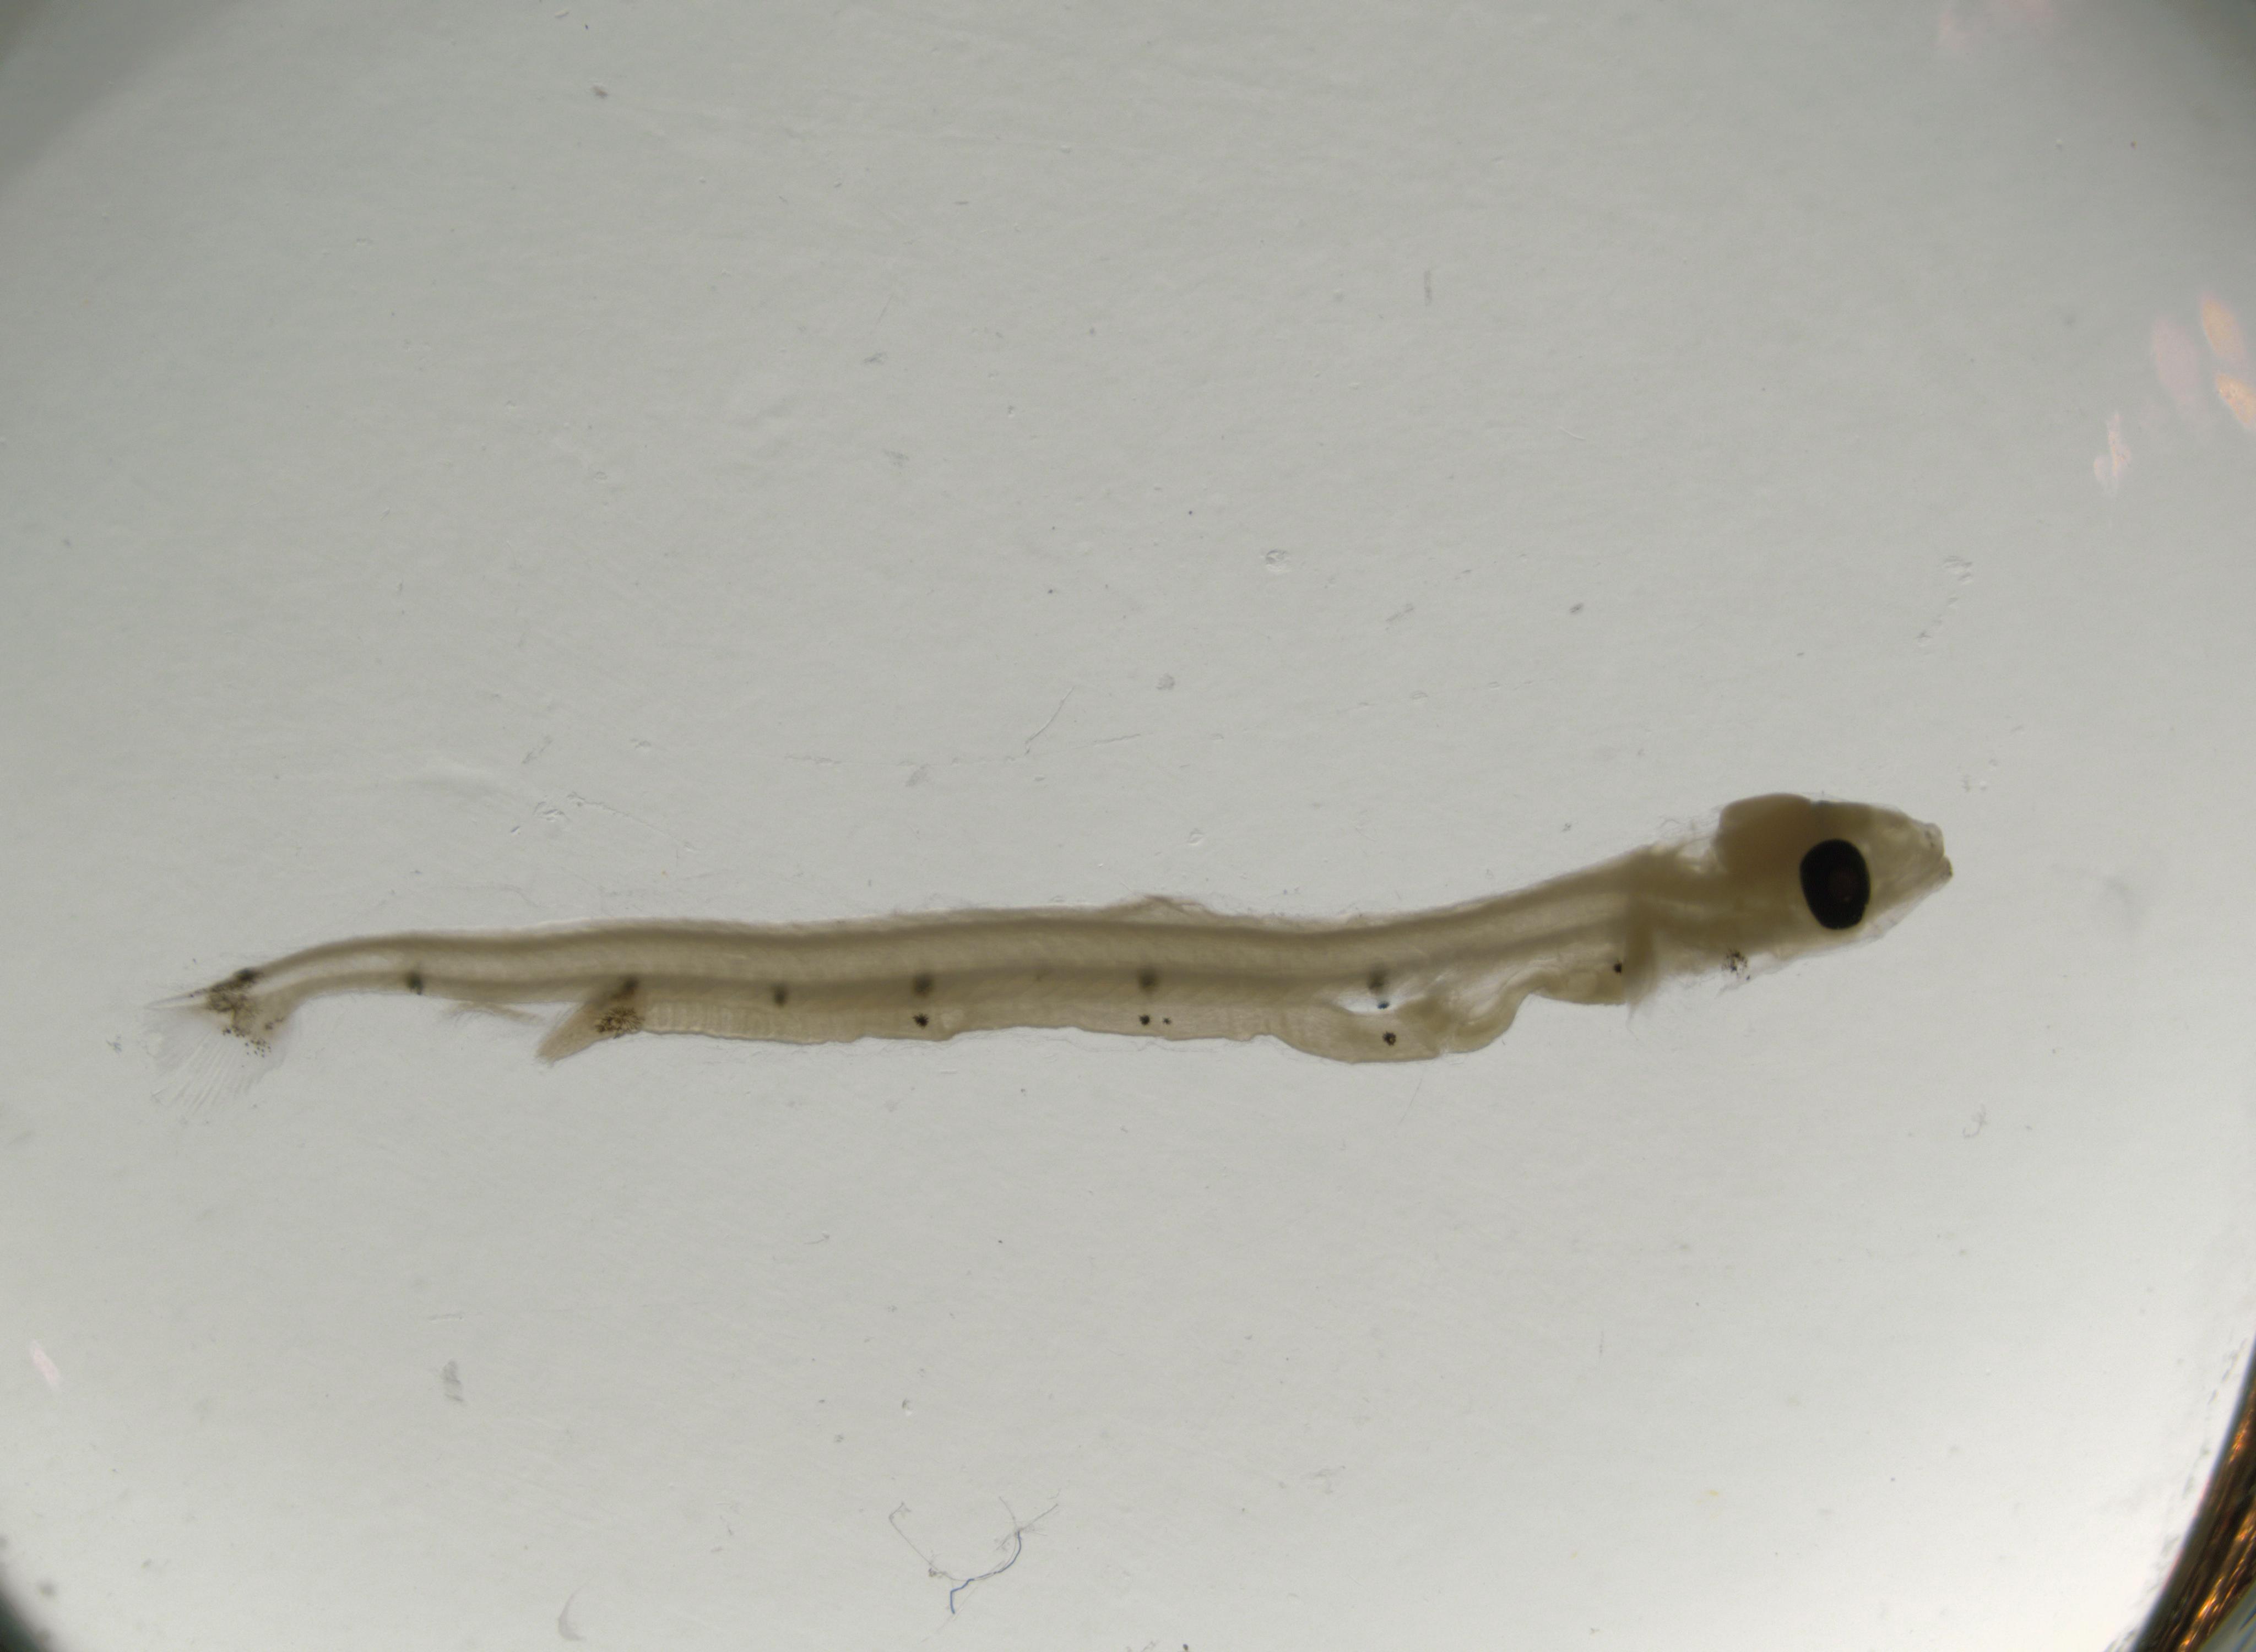
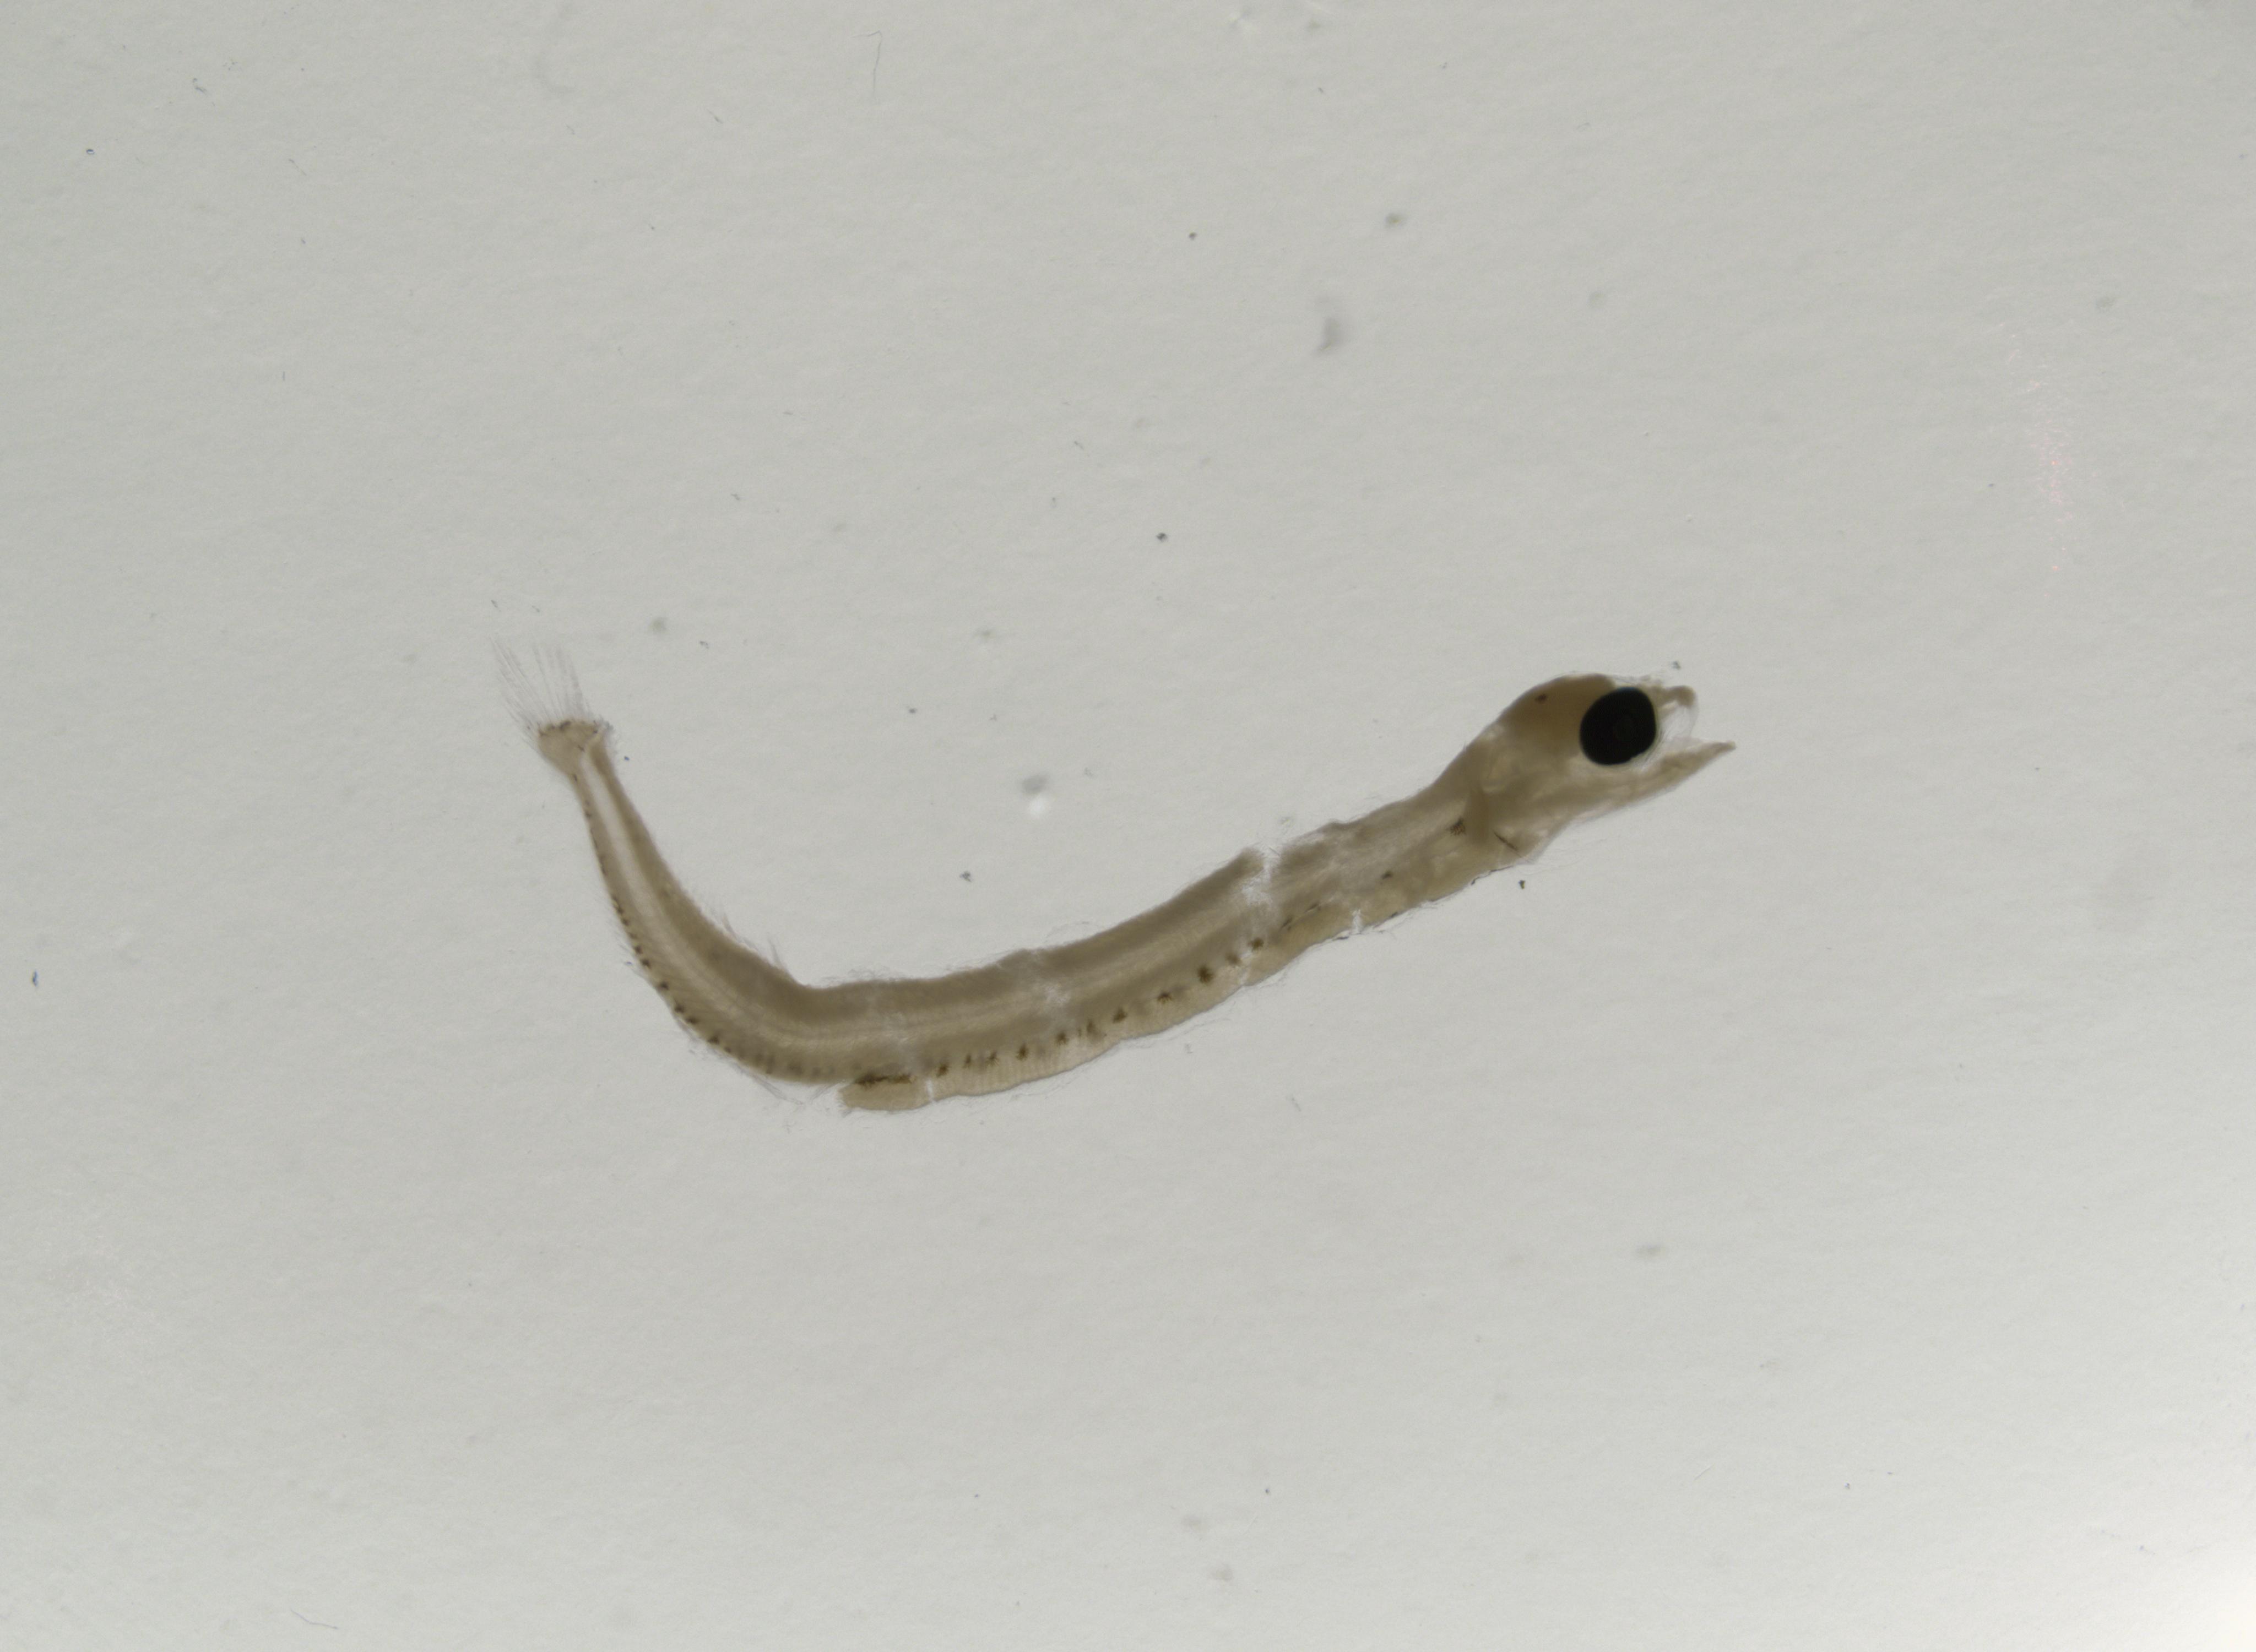
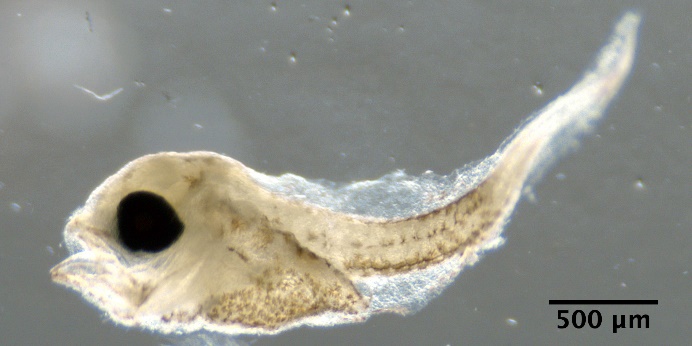
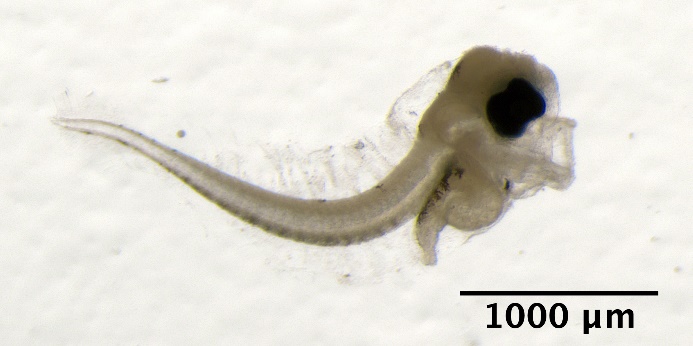
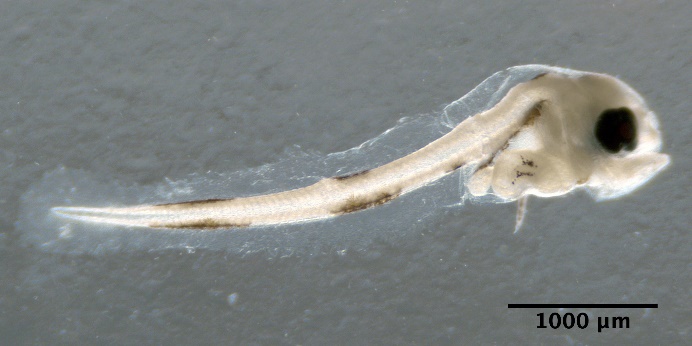
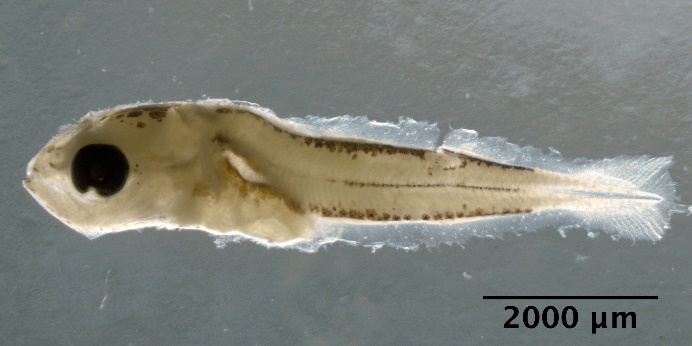
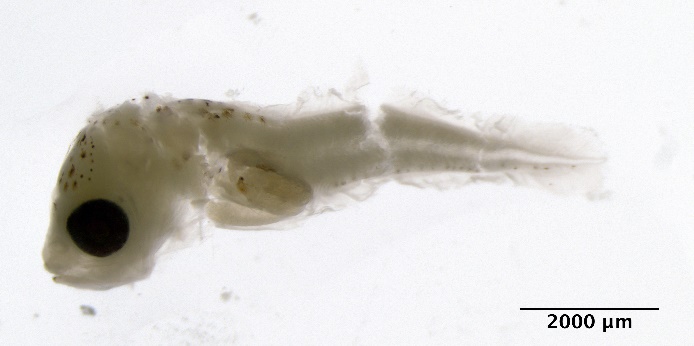
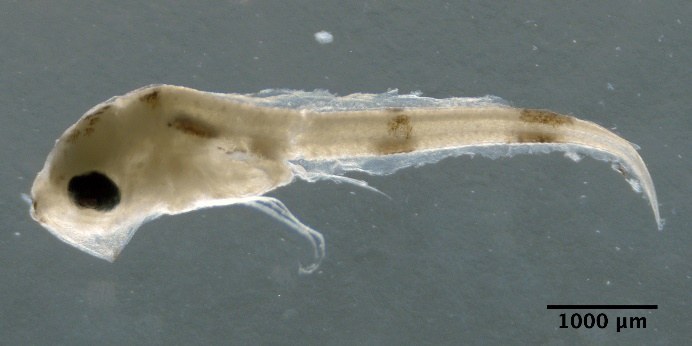
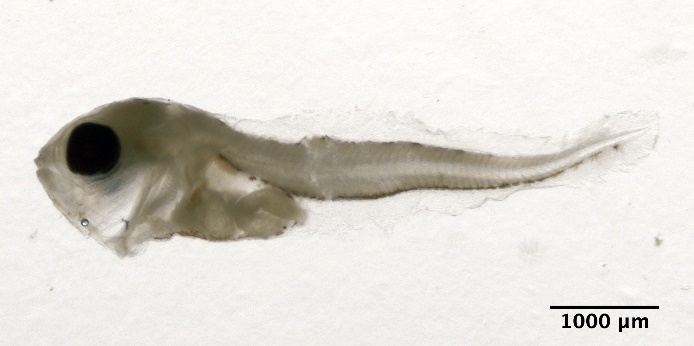
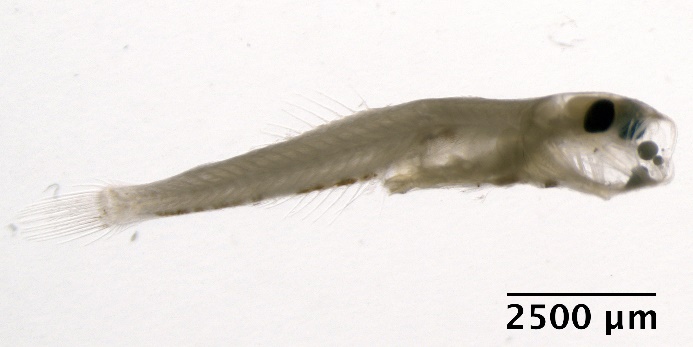
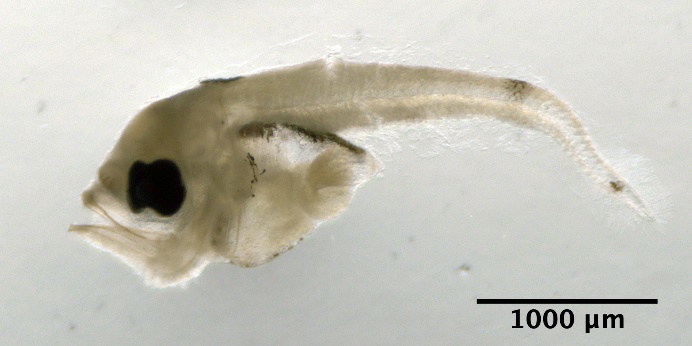
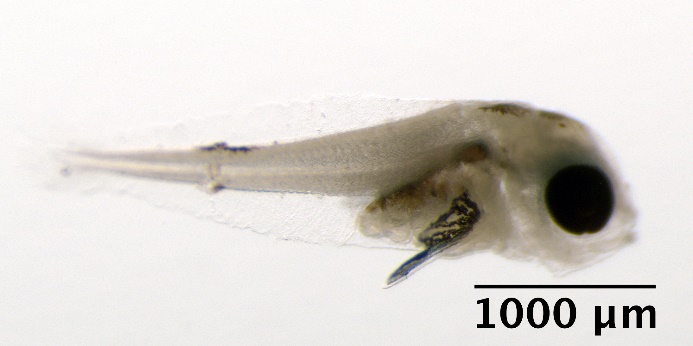
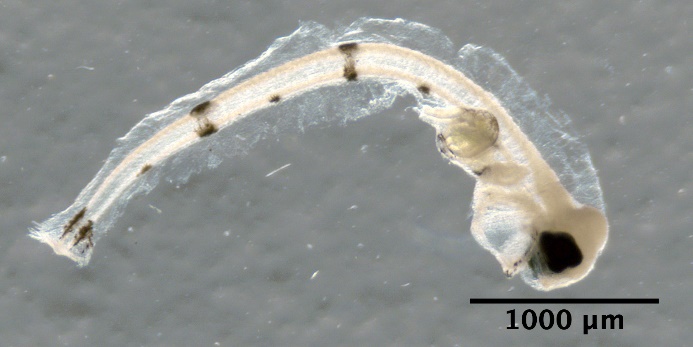
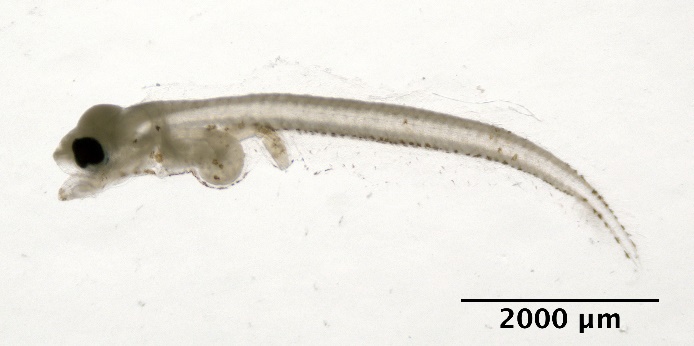
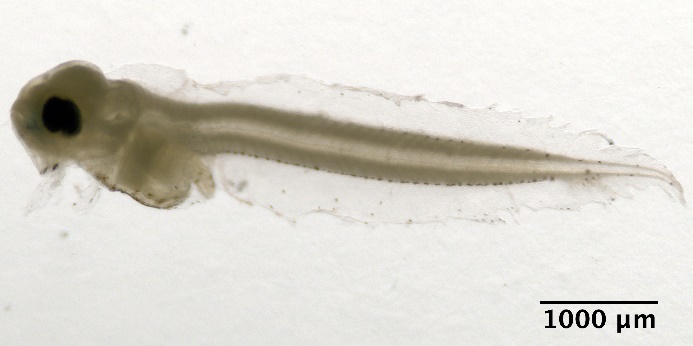
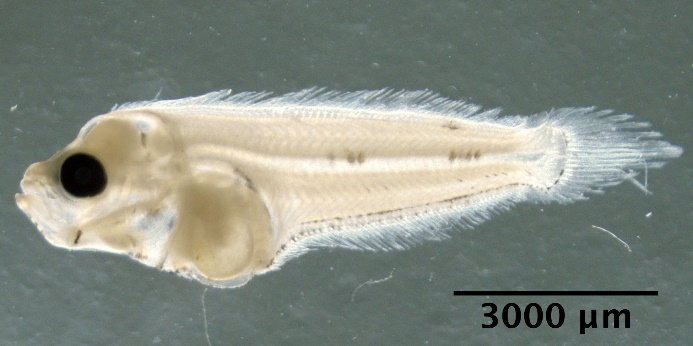
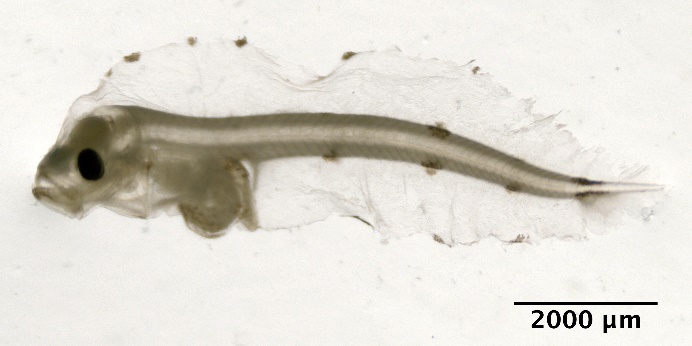
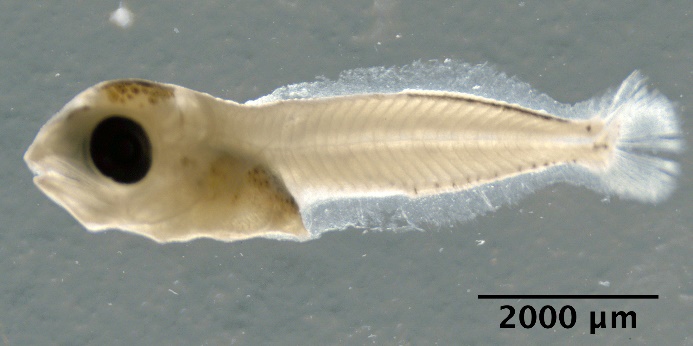
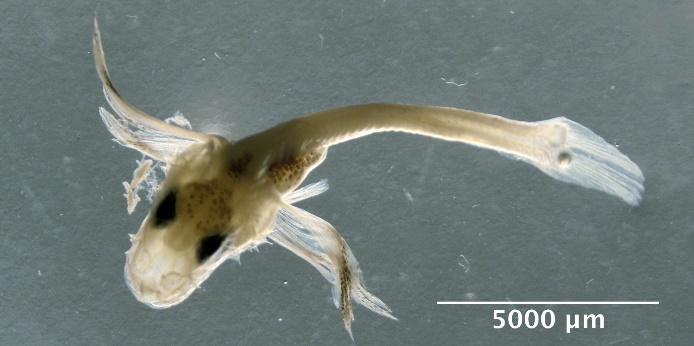
Illustrations of fish larvae identified from using visual taxonomic method:
Argentinidae:
Argentina sphyraena
Argentina silus
Ammodytidae:
Callionymidae:
Gadidae:
Trisopterus esmarkii
Pollachius virens
Pollachius pollachius
Melanogrammus aeglefinusMerlangius merlangus
Molva molva
Gobiidae:
Crystallogobius linearis
Merluccidae:
Merluccius merluccius
Phycidae:
Enchelyopus cimbrius
Pleuronectidae:
Glyptocephalus cynoglossus
Hippoglossoides platessoides
Limanda limanda
Microstomus kitt
Scombridae:
Scomber scombrus
Triglidae:
Eutrigla gurnardus
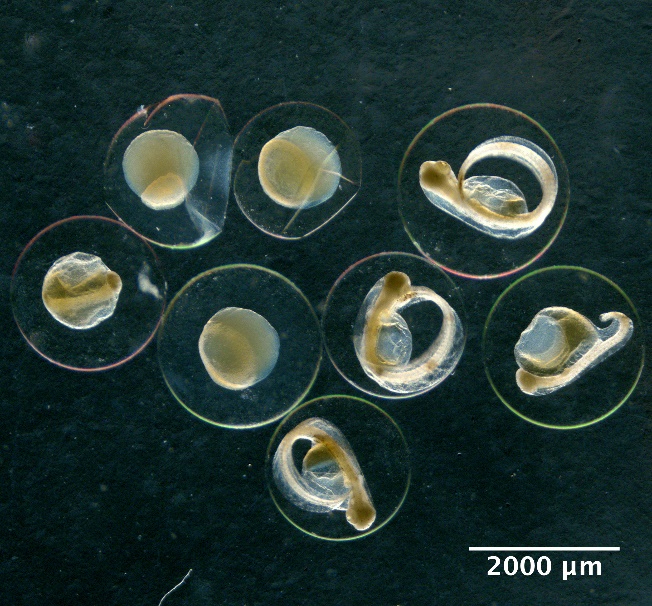
Illustrations of fish eggs identified from using visual taxonomic method