5. Methods used to assess deviation from the reference condition
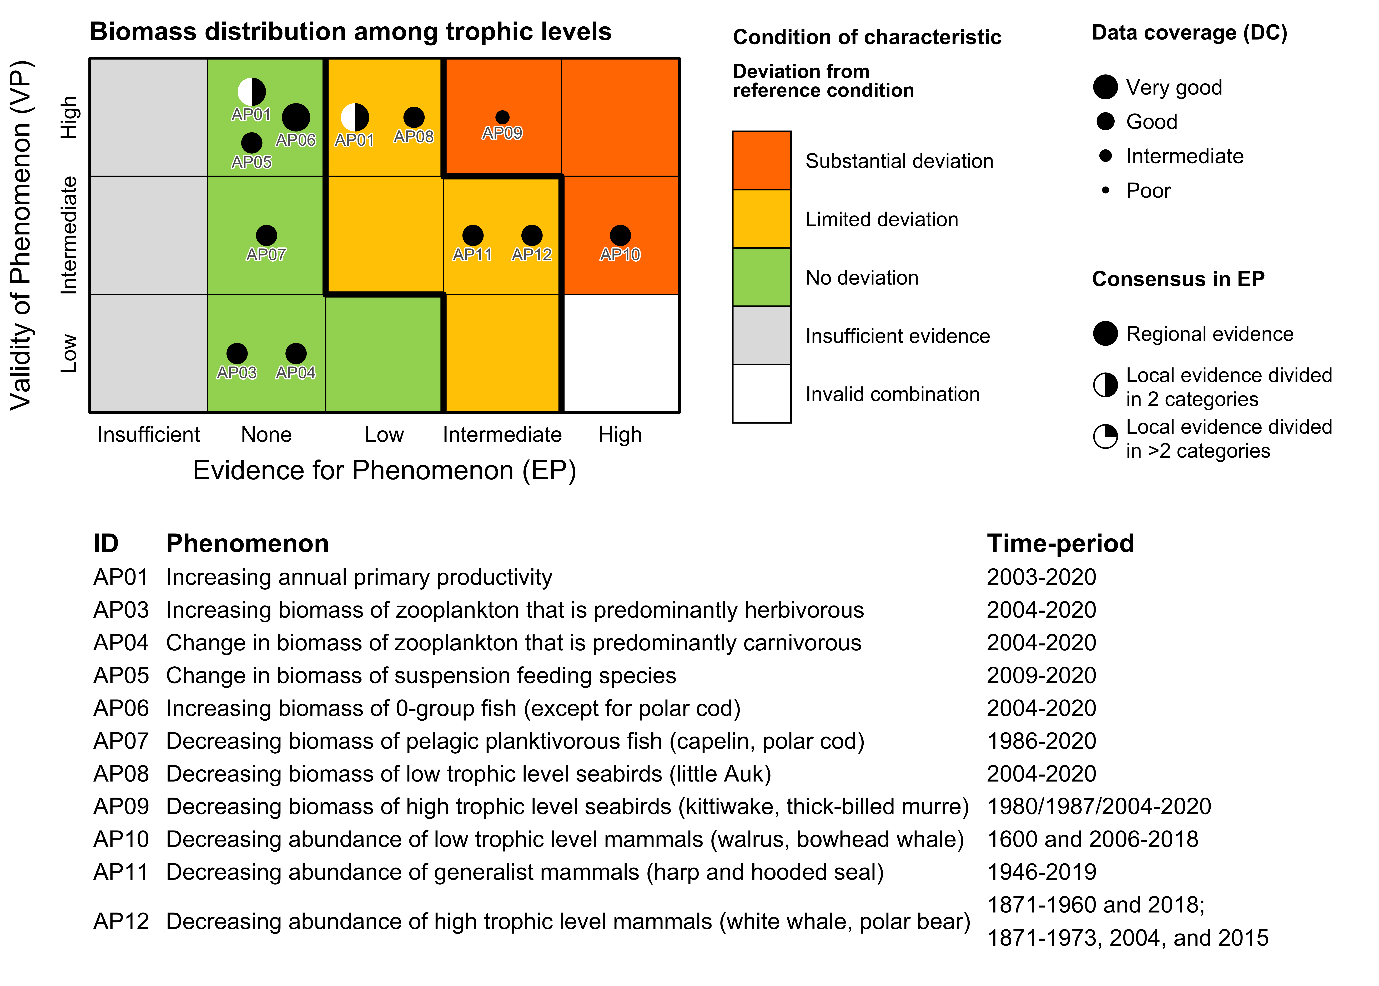
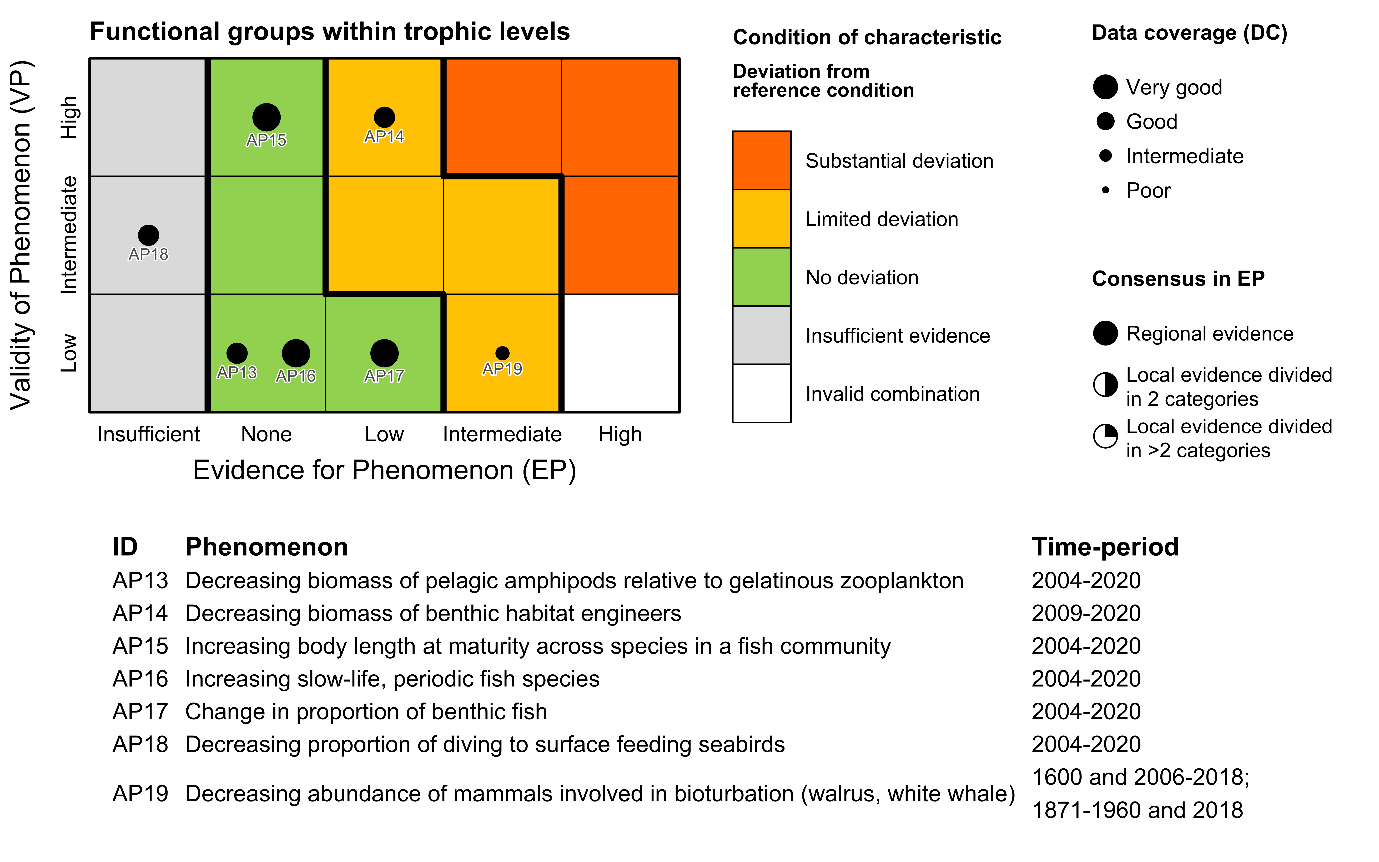
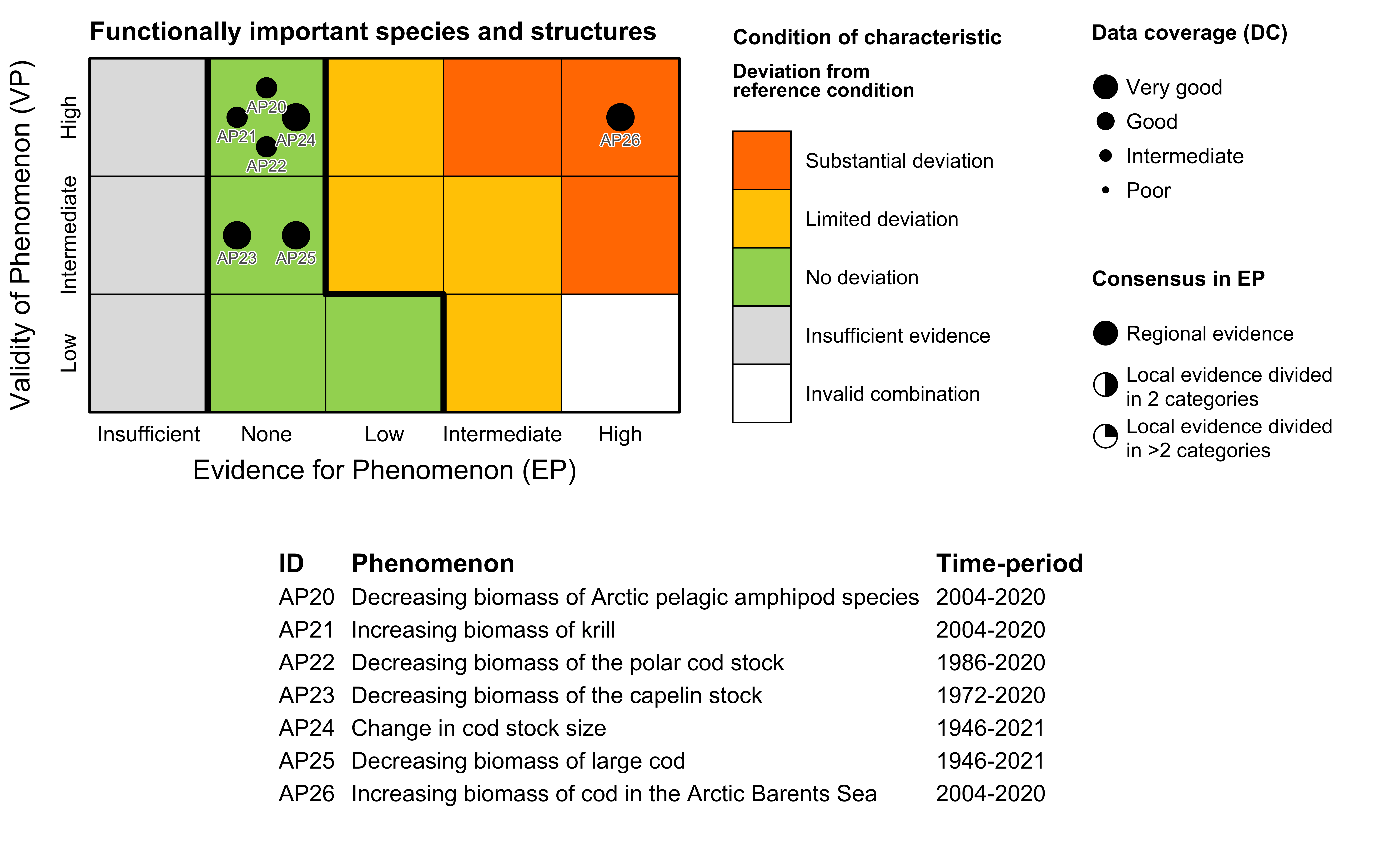
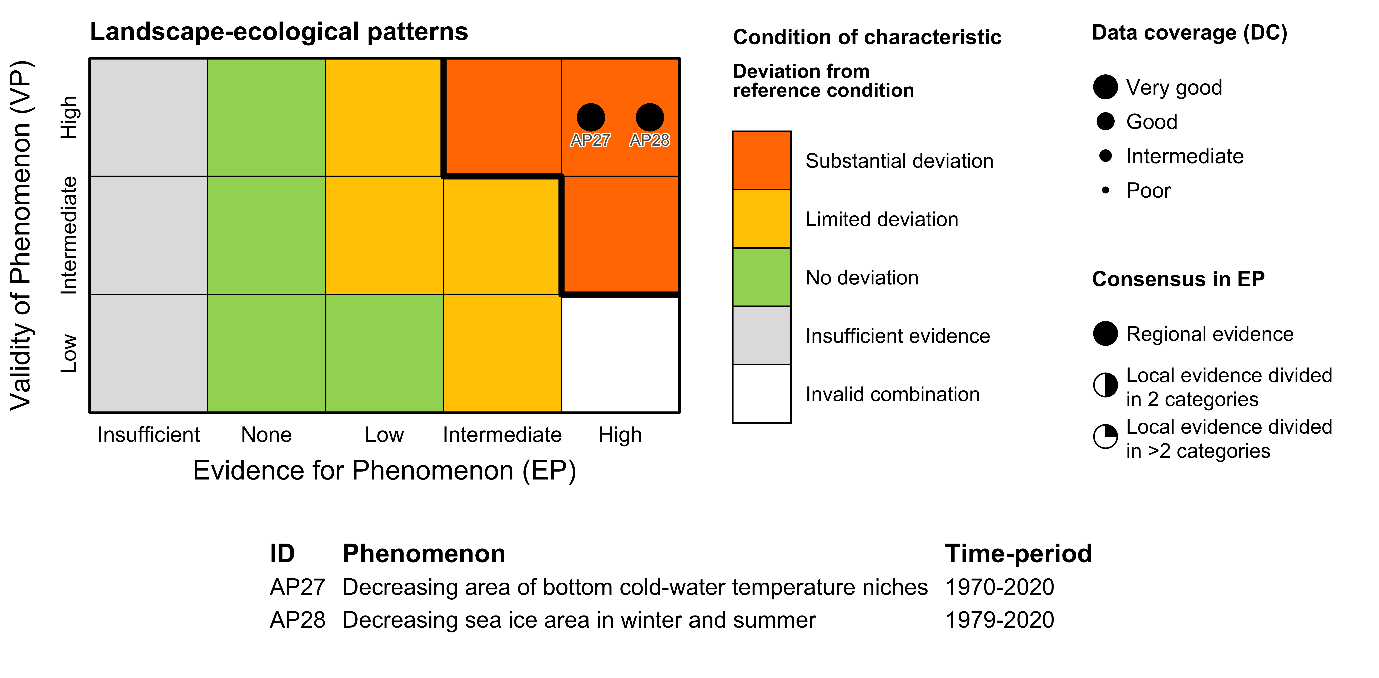
Deviation from the reference condition was assessed by comparing the expected variation in an indicator’s value with increasing human pressure (phenomenon, see short titles in Tables 5.1a and b and full descriptions in sections 5.1 and 5.2) to observed trend in the indicator’s data (see 4.2). If the fitted trend on the observed data was similar to what is expected given the observed variation in the relevant anthropogenic drivers, then there is evidence for deviation from the reference condition.
| Indicator [ID] |
Phenomenon [ID] |
Anthropogenic drivers |
Approach |
| Annual net primary productivity [AI01] |
Increasing annual net primary productivity [AP01] |
Climate change |
2) and 3) |
| Timing of spring bloom [AI02] |
Earlier start of the spring bloom [AP02] |
Climate change |
2) and 3) |
| Zooplankton TL < 2.5 [AI03] |
Increasing biomass of zooplankton that is predominantly herbivorous [AP03] |
Climate change |
2) and 3) |
| Zooplankton TL > 2.5 [AI04] |
Change in biomass of zooplankton that is predominantly carnivorous [AP04] |
Climate change |
2) and 3) |
| Benthic suspensivores [AI05] |
Change in biomass of suspension feeding species [AP05] |
Climate change |
2) and 3) |
| 0-group fish [AI06] |
Increasing biomass of 0-group fish (except for polar cod) [AP06] |
Climate change |
2) and 3) |
| Pelagic planktivorous fish [AI07] |
Decreasing biomass of pelagic planktivorous fish [AP07] |
Climate change |
2) and 3) |
| Low TL seabirds [AI08] |
Decreasing biomass of low TL seabirds [AP08] |
Climate change |
2) and 3) |
| High TL seabirds [AI09] |
Decreasing biomass of high TL seabirds [AP09] |
Climate change, fisheries |
2) and 3) |
| Low TL mammals [AI10] |
Decreasing abundance of low TL mammals [AP10] |
Overharvesting and climate change |
2) and 3) |
| Generalist mammals [AI11] |
Decreasing abundance of generalist mammals [AP11] |
Overharvesting and climate change |
2) and 3) |
| High TL mammals [AI12] |
Decreasing abundance of high TL mammals [AP12] |
Overhunting of bears and climate change |
2) and 3) |
| High TL zooplankton functional groups [AI13] |
Decreasing biomass of pelagic amphipods relative to gelatinous zooplankton [AP13] |
Climate change |
2) and 3) |
| Benthic habitat engineers [AI14] |
Decreasing biomass of benthic habitat engineers [AP14] |
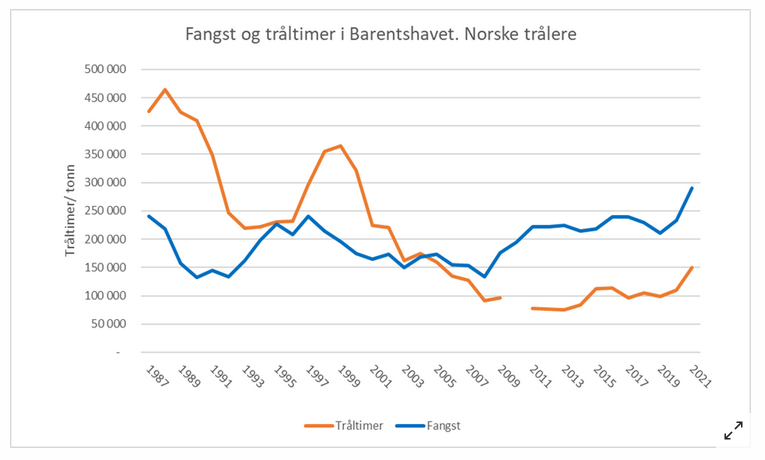
Bottom trawling |
2) and 3) |
| Fish size [AI15] |
Increasing body length at maturity across species in a fish community [AP15] |
Climate change |
2) and 3) |
| Fish life history [AI16] |
Increasing slow-life, periodic fish species [AP16] |
Climate change |
2) and 3) |
| Fish habitat use [AI17] |
Change in proportion of benthic fish [AP17] |
Climate change |
2) and 3) |
| Seabird feeding types [AI18] |
Decreasing proportion of diving to surface-feeding seabirds [AP18] |
Fisheries |
2) and 3) |
| Mammal bioturbation [AI19] |
Decreasing abundance of mammals involved in bioturbation [AP19] |
Climate change |
2) and 3) |
| Pelagic amphipods [AI20] |
Decreasing biomass of Arctic pelagic amphipod species [AP20] |
Climate change |
2) and 3) |
| Krill [AI21] |
Increasing biomass of krill [AP21] |
Climate change |
2) and 3) |
| Polar cod [AI22] |
Decreasing biomass of the polar cod stock [AP22] |
Climate change |
2) and 3) |
| Capelin [AI23] |
Decreasing biomass of the capelin stock [AP23] |
Climate change, fisheries |
2) and 3) |
| Cod [AI24] |
Change in cod total stock size [AP24] |
Climate change (increase), fisheries (decrease) |
2) and 3) |
| Cod size structure [AI25] |
Decreasing biomass of large cod [AP25] |
Fisheries |
2) and 3) |
| Cod distribution [AI26] |
Increasing biomass of cod in the Arctic Barents Sea [AP26] |
Climate change |
2) and 3) |
| Bottom thermal niches [AI27] |
Decreasing area of bottom cold-water temperature niches |
Climate change |
2) and 3) |
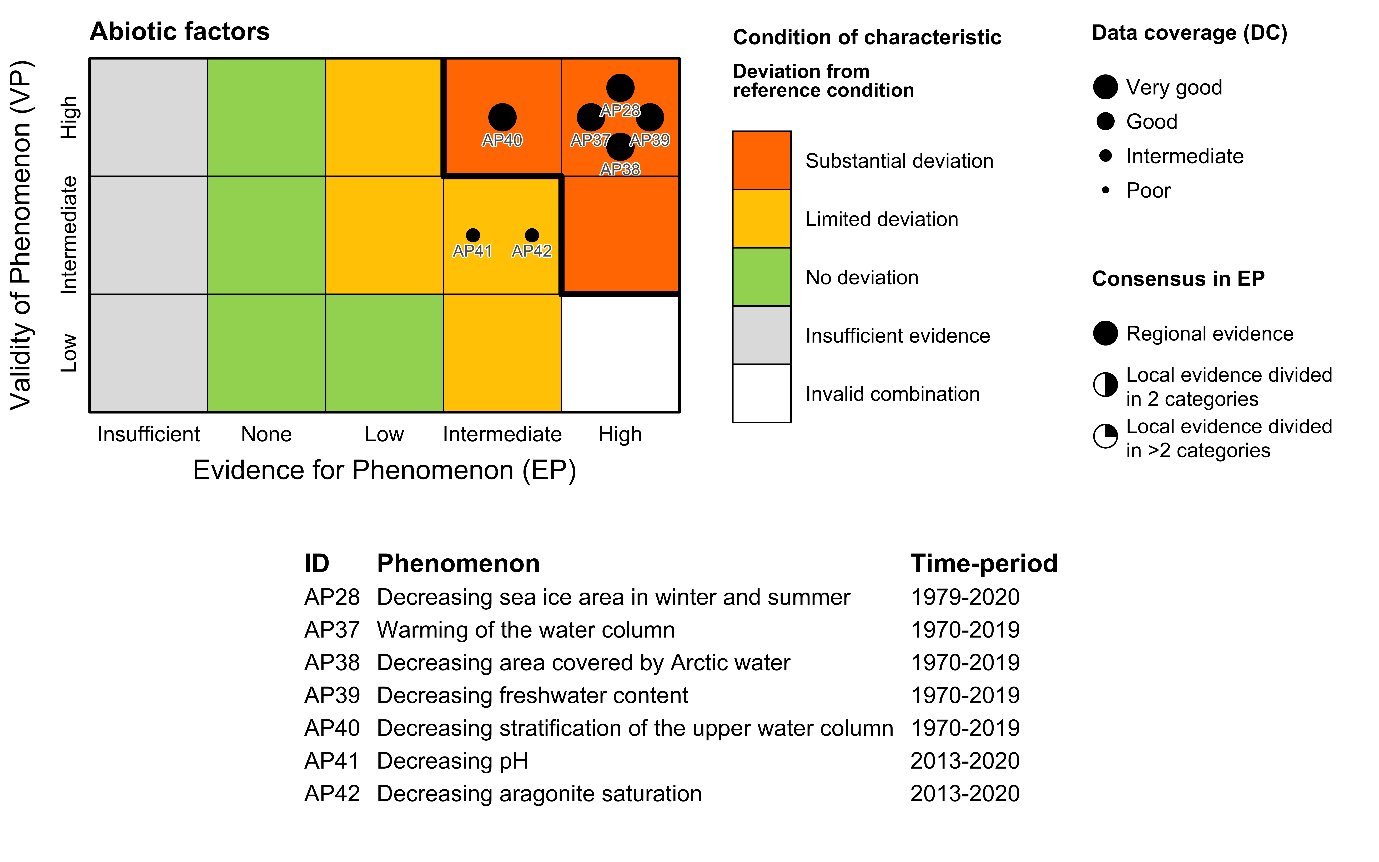
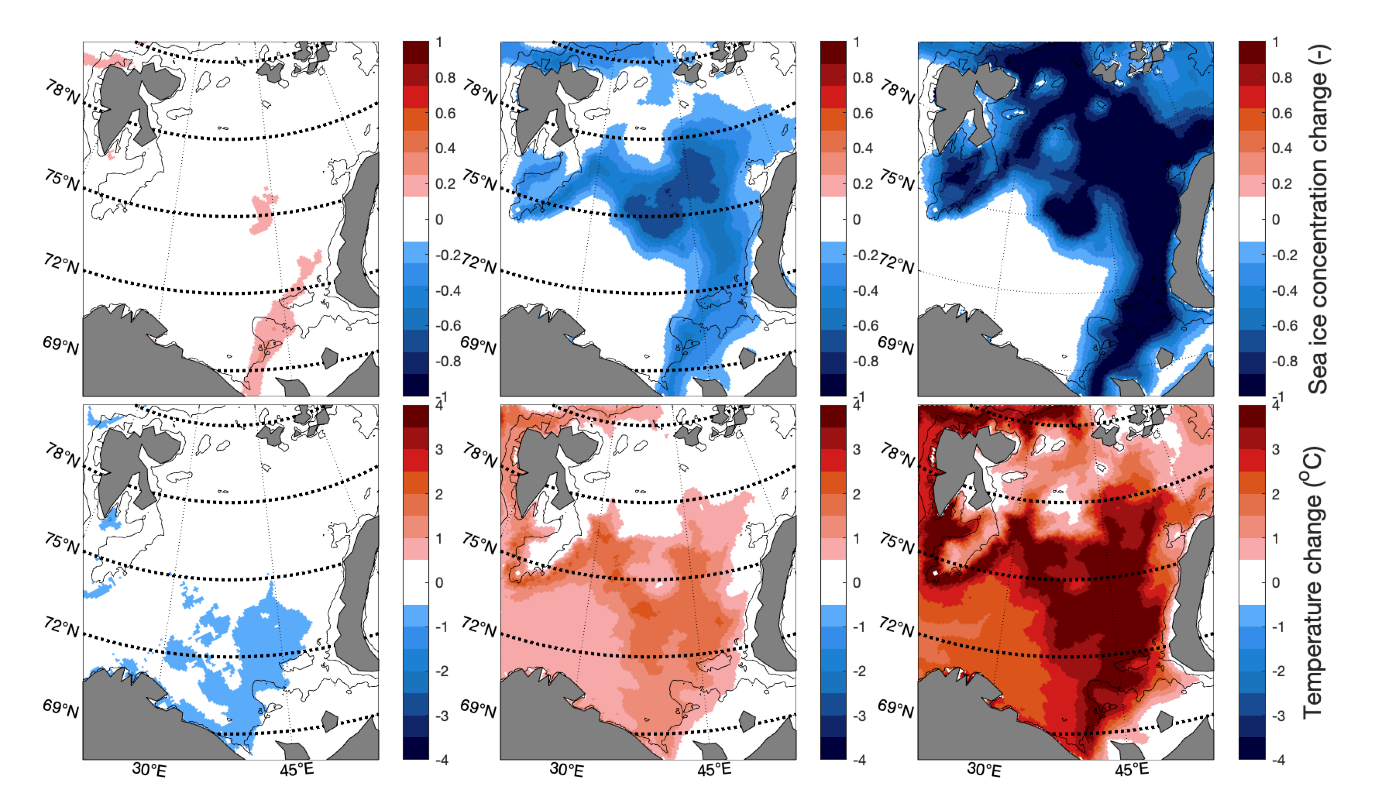
| Sea-ice area [AI28] |
Decreasing sea-ice area in winter and summer [AP28] |
Climate change |
2) and 3) |
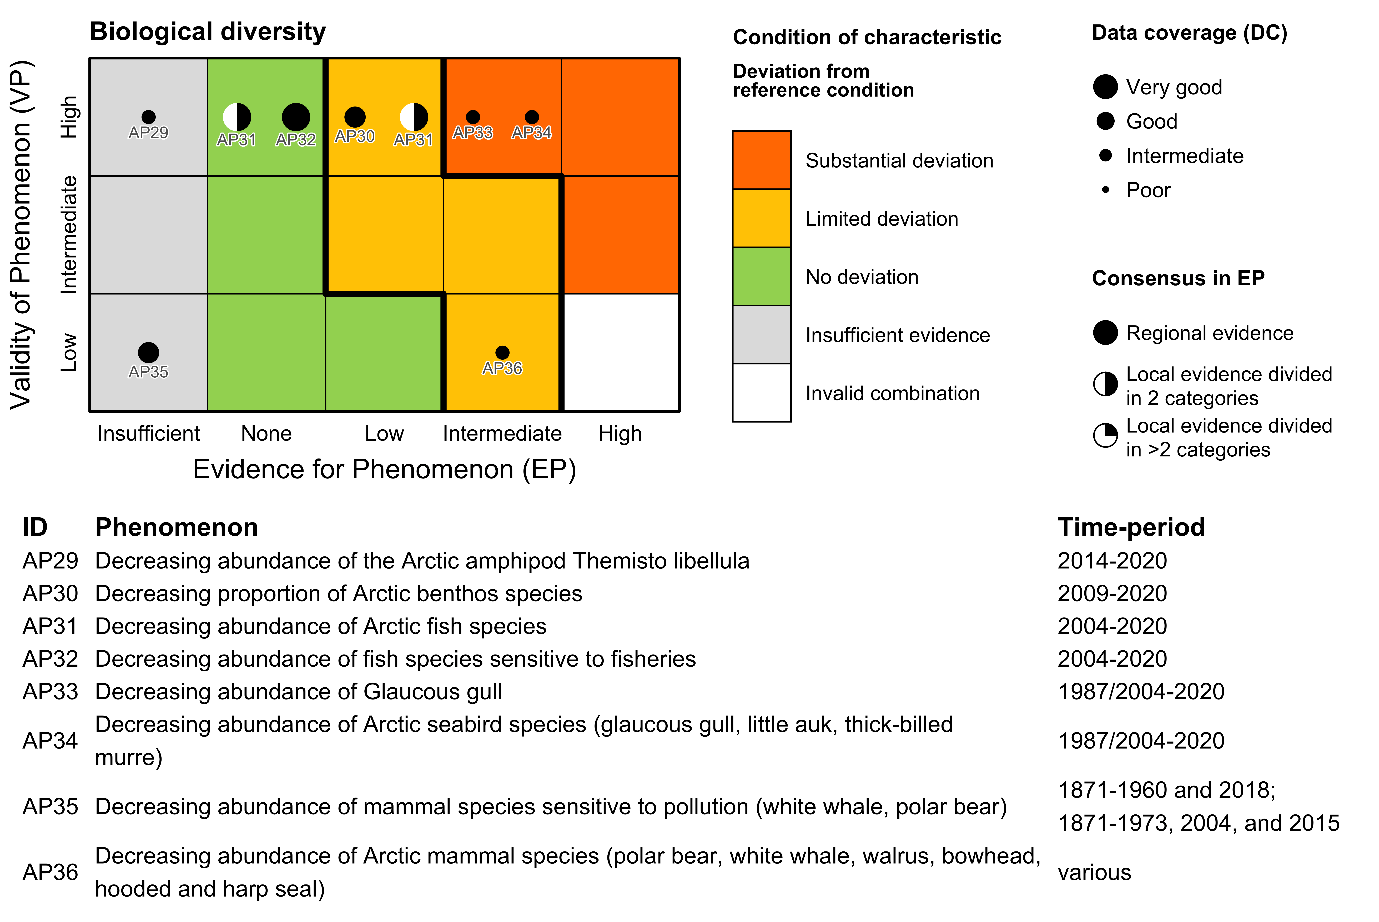
| Arctic amphipod [AI29] |
Decreasing biomass of the Arctic amphipod Themisto libellula [AP29] |
Climate change |
2) and 3) |
| Cold-water benthos [AI30] |
Decreasing proportion of Arctic benthos species [AP30] |
Climate change |
2) and 3) |
| Arctic fish [AI31] |
Decreasing abundance of Arctic fish species [AP31] |
Climate change |
2) and 3) |
| Fish sensitive to fisheries [AI32] |
Decreasing abundance of fish species sensitive to fisheries [AP32] |
Fisheries |
2) and 3) |
| Seabirds sensitive to pollution [AI33] |
Decreasing abundance of Glaucous gull [AP33] |
Pollution |
2) and 3) |
| Arctic seabirds [AI34] |
Decreasing abundance of Arctic seabird species [AP34] |
Climate change |
2) and 3) |
| Mammals sensitive to pollution [AI35] |
Decreasing abundance of mammal species sensitive to pollution [AP35] |
Pollution |
2) and 3) |
| Arctic mammals [AI36] |
Decreasing abundance of Arctic mammal species [AP36] |
Climate change |
2) and 3) |
| Temperature [AI37] |
Increasing temperature of the water column [AP37] |
Climate change |
2) and 3) |
| Area of water masses [AI38] |
Decreasing area covered by Arctic Water [AP38] |
Climate change |
2) and 3) |
| Freshwater content [AI39] |
Decreasing freshwater content [AP39] |
Climate change |
2) and 3) |
| Stratification [AI40] |
Decreasing stratification of the upper water column [AP40] |
Climate change |
2) and 3) |
| pH [AI41] |
Decreasing pH [AP41] |
Global increase in CO2 |
2) and 3) |
| Aragonite saturation [AI42] |
Decreasing aragonite saturation [AP42] |
Global increase in CO2 |
2) and 3) |
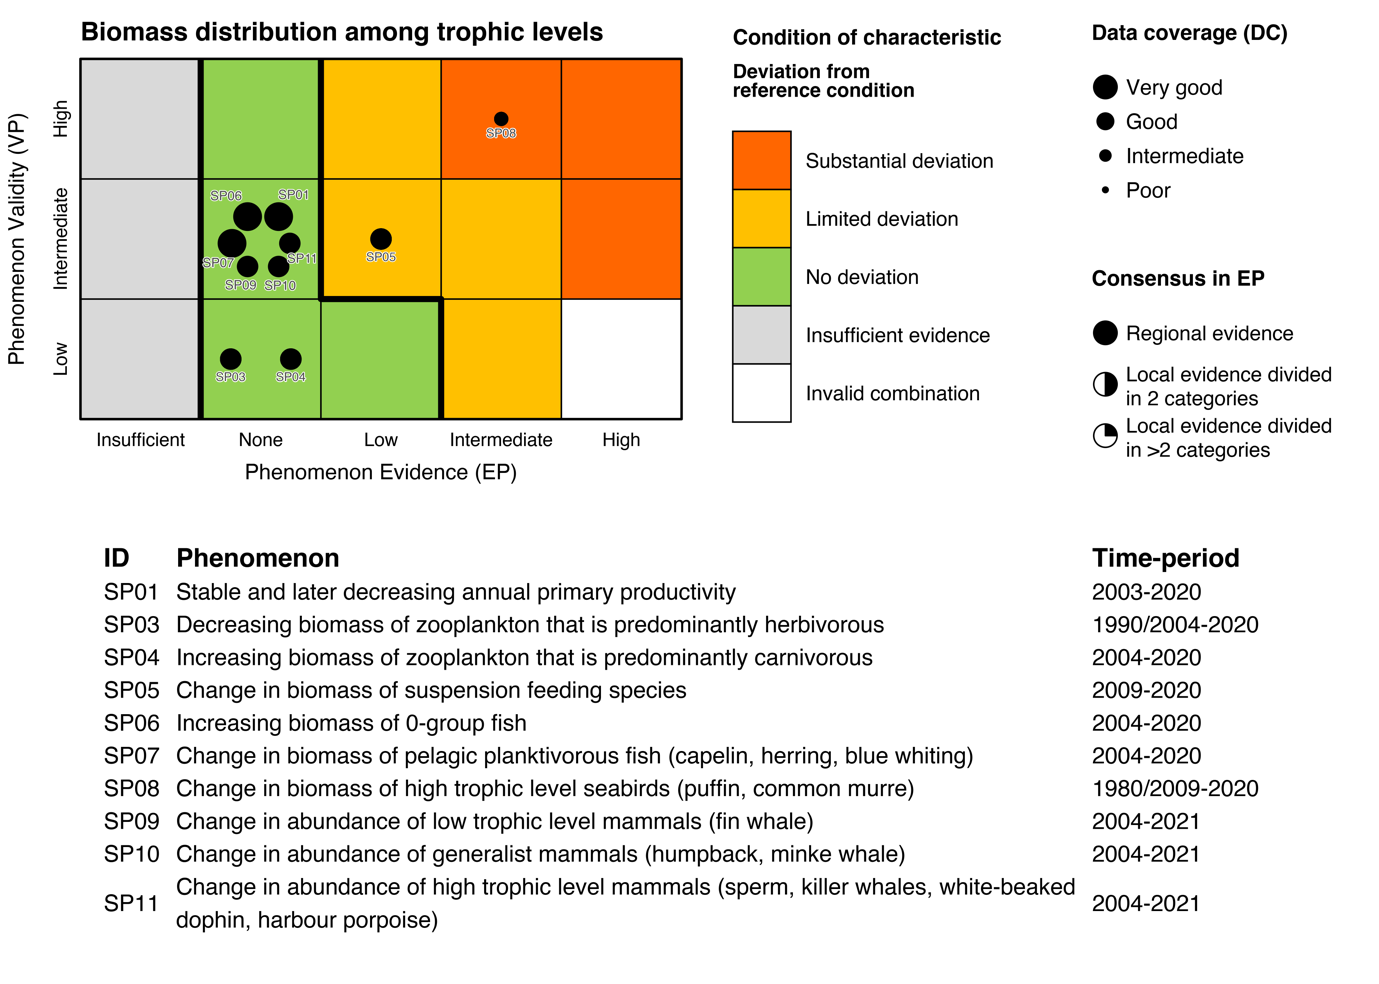
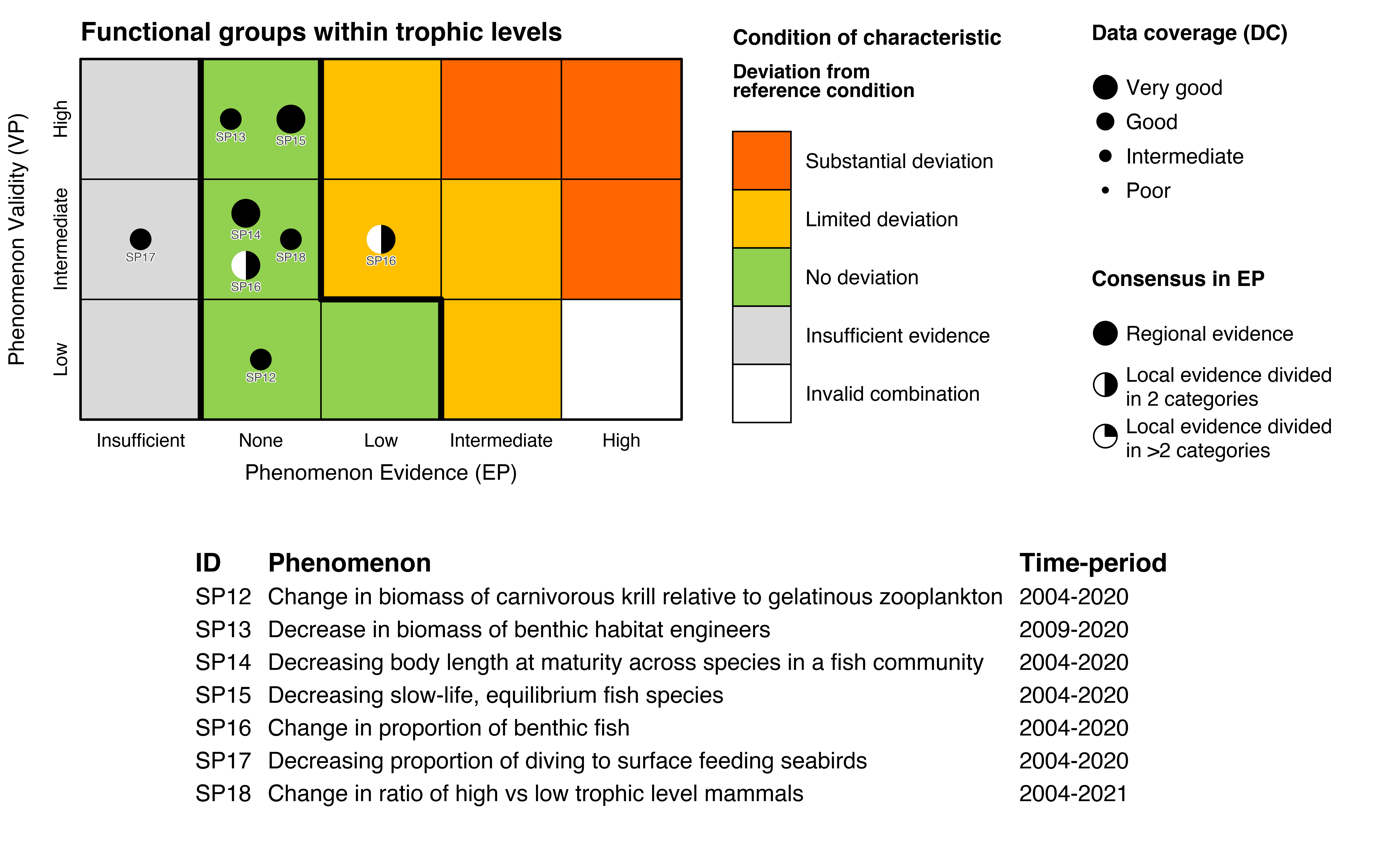
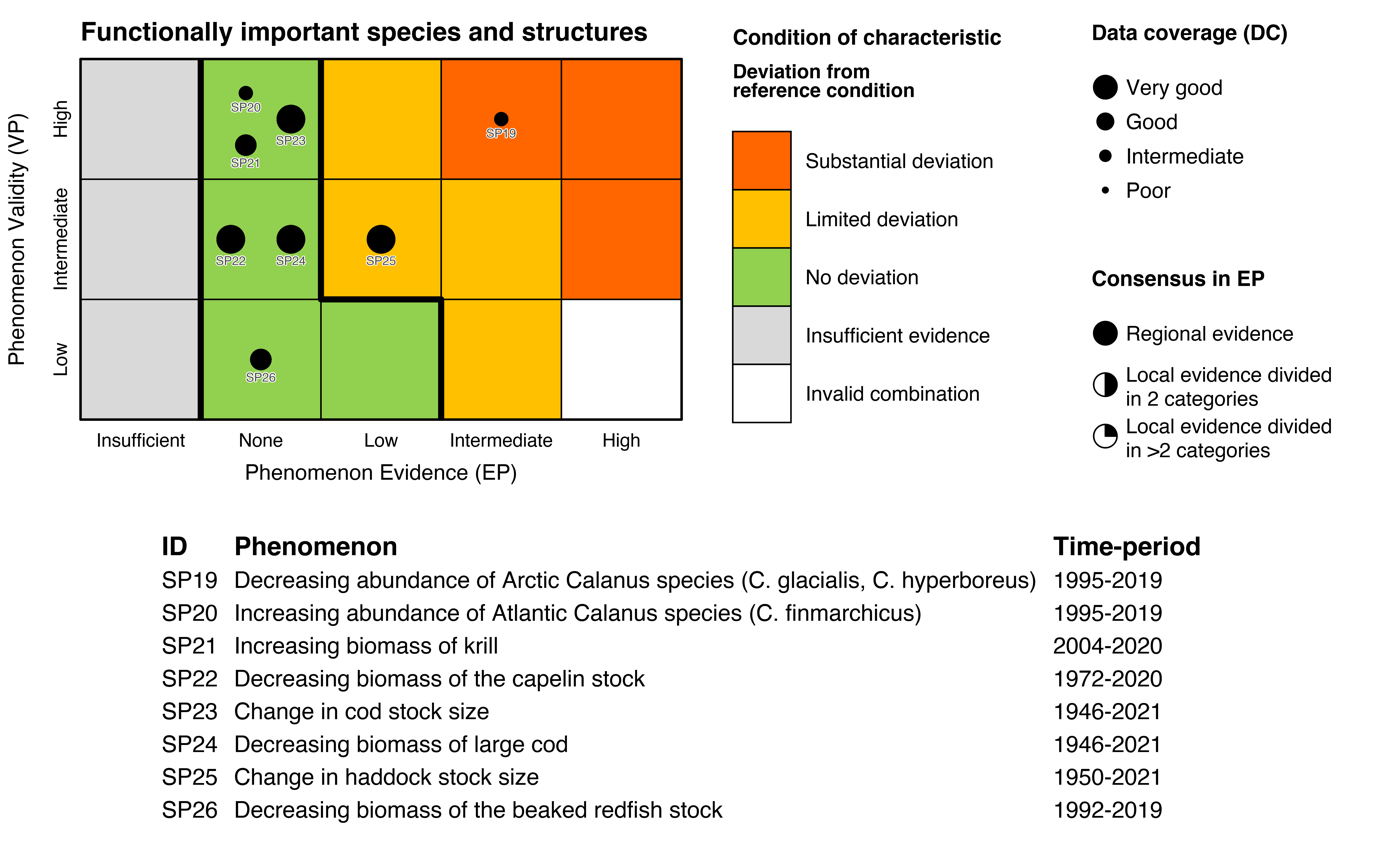
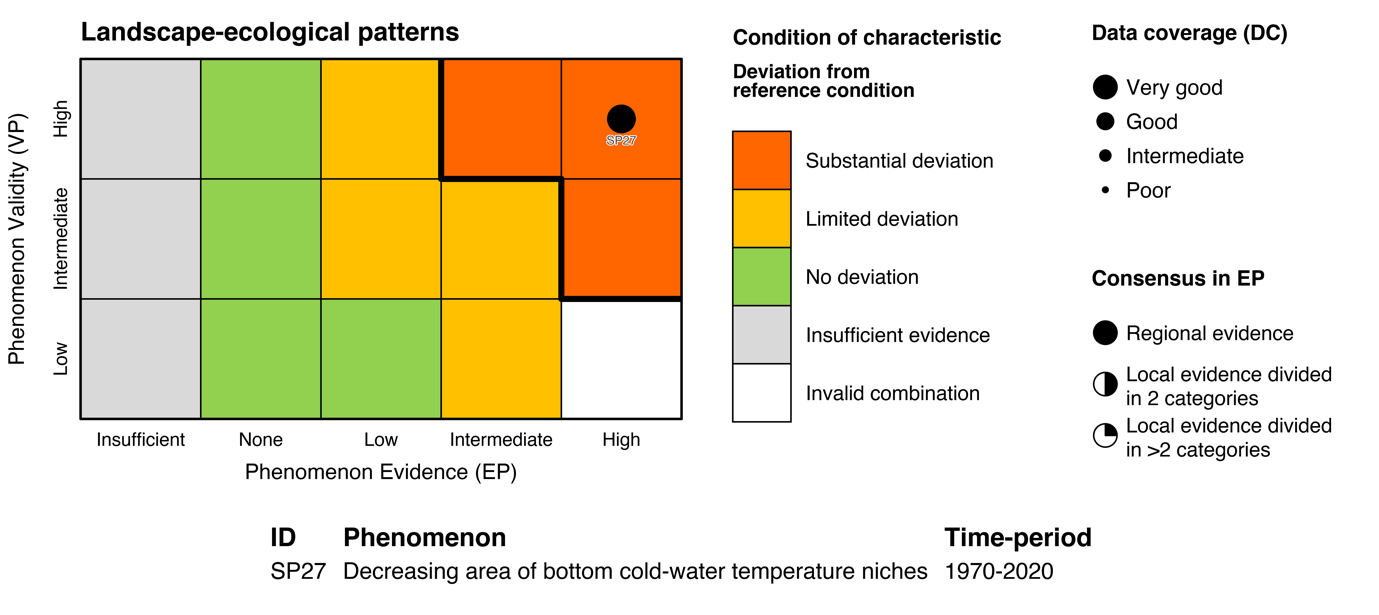
Table 5.1a. List of phenomena including overall approach used to determine the extent to which each phenomenon has occurred in the Arctic part of the Barents Sea. Approach refers to methods used to determine the extent to which the phenomenon has occurred. (1) For quantitative phenomena: The values of the indicator relative to an estimated quantitative threshold value (2) For qualitative phenomena: The value of the indicator relative to variation estimated from the indicator time series or other qualitative or quantitative information about a reference state (3) For all phenomena: Observed and expected effects of changes in the indicator on other components of the ecosystem (i.e., ecosystem significance). TL: trophic level.
Table 5.1b. List of phenomena including overall approach used to determine the extent to which each phenomenon has occurred in the Sub-Arctic part of the Barents Sea. Approach refers to methods used to determine the extent to which the phenomenon has occurred. (1) For quantitative phenomena: The values of the indicator relative to an estimated quantitative threshold value (2) For qualitative phenomena: The value of the indicator relative to variation estimated from the indicator time series or other qualitative or quantitative information about a reference state (3) For all phenomena: Observed and expected effects of changes in the indicator on other components of the eco-system (i.e., ecosystem significance). TL: trophic level
| Indicator [ID] |
Phenomenon [ID] |
Anthropogenic drivers |
Approach |
| Annual net primary productivity [SI01] |
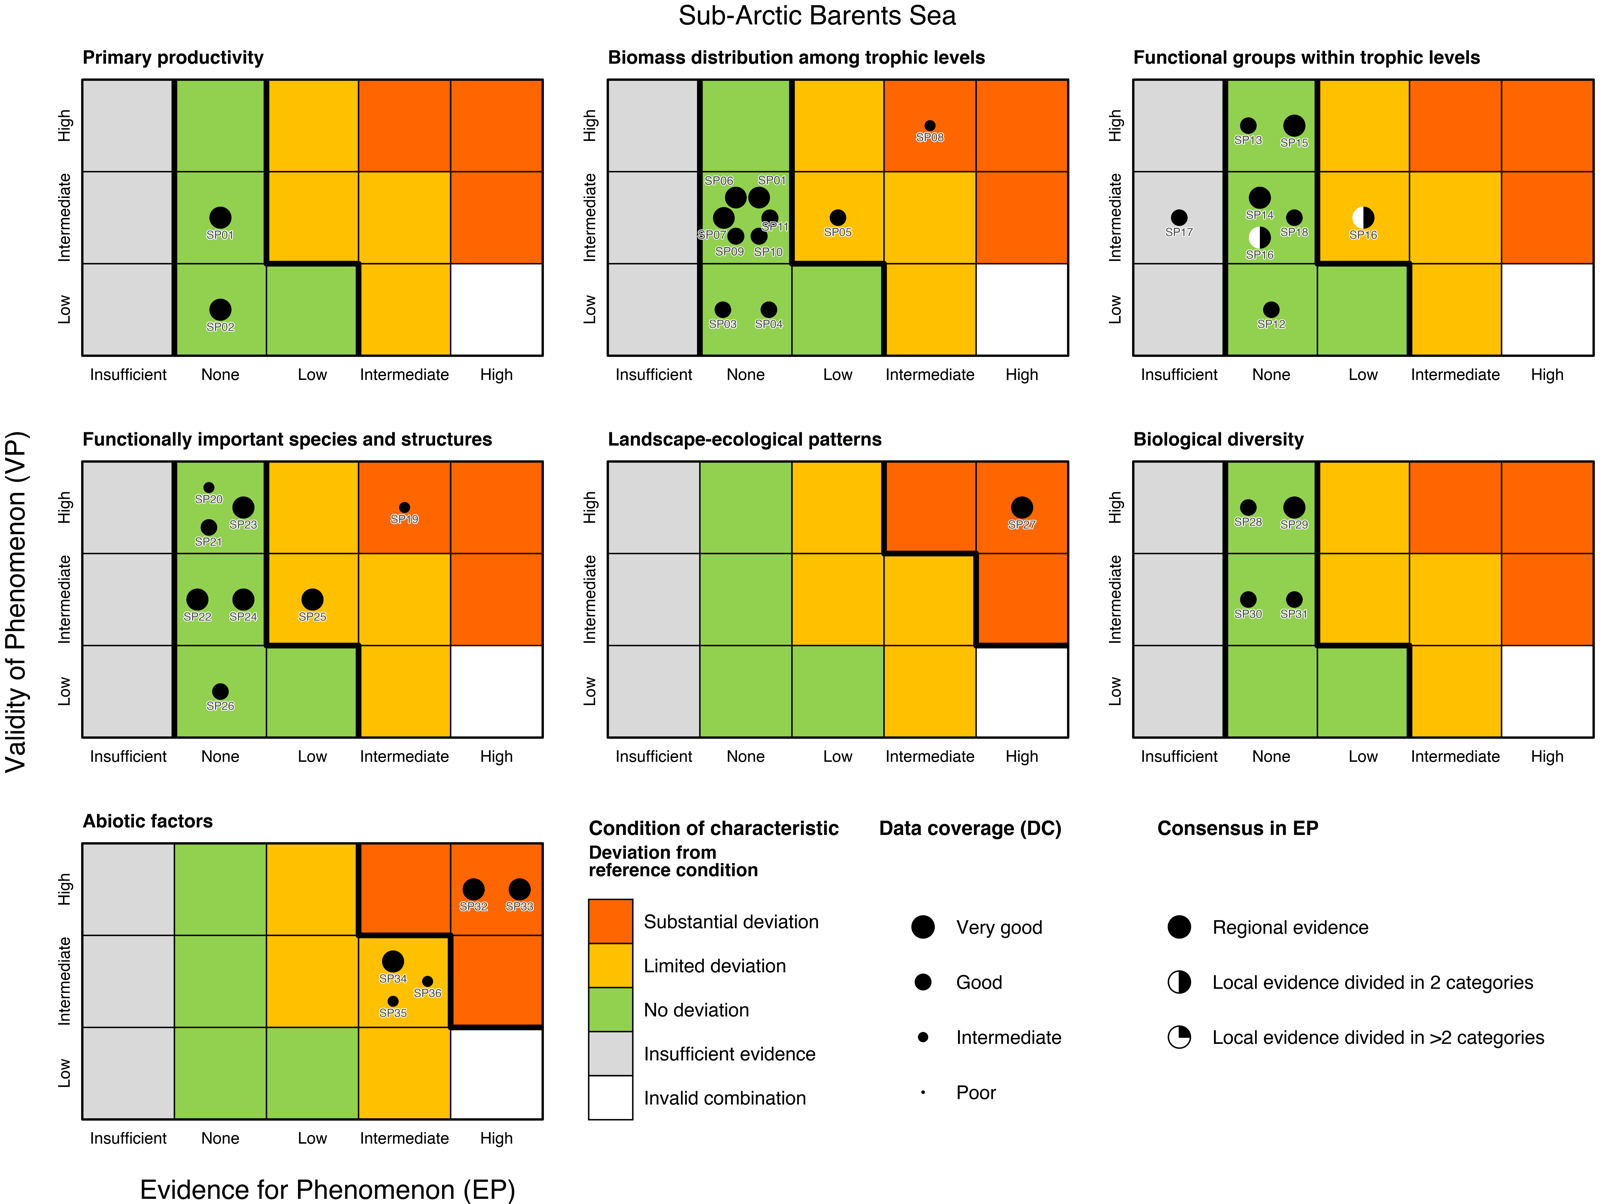
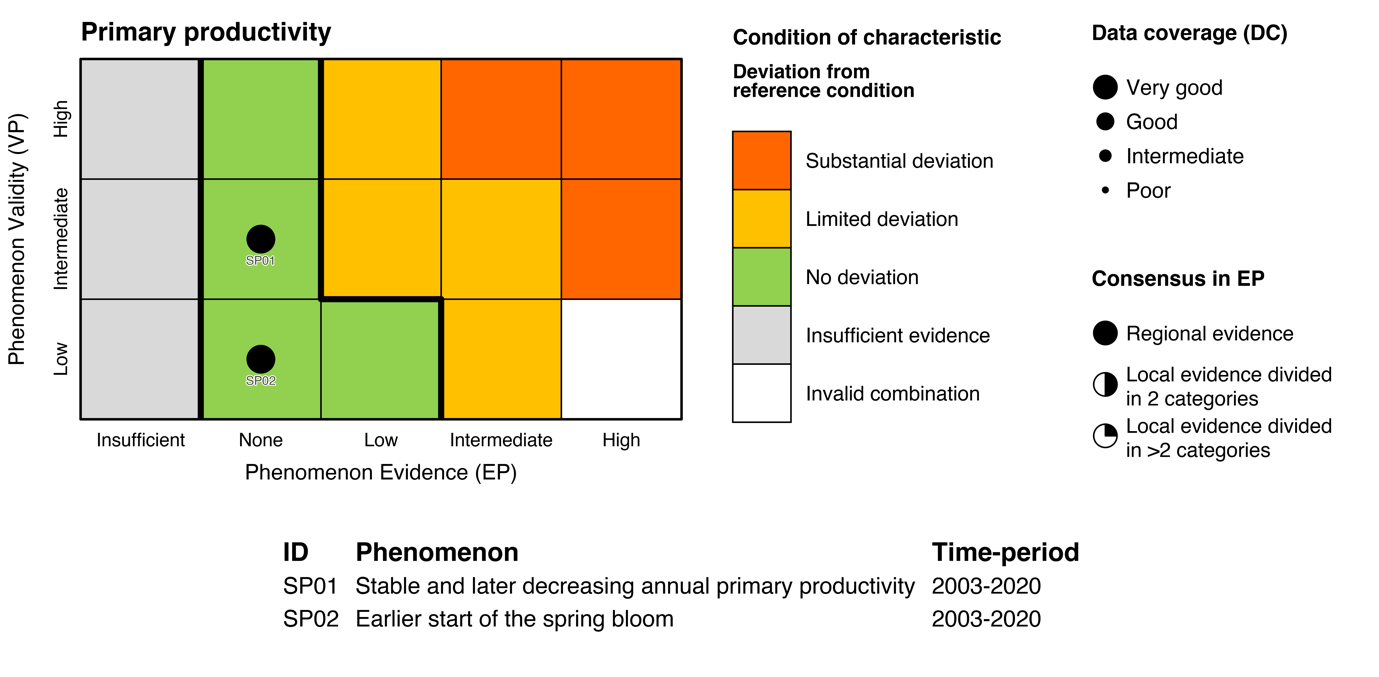
Stable and later decreasing annual net primary productivity [SP01] |
Climate change |
2) and 3) |
| Timing of spring bloom [SI02] |
Earlier start of the spring bloom [SP02] |
Climate change |
2) and 3) |
| Zooplankton TL < 2.5 [SI03] |
Decreasing biomass of zooplankton that is predominantly herbivorous [SP03] |
Climate change |
2) and 3) |
| Zooplankton TL > 2.5 [SI04] |
Increasing biomass of zooplankton that is predominantly carnivorous [SP04] |
Climate change |
2) and 3) |
| Benthic suspensivores [SI05] |
Change in biomass of suspension feeding species [SP05] |
Climate change |
2) and 3) |
| 0-group fish [SI06] |
Increasing biomass of 0-group fish [SP06] |
Climate change |
2) and 3) |
| Pelagic planktivorous fish [SI07] |
Change in biomass of pelagic planktivorous fish [SP07] |
Climate change, fisheries |
2) and 3) |
| High TL seabirds [SI08] |
Change in biomass of high TL seabirds [SP08] |
Climate change, fisheries |
2) and 3) |
| Low TL mammals [SI09] |
Change in abundance of low TL mammals [SP09] |
Climate change, past over-harvesting |
2) and 3) |
| Generalist mammals [SI10] |
Change in abundance of generalist mammals [SP10] |
Climate change, harvesting |
2) and 3) |
| High TL mammals [SI11] |
Change in abundance of high TL mammals [SP11] |
Climate change, fisheries, pollution |
2) and 3) |
| High TL zooplankton functional groups [SI12] |
Change in biomass of carnivorous krill relative to gelatinous zooplankton [SP12] |
Climate change |
2) and 3) |
| Benthic habitat engineers [SI13] |
Decreasing biomass of benthic habitat engineers [SP13] |
Climate change, physical impact on seabed, and bottom trawling |
2) and 3) |
| Fish size [SI14] |
Decreasing body length at maturity across species in a fish community [SP14] |
Climate change, fisheries |
2) and 3) |
| Fish life history [SI15] |
Decreasing slow-life, equilibrium fish species [SP15] |
Fisheries |
2) and 3) |
| Fish habitat use [SI16] |
Change in proportion of benthic fish [SP16] |
Climate change (decrease), fisheries (increase) |
2) and 3) |
| Seabird feeding types [SI17] |
Decreasing proportion of diving to surface-feeding seabirds [SP17] |
Fisheries |
2) and 3) |
| Mammals top-down control [SI18] |
Change in ratio of high vs low trophic level mammals [SP18] |
Climate change |
2) and 3) |
| Arctic Calanus [SI19] |
Decreasing abundance of Arctic Calanus species [SP19] |
Climate change |
2) and 3) |
| Atlantic Calanus [SI20] |
Increasing abundance of Atlantic Calanus species [SP20] |
Climate change |
2) and 3) |
| Krill [SI21] |
Increasing biomass of krill [SP21] |
Climate change |
2) and 3) |
| Capelin [SI22] |
Decreasing biomass of the capelin stock [SP22] |
Climate change, fisheries |
2) and 3) |
| Cod [SI23] |
Change in cod total stock size [SP23] |
Climate change (increase), fisheries (decrease) |
2) and 3) |
| Cod size structure [SI24] |
Decreasing biomass of large cod [SP24] |
Fisheries |
2) and 3) |
| Haddock [SI25] |
Change in haddock stock size [SP25] |
Climate change (increase), fisheries (decrease) |
2) and 3) |
| Redfish [SI26] |
Decreasing biomass of the beaked redfish stock [SP26] |
Climate change, fisheries, oil extraction |
2) and 3) |
| Bottom thermal niches [SI27] |
Decreasing area of bottom cold-water temperature niches[SP27] |
Climate change |
2) and 3) |
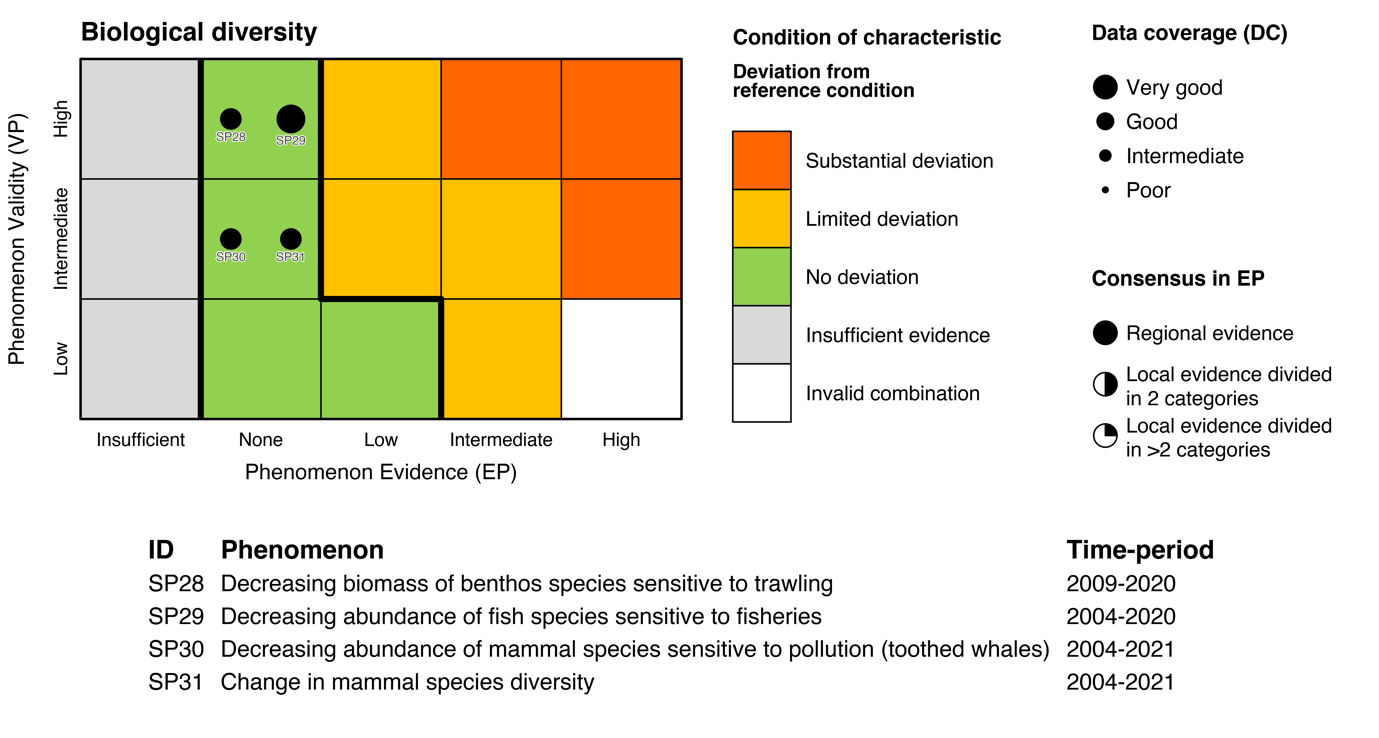
| Benthos sensitive to bottom trawling [SI28] |
Decreasing biomass of benthos species sensitive to trawling [SP28] |
Bottom trawling |
2) and 3) |
| Fish sensitive to fisheries [SI29] |
Decreasing abundance of fish species sensitive to fisheries [SP29] |
Fisheries |
2) and 3) |
| Mammals sensitive to pollution [SI30] |
Decreasing abundance of mammal species sensitive to pollution [SP30] |
Pollution |
2) and 3) |
| Mammal diversity [SI31] |
Change in mammal species diversity [SP31] |
Climate change |
2) and 3) |
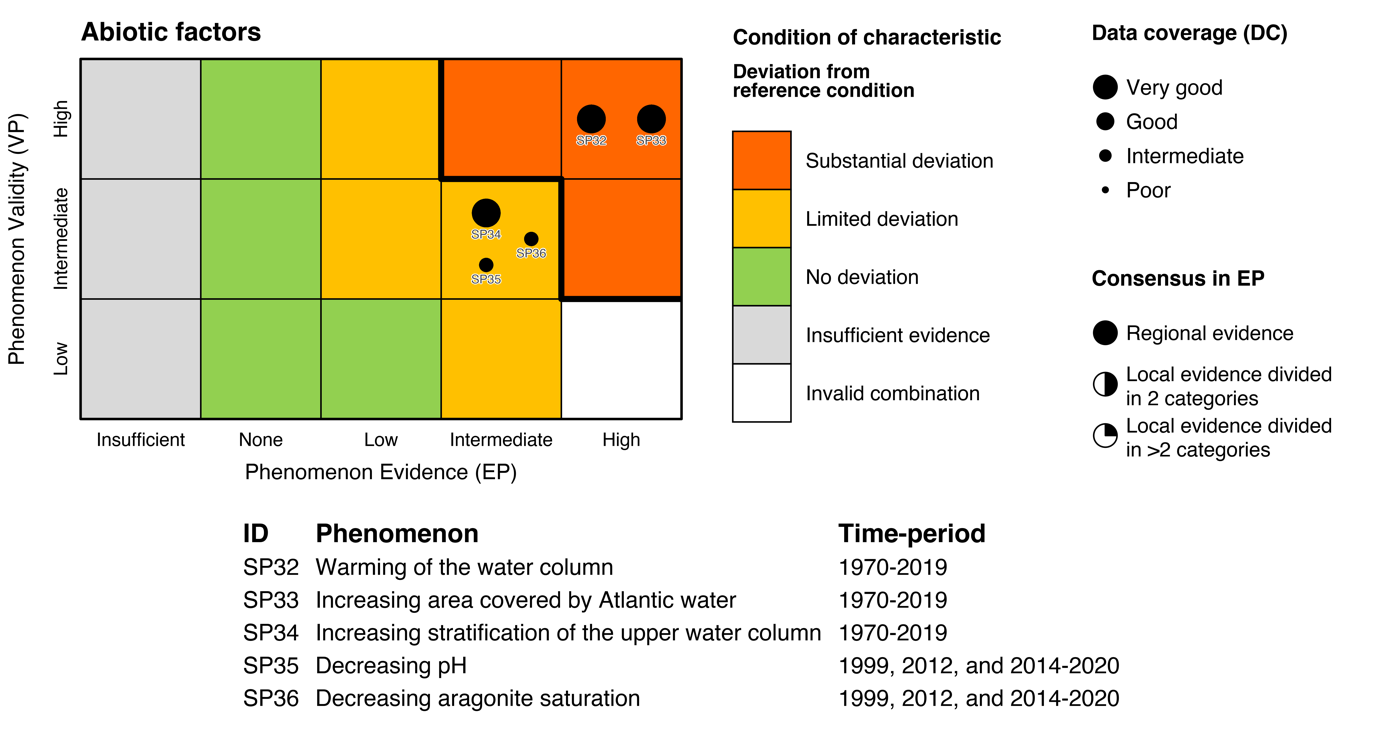
| Temperature [SI32] |
Increase in temperature of the water column [SP32] |
Climate change |
2) and 3) |
| Area of water masses [SI33] |
Increasing area covered by Atlantic Water [SP33] |
Climate change |
2) and 3) |
| Stratification [SI34] |
Increasing stratification of the upper water column [SI34] |
Climate change |
2) and 3) |
| pH [SI35] |
Decreasing pH [SP35] |
Global increase in CO2 |
2) and 3) |
| Aragonite saturation [SI36] |
Decreasing aragonite saturation [SP36] |
Global increase in CO2 |
2) and 3) |
5.1. Scientific evidence basis for the phenomena in the Arctic Barents Sea
Annual net primary productivity [AI01]
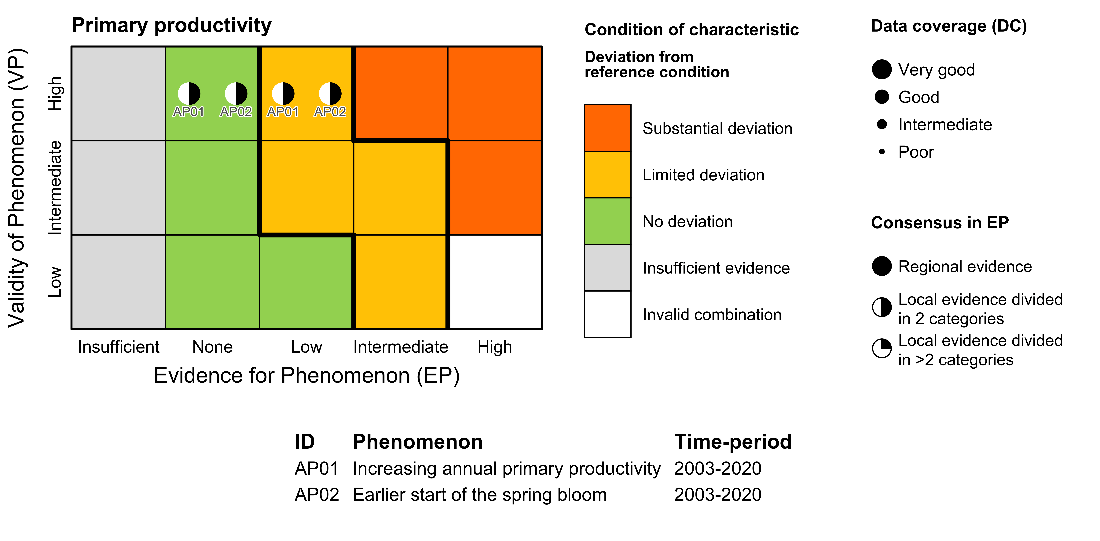
Phenomenon: Increasing annual net primary productivity [AP01]
Ecosystem characteristics: Primary productivity, Biomass distribution among trophic levels
Under the reference condition, primary production in the Arctic part of the Barents Sea is contributed by single-celled algae growing in the water column (phytoplankton) and in sea ice (ice algae). Strong seasonality in incoming light limits the time window during which primary production is possible. Consequently, there is a high seasonality in the availability of photosynthetically fixed carbon in the Arctic marine environment and the amplitude of the primary production cycle becomes increasingly shorter toward higher latitudes (Daase et al., 2021). In addition, sea ice limits the penetration of light into the water column. The freeze/melt cycle of sea ice also affects water mass stratification and mixing processes. These physical processes control the replenishment of essential nutrients to the euphotic zone, and thereby constrain primary production.
The most important anthropogenic driver of change in this indicator is climate change. The main climate change-induced effects on primary production in the Arctic part of the Barents Sea are mediated through decreased sea-ice cover, increased temperature of advected water and altered storm tracks and ocean- mixing regimes (Wassmann et al., 2010; Doney et al., 2012; Dalpadado et al., 2014, 2020; Arrigo and van Dijken, 2015; Yool et al., 2015; Lind et al., 2018). Loss of sea-ice habitat and earlier melt and later freeze-up will likely have a negative impact on annual ice algal primary production and the ice-associated food web (Barber et al., 2015; Selz et al., 2018). Field experiments also suggest that ice-algal production may decrease due to their sensitivity to elevated irradiance caused by loss of snow cover and thinning of ice (Lund-Hansen et al., 2020). As the sea ice declines, models and satellite observations (applied to the whole Barents Sea and for observations up to 2017 or earlier) have shown an increase in annual primary production for the Arctic part of the Barents Sea as a result of greater open-water area and longer growing season (Dalpadado et al., 2014, 2020; Arrigo and van Dijken, 2015; Yool et al., 2015; Mueter et al., 2021) as well as increased intensity of primary production per unit area (Lewis et al., 2020). Open-water fraction and length of growing season had the strongest positive impact on primary production during the late 1990’s and early 2000’s while increases in primary production after 2009 were largely driven by increased phytoplankton biomass. This suggests that light was the primary driver during the early observational period while increased nutrient flux was likely the main driver for the latter period (Lewis et al., 2020). This is consistent with weakened ocean stratification, enhanced vertical mixing and increased upward fluxes of heat and salt for the northern Barents Sea since the mid-2000s (Lind et al., 2018). It should be noted that light availability and hence primary production may be dampened by increases in cloud cover (Bélanger et al., 2013), and total annual production is eventually limited by nutrient availability (Randelhoff et al., 2015; Tremblay et al., 2015). Warming and increased advection of Atlantic water masses have also led to a poleward expansion of temperate phytoplankton in the Arctic part of the Barents Sea (Neukermans et al., 2018; Oziel et al., 2020) and satellite data indicate an increased dominance of Phaeocystis, an algal species presumably less palatable than diatoms in the Barents Sea (Orkney et al. 2020). Given the strong links between climate change and primary production, the current understanding of the link between drivers and changes in the indicator is rated as certain (see also Table 1 in (Mueter et al., 2021)).
Both models and observations show that primary production is generally positively related to fisheries yield (Iverson, 1990; Ware and Thomson, 2005; Chassot et al., 2007, 2010), thus providing strong evidence that changes in primary production have substantial impacts on other parts of marine ecosystems. Concurrent with increasing primary production in the Barents Sea, substantial increase in pelagic production has been observed (Eriksen et al., 2017), as well as increase in the stock of Atlantic cod, one of the most important predators in the system (Kjesbu et al., 2014). The understanding of the importance of changes in the indicator for other parts of the ecosystem is thus rated as good.
Although it is difficult to relate specific levels of increase in primary production to specific ecosystem changes, it seems likely that the level of change in primary production observed up to 2017 for the entire Arctic part of the Barents Sea (i.e., both Norwegian and Russian sector) is sufficient to trigger changes of ecosystem significance.
Knowledge gaps include a need for better in situ and autonomous measurements and estimates of the ratio of new to regenerated production, better insight into changes in phytoplankton/ice algal bloom phenology and the impact of changes in algal community composition on annual primary production and trophic transfer, and a need for better high spatial resolution models with high-quality atmospheric and sea-ice forcing.
References
Arrigo, K. R., and van Dijken, G. L. 2015. Continued increases in Arctic Ocean primary production. Progress in Oceanography, 136: 60-70.
Barber, D. G., Hop, H., Mundy, C. J., Else, B., Dmitrenko, I. A., Tremblay, J. É., Ehn, J. K., et al. 2015. Selected physical, biological and biogeochemical implications of a rapidly changing Arctic Marginal Ice Zone. Progress in Oceanography, 139: 122-150.
Bélanger, S., Babin, M., and Tremblay, J. É. 2013. Increasing cloudiness in Arctic damps the increase in phytoplankton primary production due to sea ice receding. Biogeosciences, 10: 4087-4101.
Chassot, E., Bonhommeau, S., Dulvy, N. K., Mélin, F., Watson, R., Gascuel, D., and Le Pape, O. 2010. Global marine primary production constrains fisheries catches. Ecology Letters, 13: 495-505.
Chassot, E., Mélin, F., Le Pape, O., and Gascuel, D. 2007. Bottom-up control regulates fisheries production at the scale of eco-regions in European seas. Marine Ecology Progress Series, 343: 45-55.
Dalpadado, P., Arrigo, K. R., Hjøllo, S. S., Rey, F., Ingvaldsen, R. B., Sperfeld, E., van Dijken, G. L., et al. 2014. Productivity in the Barents Sea - Response to recent climate variability. Plos One, 9.
Dalpadado, P., Arrigo, K. R., van Dijken, G. L., Skjoldal, H. R., Bagøien, E., Dolgov, A., Prokopchuk, I., et al. 2020. Climate effects on temporal and spatial dynamics of phytoplankton and zooplankton in the Barents Sea. Progress in Oceanography, 185: 102320.
Doney, S. C., Ruckelshaus, M., Duffy, J. E., Barry, J. P., Chan, F., English, C. A., Galindo, H. M., et al. 2012. Climate change impacts on marine ecosystems. Annual Review of Marine Science, 4: 11-37.
Daase, M., Berge, J., Søreide, J. E., and Falk-Petersen, S. 2021. Ecology of Arctic Pelagic Communities. In Arctic Ecology, pp. 219-259. Ed. by D. Thomas. John Wiley & Sons Ltd.
Eriksen, E., Skjoldal, H. R., Gjosaeter, H., and Primicerio, R. 2017. Spatial and temporal changes in the Barents Sea pelagic compartment during the recent warming. Progress in Oceanography, 151: 206-226.
Iverson, R. L. 1990. Control of marine fish production. Limnology and Oceanography, 35: 1593-1604.
Kjesbu, O. S., Bogstad, B., Devine, J. A., Gjøsæter, H., Howell, D., Ingvaldsen, R. B., Nash, R. D. M., et al. 2014. Synergies between climate and management for Atlantic cod fisheries at high latitudes. Proceedings of the National Academy of Sciences of the United States of America, 111: 3478-3483.
Lewis, K. M., van Dijken, G. L., and Arrigo, K. R. 2020. Changes in phytoplankton concentration now drive increased Arctic Ocean primary production. Science, 369: 198-202.
Lind, S., Ingvaldsen, R. B., and Furevik, T. 2018. Arctic warming hotspot in the northern Barents Sea linked to declining sea-ice import. Nature Climate Change.
Lund-Hansen, L. C., Hawes, I., Hancke, K., Salmansen, N., Nielsen, J. R., Balslev, L., and Sorrell, B. K. 2020. Effects of increased irradiance on biomass, photobiology, nutritional quality, and pigment composition of Arctic sea ice algae. Marine Ecology Progress Series, 648: 95-110.
Mueter, F. J., Planque, B., Hunt, G. L., Alabia, I. D., Hirawake, T., Eisner, L., Dalpadado, P., et al. 2021. Possible future scenarios in the gateways to the Arctic for Subarctic and Arctic marine systems: II. prey resources, food webs, fish, and fisheries. ICES Journal of Marine Science, 78: 3017–3045.
Neukermans, G., Oziel, L., and Babin, M. 2018. Increased intrusion of warming Atlantic Water leads to rapid expansion of temperate phytoplankton in the Arctic. Glob Chang Biol, 24: 2545-2553.
Orkney, A., Platt, T., Narayanaswamy, B. E., Kostakis, I., and Bouman, H. A. 2020. Bio-optical evidence for increasing Phaeocystis dominance in the Barents Sea. Philosophical Transactions of the Royal Society A: Mathematical, Physical and Engineering Sciences, 378: 20190357.
Oziel, L., Baudena, A., Ardyna, M., Massicotte, P., Randelhoff, A., Sallée, J. B., Ingvaldsen, R. B., et al. 2020. Faster Atlantic currents drive poleward expansion of temperate phytoplankton in the Arctic Ocean. Nature Communications, 11: 1705.
Randelhoff, A., Sundfjord, A., and Reigstad, M. 2015. Seasonal variability and fluxes of nitrate in the surface waters over the Arctic shelf slope. Geophysical Research Letters, 42: 3442-3449.
Selz, V., Saenz, B. T., van Dijken, G. L., and Arrigo, K. R. 2018. Drivers of ice algal bloom variability between 1980 and 2015 in the Chukchi Sea. Journal of Geophysical Research: Oceans, 123: 7037-7052.
Tremblay, J.-É., Anderson, L. G., Matrai, P., Coupel, P., Bélanger, S., Michel, C., and Reigstad, M. 2015. Global and regional drivers of nutrient supply, primary production and CO2 drawdown in the changing Arctic Ocean. Progress in Oceanography, 139: 171-196.
Ware, D. M., and Thomson, R. E. 2005. Bottom-up ecosystem trophic dynamics determine fish production in the Northeast Pacific. Science, 308: 1280-1284.
Wassmann, P., Slagstad, D., and Ellingsen, I. 2010. Primary production and climatic variability in the European sector of the Arctic Ocean prior to 2007: preliminary results. Polar Biology, 33: 1641-1650.
Yool, A., Popova, E. E., and Coward, A. C. 2015. Future change in ocean productivity: Is the Arctic the new Atlantic? Journal of Geophysical Research: Oceans, 120: 7771-7790.
Timing of spring bloom [AI02]
Phenomenon: Earlier start of the spring bloom [AP02]
Ecosystem characteristic: Primary productivity
The description of the indicator under the reference condition is as given for the phenomenon for annual primary productivity [AP01].
The most important anthropogenic driver of change in this indicator is climate change. As light availability influences the start of the spring bloom, climate change acting through decreased sea-ice cover is a key driver. In addition to availability of light, retreat of the sea ice also affects the near-surface stratification by the release of freshwater at the surface, which positively influences the bloom (Hunt et al., 2011; Wassmann and Reigstad, 2011; Chierici et al., 2019). Satellite observations have shown an earlier spring bloom timing for the Arctic part of the Barents Sea of nearly one month (looking across both the Norwegian and the Russian sector, Dalpadado et al., 2020). Extensive under-ice phytoplankton blooms have been attributed to improved light conditions below sea ice as a result of thinner sea ice and increased melt pond and lead fractions (Arrigo et al., 2012; Assmy et al., 2017; Ardyna et al., 2020). Although direct evidence is currently lacking (Mueter et al., 2021), both observational (Ardyna and Arrigo, 2020) and modelling evidence (Horvat et al., 2017) point towards increased under-ice production. Given the evidence, the understanding of the link between driver (climate change) and the indicator is rated as certain.
Altered timing of the spring bloom may result in mismatches between phytoplankton and zooplankton grazers, which may affect zooplankton production and other parts of the ecosystem (Mueter et al., 2021). Examples of this include a mismatch between Calanus hyperboreus reproduction and the diatom bloom in the Beaufort Sea with consequences for Calanus hyperboreus production (Dezutter et al., 2019) as well as a mismatch between the ice algal bloom and Calanus glacialis reproduction in a high-Arctic fjord (Søreide et al., 2010). The current understanding of the importance of changes in the indicator for other parts of the ecosystem can be rated as good.
Too little is known about how a given change in spring bloom timing would affect the rest of the ecosystem to evaluate how large changes should be for effects with ecosystem significance to occur.
Knowledge gaps include a need for better and more seasonal in situ measurements, development of high spatial resolution models and sufficient time/space resolving of remote sensing and autonomous platform data.
References
Ardyna, M., and Arrigo, K. R. 2020. Phytoplankton dynamics in a changing Arctic Ocean. Nature Climate Change, 10: 892-903.
Ardyna, M., Mundy, C. J., Mayot, N., Matthes, L. C., Oziel, L., Horvat, C., Leu, E., et al. 2020. Under ice phytoplankton blooms: Shedding light on the "invisible" part of Arctic primary production. Frontiers in Marine Science, 7.
Arrigo, K. R., Perovich, D. K., Pickart, R. S., Brown, Z. W., van Dijken, G. L., Lowry, K. E., Mills, M. M., et al. 2012. Massive Phytoplankton Blooms Under Arctic Sea Ice. Science, 336: 1408-1408.
Assmy, P., Fernandez-Mendez, M., Duarte, P., Meyer, A., Randelhoff, A., Mundy, C. J., Olsen, L. M., et al. 2017. Leads in Arctic pack ice enable early phytoplankton blooms below snow-covered sea ice. Scientific Reports, 7.
Chierici, M., Vernet, M., Fransson, A., and Børsheim, K. Y. 2019. Net community production and carbon exchange from winter to summer in the Atlantic Water inflow to the Arctic Ocean. Frontiers in Marine Science, 6.
Dalpadado, P., Arrigo, K. R., van Dijken, G. L., Skjoldal, H. R., Bagøien, E., Dolgov, A., Prokopchuk, I., et al. 2020. Climate effects on temporal and spatial dynamics of phytoplankton and zooplankton in the Barents Sea. Progress in Oceanography, 185: 102320.
Dezutter, T., Lalande, C., Dufresne, C., Darnis, G., and Fortier, L. 2019. Mismatch between microalgae and herbivorous copepods due to the record sea ice minimum extent of 2012 and the late sea ice break-up of 2013 in the Beaufort Sea. Progress in Oceanography, 173: 66-77.
Daase, M., Berge, J., Søreide, J. E., and Falk-Petersen, S. 2021. Ecology of Arctic Pelagic Communities. In Arctic Ecology, pp. 219-259. Ed. by D. Thomas. John Wiley & Sons Ltd.
Horvat, C., Jones, D. R., Iams, S., Schroeder, D., Flocco, D., and Feltham, D. 2017. The frequency and extent of sub-ice phytoplankton blooms in the Arctic Ocean. Science Advances, 3: e1601191.
Hunt, G. L., Jr, Coyle, K. O., Eisner, L. B., Farley, E. V., Heintz, R. A., Mueter, F., Napp, J. M., et al. 2011. Climate impacts on eastern Bering Sea foodwebs: a synthesis of new data and an assessment of the Oscillating Control Hypothesis. ICES Journal of Marine Science, 68: 1230-1243.
Mueter, F. J., Planque, B., Hunt, G. L., Alabia, I. D., Hirawake, T., Eisner, L., Dalpadado, P., et al. 2021. Possible future scenarios in the gateways to the Arctic for Subarctic and Arctic marine systems: II. prey resources, food webs, fish, and fisheries. ICES Journal of Marine Science, 78: 3017–3045.
Søreide, J. E., Leu, E., Berge, J., Graeve, M., and Falk-Petersen, S. 2010. Timing of blooms, algal food quality and Calanus glacialis reproduction and growth in a changing Arctic. Global Change Biology, 16: 3154-3163.
Wassmann, P., and Reigstad, M. 2011. Future Arctic Ocean seasonal ice zones and implications for pelagic-benthic coupling. Oceanography 24: 220-231.
Zooplankton TL < 2.5 [AI03]
Phenomenon: Increasing biomass of zooplankton that is predominantly herbivorous [AP03]
Ecosystem characteristic: Biomass distribution among trophic levels
Under the reference condition, the biomass and turnover of herbivorous zooplankton are large enough to support the community of Arctic predators that depend on lipid rich food sources, such as polar cod (Boreogadus saida), little auk (Alle alle) and bowhead whale (Balaena mysticetus) (Steen et al., 2007; Rogachev et al., 2008; Planque et al., 2014; Eriksen et al., 2020). Lipid-rich copepods such as Calanus glacialis and Calanus hyperboreus dominate the herbivorous mesozooplankton community in terms of biomass (Søreide et al., 2010; Eriksen et al., 2017; Aarflot et al., 2018; Hop et al., 2019; Dalpadado et al., 2020; Daase et al., 2021; Mueter et al., 2021), while several smaller herbivorous and omnivorous copepods dominate the Arctic mesozooplankton community in terms of numbers but contribute less to the biomass. Other larger herbivorous macrozooplankton such as euphausiids (krill) of the genus Thysanoessa are more dominant in the Sub-Arctic region and not an important component in the Arctic part under the reference condition (Dalpadado and Skjoldal, 1991; Søreide et al., 2003; Dalpadado et al., 2020). The pteropods Limacina helicina and Clione limacina, chaetognaths Parasagitta elegans and Eukrohnia hamata, ctenophores Mertensia ovum and Beroe cucumis, and cnidarians Aglantha digitale and Sarsia sp. are also important components of Arctic zooplankton communities (Søreide et al., 2003), as are pelagic hyperiid amphipod Themisto libellula (Koszteyn et al., 1995; Dalpadado et al., 2012, 2020), but most of these species are primarily omnivorous or carnivorous.
The most important anthropogenic driver of change in this indicator is climate change, causing increased water temperature and increased influx of Atlantic water masses (i.e., Atlantification) in the central and northern parts of the Barents Sea (Årthun et al., 2012, 2019; Ingvaldsen et al., 2021). This leads to changes in sea-ice cover and bloom phenology, expanding the productive season for resident species and making the region more habitable for boreal species from the south. The abundance of krill and small mesozooplankton have increased, whereas the abundance of large Arctic mesozooplankton have decreased during the last three decades (looking across both the Norwegian and the Russian sector, Eriksen and Dalpadado, 2011; Eriksen, 2017; Dalpadado et al., 2020). Effects of climate change on many aspects of the zooplankton community are known, in particular a tendency for biomass of large Arctic mesozooplankton to decrease and biomass of smaller Sub-Arctic mesozooplankton e.g., C. finmarchicus and euphausiids (in particular T. inermis) to increase (Eriksen et al., 2017; Hop et al., 2019; Stige et al., 2019; Dalpadado et al., 2020; Daase et al., 2021; Mueter et al., 2021). The indicator includes biomass of both mesozooplankton and krill, and although the opposing trends described above are likely to result in increased total biomass of herbivorous zooplankton, considerable uncertainties are associated with this. The understanding of the link to drivers should therefore be rated as less certain.
A large increase in the biomass of krill and small mesozooplankton (which is not offset by a decrease in large Arctic mesozooplankton) can have large effects on the predator community, possibly benefitting Sub-Arctic/boreal species, such as capelin (Mallotus villosus) (Dalpadado and Mowbray, 2013). This can have (indirect) effects on Arctic species that function as prey for these boreal predators (Stige et al., 2018). Even though we know much about trophic interactions and the importance of euphausiids, there are still many unknowns, for example how Arctic species may be affected indirectly from increased abundance of boreal predators (Johannesen et al., 2020), and indeed also the importance of increased biomass of krill for the boreal predators (Eriksen et al., 2017). The understanding of the importance of changes in the indicator for other parts of the ecosystem is thus rated as less good.
Knowledge gaps include lack of long-term data to assess changes in community structure with climate change and limited understanding of northwards extension of krill.
References
Aarflot, J. M., Skjoldal, H. R., Dalpadado, P., and Skern-Mauritzen, M. 2018. Contribution of Calanus species to the mesozooplankton biomass in the Barents Sea. ICES Journal of Marine Science, 75: 2342-2354.
Dalpadado, P., Arrigo, K. R., van Dijken, G. L., Skjoldal, H. R., Bagøien, E., Dolgov, A., Prokopchuk, I., et al. 2020. Climate effects on temporal and spatial dynamics of phytoplankton and zooplankton in the Barents Sea. Progress in Oceanography, 185: 102320.
Dalpadado, P., Ingvaldsen, R. B., Stige, L. C., Bogstad, B., Knutsen, T., Ottersen, G., and Ellertsen, B. 2012. Climate effects on Barents Sea ecosystem dynamics. ICES Journal of Marine Science, 69: 1303-1316.
Dalpadado, P., and Mowbray, F. 2013. Comparative analysis of feeding ecology of capelin from two shelf ecosystems, off Newfoundland and in the Barents Sea. Progress in Oceanography, 114: 97-105.
Dalpadado, P., and Skjoldal, H. R. 1991. Distribution and life-history of krill from the Barents Sea. Polar Research, 10: 443-460.
Daase, M., Berge, J., Søreide, J. E., and Falk-Petersen, S. 2021. Ecology of Arctic Pelagic Communities. In Arctic Ecology, pp. 219-259. Ed. by D. Thomas. John Wiley & Sons Ltd.
Eriksen, E. 2017. Dynamics of the Barents Sea pelagic compartment: species distributions, interactions and response to climate variability. p. 93. University of Bergen.
Eriksen, E., Benzik, A. N., Dolgov, A. V., Skjoldal, H. R., Vihtakari, M., Johannesen, E., Prokhorova, T. A., et al. 2020. Diet and trophic structure of fishes in the Barents Sea: The Norwegian-Russian program “Year of stomachs” 2015 – Establishing a baseline. Progress in Oceanography, 183: 102262.
Eriksen, E., and Dalpadado, P. 2011. Long-term changes in Krill biomass and distribution in the Barents Sea: are the changes mainly related to capelin stock size and temperature conditions? Polar Biology, 34: 1399-1409.
Eriksen, E., Skjoldal, H. R., Gjøsæter, H., and Primicerio, R. 2017. Spatial and temporal changes in the Barents Sea pelagic compartment during the recent warming. Progress in Oceanography, 151: 206-226.
Hop, H., Wold, A., Vihtakari, M., Daase, M., Kwasniewski, S., Gluchowska, M., Lischka, S., et al. 2019. Zooplankton in Kongsfjorden (1996–2016) in relation to climate change. In The Ecosystem of Kongsfjorden, Svalbard, pp. 229-300. Ed. by H. Hop, and C. Wiencke. Springer International Publishing, Cham.
Ingvaldsen, R. B., Assmann, K. A., Primicerio, R., Fossheim, M., Polyakov, I. V., and Dolgov, R. 2021. Physical manifestations and ecological implications of Arctic Atlantification. Nature Reviews Earth and Environment.
Johannesen, E., Yoccoz, N. G., Tveraa, T., Shackell, N. L., Ellingsen, K. E., Dolgov, A. V., and Frank, K. T. 2020. Resource-driven colonization by cod in a high Arctic food web. Ecology and Evolution, 10: 14272-14281.
Koszteyn, J., Timofeev, S., Weslawski, J. M., and Urban-Malinga, B. 1995. Size structure of Themisto abyssorum (Boeck) and Themisto libellula (Mandt) populations in European Arctic seas. Polar Biology, 15: 85-92.
Mueter, F. J., Planque, B., Hunt Jr., G. L., Alabia, I. D., Hirawake, T., Eisner, L., Dalpadado, P., et al. 2021. Possible future scenarios in the gateways to the Arctic for Subarctic and Arctic marine systems: II. prey resources, food webs, fish, and fisheries. ICES Journal of Marine Science.
Planque, B., Primicerio, R., Michalsen, K., Aschan, M., Certain, G., Dalpadado, P., Gjøsæter, H., et al. 2014. Who eats whom in the Barents Sea: a food web topology from plankton to whales. Ecology, 95: 1430-1430.
Rogachev, K. A., Carmack, E. C., and Foreman, M. G. G. 2008. Bowhead whales feed on plankton concentrated by estuarine and tidal currents in Academy Bay, Sea of Okhotsk. Continental Shelf Research, 28: 1811-1826.
Steen, H., Vogedes, D., Broms, F., Falk-Petersen, S., and Berge, J. 2007. Little auks (Alle alle) breeding in a High Arctic fjord system: bimodal foraging strategies as a response to poor food quality? Polar Research, 26: 118-125.
Stige, L. C., Eriksen, E., Dalpadado, P., and Ono, K. 2019. Direct and indirect effects of sea ice cover on major zooplankton groups and planktivorous fishes in the Barents Sea. ICES Journal of Marine Science, 76: I24-I36.
Stige, L. C., Kvile, K. O., Bogstad, B., and Langangen, O. 2018. Predator-prey interactions cause apparent competition between marine zooplankton groups. Ecology, 99: 632-641.
Søreide, J. E., Hop, H., Falk-Petersen, S., Gulliksen, B., and Hansen, E. 2003. Macrozooplankton communities and environmental variables in the Barents Sea marginal ice zone in late winter and spring. Marine Ecology Progress Series, 263: 43-64.
Søreide, J. E., Leu, E., Berge, J., Graeve, M., and Falk-Petersen, S. 2010. Timing of blooms, algal food quality and Calanus glacialis reproduction and growth in a changing Arctic. Global Change Biology, 16: 3154-3163.
Årthun, M., Eldevik, T., and Smedsrud, L. H. 2019. The role of Atlantic heat transport in future Arctic winter sea ice loss. Journal of Climate, 32: 3327-3341.
Årthun, M., Eldevik, T., Smedsrud, L. H., Skagseth, Ø., and Ingvaldsen, R. B. 2012. Quantifying the influence of Atlantic heat on Barents Sea ice variability and retreat. Journal of Climate, 25: 4736-4743.
Zooplankton TL > 2.5 [AI04]
Phenomenon: Change in biomass of zooplankton that is predominantly carnivorous [AP04]
Ecosystem characteristic: Biomass distribution among trophic levels
Under the reference condition, the zooplankton community is dominated by large and lipid-rich species that occur in biomasses large enough to sustain the community of Arctic predators, including polar cod, little auk and bowhead whales (Steen et al., 2007; Rogachev et al., 2008; Planque et al., 2014; Eriksen et al., 2020). Examples of carnivorous zooplankton that would be important under the reference condition include Arctic pelagic amphipods, particularly Themisto libellula (Zhukova et al., 2009; Stige et al., 2019; Dalpadado et al., 2020), which functions as an important link between the herbivorous zooplankton prey and predators such as polar cod, black legged kittiwake (Rissa tridactyla), little auk, and seals (Auel et al., 2002; Falk-Petersen et al., 2004; Marion et al., 2008; Renaud et al., 2012; Nahrgang et al., 2014; Vihtakari et al., 2018). Chaetognaths also contribute significantly to the biomass of carnivorous zooplankton under the reference condition (Søreide et al., 2003; Grigor et al., 2017). Three chaetognath species are frequently reported in Arctic plankton surveys. Parasagitta elegans is a neritic species, abundant in epipelagic waters. Eukrohnia hamata is abundant in meso-pelagic and deep waters. The largest species, Pseudosagitta maxima (up to 90 mm) is typically bathy-pelagic but may also occur near the surface in the Arctic. Carnivorous krill do not contribute to the zooplankton community under the reference condition, as the predominantly carnivorous krill species in the Barents Sea, Meganyctiphanes norvegica, is mainly associated with advected Atlantic water masses in the southwest of the area under the reference condition (Dalpadado et al., 1998). The reference condition is also characterized by occurrences of gelatinous zooplankton (Falk-Petersen et al., 2002; Lundberg et al., 2006). It has been estimated that Mertensia ovum can consume up to 9% of the standing biomass of copepods in the Barents Sea per day when ctenophores were present (Swanberg and Bamstedt, 1991). However, much is unknown about this group and, consequently, uncertainties exist in our understanding of their role in the ecosystem under the reference condition (Eriksen et al., 2012; Eriksen et al., 2018).
The most important anthropogenic driver of change in the indicator is climate change. Climate change will lead to a northward expansion of Sub-Arctic and boreal species, including krill species, and a decline of Arctic species, such as pelagic amphipods (Eriksen, 2017; Hop et al., 2019; Stige et al., 2019; Dalpadado et al., 2020). Climate change may also favor gelatinous zooplankton, but there are large uncertainties associated with this (Eriksen et al., 2012, 2018). The indicator is made up of biomass of amphipods and gelatinous zooplankton, and it is difficult to predict the outcome of the opposing and partly uncertain trends for these two groups. The phenomenon is therefore stated as any change and not a directional one. The understanding of the link between the drivers and changes in the indicator is consequently rated as less certain.
Substantial changes in biomass of the carnivorous zooplankton community will likely have significant effects on the dynamics of at least parts of the ecosystem. For example, if the change is brought about by a decrease in biomass of pelagic amphipods, this can have negative effects on the lipid-dependent predator communities in the Arctic (Dalpadado et al., 2001, 2016; Descamps et al., 2017; Hop and Wiencke, 2019; ICES, 2020). As changes in other groups, such as gelatinous zooplankton (Eriksen et al., 2012, 2018) can have other effects, the overall effects of change in the indictor are hard to predict, and the understating of the importance of changes in the indicator for other parts of the ecosystem is thus rated as less good.
Knowledge gaps include lack of long-term data to assess changes in community composition and poor understanding of life history adaptations and vulnerabilities in gelatinous taxa. It should be noted that only the larger gelatinous zooplankton are currently monitored.
References
Auel, H., Harjes, M., da Rocha, R., Stubing, D., and Hagen, W. 2002. Lipid biomarkers indicate different ecological niches and trophic relationships of the Arctic hyperiid amphipods Themisto abyssorum and T. libellula. Polar Biology, 25: 374-383.
Dalpadado, P., Arrigo, K. R., van Dijken, G. L., Skjoldal, H. R., Bagøien, E., Dolgov, A., Prokopchuk, I., et al. 2020. Climate effects on temporal and spatial dynamics of phytoplankton and zooplankton in the Barents Sea. Progress in Oceanography, 185: 102320.
Dalpadado, P., Borkner, N., Bogstad, B., and Mehl, S. 2001. Distribution of Themisto (Amphipoda) spp in the Barents Sea and predator-prey interactions. ICES Journal of Marine Science, 58: 876-895.
Dalpadado, P., Ellertsen, B., Melle, W., and Skjoldal, H. R. 1998. Summer distribution patterns and biomass estimates of macrozooplankton and micronekton in the Nordic Seas. Sarsia, 83: 103-116.
Dalpadado, P., Hop, H., Rønning, J., Pavlov, V., Sperfeld, E., Buchholz, F., Rey, A., et al. 2016. Distribution and abundance of euphausiids and pelagic amphipods in Kongsfjorden, Isfjorden and Rijpfjorden (Svalbard) and changes in their relative importance as key prey in a warming marine ecosystem. Polar Biology, 39: 1765-1784.
Descamps, S., Aars, J., Fuglei, E., Kovacs, K. M., Lydersen, C., Pavlova, O., Pedersen, A. O., et al. 2017. Climate change impacts on wildlife in a High Arctic archipelago - Svalbard, Norway. Global Change Biology, 23: 490-502.
Eriksen, E. 2017. Dynamics of the Barents Sea pelagic compartment: species distributions, interactions and response to climate variability. p. 93. University of Bergen.
Eriksen, E., Benzik, A. N., Dolgov, A. V., Skjoldal, H. R., Vihtakari, M., Johannesen, E., Prokhorova, T. A., et al. 2020. Diet and trophic structure of fishes in the Barents Sea: The Norwegian-Russian program “Year of stomachs” 2015 – Establishing a baseline. Progress in Oceanography, 183: 102262.
Eriksen, E., Bogstad, B., Dolgov, A., and Beck, I. M. 2018. Cod diet as an indicator of Ctenophora abundance dynamics in the Barents Sea. Marine Ecology Progress Series, 591: 87-100.
Eriksen, E., Prozorkevich, D., Trofimov, A., and Howell, D. 2012. Biomass of scyphozoan jellyfish, and its spatial association with 0-group fish in the Barents Sea. Plos One, 7.
Falk-Petersen, S., Dahl, T. M., Scott, C. L., Sargent, J. R., Gulliksen, B., Kwasniewski, S., Hop, H., et al. 2002. Lipid biomarkers and trophic linkages between ctenophores and copepods in Svalbard waters. Marine Ecology Progress Series, 227: 187-194.
Falk-Petersen, S., Haug, T., Nilssen, K. T., Wold, A., and Dahl, T. M. 2004. Lipids and trophic linkages in harp seal (Phoca groenlandica) from the eastern Barents Sea. Polar Research, 23: 43-50.
Grigor, J. J., Schmid, M. S., and Fortier, L. 2017. Growth and reproduction of the chaetognaths Eukrohnia hamata and Parasagitta elegans in the Canadian Arctic Ocean: capital breeding versus income breeding. Journal of Plankton Research, 39: 910-929.
Hop, H., and Wiencke, C. 2019. The Ecosystem of Kongsfjorden, Svalbard. In Advances in Polar Ecology. Springer, Cham, Zwitzerland.
Hop, H., Wold, A., Vihtakari, M., Daase, M., Kwasniewski, S., Gluchowska, M., Lischka, S., et al. 2019. Zooplankton in Kongsfjorden (1996–2016) in relation to climate change. In The Ecosystem of Kongsfjorden, Svalbard, pp. 229-300. Ed. by H. Hop, and C. Wiencke. Springer International Publishing, Cham.
ICES. 2020. Working Group on the Integrated Assessments of the Barents Sea (WGIBAR). ICES Scientific Reports. 2:30. 206 pp.
Lundberg, M., Hop, H., Eiane, K., Gulliksen, B., and Falk-Petersen, S. 2006. Population structure and accumulation of lipids in the ctenophore Mertensia ovum. Marine Biology, 149: 1345-1353.
Marion, A., Harvey, M., Chabot, D., and Brêthes, J. C. 2008. Feeding ecology and predation impact of the recently established amphipod, Themisto libellula, in the St. Lawrence marine system, Canada. Marine Ecology Progress Series, 373: 53-70.
Nahrgang, J., Varpe, Ø., Korshunova, E., Murzina, S., Hallanger, I. G., Vieweg, I., and Berge, J. 2014. Gender specific reproductive strategies of an Arctic key species (Boreogadus saida) and implications of climate change. Plos One, 9: e98452.
Planque, B., Primicerio, R., Michalsen, K., Aschan, M., Certain, G., Dalpadado, P., Gjøsæter, H., et al. 2014. Who eats whom in the Barents Sea: a food web topology from plankton to whales. Ecology, 95: 1430-1430.
Renaud, P. E., Berge, J., Varpe, Ø., Lønne, O. J., Nahrgang, J., Ottesen, C., and Hallanger, I. 2012. Is the poleward expansion by Atlantic cod and haddock threatening native polar cod, Boreogadus saida ? Polar Biology, 35: 401-412.
Rogachev, K. A., Carmack, E. C., and Foreman, M. G. G. 2008. Bowhead whales feed on plankton concentrated by estuarine and tidal currents in Academy Bay, Sea of Okhotsk. Continental Shelf Research, 28: 1811-1826.
Steen, H., Vogedes, D., Broms, F., Falk-Petersen, S., and Berge, J. 2007. Little auks (Alle alle) breeding in a High Arctic fjord system: bimodal foraging strategies as a response to poor food quality? Polar Research, 26: 118-125.
Stige, L. C., Eriksen, E., Dalpadado, P., and Ono, K. 2019. Direct and indirect effects of sea ice cover on major zooplankton groups and planktivorous fishes in the Barents Sea. ICES Journal of Marine Science, 76: I24-I36.
Swanberg, N., and Bamstedt, U. 1991. Ctenophora in the Arctic—the abundance, distribution and predatory impact of the cydippid ctenophore Mertensia ovum (Fabricius) in the Barents Sea. Polar Research, 10: 507-524.
Søreide, J. E., Hop, H., Falk-Petersen, S., Gulliksen, B., and Hansen, E. 2003. Macrozooplankton communities and environmental variables in the Barents Sea marginal ice zone in late winter and spring. Marine Ecology Progress Series, 263: 43-64.
Vihtakari, M., Welcker, J., Moe, B., Chastel, O., Tartu, S., Hop, H., Bech, C., et al. 2018. Black-legged kittiwakes as messengers of Atlantification in the Arctic. Scientific Reports, 8: 1178.
Zhukova, N. G., Nesterova, V. N., Prokopchuk, I. P., and Rudneva, G. B. 2009. Winter distribution of euphausiids (Euphausiacea) in the Barents Sea (2000–2005). Deep Sea Research II, 56: 1959-1967.
Benthic suspensivores [AI05]
Phenomenon: Change in biomass of suspension feeding species [AP05]
Ecosystem characteristic: Biomass distribution among trophic levels
A description of the state of the indicator under reference conditions can be done but need more work (see e.g., Jørgensen et al., 2022).
The most important anthropogenic driver of change in this indicator may be climate change, which can directly and indirectly affect the phenology, quality, and quantity of phytodetritus reaching the seafloor. This is expected to occur due to changes in light climate due to altered ice cover (extent, thickness, seasonality). It has been shown, for example, that coastal Arctic benthic compartment production is tightly linked to surface primary production and ice cover (Tremblay et al., 2011). Trawling will likely also lead to this phenomenon (Jørgensen et al., 2015, 2019) as it would tend to reduce the biomass of those generally tall animals, more easily captured by the bottom trawls. In addition, potentially increased importance of advection/establishment of more southern phytoplankton taxa and/or elevated grazing by zooplankton may result in possibly lower likelihood of phytodetritus reaching the seafloor. The link to trawling needs to be verified through testing of existing data and for now is moderately certain. The role of climatic change for biomass distribution for benthic suspensivores is less certain. Thus, the knowledge about overall link of the indicator to the drivers is rated as less certain.
Suspension-feeding benthos such as sponges, bryozoans, hydroids, some sea cucumbers, and other species make up local large biomass of the seabed fauna (Kędra et al., 2013). Epibenthos plays a major role in the carbon cycling of the Arctic ecosystems (Grebmeier et al., 1995; Klages et al., 2004), thus suspension feeders may be central for the functioning in the ecosystem. Such local biomass accumulations with complex, large-bodied species may be refuge and feeding areas for fish and other benthic invertebrates (Kędra et al., 2015). The understanding of the importance for other parts of the ecosystem of decreasing proportion of suspension feeding biomass is moderately good.
The ecosystem significance of decreasing proportion of suspension feeding biomass has not been verified for the Barents Sea, but the effect of structure-forming corals and sponges and their use as fish habitat have been described for the Bering Sea submarine canyons (Miller et al., 2012), and effects on fish habitat and general support of higher biodiversity are expected to be similar for Norwegian cold-water coral habitats.
References
Grebmeier, J. M., Smith Jr., W. O., and Conover, R. J. 1995. Biological Processes on Arctic Continental Shelves: Ice-Ocean-Biotic Interactions. In Arctic Oceanography: Marginal Ice Zones and Continental Shelves, pp. 231–261. American Geophysical Union (AGU). https://onlinelibrary.wiley.com/doi/abs/10.1029/CE049p0231 (Accessed 9 November 2021).
Jørgensen, L. L.., Ljubin, P., Skjoldal, H. R., Ingvaldsen, R. B., Anisimova, N., and Manushin, I. 2015. Distribution of benthic megafauna in the Barents Sea: baseline for an ecosystem approach to management. ICES Journal of Marine Science, 72: 595–613.
Jørgensen, L. L.., Primicerio, R., Ingvaldsen, R. B., Fossheim, M., Strelkova, N., Thangstad, T. H., Manushin, I., et al. 2019. Impact of multiple stressors on sea bed fauna in a warming Arctic. Marine Ecology Progress Series, 608: 1–12.
Jørgensen, L.L., Pecuchet, L., Ingvaldsen, R.B., Primicerio, R. 2022. Benthic transition zones in the Atlantic gateway to a changing Arctic Ocean, Progress in Oceanograph y. https://doi.org/10.1016/j.pocean.2022.102792
Kędra, M., Renaud, P. E., Andrade, H., Goszczko, I., and Ambrose Jr, W. G. 2013. Benthic community structure, diversity, and productivity in the shallow Barents Sea bank (Svalbard Bank). Marine Biology, 160: 805–819.
Kędra, M., Moritz, C., Choy, E. S., David, C., Degen, R., Duerksen, S., Ellingsen, I., et al. 2015. Status and trends in the structure of Arctic benthic food webs. Polar Research, 34: 23775. Routledge.
Klages, M., Boetius, A., Christensen, J. P., Deubel, H., Piepenburg, D., Schewe, I., and Soltwedel, T. 2004. The Benthos of Arctic Seas and its Role for the Organic Carbon Cycle at the Seafloor. The Organic Carbon Cycle in the Arctic Ocean: 139–167. Springer, Berlin, Heidelberg.
Miller, R. J., Hocevar, J., Stone, R. P., and Fedorov, D. V. 2012. Structure-forming corals and sponges and their use as fish habitat in Bering Sea submarine anyons. PLOS ONE, 7: e33885. Public Library of Science.
Tremblay, J.-É., Bélanger, S., Barber, D. G., Asplin, M., Martin, J., Darnis, G., Fortier, L., et al. 2011. Climate forcing multiplies biological productivity in the coastal Arctic Ocean. Geophysical Research Letters, 38. https://onlinelibrary.wiley.com/doi/abs/10.1029/2011GL048825 (Accessed 9 November 2021).
0 group fish [AI06]
Phenomenon: Increasing biomass of 0-group fish (except for polar cod) [AP06]
Ecosystem characteristic: Biomass distribution among trophic levels
Under the reference condition, the biomass of 0-group fish is large enough to support predator populations dependent on these fish larvae as prey, and also large enough to ensure sufficiently high recruitment to sustain the fish stocks themselves.
The most important anthropogenic driver of change in this indicator in the Arctic Barents Sea is climate change, through direct effects on their distribution and abundance. Larger areas of Atlantic water masses will lead to larger occupation area of 0-group cod, haddock and capelin (Eriksen et al., 2017). In the Arctic, the 2016 heatwave with the largest area of Atlantic and Mixed water masses was associated with high abundances of herring, haddock and capelin (ICES, 2020). However, it is suspected that higher temperature and lack of sea ice during the egg stage could be critical for polar cod (Boreogadus saida) and lead to less successful recruitment at later stages (Eriksen et al., 2012, 2015; Huserbråten et al., 2019). Most species of 0-group fish are expected to increase in abundance with climate change, except for polar cod. The understanding of this link to climate change is assessed as certain.
The four most abundant 0-group fish species are capelin, cod, haddock and herring. Strong year classes of those species lead to increased growth in the stock of adults in the following years. Those species are key to the Barents Sea and have huge impacts on the ecosystem as prey (capelin and younger stage of cod, haddock and cod), plankton consumers (capelin and herring) and predators (herring, cod and haddock). In addition, the 0-group fish have a wide distribution in the entire Barents Sea and is an important part of the pelagic stock in the summer and early autumn (Eriksen et al., 2011). Because of their large consumption/biomass ratio, 0-group fish have a central role in the energy transfer across trophic levels and between regions. They are preyed upon by many piscivorous fish, birds and marine mammals (Barrett and Krasnov, 1996; Skaug et al., 1997; Dalpadado and Bogstad, 2004). The understanding of the importance of changes in the biomass of 0-group fish for other parts of the ecosystem is assessed as good.
References
Barrett, R. T., and Krasnov, Y. V. 1996. Recent responses to changes in stocks of prey species by seabirds breeding in the southern Barents Sea. ICES Journal of Marine Science, 53: 713-722.
Dalpadado, P., and Bogstad, B. 2004. Diet of juvenile cod (age 0-2) in the Barents Sea in relation to food availability and cod growth. Polar Biology, 27: 140-154.
Eriksen, E., Bogstad, B., and Nakken, O. 2011. Ecological significance of 0-group fish in the Barents Sea ecosystem. Polar Biology, 34: 647-657.
Eriksen, E., Ingvaldsen, R., Stiansen, J. E., and Johansen, G. O. 2012. Thermal habitat for 0-group fish in the Barents Sea; how climate variability impacts their density, length, and geographic distribution. ICES Journal of Marine Science, 69: 870-879.
Eriksen, E., Ingvaldsen, R. B., Nedreaas, K., and Prozorkevich, D. 2015. The effect of recent warming on polar cod and beaked redfish juveniles in the Barents Sea. Regional Studies in Marine Science, 2: 105-112.
Eriksen, E., Skjoldal, H. R., Gjøsæter, H., and Primicerio, R. 2017. Spatial and temporal changes in the Barents Sea pelagic compartment during the recent warming. Progress in Oceanography, 151: 206-226.
Huserbråten, M. B. O., Eriksen, E., Gjøsæter, H., and Vikebø, F. 2019. Polar cod in jeopardy under the retreating Arctic sea ice. Communications Biology, 2: article number: 407.
ICES. 2020. Working Group on the Integrated Assessments of the Barents Sea (WGIBAR). 2:30. 206 pp.
Skaug, H. J., Gjøsæter, H., Haug, T., Nilssen, K. T., and Lindstrøm, U. 1997. Do minke whales (Balaenoptera acutorostrata) exhibit particular prey preferences? J Northw Atl Fish Sci, 22: 91-104.
Pelagic planktivorous fish [AI07]
Phenomenon: Decreasing biomass of pelagic planktivorous fish [AP07]
Ecosystem characteristic: Biomass distribution among trophic levels
Under the reference condition, pelagic planktivorous fish stocks of capelin and polar cod are large enough to support viable populations of endemic Arctic predators (fish, seabirds and mammals) dependent on these species as prey.
The most important anthropogenic driver of change in biomass of pelagic planktivorous fish is climate change. Less sea ice will lead to a shift where less primary productivity will sink to the benthic habitat, and more is consumed by zooplankton in the pelagic water masses (Kedra et al., 2015). This will increase the productivity in the otherwise typically low-productive pelagic habitat in Arctic areas (Hobson et al., 1995; Wassmann and Reigstad, 2011). However, despite this possible increase in pelagic productivity and food availability for planktivorous species, polar cod and capelin are expected to be negatively affected by climate change. Polar cod is the only endemic planktivorous fish species in the Arctic Barents Sea and is expected to be negatively affected by climate change due to its close association and dependence on sea ice (Mueter et al., 2016; Huserbråten et al., 2019; Gjøsæter et al., 2020) (more details in the phenomenon for Capelin [AP23]). Corresponding direct effects from climate change on the capelin stock biomass are more uncertain, however it is expected and observed that capelin feeding grounds have expanded northwards (Carscadden et al., 2013). The biomass of these pelagic planktivorous species is also strongly affected by predation from young NSS herring (Gjøsæter and Bogstad, 1998; Huse and Toresen, 2000; Gjøsæter et al., 2016) and NEA cod (Bogstad et al., 2000; Johannesen et al., 2012; Fall et al., 2018). Predatory interactions with these species are expected to increase with climate change in the Arctic part of the Barents Sea due to northward changes in distribution and increased overlap (Gjøsæter and Bogstad, 1998; Fall et al., 2018). In addition to effects of climate change, the distribution of these predatory fish stocks is affected by fisheries and population size; cod typically spread more into the northern regions when populations are large (Johannesen et al., 2020). Thus, the overall effect from climate change on polar cod and capelin is expected to be negative, and the knowledge about link between driver and indicator is assessed as less certain.
Planktivorous fishes have a key role in top-down regulation of pelagic consumers (zooplankton), and are important for energy transfer to top predators, such as marine mammals, seabirds, and fish (Dolgov, 2002; Orlova et al., 2009; Sakshaug et al., 2009; Jakobsen and Ozhigin, 2011; Hop and Gjøsæter, 2013; Mueter et al., 2016). In particular, the polar cod is essential food for ice-associated mammals including ringed seals, narwhal and white whale as well as fish-eating Arctic seabirds such as Brünnich’s guillemot, black guillemot and Arctic fulmar (Hop and Gjøsæter, 2013). In addition, polar cod is important food for many Arctic fishes, including Arctic skate (Amblyraja hyperborea), NEA cod (Gadus morhua), Greenland halibut (Reinhardtius hippoglossoides), and striped seasnail (Liparis bathyarcticus) (Eriksen et al., 2020). The NEA cod is dependent upon capelin for sustaining its high abundance. The capelin is also a key diet item for whales, several seabird species, harp seals and other fish species (Dolgov, 2002). There is also evidence that capelin can inflict top-down effects on its zooplankton prey (Hassel et al., 1991; Dalpadado and Skjoldal, 1996). The understanding of the importance of changes in biomass of pelagic planktivores for other parts of the ecosystem is assessed as good.
Decreasing biomass of pelagic planktivores can be considered of ecosystem significance if, for example it has i) direct effects on zooplankton, such as increase in biomass proportion of larger species and size-classes, ii) positive indirect effects on other planktivores through decreased competition, e.g. mammals, seabirds (e.g., little auk) iii) direct negative effects on piscivorous seabirds (e.g., Brünnich´s guillemot), fish, mammals (e.g., narwhals, ringed seals).
Knowledge gaps:
There are uncertainties about energy channeling of increased primary production, related to, for example, how much of the production goes into zooplankton and then higher trophic levels like planktivorous fish.
References
Bogstad, B., Haug, T., and Mehl, S. 2000. Who eats whom in the Barents Sea? NAMMCO Sci. Publ., 2: 98-119.
Carscadden, J. E., Gjøsæter, H., and Vilhjálmsson, H. 2013. A comparison of recent changes in distribution of capelin (Mallotus villosus) in the Barents Sea, around Iceland and in the Northwest Atlantic. Progress in Oceanography, 114: 64-83.
Dalpadado, P., and Skjoldal, H. R. 1996. Abundance, maturity and growth of the krill species Thysanoessa inermis and T-longicaudata in the Barents Sea. Marine Ecology Progress Series, 144: 175-183.
Dolgov, A. V. 2002. The role of capelin (Mallotus villosus) in the foodweb of the Barents Sea. ICES Journal of Marine Science, 59: 1034-1045.
Eriksen, E., Benzik, A. N., Dolgov, A. V., Skjoldal, H. R., Vihtakari, M., Johannesen, E., Prokhorova, T. A., et al. 2020. Diet and trophic structure of fishes in the Barents Sea: The Norwegian-Russian program "Year of stomachs" 2015-Establishing a baseline. Progress in Oceanography, 183: 102262.
Fall, J., Ciannelli, L., Skaret, G., and Johannesen, E. 2018. Seasonal dynamics of spatial distributions and overlap between Northeast Arctic cod (Gadus morhua) and capelin (Mallotus villosus) in the Barents Sea. Plos One, 13: e0205921.
Gjøsæter, H., and Bogstad, B. 1998. Effects of the presence of herring (Clupea harengus) on the stock-recruitment relationship of Barents Sea capelin (Mallotus villosus). Fisheries Research, 38: 57-71.
Gjøsæter, H., Hallfredsson, E. H., Mikkelsen, N., Bogstad, B., and Pedersen, T. 2016. Predation on early life stages is decisive for year-class strength in the Barents Sea capelin (Mallotus villosus) stock. ICES Journal of Marine Science, 73: 182-195.
Gjøsæter, H., Huserbråten, M., Vikebø, F., and Eriksen, E. 2020. Key processes regulating the early life history of Barents Sea polar cod. Polar Biology, 43: 1015-1027.
Hassel, A., Skjoldal, H. R., Gjøsæter, H., Loeng, H., and Omli, L. 1991. Impact of grazing from capelin (Mallotus villosus) on zooplankton: a case study in the northern Barents Sea in August 1985. Polar Research, 10: 371-388.
Hobson, K. A., Ambrose Jr, W. G., and Renaud, P. E. 1995. Sources of primary production, benthic-pelagic coupling, and trophic relationships within the Northeast Water Polynya: Insights from delta C-13 and delta N-15 analysis. Marine Ecology Progress Series, 128: 1-10.
Hop, H., and Gjøsæter, H. 2013. Polar cod (Boreogadus saida) and capelin (Mallotus villosus) as key species in marine food webs of the Arctic and the Barents Sea. Marine Biology Research, 9: 878-894.
Huse, G., and Toresen, R. 2000. Juvenile herring prey on Barents Sea capelin larvae. Sarsia, 85: 385-391.
Huserbråten, M. B. O., Eriksen, E., Gjøsæter, H., and Vikebø, F. 2019. Polar cod in jeopardy under the retreating Arctic sea ice. Communications Biology, 2: article number: 407.
Jakobsen, T., and Ozhigin, V. K. 2011. The Barents Sea: ecosystem, resources, management. Half a century of Russian-Norwegian cooperation. p. 825. Tapir Akademisk Forlag, Trondheim, Norway.
Johannesen, E., Lindström, U., Michalsen, K., Skern-Mauritzen, M., Fauchald, P., Bogstad, B., and Dolgov, A. 2012. Feeding in a heterogeneous environment: spatial dynamics in summer foraging Barents Sea cod. Marine Ecology Progress Series, 458: 181-197.
Johannesen, E., Yoccoz, N. G., Tveraa, T., Shackell, N. L., Ellingsen, K. E., Dolgov, A. V., and Frank, K. T. 2020. Resource-driven colonization by cod in a high Arctic food web. Ecology and Evolution, 10: 14272-14281.
Kedra, M., Moritz, C., Choy, E. S., David, C., Degen, R., Duerksen, S., Ellingsen, I., et al. 2015. Status and trends in the structure of Arctic benthic food webs. Polar Research, 34.
Mueter, F. J., Nahrgang, J., Nelson, R. J., and Berge, J. 2016. The ecology of gadid fishes in the circumpolar Arctic with a special emphasis on the polar cod (Boreogadus saida). Polar Biology, 39: 961-967.
Orlova, E. L., Dolgov, A. V., Rudneva, G. B., Oganin, I. A., and Konstantinova, L. L. 2009. Trophic relations of capelin Mallotus villosus and polar cod Boreogadus saida in the Barents Sea as a factor of impact on the ecosystem. Deep-Sea Research Part Ii-Topical Studies in Oceanography, 56: 2054-2067.
Sakshaug, E., Johnsen, G., and Kovacs, K. M. 2009. Ecosystem Barents Sea, Tapir Academic Press, Trondheim.
Wassmann, P., and Reigstad, M. 2011. Future Arctic Ocean seasonal ice zones and implications for pelagic-benthic coupling. Oceanography, 24: 220-231.
Low trophic level seabirds [AI08]
Phenomenon: Decreasing biomass of low trophic level seabirds [AP08]
Ecosystem characteristic: Biomass distribution among trophic levels
Under the reference condition, little auk (Alle alle) is a numerous and important zooplanktivorous seabird species in the Arctic Barents Sea ecosystem (ICES, 2020). Historical changes in the abundance of natural competitors due to industrial whaling and fishing have probably influenced the current abundance of the species (Hacquebord, 2001).
The most important current anthropogenic driver of change for little auks is climate change (Hovinen et al., 2014a, b; Jakubas et al., 2017; Descamps and Strøm, 2021). As an ice-associated species depending on Arctic lipid-rich sympagic zooplankton (Isaksen and Gavrilo, 2000), it has been hypothesized that diminishing sea ice associated with climate warming will have detrimental impact on the populations of little auks (Karnovsky et al., 2010). Moreover, it has been suggested that little auks will be displaced northwards as their habitat in the marginal ice-zone is moving north under climate warming (Karnovsky et al., 2010). Thus, a decline in abundance and a northward shift in little auks are expected in the Barents Sea as a response to climate warming. The indicator is based on data from the ecosystem survey in the Barents Sea, which is conducted in September, representing the post-breeding period when the species is molting and before they start their southwest migration out of the Barents Sea. There is good theoretical and empirical knowledge underpinning the mechanisms of the proposed phenomenon and the understanding of the link to climate change is assessed as certain.
Little auks are considered to be the most abundant seabird species in the Arctic (Stempniewicz, 2001) and an important part of Arctic ecosystems (Karnovsky and Hunt, 2002; González-Bergonzoni et al., 2017). Little auks are a part of the ice-associated Arctic ecosystem which includes sympagic algae and zooplankton, polar cod, ice seals, and bowhead whales. A reduced abundance and a northward displacement of little auks in the Barents Sea could reflect bottom-up changes in this ecosystem. Specifically, it would indicate reduced availability and/or changed distribution of lipid-rich Arctic zooplankton which are central links between primary production and upper trophic levels in the system. A reduction in the abundance of little auks is likely to be accompanied by an increase in boreal planktivorous species such as capelin, mackerel and herring that are better adapted to utilize the smaller boreal zooplankton species (Stempniewicz et al., 2007), and an increase in boreal fish-eating seabirds (Descamps and Strøm, 2021).
Little auks provide an important link to terrestrial ecosystems. The large high-Arctic breeding colonies provide significant amounts of nutrients (nitrogen) to the tundra vegetation (Skrzypek et al., 2015) and the terrestrial landscapes engineered by little auks are important habitats for geese and reindeer (Rangifer tarandus) (González-Bergonzoni et al., 2017; Mosbech et al., 2018). A reduction in the breeding population will therefore also have consequences for high-arctic terrestrial ecosystems. Little auks are also important prey for glaucous gulls (Larus hyperboreus), gyrfalcons (Falco rusticolus), and Arctic foxes (Alopex lagopus) (Mosbech et al., 2018). The understanding of the importance of changes in the biomass of little auks for other parts of the ecosystem is assessed as good.
Decreasing biomass of little auks can be considered of ecosystem significance if there is a significant gradual long-term (> 10 years) change in the biomass associated with climate warming and a borealization of the Arctic ecosystem.
Knowledge gaps:
Foraging behavior, migration, reproduction and demography are monitored in selected breeding colonies at Bear Island and Spitsbergen. There is, however, little data on the overall population dynamics of little auks. There is little information on the interactions between little auks and prey and between little auks and competitors at sea. The time series from the ecosystem survey in the Barents Sea is relatively short (2004-2020).
The indicator is sensitive to natural fluctuations in, for example, the Barents Sea climate and the abundance and distribution of key species such as capelin. Within limits, little auks are likely to adapt to reduced sea-ice concentration and availability of lipid-rich zooplankton (Grémillet et al., 2012; Jakubas et al., 2017). Lagged responses could therefore be expected.
References
Descamps, S., and Strøm, H. 2021. As the Arctic becomes boreal: ongoing shifts in a high-Arctic seabird community. Ecology, e03485.
González-Bergonzoni, I., Johansen, K. L., Mosbech, A., Landkildehus, F., Jeppesen, E., and Davidson, T. A. 2017. Small birds, big effects: the little auk (Alle alle) transforms high Arctic ecosystems. Proceedings of the Royal Society B-Biological Sciences, 284: 20162572.
Grémillet, D., Welcker, J., Karnovsky, N. J., Walkusz, W., Hall, M. E., Fort, J., Brown, Z. W., et al. 2012. Little auks buffer the impact of current Arctic climate change. Marine Ecology Progress Series, 454: 197-206.
Hacquebord, L. 2001. Three centuries of whaling and walrus hunting in Svalbard and its impact on the Arctic ecosystem. Environment and History, 7: 169-185.
Hovinen, J. E. H., Welcker, J., Descamps, S., Strøm, H., Jerstad, K., Berge, J., and Steen, H. 2014a. Climate warming decreases the survival of the little auk (Alle alle), a high Arctic avian predator. Ecology and Evolution, 4: 3127-3138.
Hovinen, J. E. H., Wojczulanis-Jakubas, K., Jakubas, D., Hop, H., Berge, J., Kidawa, D., Karnovsky, N. J., et al. 2014b. Fledging success of little auks in the high Arctic: do provisioning rates and the quality of foraging grounds matter? Polar Biology, 37: 665-674.
ICES. 2020. Working Group on the Integrated Assessments of the Barents Sea (WGIBAR). 2:30. 206 pp.
Isaksen, K., and Gavrilo, M. V. 2000. Little auk, Alle alle. In The status of marine birds breeding in the Barents Sea region. Norsk Polarinstitutt Rapportserie nr 113. Ed. by T. Anker-Nilsen, B. T., H. Strøm, A. N. Golovkin, V. V. Bianki, and I. P. Tatarinkova. Norwegian Polar Institute, Tromsø, Norway.
Jakubas, D., Wojczulanis-Jakubas, K., Iliszko, L. M., Strøm, H., and Stempniewicz, L. 2017. Habitat foraging niche of a High Arctic zooplanktivorous seabird in a changing environment. Scientific Reports, 7: 16203.
Karnovsky, N., Harding, A., Walkusz, W., Kwaśniewski, S., Goszczko, I., Wiktor, J., Routti, H., et al. 2010. Foraging distributions of little auks Alle alle across the Greenland Sea: implications of present and future Arctic climate change. Marine Ecology Progress Series, 415: 283-293.
Karnovsky, N. J., and Hunt, G. L. 2002. Estimation of carbon flux to dovekies (Alle alle) in the North Water. Deep-Sea Research Part Ii-Topical Studies in Oceanography, 49: 5117-5130.
Mosbech, A., Johansen, K. L., Davidson, T. A., Appelt, M., Grønnow, B., Cuyler, C., Lyngs, P., et al. 2018. On the crucial importance of a small bird: The ecosystem Services of the little auk (Alle alle) population in Northwest Greenland in a long-term perspective. Ambio, 47: 226-243.
Skrzypek, G., Wojtuń, B., Richter, D., Jakubas, D., Wojczulanis-Jakubas, K., and Samecka-Cymerman, A. 2015. Diversification of nitrogen nources in various tundra vegetation types in the High Arctic. Plos One, 10: e0136536.
Stempniewicz, L. 2001. Little auk (Alle alle). In BWP update. Vol.3. The journal of the birds of the western Palearctic, pp. 175-201. Ed. by M. Ogilvie. Oxford University Press, Oxford.
Stempniewicz, L., Błachowiak-Samołyk, K., and Wesławski, J. M. 2007. Impact of climate change on zooplankton communities, seabird populations and arctic terrestrial ecosystem - A scenario. Deep-Sea Research Part Ii-Topical Studies in Oceanography, 54: 2934-2945.
High trophic level seabirds [AI09]
Phenomenon: Decreasing biomass of high trophic level seabirds [AP09]
Ecosystem characteristic: Biomass distribution among trophic levels
Under the reference condition, Brünnich’s guillemot (Uria lomvia) and kittiwake (Rissa tridactyla) are important piscivorous predators in the Barents Sea ecosystem and a dominant part of the avifauna in the central to Arctic part of the Barents Sea (ICES, 2020). Historical hunting and industrial fishing of important prey items had large impacts on the population dynamics of these species during the 20 th century (Krashnov and Barrett, 1995).
Climate change is considered to be a dominant anthropogenic driver affecting the populations of Brünnich’s guillemots and black-legged kittiwakes on Svalbard (Descamps et al., 2013; Descamps and Ramírez, 2021; Descamps and Strøm, 2021). However, the links to climate change are often complex including changes in sea-ice cover and changes in the pelagic food web affecting the availability of small pelagic fish as prey (Descamps et al., 2013; Descamps and Ramírez, 2021). Although both species are considered to be Arctic, they could, as piscivorous predators, temporarily profit from a borealization of the ecosystem when the change involves a higher abundance of small pelagic fish, such as capelin (Vihtakari et al., 2018).
An unprecedented mass die-off of seabirds, most notably murres, was recently observed in the North Pacific following a marine heat wave, causing widespread changes at lower trophic levels and subsequent starvation among seabirds (Piatt et al., 2020). Such climate extremes, which are expected to increase in frequency due to climate change, could have pervasive impacts on the Arctic marine ecosystems and seabird populations in particular.
Competition with industrial fisheries targeting small pelagic fish has been argued to be an important factor affecting seabird populations worldwide (Cury et al., 2011; Grémillet et al., 2018). In September, black-legged kittiwakes and Brünnich´s guillemots are found in large number in the central part of the Barents Sea, closely associated with capelin. Both species depend on capelin as a prey item during autumn when capelin are on a feeding migration north in the Barents Sea and during pre-breeding, in February – April, when capelin are on a spawning migration towards the coasts of Norway and Murmansk (Fauchald and Erikstad, 2002; Reiertsen et al., 2014). The commercial capelin fishery could accordingly be an anthropogenic factor that indirectly affects the abundance of the two seabird species in the Barents Sea. However, the current prudent regulation of the fishery suggests that the fluctuations in the abundance of capelin might be caused by other factors.
The understanding of the links between the indicator and climate change and fishery are assessed as certain. Fisheries are expected to affect the populations negatively. Climate change is expected to affect the populations negatively through increased frequency of extreme events and through a borealization of the ecosystem. The mechanisms are well understood and there is good empirical evidence for anthropogenic impacts caused by over-fishing and climate change.
Black-legged kittiwakes and Brünnich’s guillemots are, together with marine mammals and cod, important predators on pelagic fish in the Barents Sea and constitute a significant part of the top-predator guild in the ecosystem (ICES, 2020). A large relative drop in the abundance of these species could impact their role as top predators in the ecosystem and would signal negative changes at lower trophic levels (Krashnov and Barrett, 1995; Reiertsen et al., 2014; Vihtakari et al., 2018; Descamps and Strøm, 2021). The understanding of the importance of changes in the biomass of Brünnich’s guillemots and black-legged kittiwakes for other parts of the ecosystem is assessed as good.
Decreasing biomass of Arctic high trophic level seabirds can be considered of ecosystem significance if, for example i) there is a sudden drop in the biomass caused by a mass die-off of birds following a collapse in the availability of prey due to climate extremes or over-fishing, ii) there is a significant gradual long-term (> 10 years) decrease in the biomass associated with climate warming and a borealization of the ecosystem.
Knowledge gaps:
Foraging behavior, diet, migration, reproduction and demography are monitored in selected breeding colonies on Bear Island and Spitsbergen. The time series from the ecosystem survey in the Barents Sea is relatively short (2004-2020). The indicator is sensitive to natural fluctuations in the Barents Sea climate and the abundance and distribution of key species such as capelin. Lagged responses could be expected with respect to the effects of borealization. The impacts from fishing and climate change are mediated through multiple direct and indirect pathways, and the relative importance of these drivers is therefore often difficult to separate. More knowledge is needed to understand the mechanisms and dynamics related to these drivers.
References
Cury, P. M., Boyd, I. L., Bonhommeau, S., Anker-Nilssen, T., Crawford, R. J. M., Furness, R. W., Mills, J. A., et al. 2011. Global seabird response to forage fish depletion - One-fhird for the birds. Science, 334: 1703-1706.
Descamps, S., and Ramírez, F. 2021. Species and spatial variation in the effects of sea ice on Arctic seabird populations. Diversity and Distributions, 00: 1-14.
Descamps, S., and Strøm, H. 2021. As the Arctic becomes boreal: ongoing shifts in a high-Arctic seabird community. Ecology, e03485.
Descamps, S., Strøm, H., and Steen, H. 2013. Decline of an arctic top predator: synchrony in colony size fluctuations, risk of extinction and the subpolar gyre. Oecologia, 173: 1271-1282.
Fauchald, P., and Erikstad, K. E. 2002. Scale-dependent predator-prey interactions: the aggregative response of seabirds to prey under variable prey abundance and patchiness. Marine Ecology Progress Series, 231: 279-291.
Grémillet, D., Ponchon, A., Paleczny, M., Palomares, M. L. D., Karpouzi, V., and Pauly, D. 2018. Persisting worldwide seabird-fishery competition despite seabird community decline. Current Biology, 28: 4009-4013.e4002.
ICES. 2020. Working Group on the Integrated Assessments of the Barents Sea (WGIBAR). 2:30. 206 pp.
Krashnov, Y. V., and Barrett, R. T. 1995. Large-scale interactions between seabirds, their prey and man in the southern Barents Sea. In Ecology of Fjords and Coastal Waters, pp. 443-456. Ed. by H. R. Skjoldal, C. C. E. Hopkins, K. E. Erikstad, and H. P. Leinaas. Elsevier Science, Amsterdam.
Piatt, J. F., Parrish, J. K., Renner, H. M., Schoen, S. K., Jones, T. T., Arimitsu, M. L., Kuletz, K. J., et al. 2020. Extreme mortality and reproductive failure of common murres resulting from the northeast Pacific marine heatwave of 2014-2016. Plos One, 15: e0226087.
Reiertsen, T. K., Erikstad, K. E., Anker-Nilssen, T., Barrett, R. T., Boulinier, T., Frederiksen, M., Gonzalez-Solis, J., et al. 2014. Prey density in non-breeding areas affects adult survival of black-legged kittiwakes Rissa tridactyla. Marine Ecology Progress Series, 509: 289-302.
Vihtakari, M., Welcker, J., Moe, B., Chastel, O., Tartu, S., Hop, H., Bech, C., et al. 2018. Black-legged kittiwakes as messengers of Atlantification in the Arctic. Scientific Reports, 8: 1-11.
Low trophic level mammals [AI10]
Phenomenon: Decreasing abundance of low trophic level mammals [AP10]
Ecosystem characteristic: Biomass distribution among trophic levels
The two Arctic lower-trophic feeding marine mammal species in the Barents Sea, bowhead whales and walruses were hunted to near extirpation before being protected. Original pre-whaling stock size has been estimated for bowheads (Allen and Keay, 2006) and also for walruses from Svalbard based on records of catches and products reaching markets (Gjertz and Wiig, 1998; Weslawski et al., 2000).
Historically harvest was unquestionable the major driver to population size (biomass) of both species. However, the major driver for these species now is climate change (Kaschner et al., 2011; Kovacs et al., 2021). The status for the Barents Sea bowhead population has just been reclassified as Endangered (RL 2021), downlisted from Critically Endangered, because these whales have recently been found in larger numbers than expected (100s vs 10s), within the marginal sea-ice zone of the northern Barents Sea in summer and even deeper into the ice in winter (Ahonen et al., 2017; Vacquié-Garcia et al., 2017a; Kovacs et al. 2020). The current trend in this population is unknown, but the future trend in this region is expected to be negative because of the strong affiliation that this population displays for sea ice (Stafford et al., 2012; Kovacs et al., 2020). Their dietary specialization on Arctic calanoid copepods also puts them at risk in an Arctic with decreasing sea ice. It is unknown what will happen to Arctic copepods when the summer sea ice retreats beyond the coastal shelves into the deep Arctic Ocean. Increasing ship traffic and ocean noise in general are also perceived to be potential drivers for Barents Sea bowhead whales because this very small population communicates over vast distances (Reeves et al., 2014; Blackwell and Thode, 2021). Bowhead whales remain severely depressed in numbers compared to pre-whaling stock size.
In recent decades, walruses are showing an increasing trend in the Svalbard Archipelago (Lydersen et al., 2008; Kovacs et al., 2014; https://www.mosj.no), despite the likelihood that climate change is already having negative impacts on benthic productivity due to reduced ice cover (Kovacs et al., 2015). The current positive trend is due to the fact that walruses were hunted down to such low numbers that carrying capacity continues to exceed their current abundance (Kovacs et al., 2014). However, the population is very small compared to pre-hunting levels and it is expected that this species will decline in the future because of reduced benthic productivity as a result of sympagic nutrient declines with reduced sea ice (see Ershova et al., 2019; Bluhm et al., 2020). Increased tourism over recent decades has not had negative impacts on walruses in the Svalbard area; they appear to be quite resilient to this potential disturbance factor (Øren et al., 2018). Walruses in Norwegian waters are classified as vulnerable (VU) because of on-going deterioration of their sea-ice habitat.
Knowledge about the link to anthropogenic drivers is assessed as certain. Both of these populations remain dramatically reduced compared to preharvest levels.
These two lower-trophic feeding species have considerable impacts on the ecosystems they occupy, similar to other marine mammals, largely because their large body size(s) resulting in likely top-down control of prey species. However, they also perform unique ecological roles that include vertical circulation of nutrients by bowhead whales and bioturbation of benthic environments by walruses (Oliver et al., 1985). Dead whale carcasses also represent large nutrient supplies for scavengers both on the sea floor and when they wash ashore. This food source is particularly important to polar bears during summer in the Svalbard Archipelago (see below for details regarding these ecosystem interactions). Although common wisdom suggests that these animals have considerable influence on the structuring of the ecosystems that they occupy, the understanding of the results of changes in their standing biomass is complex and not well documented. Alteration of numbers/biomass in the indicators can alter the abundance of other species as well as altering the structure and functioning of the ecosystems they occupy i.e., declines in walruses is thought to have resulted in dramatically increased numbers of bearded seals in the Svalbard area (Weslawski et al., 2000). High densities of walruses would almost certainly influence Mya truncata, and perhaps also other benthic invertebrate, densities - although little is known about the prey base for walruses in Svalbard. Effects of reduced numbers of bowhead whales are more uncertain, because their current biomass is low and also given that this species has displayed some capacity to prey-switch in other Arctic areas (Lowry et al., 2004).
Knowledge about importance of changes in the indicator for other parts of the ecosystem is thus assessed as less good.
Current monitoring of abundance of bowhead whales is insufficient to accurately detect trends in this species. Walruses in Svalbard have been surveyed regularly in the past two decades, though numbers of the whole population are uncertain because Russian parts of their distribution in the Barents Sea have never been surveyed. Increased monitoring effort is needed for both species.
References
Ahonen, H., Stafford, K. M., Steur, L. de, Lydersen, C., and Kovacs, K. M. 2017.The underwater soundscape in western Fram Strait: breeding ground of Spitsbergen's endangered bowhead whales. Mar. Pollut. Bull. 123: 97-112.
Blackwell, S. B., and A. M. Thode 2021. Effects of noise. Pp. 565-576 In: George, J. C. and Thewissen, J. G. M. (eds.) The bowhead whale Balaena mysticetus : Biology and human interactions. Acad. Press, London.
Bluhm, B.A., Janout, M.A., Danielson, S.L., Ellingsen, I., Gavrilo, M., Grebmeier, J.M., Hopcroft, R.R. et al. 2020. The pan-Arctic continental slope: sharp gradients o f physical processes affect pelagic and benthic ecosystems. Front. Mar. Sci. 7, art. No. 544386. Doi.10.3389/fmars.2020.544386.
Ershova, E.A., Descoteaux, R., Wangensteen, O.S., Iken, K., Hopcroft, R. R., Smoot, C., Grebmeier, J. M., and Bluhm, B. A. 2019. Diversity and distribution of meroplanktonic larvae in the Pacific Arctic and connectivity with adult benthic invertebrate communities. Front. Mar. Sci. 6, art. No. 490,. D doi.10.3389/fmars.2019.00490.
Gjertz I., and Wiig Ø., 1998, Back-calculation of original population size for walruses Odobaenus rosmarus in Franz Josef Land, Wildlife Biol., 4: 223–230.
Kaschner, K., Tittensor, D. P., Ready, J. Gerrodette, T., and Worme, B. 2011. Current and future patterns of global marine mammal biodiversity. PLoS ONE 6: e19653.
Kovacs, K. M., Aars, J., and Lydersen, C. 2014. Walruses recovering after 60+ years of protection at Svalbard, Norway. Polar Res. 33, 26034, doi: 10.3402/polar.v33.26034.
Kovacs, K.M., Belikov, S., Boveng, P., Desportes, G., Ferguson, S., Hansen, R.G., Laidre, K., Stenson, G., Thomas, P., Ugarte, F., and Vongraven, D. 2021. SAMBR Update and Overview of Circumpolar Arctic Scientific Monitoring – Marine Mammals. Conservation of Arctic Flora and Fauna International Secretariat, Akureyri, Iceland.
Kovacs, K. M., Lemons, P. R. III, MacCracken, J. G., and Lydersen, C. 2015. Walruses in a time of climate change. Arctic Report Card 2015: 66-74.
Kovacs, K. M., Lydersen, C., Vacquiè-Garcia, J., Shpak, O., Glazov, D., and Heide-Jørgensen, M. P. 2020. The endangered Spitsbergen bowhead whales’ secrets revealed after hundreds of years in hiding. Biol. Letters 16, art. No. 20200148:1-6, doi:10.1098/rsbl.2020.0148
Lowry, L. F., Sheffield, G., and George, J. C. 2004. Bowhead whale feeding in the Alaskan Beaufort Sea, based on stomach contents analyses. J. Cetacean. Res. Manage. 6: 215-223.
Lydersen, C., Aars, J., and Kovacs, K. M. 2008. Estimating the number of walruses in Svalbard from aerial surveys and behavioural data from satellite telemetry. Arctic 61: 119-128.
Oliver, J.S., Kvitek, R.G., and Slattery, P.N. 1985. Walrus feeding disturbance – scavenging habits and recolonization of the Bering Sea benthos. J. Exp. Mar. Biol.91: 233-246.
RL 2021 https://artsdatabanken.no/lister/rodlisteforarter/2021/
Reeves, R. R., Ewins, P. J., Agbayani, S., Heide-Jørgensen, M. P., Kovacs, K. M., Lydersen, C., Suydam, R., Elliot, W., Polet, G., Dijk, Y. van, and Blijleven, R. 2014. Distribution of endemic cetaceans in relation to hydrocarbon development and commercial shipping in a warming Arctic. Mar. Policy 44: 375-389.
Stafford, K. M., Moore, S. E., Berchok, C. L., Wiig, Ø., Lydersen, C., Hansen, E., Kalmbach, D., and Kovacs, K. M. 2012. Spitsbergen’s endangered bowhead whales sing through the polar night. Endang. Species Res. 18: 95-103.
Vacquié-Garcia, J., Lydersen, C., Marques, T. A., Aars, J., Ahonen, H., Skern-Mauritzen, M., Øien, N., and Kovacs, K. M. 2017. Late summer distribution and abundance of ice-associated whales in the Norwegian High Arctic. Endang. Species Res. 32: 59-70.
Weslawski, J. M., Hacquebord, L., Stempniewicz, L., and Malinga, M. 2000. Greenland whales and walruses in the Svalbard food web before and after exploitation. Oceanologia 42: 37-56
Øren, K., Kovacs, K. M., Yoccoz, N. G., and Lydersen, C. 2018. Assessing site-use and sources of disturbance at walrus haul-outs using monitoring cameras. Polar Biol. 41: 1737-1750.
Generalist mammals [AI11]
Phenomenon: Decreasing abundance of generalist mammals [AP11]
Ecosystem characteristic: Biomass distribution among trophic levels
Some of the generalist feeding marine mammal species occupying Arctic areas in the Barents Sea are known to have been reduced via commercial overharvesting in some periods, e.g., harp seals and hooded seals, while the others (e.g., harbour, ringed, and bearded seals) have received less concerted hunting pressure (and these harvests have been more poorly documented). Although original stock size is not known with certainty for any of these species, back-calculations are available for the two commercially harvested seals (see https://www.mosj.no).
Harp seals numbers are somewhat reduced from Post WWII levels, but they are still the most numerous pinnipeds in the Arctic regions of the Barents Sea, at least seasonally. Population size is estimated to be in excess of 425,000 animals for the West Ice breeding area and approximately 1.5 M animals from the White Sea breeding area (ICES, 2019). Many of the White Sea breeding harp seals feed seasonally at marginal ice-edge in the northern Barents Sea, sympatrically with West Ice animals, during summer and autumn (Folkow et al., 2004; Nordøy et al., 2008; Lindstrøm et al., 2013; Haug et al., 2021). Although the current population trend for both stocks is increasing, declines in body condition and reproductive rates are a concern (Øigård et al., 2013; Stenson et al., 2016, 2020). Low levels of reproduction for some recent periods in the White Sea/Barents Sea are thought to be due to increased pup mortality because of poor ice conditions in combination with competition for food with the large Atlantic cod stock (Stenson et al., 2020).
Hooded seals have declined precipitously since the 1950s in the Barents Sea. The most recent survey of Greenland Sea hooded seals was conducted in 2018 (ICES, 2019a). Pup production (12,977 CI= 9867–17067) estimated from this survey was lower than the surveys in 2005 and 2007, but similar to the survey conducted in 2012 (Øigård et al., 2014). Population models suggest that the population is either stable (at a new low level -circa 80,000) or is continuing to decline slowly, despite a ban on commercial hunting that was put in place in 2007 (ICES, 2019a). Some of the hooded seal harvest in Southeast Greenland is very likely from this Endangered stock (RL, 2021). Climate change is a serious conservation concern for this ice-breeding species (Kovacs et al., 2011, 2012). Sea-ice losses have occurred throughout the species’ range over the last few decades (e.g., Stenson and Hamill, 2014; Spreen et al., 2020) and in the Greenland Sea floes are smaller and less stable, which likely impacts survivorship of pups. Additionally, pupping areas have shifted closer to the Greenland coast where hooded seals of all ages are more vulnerable to polar bear predation (Øigård et al., 2014). The occurrence of hooded seals has increased in the diet of both polar bears and killer whales in east Greenland (Foote et al., 2013; McKinney et al., 2013). Hooded seals from the West Ice disperse broadly outside the breeding season, covering much of the North Atlantic Arctic (Vacquiè-Garcia et al., 2017b). Prey abundance and distribution in the Greenland Sea are undergoing significant change that is very likely to impact hooded seals (e.g., Christiansen, 2017; ICES, 2019b; Pedersen et al., 2020). A recent dietary study on Greenland Sea hooded seals found that their diet is dominated by polar cod (Boreogadus saida), which is undergoing decline throughout the Barents region (Enoksen et al., 2017). Hooded seals also consumed krill and squid (Gonatus fabricii), but at lower levels than in the past. Despite some evidence of prey shifting, Enoksen et al. (2017) concluded that Greenland Sea hooded seals show narrow niche breadth and specialization on Arctic fishes that makes them particularly vulnerable to negative impacts of climate change.
Ringed seals and bearded seals have been harvested by explorers and whalers in the Norwegian Arctic, with significant numbers of bearded seals in particular being taken by some expeditions that did “plukk-fangst” – taking all of the marine mammals they came upon. Hundreds of animals were taken by individual boats in some years from this relatively low-density species. Data are insufficient to determine whether these harvests had population-level impacts, though it is likely that they did. Current population sizes and trends are unknown although some baseline data are available (e.g., Krafft et al., 2006). Ringed seals are a species of special concern with respect to climate change because of their unique breeding ecology – giving birth and nursing their young in snow caves on top of sea ice (see Kovacs et al., 2011). In Svalbard, where sea-ice conditions have changed dramatically in recent decades, ringed seals appear to be retracting into small Arctic refugia areas and are not showing signs of flexibility with regard to habitat choices (although see Lydersen et al., 2017) or dietary change (Hamilton et al., 2016; Bengtsson et al., 2020). They are diving more and resting less in both offshore and coastal habitats, suggesting that they are working harder to find food; offshore they are doing less sympagic diving and less area-restricted search as well (Hamilton et al., 2015; 2016; 2018a). Summer foraging migrations are now a lot longer compared to a decade ago, to reach preferred sea-ice concentrations (Lone et al., 2019).
Less is known regarding how bearded seals are responding to changing ice conditions, although they transitioned readily from annual ice to glacier ice pieces for pupping and nursing when sea ice collapsed in Svalbard fjords in 2006 (Kovacs et al., 2020), but this alternate habitat is not likely to be a long-term solution in this region given that tide-water glaciers are melting and retracting onto shore. Bearded seal diets show variance with different ice concentrations in some areas (Hindell et al., 2012 ; Wang et al., 2016), with shifts between proportions of invertebrate vs fish occurring either through time or in direct association with sea-ice concentration variation as well as varying with age class (Young et al., 2010). Increased risk of health-related problems with reduced sea ice is a serious concern for Arctic endemic seals, including bearded seals, that are unlikely to have immunity to many viruses, bacteria, parasites etc. that have not been part of their evolutionary history, but which are likely to become more prevalent in a warmer Arctic (e.g., VanWormer et al., 2019). Both ringed and bearded seals are Red Listed in Norwegian waters because of habitat deterioration (RL, 2021).
Among the generalist feeding marine mammal species occupying Arctic areas of the Barents Sea, the major driver of abundance/biomass has historically been harvesting. Commercial harvests are currently conducted within sustainable limits for harp seals, and hooded seals are totally protected. However, despite the harvest being stopped in 2008, hooded seals are not showing any signs of recovery. In Arctic areas, ringed seals and bearded seals are hunted at low levels in a sport-hunt and small quotas are assigned for these species in mainland Norway; sustainability of these harvest has not been evaluated but for ringed seals in some fjords, hunting might be a threat. The most important driver for all of the generalist feeding ice-dependent marine mammal species in the Barents Sea region is now climate change. Negative abundance trends are expected in the future due to both direct (habitat reductions) and indirect (food web changes, disease increases, increased toxicity of contaminants etc) effects of climate change (Laidre et al., 2015; Kovacs et al., 2021).
The small Arctic harbour seal population in in the Svalbard Archipelago is currently extending its distribution northward along the coast of Spitsbergen, where they now occupy fjords that are undergoing Atlantification (Storrie et al., 2018 ; Bengtsson et al., 2020). They are expected to continue to be “climate winners” (Blanchet et al., 2014) and will likely exacerbate negative impacts of climate change on ringed and bearded seals via interspecific competition; unlike the endemic species, that seem to have evolved into somewhat separate feeding niches (Wathne et al., 2000; Hamilton et al., 2019) This population should be monitored in this context.
Knowledge about the link to anthropogenic drivers is assessed as certain.
Similar to the other marine mammals, generalist feeding marine mammals exert considerable influences on the ecosystems they occupy. These include - top-down control, and bioturbation of benthos (bearded seals). Although common wisdom suggests that these animals have considerable influence on the structuring of the ecosystems that they occupy, the understanding of the results of changes in their standing biomass is complex and not well documented. The knowledge about the importance of changes in the indicator for other parts of the ecosystem is thus assessed as less good.
Harp seals are monitoring within the ICES system (e.g., ICES, 2019) with updated population abundance information every five years. The Arctic generalists (ringed, bearded and harbour seals) currently represent gaps in knowledge (data insufficient) although some base-line information is available for ringed and harbour seals (Krafft et al., 2006; Merkel et al., 2013).
References
Bengtsson, O., Lydersen, C., Kovacs, K.M., and Lindström, U. 2020. Ringed seal (Pusa hispida) diet on the west coast of Spitsbergen, Svalbard, Norway. Polar Biol 43: 773–788.
Blanchet, M.-A., Lydersen, C., Ims, R. A., Lowther, A. D., and Kovacs, K. M. 2014. Harbour seal (Phoca vitulina) movement patterns in the High Arctic archipelago of Svalbard, Norway. Aquatic Biology 21: 167-181.
Christiansen, J.S. 2017. No future for Euro-Arctic ocean fishes? Mar Ecol Prog Ser 575: 217–227. doi: 10.3354/meps12192.
Enoksen, S., Haug, T., Lindstrøm, U., and Nilssen, K.T. 2017. Recent summer diet of hooded Cystophora cristata and harp Pagophilus groenlandicus seals in the drift ice of the Greenland Sea. Polar Biology 40: 931-937.
Folkow, L.P., Nordøy, E.S., and Blix, A.S. 2004. Distribution and diving behaviour of harp seals (Pagophilus groenlandicus) from the Greenland Sea stock. Polar Biol. 27: 281-298.
Foote, A.D., Newton, J., Avila-Arcos, M.C., Kampmann, M.-L., Samaniego, J.A., Post, K., Rosing-Asvid, A., Sinding, M.-H.S., and Gilbert, M.T.P. 2013. Tracking niche variation over millennial timescales in sympatric killer whale lineages. Proc. R. Soc. B 280: 20131481.
Hamilton, C.D., Lydersen, C., Ims, R.A., and Kovacs, K.M. 2015. Predictions replaced by facts: a keystone species' behavioural responses to declining arctic sea-ice. Biol Lett 11: 20150803. doi: 10.1098/rsbl.2015.0803.
Hamilton, C.D., Lydersen, C., Ims, R.A., and Kovacs, K.M. 2016. Coastal habitat use by ringed seals Pusa hispida following a regional sea-ice collapse: importance of glacial refugia in a changing Arctic. Mar Ecol Prog Ser 545: 261-277.
Hamilton, C.D., Kovacs, K.M., Ims, R.A., and Lydersen, C. 2018a. Haul-out behaviour of Arctic ringed seals: Inter-annual patterns and impacts of current environmental change. Polar Biol. 41: 1063-1082.
Hamilton, C.D., Kovacs, K.M. and Lydersen, C. 2019. Sympatric use of a glacial fjord by two Arctic endemic seals. Marine Ecology Progress Series 615: 205-220.
Haug, T., Biuw, M., Gjøsæther, H., Knutsen, T., Lindstrom, T., Mackenzie, K. M., Meier, S. and Nilssen, K. T. 2021. Harp seal body condition and trophic interactions with prey in Norwegian high Arctic waters in early autumn. Prog. Oceanogr. 191, art. no. 102498: 1-18.
Hindell, M.A., Lydersen, C., Hop, H., and Kovacs, K.M. 2012. Pre-partum diet of adult female bearded seals in years of contrasting ice conditions. PloS ONE 7: e38307.
International Council for the Exploration of the Sea (ICES). 2019a. ICES/NAFO/NAMMCO Working Group on Harp and Hooded Seals (WGHARP). ICES Sci Rep 1:72. doi: 10.17895/ICES.pub.5617.
International Council for the Exploration of the Sea (ICES). 2019b. Icelandic Waters ecoregion –Ecosystem overview. In Report of the ICES Advisory Committee, 2019. ICES Advice 2019, Section 11.1, doi: 10.17895/ICES.advice.5746.
Kovacs, K.M., Moore, S., Overland, J.E., and Lydersen, C. 2011. Impacts of changing sea-ice conditions on Arctic marine mammals. Mar. Biodiv. 41: 181-194. doi: 10.1007/S12526-010-0061-0.
Kovacs, K.M., Aguilar, A., Aurioles, D., Burkanov, V., Campagna, C., Gales, N., Gelatt, T., Goldsworthy, S.D., Goodman, S.J., Hofmeyr, G.J.G., Härkönen, T., Lowry, L., Lydersen, C., Schipper, J., and Sipilä, T. 2012. Global threats to pinnipeds. Mar. Mammal Sci. 28: 414-436.
Kovacs, K.M., Krafft, B., and Lydersen, C. 2020. Bearded seal (Erignathus barbatus) pup growth - body size, behavioral plasticity and survival in a changing climate. Mar. Mammal Sci. 36: 276-284. doi: 10.1111/mms.12647.
Kovacs, K.M., Belikov, S., Boveng, P., Desportes, G., Ferguson, S., Hansen, R.G., Laidre, K., Stenson, G., Thomas, P., Ugarte, F., and Vongraven, D. 2021. SAMBR Update and Overview of Circumpolar Arctic Scientific Monitoring – Marine Mammals. Conservation of Arctic Flora and Fauna International Secretariat, Akureyri, Iceland.
Krafft, B. A., Kovacs, K. M., Ergon, T., Andersen, M., Aars, J., Haug, T., and Lydersen, C. 2006. Abundance of ringed seals (Pusa hispida) in the fjords of Spitsbergen, Svalbard, during the peak molting period. Mar. Mammal Sci. 22: 394-412.
Laidre, K.L., Stern, H., Kovacs, K.M., Lowry, L., Moore, S.E., Regehr, E.V., Ferguson, S.H., Wiig, Ø., Boveng, P., Angliss, R.P., Born, E.W., Litovka, D., Quakenbush, L., Lydersen, C., Vongraven, D., and Ugarte, F. 2015. Arctic marine mammal population status, sea ice habitat loss, and conservation recommendations for the 21st century. Conserv. Biol. 29: 724–737.
Lindstrøm, U., Nilssen, K.T., Pettersen, L.M.S., and Haug, T. 2013. Harp seal foraging behaviour during summer around Svalbard in the northern Barents Sea: diet composition and the selection of prey. Polar Biol. 36: 305-320.
Lone, K., Hamilton, C.D., Aars, J., Lydersen, C., and Kovacs, K.M. 2019. Summer habitat selection by ringed seals (Pusa hispida) in the drifting sea ice of the northern Barents Sea. Polar Res 38: 3483.
Lydersen, C., Vacquie-Garcia, J., Lydersen, E., Christensen, G.N. and Kovacs, K.M. 2017.Terrestrial haul-out by ringed seals (Pusa hipida), with harbour seal (Phoca vitulina) in Svalbard. Polar Research 36, 1374124.
McKinney, M.A., Iverson, S.J., Fisk, A.T., Sonne, C., Riget, F.F., Letcher, R.J., Arts, M.T., Born, E.W., Rosing-Asvid, A., and Dietz, R. 2013. Global change effects on the long-term feeding ecology and contaminant exposures of East Greenland polar bears. Glob Chang Biol 19: 2360-2372. doi: 10.1111/gcb.12241.
Merkel, B., Lydersen, C., Yoccoz, N. G., and Kovacs, K. M. 2013. The world's northernmost harbour seal population - how many are there? PLoS ONE 8: e67576. 11pp.
Nordøy, E.S., Folkow, L.P., Potelov, V., Prischemikhin, V., and Blix, A. S.2008. Seasonal distribution and dive behaviour of harp seals (Pagophilus groenlandicus) of the White Sea- Barents Sea stock. Polar Biol. 31: 1119-1135.
Pedersen, E.J., Koen-Alonso, M., and Tunney, T.D. 2020. Detecting regime shifts in communities using estimated rates of change. ICES J. Mar. Sci. 77: 1546–1555. doi:10.1093/ICESjms/fsaa056.
RL (Norsk Rød Liste for Arter). 2021. https://artsdatabanken.no/lister/rodlisteforarter/2021
Stenson, G.B., Buren, A.D., and Koen-Alonso, M. 2016. The impact of changing climate and abundance on reproduction in an ice-dependent species, the Northwest Atlantic harp seal, Pagophilus groenlandicus. ICES J Mar Sci 73: 250-262.
Stenson, G.B., Haug, T., and Hammill, M.O. 2020. Harp seals: monitors of change in differing ecosystems. Front Mar. Sci. 7: 569258. doi: 10.3389/fmars.2020.56925.
Storrie, L., Lydersen, C., Andersen, M., Wynn, R. B., and Kovacs, K. M. 2018. Determining the species assemblage and habitat use of cetaceans in the Svalbard Archipelago, based on recorded observations from 2002-2014. Polar Res. 37, 1463065, doi: 10.1080/17518369.2018.1463065.22pp.
Vacquie-Garcia, J., Lydersen, C., Biuw,M., Haug, T., Fedak, M.A., and Kovacs, K.M. 2017b. Hooded seal Cystophora cristata foraging areas in the Northeast Atlantic Ocean—Investigated using three complementary methods. PLoS ONE 12: e0187889.
VanWormer, E., Mazet, J.A.K., Hall, A., Gill, V.A., Boveng, P.L., London, J.M., Gelatt, T., Fadely, B.S., Lander, M.E., Sterling, J., Burkanov, V.N., Ream, R.R., Brock, P.M., Rea, L.D., Smith, B.R., Jeffers, A., Henstock, M., Rehberg, M.J., Burek-Huntington, K.A., Cosby, S.L., Hammond, J.A., and Goldstein T. 2019. Viral emergence in marine mammals in the North Pacific may be linked to Arctic sea ice reduction. Sci Rep 9: 1-11.
Wang, S.W,, Springer, A.M., Budge, S.M., Horstmann, L., Quakenbush, L.T., and Wooller, M.J. 2016. Carbon sources and trophic relationships of ice seals during recent environmental shifts in the Bering Sea. Ecol Appl 26: 830-845.
Wathne, J.A., Haug, T,. and Lydersen, C. 2000. Prey preferences and niche overlap of ringed seals (Phoca hispida) and harp seals (P. groenlandica) in the Barents Sea. MEPS 194: 233-239.
Young, B.G., Loseto, L.L., and Ferguson, S.H. 2010. Diet differences among age classes of Arctic seals: evidence from stable isotope and mercury biomarkers. Polar Biol 33: 153-162.
Øigård, T.A., Lindstrøm, U., Haug, T., Nilssen, K.T., and Smout, S. 2013. Functional relationship between harp seal body condition and available prey in the Barents Sea. Mar Ecol Prog Ser 484: 287-301.
Øigård, T.A., Haug, T., and Nilssen, K.T. 2014: Current status of hooded seals in the Greenland Sea. victims of climate change and predation? Biol Conserv 172: 29-36. doi: 10.1016/j.biocon.2014.02.007.
High trophic level mammals [AI12]
Phenomenon: Decreasing abundance of high trophic level mammals [AP12]
Ecosystem characteristic: Biomass distribution among trophic levels
Important mammal top predators in the Arctic Barents Sea are polar bears, white whales and narwhals. Polar bears and white whales were hunted to near extinction in the Norwegian sectors of the Barents Sea (Lønø, 1970; Lydersen and Kovacs, 2021). Polar bear harvests in Svalbard exceeded the currently estimated total stock in many 5-year periods leading up to protection in 1973 (Lønø, 1970) and in some periods were two times the current estimate for the total resident stock. Polar bears are part of the MOSJ monitoring programme (https://MOSJ.no), but the species has only been surveyed twice and the second survey did not include the entire range, so the trend is only available for bears resident in the Svalbard Archipelago (Aars et al., 2009, 2017). Narwhal were taken whenever they were accessible, but historically this harvest did not comprise large numbers of animals. Narwhals and white whales have recently been surveyed for the first time in the Barents Region (Vacquie-Garcia et al. 2017, 2020), providing status information and a base for future trend assessments. White whale harvests have been reviewed (Lønø and Øynes, 1961), so minimal estimates of the takes in Svalbard are known; it is likely that the population was reduced by 95% when it was declared commercially extinct in the early 1960s, and subsequently protected (Lydersen and Kovacs 2021, RL 2021).
Historically harvest was unquestionably the most important driver for polar bear and white whale abundance. Presently climate change and pollutants are the most likely anthropogenic drivers for these two species. Polar bears have undergone some recovery in the period that they have been protected (since 1973) and the population that is resident in Svalbard is estimated to be either stable (some 250 animals) or increasing slightly. However, as ice- affiliated seals whales decline with climate change, polar bear numbers are expected to also decline (Aars et al., 2017; Stern and Laidre, 2016; Kovacs et al. 2021); reproductive values are already showing slight downward tendencies. Climate change is likely going to be the most important driver for future narwhal abundance in the Barents Sea as well. Hunting is currently also a serious issue for narwhal in East Greenland (Heide-Jørgensen et al. 2020), but connectivity among Greenlandic and Norwegian stocks is unknown. Narwhals in the northern Barents region appear to be tightly ice-affiliated (Vacquié Garcia et al., 2017; Ahonen et al., 2019) and are thus likely to be particularly sensitive to ongoing declines in sea ice compared to populations that spend some seasons in coastal ice-free areas. This species is also thought to be particularly sensitive to anthropogenic noise (Laidre et al., 2015). Currently the number of white whales in Svalbard is low (Vacquié-Garcia et al., 2020) and habitat deterioration is expected to result in further decline. High levels of pollutants are also of concern for this species and the narwhal in the Norwegian Arctic (Andersen et al., 2001, 2006; Wolkers et al., 2004, 2006; Villanger et al., 2020). Knowledge about the link to anthropogenic drivers is assessed as certain.
Top-trophic feeding marine mammals likely exert considerable influences on the ecosystems they occupy. These include - top-down control, vertical circulation of nutrients (e.g., Lavery et al., 2014; Devred et al., 2021), bioturbation of benthos for benthic feeders (white whales), and dead whales represent nutrients for scavengers (including polar bears) (see below for details regarding these ecosystem interactions). Polar bears as pinnacle predators have particularly high capacities to influence prey populations. Although common wisdom suggests that these animals have considerable influence on the structuring of the ecosystems that they occupy, the understanding of the results of changes in their standing biomass is complex and not well documented. Knowledge about the importance of change in the indicator for other parts of the ecosystem is thus assessed as less good.
Alteration of numbers/biomass in the indicators can alter the abundance of other species as well as altering the structure and functioning of the ecosystems they occupy i.e., increases in killer whales in the Canadian Arctic have resulted in increased predation pressure on the ice-associated Artic endemic whales (Mathews et al., 2020).
Even though polar bears are a selected monitoring species in MOSJ, surveys are only conducted intermittently (Aars et al., 2009, 2017) and recent information from Russian areas is lacking completely. There is no established monitoring of white whales or narwhal, creating a serious knowledge gap for these species.
It is certain that polar bear and white whale populations remain significantly reduced from historical population sizes. Polar bears are listed as Vulnerable on the Norwegian Red List due to habitat deterioration (RL, 2021). White whales have recently been designated as Endangered due to the massive reduction in population size due to harvesting, the small number remaining and future predictions for declines in core habitat areas (sea ice and glacier fronts) (RL, 2021). Increased monitoring effort is needed to document trends in the high-trophic feeding marine mammal populations in the Barents Sea.
References
Aars, J. Marques, T. A., Buckland, S. T., Andersen, M., Belikov, S., Boltunov, A., and Wiig, Ø. 2009. Estimating the Barents Sea polar bear population size. Mar. Mammal Sci. 25: 35-52.
Aars, J., Marques, T. A., Lone, K., Andersen, M., Wiig, Ø., Fløystad, I. M. B., Hagen, S. B., and Buckland, S. T. 2017. The number and distribution of polar bears in the western Barents Sea. Polar Res. 36, art. no. 1374125: 1-15.
Ahonen, H., Stafford, K. M., Lydersen, C., de Steur, L., and Kovacs, K. M. 2019. A multi-year study of narwhal occurrence in the western Fram Strait - detected via passive acoustic monitoring. Polar Res. 38, art. no.3468: 1-14, doi: 10.33265/polar.v38.3468.
Andersen, G., Kovacs, K. M., Lydersen, C., Skaare, J. U., Gjertz, I., and Jenssen, B. M. 2001. Concentrations and patterns of organochlorine contaminants in white whales (Delphinapterus leucas) from Svalbard, Norway. Sci. Total Environ. 264: 267-281.
Andersen, G., Foreid, S., Skaare, J. U., Jenssen, B. M., Lydersen, C., and Kovacs, K. M. 2006. Levels of toxaphene congeners in white whales (Delphinapterus leucas) from Svalbard, Norway. Sci. Total Environ. 357: 128-137.
Devred, E., Hilborn, A., and den Heyer, C.E. 2021. Enhanced chlorophyll-a concentration in the wake of Sable Island, eastern Canada, revealed by two decades of satellite observations: a response to grey seal population dynamics? Biogeosciences, 18, 6115–6132, https://doi.org/10.5194/bg-18-6115-2021
Heide-Jørgensen, M-P., Garde, E., Hansen, R.G., Tervo, O.M., Sinding, M.H.S., Witting, L., Marcoux, M., Watt, C., Reeves, R.R., and Kovacs, K.M. 2020. Narwhals require targeted conservation. Science 370: 416, doi.10.1126/science.abe7105.
Kovacs, K.M., Belikov, S., Boveng, P., Desportes, G., Ferguson, S., Hansen, R.G., Laidre, K., Stenson, G., Thomas, P., Ugarte, F., and Vongraven, D. 2021. SAMBR Update and Overview of Circumpolar Arctic Scientific Monitoring – Marine Mammals. Conservation of Arctic Flora and Fauna International Secretariat, Akureyri, Iceland.
Laidre, K.L., Stern, H., Kovacs, K.M., Lowry, L., Moore, S.E., Regehr, E.V., Ferguson, S.H., Wiig, Ø., Boveng, P., Angliss, R.P., Born, E.W., Litovka, D., Quakenbush, L., Lydersen, C., Vongraven, D., and Ugarte, F. 2015. Arctic marine mammal population status, sea ice habitat loss, and conservation recommendations for the 21st century. Conserv. Biol. 29: 724–737.
Laverty, T.J., Roudnew, B., Seymour, J., Mitchell, J.G., Smetacek, V., and Nicol. S. 2014. Whales sustain fisheries: blue whales stimulate primary production in the Southern Ocean. Marine Mammal Science 30: 888-904.
Lønø, O., and Øynes, P. 1961. White whale fishery at Spitzbergen. Norsk Hvalf.- Tid. 7:267-288.
Lydersen, C., and Kovacs, K. M. 2021. A review of the ecology and status of white whales (Delphinapterus leucas) in Svalbard, Norway. Polar Research 40: 5509. http://dx.doi.org/10.33265/polar.v40.5509
Matthews, C.J.D., Breed, G.A., LeBlanc, B., and Ferguson, S.H. 2020. Killer whale presence drives bowhead whale selection for sea ice in Arctic seascapes of fear. Proc. Natl. Acad. Sci. 117(12): 6590-6598. doi: 10.1073/pnas.1911761117.
RL (Norsk Rødliste for Arter). 2021. https://artsdatabanken.no/lister/rodlisteforarter/2021.
Stern, H.L., and Laidre, K.L. 2016. Sea-ice indicators of polar bear habitat. Cryosphere 10: 2027–2041.
Vacquié-Garcia, J., Lydersen, C., Marques, T. A., Aars, J., Ahonen, H., Skern-Mauritzen, M., Øien, N., and Kovacs, K. M. 2017. Late summer distribution and abundance of ice-associated whales in the Norwegian High Arctic. Endang. Species Res. 32: 59-70.
Vacquie-Garcia, J., Lydersen, C., Marques, T. A., Andersen, M., and Kovacs, K. M. 2020. First abundance estimate for white whales (Delphinapterus leucas) in Svalbard, Norway. Endang. Species Res. 41: 253-263.
Villanger GD, Kovacs KM, Lydersen C, Haug LS, Sabaredzovic A, Jenssen BM, Routti H. 2020. Perfluoroalkyl substances (PFASs) in white whales (Delphinapterus leucas) from Svalbard – A comparison of levels in plasma sampled 15 years apart. Environ Pollut 263: 114497. doi: 10.1016/j.envol.2020.114497.
Wolkers, H., Bavel, B. van, Derocher, A. E., Wiig, Ø., Kovacs, K. M., Lydersen, C., and Lindström, G. 2004. Congener-specific accumulation and food chain transfer of polybrominated diphenyl ethers in two Arctic food chains. Environ. Sci. Technol. 38: 1667-1674.
Wolkers, H., Lydersen, C., Kovacs, K. M., Burkow, I., and Bavel, B. van. 2006. Accumulation, metabolism, and food-chain transfer of chlorinated and brominated contaminants in subadult white whales (Delphinapterus leucas) and narwhals (Monodon monoceros) from Svalbard, Norway. Arch. Environ. Contam. Toxicol. 50: 69-78.
High TL zooplankton functional groups [AI13]
Phenomenon: Decreasing biomass of pelagic amphipods relative to gelatinous zooplankton [AP13]
Ecosystem characteristic: Functional groups within trophic levels
The indicator is estimated using biomass data based on pelagic trawl catches for pelagic amphipods and gelatinous zooplankton. Under the reference condition, pelagic amphipods, and in particular the hyperiid Themisto libellula, are a significant component of the zooplankton community in the Arctic part of the Barents Sea (Zhukova et al., 2009; Stige et al., 2019; Dalpadado et al., 2020) and important for sustaining lipid-dependent Arctic predators, such as the polar cod (Dalpadado et al., 2001, 2016; Hop and Wiencke, 2019; ICES, 2020). There are larger uncertainties associated with our understanding of the ecosystem role of gelatinous zooplankton in general (e.g., Hays et al., 2018; Stoltenberg et al., 2021), and thus also for the Arctic part of the Barents Sea in particular (Swanberg and Bamstedt, 1991) under the reference condition.
The most important anthropogenic driver of change in the indicator is climate change, particularly rising temperatures and increased darkening of the water column in coastal areas. Large pelagic amphipods are negatively affected by increasing temperatures and declining sea-ice cover (Stige et al., 2019; Dalpadado et al., 2020). There are indications that climate change may have a positive effect on jellyfish, but the evidence is weak and limited to ctenophoran and scyphozoan species (Eriksen et al., 2012, 2018). Darkening of the water column because of higher levels of suspended matter from run off in coastal areas may enhance tactile predators, such as gelatinous zooplankton, over visual predators (Aksnes et al., 2009; Szeligowska et al., 2021). The understanding of the link between driver and indicator is therefore rated as less certain.
Amphipods and jellyfish have widely different functions as predators and prey, and a substantial change in the ratio of biomass of these two groups is likely to have ecosystem effects. However, while much is known about the role of amphipods as prey and predator, considerably less is known about gelatinous species (see above). The overall uncertainties are substantial, and the understanding of the importance of changes in the indicator for other parts of the ecosystem is thus rated as less good.
Important knowledge gaps include abundance estimates of gelatinous zooplankton and the importance of jellyfish as predators and prey (i.e. their importance in the food web), including differentiating the roles of smaller jellyfish and larger ones.
References
Aksnes, D. L., Dupont, N., Staby, A., Fiksen, Ø., Kaartvedt, S., and Aure, J. 2009. Coastal water darkening and implications for mesopelagic regime shifts in Norwegian fjords. Marine Ecology Progress Series, 387: 39-49.
Dalpadado, P., Arrigo, K. R., van Dijken, G. L., Skjoldal, H. R., Bagøien, E., Dolgov, A., Prokopchuk, I., et al. 2020. Climate effects on temporal and spatial dynamics of phytoplankton and zooplankton in the Barents Sea. Progress in Oceanography, 185: 102320.
Dalpadado, P., Borkner, N., Bogstad, B., and Mehl, S. 2001. Distribution of Themisto (Amphipoda) spp in the Barents Sea and predator-prey interactions. ICES Journal of Marine Science, 58: 876-895.
Dalpadado, P., Hop, H., Rønning, J., Pavlov, V., Sperfeld, E., Buchholz, F., Rey, A., et al. 2016. Distribution and abundance of euphausiids and pelagic amphipods in Kongsfjorden, Isfjorden and Rijpfjorden (Svalbard) and changes in their relative importance as key prey in a warming marine ecosystem. Polar Biology, 39: 1765-1784.
Eriksen, E., Bogstad, B., Dolgov, A., and Beck, I. M. 2018. Cod diet as an indicator of Ctenophora abundance dynamics in the Barents Sea. Marine Ecology Progress Series, 591: 87-100.
Eriksen, E., Prozorkevich, D., Trofimov, A., and Howell, D. 2012. Biomass of Scyphozoan jellyfish, and its spatial association with 0-group fish in the Barents Sea. Plos One, 7.
Hays, G. C., Doyle, T. K., and Houghton, J. D. R. 2018. A paradigm shift in the trophic Importance of jellyfish? Trends in Ecology & Evolution, 33: 874-884.
Hop, H., and Wiencke, C. 2019. The Ecosystem of Kongsfjorden, Svalbard. In Advances in Polar Ecology. Springer, Cham, Zwitzerland.
ICES. 2020. Working Group on the Integrated Assessments of the Barents Sea (WGIBAR). ICES Scientific Reports. 2:30. 206 pp.
Stige, L. C., Eriksen, E., Dalpadado, P., and Ono, K. 2019. Direct and indirect effects of sea ice cover on major zooplankton groups and planktivorous fishes in the Barents Sea. ICES Journal of Marine Science, 76: I24-I36.
Stoltenberg, I., Dierking, J., Muller-Navarra, D. C., and Javidpour, J. 2021. Review of jellyfish trophic interactions in the Baltic Sea. Marine Biology Research, 17: 311-326.
Swanberg, N., and Bamstedt, U. 1991. Ctenophora in the Arctic—the abundance, distribution and predatory impact of the cydippid ctenophore Mertensia ovum (Fabricius) in the Barents Sea. Polar Research, 10: 507-524.
Szeligowska, M., Trudnowska, E., Boehnke, R., Dąbrowska, A. M., Dragańska-Deja, K., Deja, K., Darecki, M., et al. 2021. The interplay between plankton and particles in the Isfjorden waters influenced by marine- and land-terminating glaciers. Science of The Total Environment, 780: 146491.
Zhukova, N. G., Nesterova, V. N., Prokopchuk, I. P., and Rudneva, G. B. 2009. Winter distribution of euphausiids (Euphausiacea) in the Barents Sea (2000–2005). Deep Sea Research II, 56: 1959-1967
Benthic habitat engineers [AI14]
Phenomenon: Decreasing biomass of benthic habitat engineers [AP14]
Ecosystem characteristic: Functional groups within trophic levels
Under reference conditions, biomass of benthic habitat engineers should be sufficient to host local biodiversity hot spots and provide the ecosystem with habitat complexity promoting nursing and feeding.
The most important anthropogenic driver of change in this indicator is bottom-trawling. Local, large, erected, and immobile species will have a high likelihood of being hit by a bottom trawl compared to small, cryptic infaunal species. Arguably, much of the trawling effect in the southern Barents Sea has already been realized, so effects in the northern regions (AI307) are more likely to be observed when trawling moratoria in the northern Barents Sea are lifted. Some effects are likely already being felt north of Svalbard where shrimp and cod trawling is underway (Sswat et al., 2015). Several studies (Jørgensen et al., 2016, 2019; Øseth et al., 2016) have indicated the threat of bottom trawling to habitat engineers in the northern Barents Sea and rate these areas highly vulnerable to trawling effects (and combined effects with climate warming). The understanding of the link between the driver and the indicator is thus rated as “ certain ”.
Removal of existing benthic species constitutes a development away from intact nature (i.e., without human pressures). Habitat engineers provide substrate and food for a large number of species, and it can be expected that reduction in these habitat-forming species will reduce biodiversity levels. This may be particularly important in areas thus far not experiencing bottom trawling and other seafloor disturbances.
The ecosystem significance of decreasing benthic habitat engineers has not been verified for the Barents Sea, but the effect of structure-forming corals and sponges and their use as fish habitat has been described for the Bering Sea Submarine Canyons (Miller et al., 2018). The understanding of the importance for the rest of the ecosystem of decreasing Benthic habitat engineers is thus rated as good.
The term 'habitat engineer' specifically indicates how the species modifies the environment. Changes in seafloor/habitat heterogeneity, altered bottom-currents, and changes in resuspension and particle loads are just a few changes in the seafloor environment that will likely lead to changes in other components of the system. Indeed, some of the species forming habitat are highlighted as specifically important or vulnerable (sponges, corals, sea pens). Few specific studies have addressed this specifically in the northern or southern Barents Sea, but these patterns of impact have been observed elsewhere and can be expected to occur in the Barents Sea as well.
Knowledge gaps: A risk-analysis of having bottom-trawling in areas with large, upraised, immobile species needs to be made.
Reference
Jørgensen, L. L.., Planque, B., Thangstad, T. H., and Certain, G. 2016. Vulnerability of megabenthic species to trawling in the Barents Sea. ICES Journal of Marine Science, 73: i84–i97.
Jørgensen, L. L.., Primicerio, R., Ingvaldsen, R. B., Fossheim, M., Strelkova, N., Thangstad, T. H., Manushin, I., et al. 2019. Impact of multiple stressors on sea bed fauna in a warming Arctic. Marine Ecology Progress Series, 608: 1–12.
Miller, D. D., Ota, Y., Sumaila, U. R., Cisneros‐Montemayor, A. M., and Cheung, W. W. L. 2018. Adaptation strategies to climate change in marine systems. Global Change Biology, 24: e1–e14.
Øseth, E., Jørgensen, L. L.., Renaud, P. E., and Andrade, H. 2016. Benthos vulnerability to bottom trawling. Brief Reports, 037. Norwegian Polar Institute
Sswat, M., Gulliksen, B., Menn, I., Sweetman, A. K., and Piepenburg, D. 2015. Distribution and composition of the epibenthic megafauna north of Svalbard (Arctic). Polar Biology, 38: 861–877.
Fish size [AI15]
Phenomenon: Increasing body length at maturity across species in a fish community [AP15]
Ecosystem characteristic: Functional groups within trophic levels
Under the reference condition, community mean body length of demersal fish in the Arctic is comparatively smaller than in the Sub-Arctic region, since Arctic fish species are typically smaller and mature earlier compared to boreal species (Wiedmann et al., 2014).
The most important anthropogenic driver of change in this indicator is climate change. Arctic species are characterized by smaller body length at maturation compared to Sub-Arctic and boreal species (Wiedmann et al., 2014). Due to climate change, southern species are redistributing northwards (Fossheim et al., 2015). The ongoing species redistribution is reflected in an increase of the abundance of larger Sub-Arctic and boreal demersal fish species at the expense of smaller Arctic species, resulting in an increase in the community mean body length of demersal fish species (Frainer et al., 2017). The understanding of the link between climate change and the indicator is assessed as certain in the Barents Sea.
Body size is considered a master trait in the ocean, as an organism´s body size is related to many other traits such as metabolism and feeding ecology (Brown et al., 2004; Andersen et al., 2016). Marine food webs are largely structured by species body size (Brose et al., 2006; Andersen, 2019), with the Barents Sea not being an exception (Pecuchet et al., 2020). As the abundance of the comparatively large Sub-Arctic species increases in the Arctic, the structure of the Arctic food web will change as large species can, in general, eat a wider size range of prey. Notably in the Barents Sea, large boreal species are generally piscivorous species with a higher trophic level (Frainer et al., 2017). These large generalist species have the capacity to feed on both demersal and pelagic compartments and might thus impact the bentho-pelagic coupling. Changes in the size structure of fish communities can have implications for top-down and bottom-up control in the ecosystem (Brose et al., 2012) and affect the energy flow across trophic levels. Changes in the body size composition in the community will thus impact the structure of the Arctic food web, and ultimately its functioning. The understanding of the importance of changes in the indicator for other parts of the ecosystem is assessed as good.
Increasing trend in community level body length at maturation can be considered of ecosystem significance if, for example, i) the structure of the food web changes, e.g., from top-down to bottom-up control in the ecosystem, ii) it affects energy flow across trophic levels and ii) changes the coupling between benthic, demersal and pelagic compartments.
Knowledge gaps:
The extent to which ecosystem functions, such as carbon fluxes and bentho-pelagic coupling, are affected by changes in body size structure is uncertain. In addition, it is uncertain how other trophic levels might compensate for changes in fish community size structure.
References
Andersen, K. H. 2019. Fish ecology, evolution, and exploitation - a new theoretical synthesis, Princeton University Press, Princeton and Oxford.
Andersen, K. H., Berge, T., Goncalves, R. J., Hartvig, M., Heuschele, J., Hylander, S., Jacobsen, N. S., et al. 2016. Characteristic sizes of life in the oceans, from bacteria to whales. Annual Review of Marine Science, 8: 217-241.
Brose, U., Dunne, J. A., Montoya, J. M., Petchey, O. L., Schneider, F. D., and Jacob, U. 2012. Climate change in size-structured ecosystems. Philosophical Transactions of the Royal Society B-Biological Sciences, 367: 2903-2912.
Brose, U., Jonsson, T., Berlow, E. L., Warren, P., Banasek-Richter, C., Bersier, L. F., Blanchard, J. L., et al. 2006. Consumer-resource body-size relationships in natural food webs. Ecology, 87: 2411-2417.
Brown, J. H., Gillooly, J. F., Allen, A. P., Savage, V. M., and West, G. B. 2004. Toward a metabolic theory of ecology. Ecology, 85: 1771-1789.
Fossheim, M., Primicerio, R., Johannesen, E., Ingvaldsen, R. B., Aschan, M. M., and Dolgov, A. V. 2015. Recent warming leads to a rapid borealization of fish communities in the Arctic. Nature Climate Change, 5: 673-677.
Frainer, A., Primicerio, R., Kortsch, S., Aune, M., Dolgov, A. V., Fossheim, M., and Aschan, M. M. 2017. Climate-driven changes in functional biogeography of Arctic marine fish communities. Proceedings of the National Academy of Sciences of the United States of America, 114: 12202-12207.
Pecuchet, L., Blanchet, M. A., Frainer, A., Husson, B., Jorgensen, L. L., Kortsch, S., and Primicerio, R. 2020. Novel feeding interactions amplify the impact of species redistribution on an Arctic food web. Global Change Biology, 26: 4894-4906.
Wiedmann, M. A., Primicerio, R., Dolgov, A., Ottesen, C. A. M., and Aschan, M. 2014. Life history variation in Barents Sea fish: implications for sensitivity to fishing in a changing environment. Ecology and Evolution, 4: 3596-3611.
Fish life history [AI16]
Phenomenon: Increasing slow-life, periodic fish species [AP16]
Ecosystem characteristic: Functional groups within trophic levels
Under the reference condition, the demersal fish communities in the Arctic are likely characterized by a relatively high proportion of small sized species with a fast-life, opportunistic life history strategy, compared to the Sub-Arctic demersal fish communities (Wiedmann et al., 2014).
The most important anthropogenic driver of change in this indicator is climate change. Climate-driven reduction of sea ice, increased sea temperature and pelagic primary productivity facilitate a movement of boreal fish species (mainly pelagic and bentho-pelagic species) northwards into water masses traditionally considered Arctic (e.g. Fossheim et al., 2015). These species include the north-east Arctic cod (Gadus morhua), northeast Arctic haddock (Melanogrammus aeglefinus), beaked redfish (Sebastes mentella) and golden redfish (Sebastes norvegicus) (Fossheim et al., 2015). These boreal species are characterized by a generalist diet, large body size, high fecundity, and high age at maturity in comparison to the Arctic fish species (Wiedmann et al., 2014; Frainer et al., 2017). The traits of the most abundant Arctic fish species are characteristic of fast-life, opportunistic species, whereas several of the incoming boreal species are characteristic of Periodic species with slower-life history strategy (Winemiller and Rose, 1992; Pecuchet et al., 2017). Due to climate change, the abundance of mostly opportunistic/fast-life Arctic species is expected to decline whereas the abundance of periodic/slow-life boreal species is expected to increase in the Arctic. Therefore, the fish community composition in the Arctic is expected to be increasingly composed of slow-life, periodic species for the demersal compartment. Although the specific expectation for effects of climate change on life history strategies is quite certain for the Arctic part of the Barents Sea, the mechanistic link between climate change and life history strategies in general is not well understood. Therefore, the link between fish life history strategies and climate change is assessed as less certain.
Life-history strategies are the result of correlations and trades-offs among life-history traits (Winemiller et al., 2015). For fish, the equilibrium–periodic–opportunistic framework (Winemiller and Rose, 1992) links three strategies characterized by trade-offs between fecundity, juvenile survival and generation time to environmental stability and predictability. The ‘equilibrium species’ have a large body size, produce few but large offspring with high survival rate, this strategy is typically followed by sharks and rays (Pecuchet et al., 2017). The ‘periodic species’ have also a large body size but produce many small eggs with low survival rate, this strategy is typically followed by gadoid species such as cod. The ‘opportunistic species’ have a small body size, short lifespan, and short generation time, this strategy is typically followed by small demersal species such as snailfishes (Liparidae) and lumpsuckers (Eumicrotremus spp.) or small pelagic species such as capelin (Mallotus villosus). The equilibrium strategy is hypothesized to prevail in stable and predictable environments, while the opportunistic strategy in unstable and unpredictable environments. The periodic strategy is hypothesized to occur in seasonal but predictable environments. A resilient ecosystem is composed of species displaying a variety of life-history strategies, because the different life-history strategies respond differently to ecosystem change and variability. Profound changes in the dominance of these strategies could thus affect ecosystem resilience. In addition, these changes can impact food web structure and function, as species’ trophic level is correlated to the life-history strategy (i.e., fast/opportunistic species which are characterized by a small body size have low trophic level (Pecuchet et al., 2017). The understanding of the importance for other parts of the ecosystem of increasing slow life, periodic life history strategies in the demersal fish community is assessed as less good.
Increasing trend in the relative biomass of slow life, periodic life histories in the Arctic Barents Sea can be considered of ecosystem significance if i) the diversity in life-history strategies in the communities is eroded, due for example to a decrease in the abundance of fast-life, opportunistic species in the Arctic.
Knowledge gaps:
There are still knowledge gaps on the response of life-history strategies to climate change, and on the impact of changes in the life-history strategy distribution of the community on the ecosystem functions.
References
Fossheim, M., Primicerio, R., Johannesen, E., Ingvaldsen, R. B., Aschan, M. M., and Dolgov, A. V. 2015. Recent warming leads to a rapid borealization of fish communities in the Arctic. Nature Climate Change, 5: 673-677.
Frainer, A., Primicerio, R., Kortsch, S., Aune, M., Dolgov, A. V., Fossheim, M., and Aschan, M. M. 2017. Climate-driven changes in functional biogeography of Arctic marine fish communities. Proceedings of the National Academy of Sciences of the United States of America, 114: 12202-12207.
Pecuchet, L., Lindegren, M., Hidalgo, M., Delgado, M., Esteban, A., Fock, H. O., de Sola, L. G., et al. 2017. From traits to life-history strategies: Deconstructing fish community composition across European seas. Global Ecology and Biogeography, 26: 812-822.
Wiedmann, M. A., Primicerio, R., Dolgov, A., Ottesen, C. A. M., and Aschan, M. 2014. Life history variation in Barents Sea fish: implications for sensitivity to fishing in a changing environment. Ecology and Evolution, 4: 3596-3611.
Winemiller, K. O., Fitzgerald, D. B., Bower, L. M., and Pianka, E. R. 2015. Functional traits, convergent evolution, and periodic tables of niches. Ecology Letters, 18: 737-751.
Winemiller, K. O., and Rose, K. A. 1992. Patterns of life-history diversification in North American fishes: implications for population regulation. Canadian Journal of Fisheries and Aquatic Sciences, 49: 2196-2218.
Fish habitat use [AI17]
Phenomenon: Change in proportion of benthic fish [AP17]
Ecosystem characteristic: Functional groups within trophic levels
Under the reference condition, the benthic fish community is an important part of the ecosystem, receiving considerable amounts of carbon from pelagic primary production. Arctic benthic fish species constitute a considerable proportion of the bottom fish community biomass in the ecosystem, as the polar cod (Boreogadus saida) is the only abundant fish species present in the Arctic throughout the year that has a strong affiliation to the pelagic habitat (Christiansen and Reist, 2013).
The most important anthropogenic driver of change in this indicator is climate change. In areas with extensive sea ice, much of the primary production sinks to the bottom (especially ice algae that are released when the ice melts), but the productivity in the pelagic is low during large parts of the year (Hobson et al., 1995; Wassmann and Reigstad, 2011). Indeed, the proportion of carbon being exported towards the bottom is higher in Arctic than in Atlantic water masses (Reigstad et al., 2011). Less sea ice will lead to a shift where less of the primary production becomes available for benthic organisms, and more is consumed by zooplankton in the pelagic water masses (Kedra et al., 2015). This in turn facilitates a movement of boreal fish species (mainly pelagic and bentho-pelagic species, but also some benthic ones) northwards into water masses traditionally considered Arctic (e.g. Fossheim et al., 2015). These species include the Atlantic cod (Gadus morhua), northeast Arctic haddock (Melanogrammus aeglefinus), beaked redfish (Sebastes mentella), long rough dab (Hippoglossoides platessoides) and golden redfish (Sebastes norvegicus) (Fossheim et al., 2015). Similar shifts have been observed in the northern Bering Sea (Overland and Stabeno, 2004; Grebmeier et al., 2006). Thus, climate change is expected to lead to an increase in pelagic and bentho-pelagic fish species at the expense of benthic species (Wassmann and Reigstad, 2011; Jones et al., 2014; Kedra et al., 2015). The above-mentioned boreal species are efficient predators that are shown to feed on small, demersal fish species (e.g. Eriksen et al., 2020), and they may therefore have a negative effect on the typically small demersal arctic fish species. Thus, climate change is expected to lead to a decrease in the proportion of the typically arctic benthic fish species due to both lower food resources and increased predation pressure from boreal species. However, benthic boreal species, such as the long-rough dab, will likely increase in the Arctic areas following climate change. Even though the different mechanisms linking the indicator with climate change is well understood, the outcome of different effects on the indicator in unknown, since “benthic fish” includes both typically Arctic and boreal species and the expected decline in Arctic species may be compensated for by increasing boreal species. Therefore, the link between climate change and the indicator is assessed as less certain. In addition, fisheries may be affecting some of the boreal fish stocks (e.g., the Northeast Atlantic cod stock) entering the northern Barents Sea, which could also affect the changes in this indicator.
The indicator reflects the biomass allocation in pelagic (bentho-pelagic) and benthic ecosystem compartments, respectively, and thus changes in the pelagic-benthic coupling (Griffiths et al., 2017). This is a key feature of ecosystem structure in aquatic ecosystems, providing a simple measure of the status of a fish community (e.g. Pennino and Bellido, 2012). Changes in the ratio likely reflect community-wide alterations in community structure and biomass allocation, and the indicator may therefore be indicative of regime shifts (Aschan et al., 2013). When interpreting changes in the ratio, many factors will need to be accounted for simultaneously, and the understanding of the importance of changes in this indicator for other parts of the ecosystem is thus assessed as less good.
Change in proportion of benthic fish biomass can be considered of ecosystem significance if, for example, i) benthic fish are replaced by benthic invertebrates (e.g., crabs).
Knowledge gaps and uncertainties:
Although a larger part of the primary production is expected to be consumed in the pelagic compartment, there is uncertainty as to how the primary and secondary production will develop in different, previously ice-covered areas under climate change (e.g., Wassmann and Reigstad, 2011). This will in turn influence the amount and allocation of energy available to bentho-pelagic species during different seasons. Although many of the boreal species moving northwards in response to warming can be defined as bentho-pelagic (e.g., cod, haddock), others are benthic (including the highly abundant and widely distributed long rough dab), which makes interpretation of this indicator challenging. Furthermore, the definition of whether a species is "benthic" or "bentho-pelagic" clearly affects the temporal development of the indicator, although changes may be expected.
References
Aschan, M., Fossheim, M., Greenacre, M., and Primicerio, R. 2013. Change in fish community structure in the Barents Sea. Plos One, 8: 1-12.
Christiansen, J. S., and Reist, J. D. 2013. Fishes. In Arctic Biodiversity Assessment. Conservation of Arctic Flora and Fauna (CAFF), pp. 192-245. Ed. by H. Meltofte. Narayana Press, Akureyri.
Eriksen, E., Benzik, A. N., Dolgov, A. V., Skjoldal, H. R., Vihtakari, M., Johannesen, E., Prokhorova, T. A., et al. 2020. Diet and trophic structure of fishes in the Barents Sea: The Norwegian-Russian program "Year of stomachs" 2015-Establishing a baseline. Progress in Oceanography, 183: 102262.
Fossheim, M., Primicerio, R., Johannesen, E., Ingvaldsen, R. B., Aschan, M. M., and Dolgov, A. V. 2015. Recent warming leads to a rapid borealization of fish communities in the Arctic. Nature Climate Change, 5: 673-677.
Grebmeier, J. M., Overland, J. E., Moore, S. E., Farley, E. V., Carmack, E. C., Cooper, L. W., Frey, K. E., et al. 2006. A major ecosystem shift in the northern Bering Sea. Science, 311: 1461-1464.
Griffiths, J. R., Kadin, M., Nascimento, F. J. A., Tamelander, T., Törnroos, A., Bonaglia, S., Bonsdorff, E., et al. 2017. The importance of benthic-pelagic coupling for marine ecosystem functioning in a changing world. Global Change Biology, 23: 2179-2196.
Hobson, K. A., Ambrose Jr, W. G., and Renaud, P. E. 1995. Sources of primary production, benthic-pelagic coupling, and trophic relationships within the Northeast Water Polynya: Insights from delta C-13 and delta N-15 analysis. Marine Ecology Progress Series, 128: 1-10.
Jones, D. O. B., Yool, A., Wei, C. L., Henson, S. A., Ruhl, H. A., Watson, R. A., and Gehlen, M. 2014. Global reductions in seafloor biomass in response to climate change. Global Change Biology, 20: 1861-1872.
Kedra, M., Moritz, C., Choy, E. S., David, C., Degen, R., Duerksen, S., Ellingsen, I., et al. 2015. Status and trends in the structure of Arctic benthic food webs. Polar Research, 34.
Overland, J. E., and Stabeno, P. J. 2004. Is the climate of the Bering Sea warming and affecting the ecosystem? Eos Trans. Am. Geophys. Union, 85: 309-312.
Pennino, M. G., and Bellido, J. M. 2012. Can simple pelagic-demersal ratio explain ecosystem functioning? Biodiversity Journal, 3: 69-78.
Reigstad, M., Carroll, J., Slagstad, D., Ellingsen, I., and Wassmann, P. 2011. Intra-regional comparison of productivity, carbon flux and ecosystem composition within the northern Barents Sea. Progress in Oceanography, 90: 33-46.
Wassmann, P., and Reigstad, M. 2011. Future Arctic Ocean seasonal ice zones and implications for pelagic-benthic coupling. Oceanography, 24: 220-231.
Seabird feeding types [AI18]
Phenomenon: Decreasing proportion of diving to surface-feeding seabirds [AP18]
Ecosystem characteristic: Functional groups within trophic levels
Under the reference condition, the diving seabirds are important piscivorous predators in the Barents Sea ecosystem and a dominant part of the avifauna (ICES, 2020). Surface-feeding seabirds are, to a large degree, dependent on diving seabirds and other top predators for food accessibility (Harrison et al., 1991; Camphuysen and Webb, 1999). Extensive industrial fisheries and historical extirpation of cetaceans by the whaling industry during the 19th and 20th centuries did probably alter the ratio between diving and surface-feeding seabirds to an unknown extent.
Fisheries are the most important anthropogenic driver of change affecting the proportion of diving to surface-feeding seabirds. Surface-feeding seabirds typically forage in the upper meter of the ocean and are largely dependent on other top predators (predatory fish, diving seabirds and marine mammals) for driving fish and krill to the surface and making the food accessible (Harrison et al., 1991; Camphuysen and Webb, 1999). In contrast, diving seabirds hunt in a larger portion of the water column and are less dependent on other top predators to access food (Fauchald, 2009; Veit and Harrison, 2017). During the last 50 years, surface-feeding seabirds have profited from large amounts of discards from the fishing industry (Garthe et al., 1996; Votier et al., 2004). At the same time, the same pelagic fisheries are competing with diving piscivorous seabirds, such as auks (Cury et al., 2011; Grémillet et al., 2018). It is therefore expected that increased industrial fisheries could change the functional composition of the seabird community, implying reduced abundance of diving piscivorous seabirds and increased abundance of surface-feeding and scavenging seabirds. In the Barents Sea, dominant surface-feeding birds include gulls (Rissa tridactyla, Larus argentaus, L. marinus, L. hyperboreus) and northern fulmar (Fulmarus glacialis); and dominant diving piscivorous seabirds include the large auks (Fratercula arctica, Uria aalge, U. lomvia) (ICES, 2020). While increased fisheries and discards are expected to result in a decreased proportion of diving to surface-feeding birds, regulatory measures aimed at reducing the discards (i.e., the “discard ban”, Gullestad et al. 2015) and sustainable harvesting could reverse this trend.
The link between fisheries and the indicator is assessed as certain. The mechanisms relating seabird abundance to fishery discards and competition with pelagic fisheries are well understood and have been documented extensively. A decreasing ratio of diving relative to surface-feeding seabirds is expected to be related to unsustainable pelagic fishing practices (i.e., high discard rates and poor regulation of catches). An increased ratio can be expected for reduced discards and sustainable catch regulations.
Seabirds are important top predators in the Barents Sea ecosystem. Facilitation (i.e., positive interactions) between top predators with different functions is considered to be important for top predators in the pelagic ecosystem (Fauchald et al., 2011; Veit and Harrison, 2017), and the function of the top predator guild is accordingly sensitive to changes in functional diversity. There is however still a relatively weak understanding of the importance of these mechanisms. The understanding of the importance of changes in the indicator is assessed as less good.
A decreasing trend in the indicator can be considered of ecosystem significance if there is a persistent and relatively large reduction in the ratio related to unsustainable pelagic fishing practices (i.e., high discard rates and poor regulation of catches). An increased ratio can be expected for reduced discards and sustainable catch regulations.
Knowledge gaps:
How functional diversity and facilitation affect top predators and their role in the pelagic ecosystem is poorly known. The time series from the ecosystem survey in the Barents Sea is relatively short (2004-2020) and the relative abundance of surface-feeding seabirds is biased by their attraction to the survey vessel. How climate change could affect the ratio is unknown.
References
Camphuysen, K., and Webb, A. 1999. Multi-species feeding associations in North Sea seabirds: Jointly exploiting a patchy environment. Ardea, 87: 177-198.
Cury, P. M., Boyd, I. L., Bonhommeau, S., Anker-Nilssen, T., Crawford, R. J. M., Furness, R. W., Mills, J. A., et al. 2011. Global seabird response to forage fish depletion - One-fhird for the birds. Science, 334: 1703-1706.
Fauchald, P. 2009. Spatial interaction between seabirds and prey: review and synthesis. Marine Ecology Progress Series, 391: 139-151.
Fauchald, P., Skov, H., Skern-Mauritzen, M., Hausner, V. H., Johns, D., and Tveraa, T. 2011. Scale-dependent response diversity of seabirds to prey in the North Sea. Ecology, 92: 228-239.
Garthe, S., Camphuysen, C. J., and Furness, R. W. 1996. Amounts of discards by commercial fisheries and their significance as food for seabirds in the North Sea. Marine Ecology Progress Series, 136: 1-11.
Grémillet, D., Ponchon, A., Paleczny, M., Palomares, M. L. D., Karpouzi, V., and Pauly, D. 2018. Persisting worldwide seabird-fishery competition despite seabird community decline. Current Biology, 28: 4009-4013.e4002.
Gullestad, P., Blom, G., Bakke, G. and Bogstad, B. 2015. The “Discard Ban Package”: experiences in efforts to improve the exploitation pattern in Norwegian fisheries. Marine Policy 54(5): 1-9.
Harrison, N. M., Whitehouse, M. J., Heinemann, D., Prince, P. A., Hunt, G. L., and Veit, R. R. 1991. Observations of multispecies seabird flocks around South Georgia. Auk, 108: 801-810.
ICES. 2020. Working Group on the Integrated Assessments of the Barents Sea (WGIBAR). 2:30. 206 pp.
Veit, R. R., and Harrison, N. M. 2017. Positive interactions among foraging seabirds, marine mammals and fishes and implications for their conservation. Frontiers in Ecology and Evolution, 5: 121.
Votier, S. C., Furness, R. W., Bearhop, S., Crane, J. E., Caldow, R. W. G., Catry, P., Ensor, K., et al. 2004. Changes in fisheries discard rates and seabird communities. Nature, 427: 727-730.
Mammal bioturbation [AI19]
Phenomenon: Decreasing abundance of mammals involved in bioturbation [AP19]
Ecosystem characteristic: Functional groups within trophic levels
It is not possible to provide information on the original state of the benthic ecosystem prior to near extirpation of benthic foraging walruses and white whales in the Norwegian Arctic, nor its changing status upon the recovery of walruses.
Overharvesting was the major driver of change in both walrus and white whale populations in the Norwegian Arctic (e.g., Kovacs et al., 2014; Lydersen and Kovacs, 2021) and bearded seals were likely also reduced late in the whaling “plukk-fangst” period. Currently, climate change is the major driver that will result in changes in the abundance/biomass of these species (Kovacs et al., 2015; Kovacs et al., 2021).
The understanding of the link between drivers and changes in the indicator is rated as certain.
Benthic feeding marine mammals in the Arctic are important ecosystems engineers, modifying the seafloor as they search for near-bottom swarming crustaceans or infaunal prey - including benthic shrimp, amphipods, crabs, bivalves, octopus, and polychaete worms (Johnson et al., 1983; Quakenbush et al., 2015; Lacher et al., 2019). Via their suction, jetting, rooting and digging activities, benthic feeding marine mammals resuspend many billions of tons of sediments each year in Arctic waters (Nelson et al., 1994; Marshal et al., 2008). The disturbed bottom is also more prone to erosion by bottom currents adding to the nutrient release, recycling and resultant boosting of primary production (Johnson et al., 1983). The pits and furrows created by benthic feeding whales and pinnipeds result in enhanced benthic species biodiversity and recolonization phenomena, similar to edge effects in terrestrial environments enhancing community species richness (Oliver et al., 1983, 1985; Klaus et al., 1990).
Little research has been directed to the issue of benthic bioturbation by marine mammals in Norwegian Arctic waters, but this thematic research area has had modestly extensive investigation in the Pacific Arctic (see above). The indicator should be developed and incorporated in MAREANO efforts, with direct attention the identifying key benthic foraging areas for marine mammals (via tracking studies, many of which are available e.g., Freitas et al., 2009; Lydersen and Kovacs, 2013; Hamilton et al., 2015; Vacquie Garcia et al., 2018).
Changes in the abundance/biomass of benthic foraging marine mammals will have impacts on benthic biodiversity and nutrient release/transfer, which impacts primary production especially in Arctic coastal shelf areas. The understanding of the importance of change in the indicator for other parts of the ecosystem is still rated as less good.
Marine mammal foraging areas should be incorporated into studies and monitoring conducted in the MAREANO programme to get a better understanding of the role marine mammals play in bioturbation in the Norwegian Arctic.
References
Freitas, C., Kovacs, K.M., Ims, R.A., Fedak, M.A., and Lydersen, C. 2009. Deep into the ice: over-wintering and habitat selection in Atlantic walruses. Marine Ecology Progress Series 375: 247-261.
Hamilton, C. D., Lydersen, C., Ims, R. A., and Kovacs, K. M. 2015. Predictions replaced by facts: a keystone species' behavioural responses to declining arctic sea-ice. Biol. Lett. 11: art. no. 20150803, 6 pp. doi: 10.1098/rsbl.2015.0803
Johnson, K.R., Nelson, C.H., and Barber, J.H. 1983. Assessment of gray whale feeding grounds and sea floor interactions in the northeastern Bering Sea. United States Department of interior Geological Survey – Report 83-727.
Klaus, A.D., Oliver, J.S., and Kvitek, R.G. 1990. The effects of gray whale, walrus, and ice-gouging disturbance on benthic communities in the Bering Sea and Chukchi Sea, Alaska. National Geographic Research 6: 470–84.
Kovacs, K. M., Aars, J., and Lydersen, C. 2014. Walruses recovering after 60+ years of protection at Svalbard, Norway. Polar Res. 33, 26034, doi: 10.3402/polar.v33.26034.
Kovacs, K. M., Lemons, P. R. III, MacCracken, J. G., and Lydersen, C. 2015. Walruses in a time of climate change. Arctic Report Card 2015: 66-74.
Kovacs, K.M., Belikov, S., Boveng, P., Desportes, G., Ferguson, S., Hansen, R.G., Laidre, K., Stenson, G., Thomas, P., Ugarte, F. and Vongraven, D. 2021. SAMBR Update and Overview of Circumpolar Arctic Scientific Monitoring – Marine Mammals. Conservation of Arctic Flora and Fauna International Secretariat, Akureyri, Iceland.
Lacher, T.E., Davidson, A.D.-, Fleming, T.H., Gomez-Ruiz, E.P., McCracken, G.F., Owen-Smith, N., Peres, C.A., and Vander Wall, S.B. 2019. The functional roles of mammals in ecosystems. J. Mammal. 100: 942-964.
Lydersen, C., and Kovacs, K.M. 2013. Walrus Odobenus rosmarus research in Svalbard, Norway, 2000-2010. NAMMCO Sci. Publ. 9: 175-190.
Lydersen, C., and Kovacs, K. M. 2021. A review of the ecology and status of white whales (Delphinapterus leucas) in Svalbard, Norway. Polar Res. In press
Marshall, C.D., Kovacs, K.M., and Lydersen, C. 2008. Feeding kinematics, suction and hydraulic jetting capabilities in bearded seals (Erignathus barbatus). Journal of Experimental Biology 211:699-708.
Nelson, C.H., Phillips,R.L., McRea, J., Barber, J.H., McLaughlin, M.W., and Chin, J.L. 1994. Grey whale and Pacific walrus benthic feeding ground and sea floor interaction in the Chukchi Sea. United States Geological Survey, Technical Report No. 14157.
Oliver, J.S., Slattery, P.N., OConnor, E.F., and Lowry, L.F. 1983. Walrus, Odeobenus rosmarus, feeding in the Bering Sea – a benthic perspective. Fish. Bull. 81: 501-512.
Quakenbush, L., Suydam, R.S., Bryan, A.L., Lowry, L.L., Frost, K.J., and Mahoney, B.A. 2015. Diet of beluga whales, Dephinapterus leucas, in Alaska from stomach contents, March-November. Marine Fisheries Review doi.org/10.7755/MFR.77.1.7
Vacquie-Garcia, J., Lydersen, C., Ims, R.A. and Kovacs, K.M. 2018. Habitats and movement patterns of white whales Delphinapterus leucas in Svalbard, Norway in a changing climate. Mov. Ecol. 6: 21, doi.org/10.1186/s40462-018-0139-z.
Pelagic amphipods [AI20]
Phenomenon: Decreasing biomass of Arctic pelagic amphipod species [AP20]
Ecosystem characteristic: Functionally important species and biophysical structures
Amphipods of the genus Themisto are the dominant pelagic amphipod species in the Barents Sea. Themisto libellula is regarded as an Arctic species and T. abyssorum, and particularly, T. compressa as Sub-Arctic (Dalpadado et al., 2001; Kraft et al., 2012; Havermans et al., 2019). Under the reference condition, Arctic amphipods are important prey for fish, seabirds, and marine mammals in the Arctic part of the Barents Sea and considered important for sustaining the lipid-dependent Arctic predator community, including polar cod (Dalpadado et al., 2001, 2016; Descamps et al., 2017; Hop and Wiencke, 2019; ICES, 2020). Under the reference condition they are also important predators of Calanus species (Auel et al., 2002; Kraft et al., 2013). Other Arctic amphipods are ice-associated species, such as Apherusa glacialis, Gammarus wilkitzkii and Onisimus spp. These amphipods have typically been considered permanent residents of sea ice (sympagic), with their entire life cycle to occur within the sea-ice habitat (Gulliksen and Lønne, 1991; Lønne and Gulliksen, 1991; Macnaughton et al., 2007), although recent observations indicate that Apherusa glacialis is more pelagic than previously assumed (Kunisch et al., 2020). In the Barents Sea, they can be found in ice-covered waters, both associated with sea ice and the open water close to the ice edge. They are considered key species in the ice-associated food web (Poltermann, 1998), especially as prey item for juvenile polar cod (Lønne and Gulliksen, 1989) and seabirds feeding in the marginal ice zone (Lønne and Gabrielsen, 1992). Thus, under the reference condition, ice-associated species may also contribute to the pelagic amphipod community.
The most important anthropogenic driver of change in the indicator is climate change. Time series analyses (1980-2015) on pelagic Arctic amphipods (T. libellula) covering both the Norwegian and Russian parts of the Barents Sea show that increasing temperatures and subsequent reduced ice cover had a corresponding direct effect with likely decrease in their biomass (Stige et al., 2019). Another study from the west and north of Svalbard (Kongsfjorden, Isfjorden and Rijpfjorden) also indicate that if the warming trend persists, these conditions will favor the smaller Atlantic/boreal amphipods (T. abyssorum) over the larger Arctic species T. libellula (Dalpadado, 2006). The decline in Arctic species could be due to loss of habitat (less Arctic water masses) during warming periods (Dalpadado et al., 2020; ICES, 2020). In addition, the loss of sea ice, particularly multiyear ice, has had negative consequences on abundance of sympagic organisms like ice amphipods e.g., Gammarus wilkitzkii and Onisimus species, impacting the biodiversity of the Arctic region (Hop et al., 2021). Given the extensive knowledge on the influence of climate change on pelagic amphipods in the Arctic part of the Barents Sea, the understanding of the link between driver and indicator is rated as certain.
Given the importance of pelagic amphipods in the diet of many species (Dalpadado et al., 2001, 2016; Descamps et al., 2017; Hop and Wiencke, 2019; ICES, 2020), a decline in the biomass of the group is expected to have significant effects on Arctic predator communities. The understanding of the importance of changes in the indicator for other parts of the ecosystem is thus rated as good.
Examples of changes that would be of ecosystem significance include declines in pelagic biomass that would affect polar cod recruitment, growth and survival and reproduction of seabirds.
An important knowledge gap is that systematic monitoring of species composition is lacking.
References
Auel, H., Harjes, M., da Rocha, R., Stubing, D., and Hagen, W. 2002. Lipid biomarkers indicate different ecological niches and trophic relationships of the Arctic hyperiid amphipods Themisto abyssorum and T. libellula. Polar Biology, 25: 374-383.
Dalpadado, P. 2006. Distribution and reproduction strategies of krill (Euphausiacea) on the Norwegian shelf. Polar Biology, 29: 849-859.
Dalpadado, P., Arrigo, K. R., van Dijken, G. L., Skjoldal, H. R., Bagøien, E., Dolgov, A., Prokopchuk, I., et al. 2020. Climate effects on temporal and spatial dynamics of phytoplankton and zooplankton in the Barents Sea. Progress in Oceanography, 185: 102320.
Dalpadado, P., Borkner, N., Bogstad, B., and Mehl, S. 2001. Distribution of Themisto (Amphipoda) spp in the Barents Sea and predator-prey interactions. ICES Journal of Marine Science, 58: 876-895.
Dalpadado, P., Hop, H., Rønning, J., Pavlov, V., Sperfeld, E., Buchholz, F., Rey, A., et al. 2016. Distribution and abundance of euphausiids and pelagic amphipods in Kongsfjorden, Isfjorden and Rijpfjorden (Svalbard) and changes in their relative importance as key prey in a warming marine ecosystem. Polar Biology, 39: 1765-1784.
Descamps, S., Aars, J., Fuglei, E., Kovacs, K. M., Lydersen, C., Pavlova, O., Pedersen, A. O., et al. 2017. Climate change impacts on wildlife in a High Arctic archipelago - Svalbard, Norway. Global Change Biology, 23: 490-502.
Gulliksen, B., and Lønne, O. J. 1991. Sea ice macrofauna in the Antarctic and Arctic. Journal of Marine Systems, 2: 53-61.
Havermans, C., Auel, H., Hagen, W., Held, C., Ensor, N. S., and A. Tarling, G. 2019. Chapter Two - Predatory zooplankton on the move: Themisto amphipods in high-latitude marine pelagic food webs. In Advances in Marine Biology, pp. 51-92. Ed. by C. Sheppard. Academic Press.
Hop, H., Vihtakari, M., Bluhm, B. A., Daase, M., Gradinger, R., and Melnikov, I. A. 2021. Ice-Associated amphipods in a pan-Arctic scenario of declining sea ice. Frontiers in Marine Science, 8: 743152.
Hop, H., and Wiencke, C. 2019. The Ecosystem of Kongsfjorden, Svalbard. In Advances in Polar Ecology. Springer, Cham, Zwitzerland.
ICES. 2020. Working Group on the Integrated Assessments of the Barents Sea (WGIBAR). ICES Scientific Reports. 2:30. 206 pp.
Kraft, A., Bauerfeind, E., Nöthig, E.-M., and Bathmann, U. V. 2012. Size structure and life cycle patterns of dominant pelagic amphipods collected as swimmers in sediment traps in the eastern Fram Strait. Journal of Marine Systems, 95: 1-15.
Kraft, A., Berge, J., Varpe, Ø., and Falk-Petersen, S. 2013. Feeding in Arctic darkness: mid-winter diet of the pelagic amphipods Themisto abyssorum and T. libellula. Marine Biology, 160: 241-248.
Kunisch, E. H., Bluhm, B. A., Daase, M., Gradinger, R., Hop, H., Melnikov, I. A., Varpe, Ø., et al. 2020. Pelagic occurrences of the ice amphipod Apherusa glacialis throughout the Arctic. Journal of Plankton Research, 42: 73-86.
Lønne, O. J., and Gabrielsen, G. W. 1992. Summer diet of seabirds feeding in sea-ice-covered waters near Svalbard. Polar Biology 12: 685-692.
Lønne, O. J., and Gulliksen, B. 1989. Size, age and diet of polar cod, Boreogadus saida (Lepechin 1773) in ice covered waters. Polar Biology, 9: 187-191.
Lønne, O. J., and Gulliksen, B. 1991. Sympagic macro-fauna from multiyear sea-ice near Svalbard. Polar Biology, 11: 471-477.
Macnaughton, M. O., Thormar, J., and Berge, J. 2007. Sympagic amphipods in the Arctic pack ice: redescriptions of Eusirus holmii Hansen, 1887 and Pleusymtes karstensi (Barnard, 1959). Polar Biology, 30: 1013-1025.
Poltermann, M. 1998. Abundance, biomass and small-scale distribution of cryopelagic amphipods in the Franz Josef Land area (Arctic). Polar Biology, 20: 134-138.
Stige, L. C., Eriksen, E., Dalpadado, P., and Ono, K. 2019. Direct and indirect effects of sea ice cover on major zooplankton groups and planktivorous fishes in the Barents Sea. ICES Journal of Marine Science, 76: I24-I36.
Krill [AI21]
Phenomenon: Increasing biomass of krill [AP21]
Ecosystem characteristic: Functionally important species and biophysical structures
Under the reference condition, krill is not an important component of the zooplankton community of the Arctic part of the Barents Sea, as the main krill species in the Barents Sea, Thysanoessa inermis T. raschii, T. longicaudata and Meganyctiphanes norvegica, are all either Atlantic or Sub-Arctic (Dalpadado and Skjoldal, 1991). Nematoscelis megalops is another species observed in the Barents Sea, although this species is mainly associated with warmer water masses.
The most important anthropogenic driver of change in the indicator is climate change. Time series analyses (1980-2015) of boreal krill covering both the Norwegian and Russian parts of the Barents Sea have shown that warming and reduced ice cover have had a direct positive effect on krill biomass (Stige et al., 2019). Other studies have shown that the Atlantic M. norvegica, which was almost absent during cooler periods in the 1970-1990s, has reentered the Barents Sea during the warmer last two decades (Zhukova et al., 2009; Eriksen et al., 2017; ICES, 2019). After nearly a 30-year long absence, the sub-tropical Nematoscelis megalops was again observed in the Barents Sea in the early 2000s (Zhukova et al., 2009). The robust evidence for the effects of climate change implies that the understanding of the link between driver and indicator is rated as certain.
Krill is an important part of the diet of many ecological and commercially important fish species in the Barents Sea (Eriksen et al., 2020; ICES, 2020) and for other groups such as seabirds and seals (Planque et al., 2014). Krill has been shown to be important for growth of capelin and krill stock size may be controlled by predator stock size, especially capelin (Dalpadado and Skjoldal, 1996; Gjøsæter et al., 2002). Krill lipids are important for adult capelin growth (Orlova et al., 2010). Different krill species are likely to function differently as prey. For example, the largest species, M. norvegica, is twice the size of the Thysanoessa species, implying that a single individual of the former will contribute significantly more biomass and lipids than individuals of the smaller species. Given the substantial knowledge about predator-prey dynamics and the importance of krill as prey, the understanding of the importance of changes in the indicator for other parts of the ecosystem is rated as good.
An increase in krill biomass in the Arctic part of the Barents Sea will provide higher availability of food for predators that are not abundant or dominant in the area under the reference condition, such as cod. This can change the predation pressure on Arctic species and alter their abundance, and even the structure of entire food webs (Kortsch et al., 2015).
An important knowledge gap is the lack of quantitative systematic monitoring of species composition.
References
Dalpadado, P., and Skjoldal, H. R. 1991. Distribution and life-history of krill from the Barents Sea. Polar Research, 10: 443-460.
Dalpadado, P., and Skjoldal, H. R. 1996. Abundance, maturity and growth of the krill species Thysanoessa inermis and T. longicaudata in the Barents Sea. Marine Ecology Progress Series, 144: 175-183.
Eriksen, E., Benzik, A. N., Dolgov, A. V., Skjoldal, H. R., Vihtakari, M., Johannesen, E., Prokhorova, T. A., et al. 2020. Diet and trophic structure of fishes in the Barents Sea: The Norwegian-Russian program “Year of stomachs” 2015 – Establishing a baseline. Progress in Oceanography, 183: 102262.
Eriksen, E., Skjoldal, H. R., Gjøsæter, H., and Primicerio, R. 2017. Spatial and temporal changes in the Barents Sea pelagic compartment during the recent warming. Progress in Oceanography, 151: 206-226.
Gjøsæter, H., Dalpadado, P., and Hassel, A. 2002. Growth of Barents Sea capelin (Mallotus villosus) in relation to zooplankton abundance. ICES Journal of Marine Science, 59: 959-967.
ICES. 2019. The Working Group on the Integrated Assessments of the Barents Sea (WGIBAR). ICES Scientific Reports. 1:42. 157 pp.
ICES. 2020. Working Group on the Integrated Assessments of the Barents Sea (WGIBAR). ICES Scientific Reports. 2:30. 206 pp.
Kortsch, S., Primicerio, R., Fossheim, M., Dolgov, A. V., and Aschan, M. 2015. Climate change alters the structure of arctic marine food webs due to poleward shifts of boreal generalists. Proceedings of the Royal Society B-Biological Sciences, 282: 31-39.
Orlova, E. L., Rudneva, G. B., Renaud, P. E., Eiane, K., Savinov, V. M., and Yurko, A. S. 2010. Climate impacts on feeding and condition of capelin Mallotus villosus in the Barents Sea: evidence and mechanisms from a 30 year data set. Aquatic Biology, 10: 105-118.
Planque, B., Primicerio, R., Michalsen, K., Aschan, M., Certain, G., Dalpadado, P., Gjøsæter, H., et al. 2014. Who eats whom in the Barents Sea: a food web topology from plankton to whales. Ecology, 95: 1430-1430.
Stige, L. C., Eriksen, E., Dalpadado, P., and Ono, K. 2019. Direct and indirect effects of sea ice cover on major zooplankton groups and planktivorous fishes in the Barents Sea. ICES Journal of Marine Science, 76: I24-I36.
Zhukova, N. G., Nesterova, V. N., Prokopchuk, I. P., and Rudneva, G. B. 2009. Winter distribution of euphausiids (Euphausiacea) in the Barents Sea (2000–2005). Deep Sea Research II, 56: 1959-1967
Polar cod [AI22]
Phenomenon: Decreasing biomass of the polar cod stock [AP22]
Ecosystem characteristic: Functionally important species and biophysical structures
Under the reference condition, the polar cod population is large enough to support endemic Arctic predators (fish, seabirds and mammals) dependent on polar cod as prey.
The most important anthropogenic driver of change in this indicator is climate change (Mueter et al., 2016; Huserbråten et al., 2019; Gjøsæter et al., 2020). In particular, the early life stages of polar cod seem vulnerable to increased temperature and reduced ice cover; spawning of eggs happens under the ice and the eggs and larvae have high survival rates in sub-zero temperatures under the ice and larvae feed on zooplankton specific to the seasonal ice-melt-water blooms (Huserbråten et al., 2019). With the warming Barents Sea, the main spawning area of polar cod in the Pechora Sea south of Novaya Zemlya is believed to become less favorable (Huserbråten et al., 2019), with the expectancy of a decreasing population trend in the Barents Sea. Climate change may also increase predation pressure and competition in polar cod, due to the expanding feeding area of predators, in particular NEA cod, and increased competition with other secondary consumers, in particular capelin following a borealization of the Barents Sea (Mueter et al., 2016). Fisheries are not considered an important anthropogenic pressure, as polar cod has never been heavily harvested, and there has been no polar cod fishery at all in recent times (Gjøsæter et al., 2020). There is a good theoretical understanding of mechanisms and empirical evidence to support that the reduced ice coverage as a result of warming of the Barents Sea is likely to result in sub-optimal conditions for early life stages of polar cod and consequently a reduced population of polar cod in the Barents Sea. The link between climate change and the indicator is thus assessed as certain.
Polar cod is by far the most abundant secondary consumer in the Arctic Barents Sea, and therefore important for efficiently making energy from macroplankton available to predators at higher trophic levels (Hop and Gjøsæter, 2013; Mueter et al., 2016). In particular, polar cod is essential food for ice-associated mammals including ringed seals, narwhal and white whale as well as fish-eating Arctic seabirds such as Brünnich’s guillemot, black guillemot and Northern fulmar (Hop and Gjøsæter, 2013). In addition, polar cod is important food for many Arctic fishes including Arctic skate (Amblyraja hyperborea), NEA cod (Gadus morhua), Greenland halibut (Reinhardtius hippoglossoides), and striped seasnail (Liparis bathyarcticus) (Eriksen et al., 2020). The importance of polar cod as essential secondary consumer in the Arctic part of the Barents Sea food web is well established. The understanding of the importance of changes in the biomass of polar cod for other parts of the ecosystem is thus assessed as good.
Decreasing trends in the indicator is a sign of borealization of the Barents Sea and less favorable habitat for species adapted to Arctic conditions. Decreasing polar cod population can be considered of ecosystem significance if, for example, i) small population size of polar cod over time has negative impact on endemic Arctic predators such as narwhals, ringed seals or Brünnich’s guillemot.
Knowledge gaps:
It is still poorly known how a change in the predator distribution will affect the population of polar cod. An expected change is increased predation pressure due to expanded distribution of main predators, but evidence to support this is still lacking (Mueter et al., 2016).
References
Eriksen, E., Benzik, A. N., Dolgov, A. V., Skjoldal, H. R., Vihtakari, M., Johannesen, E., Prokhorova, T. A., et al. 2020. Diet and trophic structure of fishes in the Barents Sea: The Norwegian-Russian program "Year of stomachs" 2015-Establishing a baseline. Progress in Oceanography, 183: 102262.
Gjøsæter, H., Huserbråten, M., Vikebø, F., and Eriksen, E. 2020. Key processes regulating the early life history of Barents Sea polar cod. Polar Biology, 43: 1015-1027.
Hop, H., and Gjøsæter, H. 2013. Polar cod (Boreogadus saida) and capelin (Mallotus villosus) as key species in marine food webs of the Arctic and the Barents Sea. Marine Biology Research, 9: 878-894.
Huserbråten, M. B. O., Eriksen, E., Gjøsæter, H., and Vikebø, F. 2019. Polar cod in jeopardy under the retreating Arctic sea ice. Communications Biology, 2: article number: 407.
Mueter, F. J., Nahrgang, J., Nelson, R. J., and Berge, J. 2016. The ecology of gadid fishes in the circumpolar Arctic with a special emphasis on the polar cod (Boreogadus saida). Polar Biology, 39: 961-967.
Capelin [AI23]
Phenomenon: Decreasing biomass of the capelin stock [AP23]
Ecosystem characteristic: Functionally important species and biophysical structures
Under the reference condition, long-term population size of capelin is high enough to support viable populations of predators dependent on capelin (e.g., NEA cod, humpback whales, harp seals, black-legged kittiwake, and Brünnich’s guillemot). However, based on the life history of capelin being short-lived and semelparous, it is likely that the capelin population size undergoes large fluctuations also under the reference condition (Gjøsæter, 1998). The capelin population in the Barents Sea has been heavily exploited since the mid-60s, while regular monitoring started in 1972. In addition, the population is heavily affected by Atlantic cod, Norwegian spring spawning (NSS) herring and marine mammals, which have been exploited by humans long before that.
The most important anthropogenic driver of change in this indicator today is climate change. Climate change may significantly alter distribution of capelin (Rose, 2005), affect recruitment, and also the strength of the impact of key predators on capelin. Direct effect of warming that can be expected include a northward expansion during feeding, which has already been observed (Carscadden et al., 2013), and possibly the use of spawning grounds further north as temperatures increase (Rose, 2005). Climate change is expected to lead to increased productivity in the pelagic zone in Arctic seas (see phenomenon for indicator AI01), and changes in the zooplankton community composition (see phenomena for indicators AI03, AI20 and AI21) which can have both positive and negative effects on the capelin population (Dalpadado and Mowbray, 2013; Renaud et al., 2018; Duffy-Anderson et al., 2019). The capelin biomass is also strongly and directly affected by other ecosystem components such as Norwegian spring spawning herring, negatively affecting recruitment by feeding on capelin larvae (Gjøsæter and Bogstad, 1998; Huse and Toresen, 2000), and the Northeast stock of Atlantic cod, feeding on adult capelin (Johannesen et al., 2012; Fall et al., 2018; Holt et al., 2019). Climate change is expected to lead to a northward expansion of spawning of NSS herring, which possibly will increase the overlap with capelin larvae thereby reducing recruitment success (Gjøsæter and Bogstad, 1998). Similarly, the climate-change related increased distribution of cod may enhance predation pressure on capelin (Fall et al., 2018). These indirect effects of climate change on capelin may be more important drivers of capelin biomass than direct effects, and the net consequences of a warmer ocean for capelin are uncertain. The link between climate change and the indicator is therefore assessed as less certain.
Fisheries have been an important anthropogenic driver of change in the past for capelin with particularly high harvest level in the 1970s and 1980s (Gjøsæter, 1998). A precautionary management regime is currently in place for capelin where the fishery is only allowed to target a surplus of mature capelin after a proportion is allowed to spawn and after predator consumption (Gjøsæter et al., 2015). With this management regime, the fishery is not expected to be a strong driver of change in capelin biomass. The link between fisheries and changes in the indicator is assessed as certain.
Capelin plays a key role in the Arctic part of the Barents Sea as the most important mid-trophic level species efficiently making energy from plankton available to top-predators (Dolgov, 2002; Orlova et al., 2009). In particular Northeast Atlantic cod is dependent on capelin for sustaining its high abundance. Capelin is also a key diet items for whales, several seabird species, harp seals and other fish species (Dolgov, 2002). There is also evidence that capelin can inflict top-down effects on its zooplankton prey (Hassel et al., 1991; Dalpadado and Skjoldal, 1996). The capelin population in the Barents Sea has undergone strong fluctuations including collapse periods during the period of monitoring from 1973 to present (Gjøsæter et al., 2009). The two collapse periods in the mid-80s and 90s were particularly severe, and in particular the first of these likely lead to a range of cascade effects in the Barents Sea ecosystem, including recruitment failures in seabirds and harp seals and cannibalism and hampered growth in cod (Gjøsæter et al., 2009). The later collapses did not have equally severe impacts on the ecosystem (Johannesen et al., 2012). The reason for this is likely the higher abundance of alternative prey in these periods (Gjøsæter et al., 2009). The understanding of the role of changes in the biomass of capelin for other parts of the ecosystem is assessed as good.
Decreasing capelin stock biomass can be considered to be of ecosystem significance if, for example, i) lack of food affects breeding success in seabirds, distribution of marine mammals or growth and cannibalism in cod (Gjøsæter et al., 2009).
Knowledge gaps:
Capelin has large natural variation in recruitment, which is important for the stock development. It is known that predation by young herring may strongly influence the capelin recruitment, but not much is known about how change in the population of other predators such as whales may influence recruitment. There is also a lack of knowledge about potential change in predation pressure and survival at other life stages.
References
Carscadden, J. E., Gjøsæter, H., and Vilhjálmsson, H. 2013. A comparison of recent changes in distribution of capelin (Mallotus villosus) in the Barents Sea, around Iceland and in the Northwest Atlantic. Progress in Oceanography, 114: 64-83.
Dalpadado, P., and Mowbray, F. 2013. Comparative analysis of feeding ecology of capelin from two shelf ecosystems, off Newfoundland and in the Barents Sea. Progress in Oceanography, 114: 97-105.
Dalpadado, P., and Skjoldal, H. R. 1996. Abundance, maturity and growth of the krill species Thysanoessa inermis and T-longicaudata in the Barents Sea. Marine Ecology Progress Series, 144: 175-183.
Dolgov, A. V. 2002. The role of capelin (Mallotus villosus) in the foodweb of the Barents Sea. ICES Journal of Marine Science, 59: 1034-1045.
Duffy-Anderson, J. T., Stabeno, P., Andrews, A. G., Cieciel, K., Deary, A., Farley, E., Fugate, C., et al. 2019. Responses of the northern Bering Sea and southeastern Bering Sea pelagic ecosystems following record-breaking low winter sea ice. Geophysical Research Letters, 46: 9833-9842.
Fall, J., Ciannelli, L., Skaret, G., and Johannesen, E. 2018. Seasonal dynamics of spatial distributions and overlap between Northeast Arctic cod (Gadus morhua) and capelin (Mallotus villosus) in the Barents Sea. Plos One, 13: e0205921.
Gjøsæter, H. 1998. The population biology and exploitation of capelin (Mallotus villosus) in the Barents Sea. Sarsia, 83: 453-496.
Gjøsæter, H., and Bogstad, B. 1998. Effects of the presence of herring (Clupea harengus) on the stock-recruitment relationship of Barents Sea capelin (Mallotus villosus). Fisheries Research, 38: 57-71.
Gjøsæter, H., Bogstad, B., and Tjelmeland, S. 2009. Ecosystem effects of the three capelin stock collapses in the Barents Sea. Marine Biology Research, 5: 40-53.
Gjøsæter, H., Bogstad, B., Tjelmeland, S., and Subbey, S. 2015. A retrospective evaluation of the Barents Sea capelin management advice. Marine Biology Research, 11: 135-143.
Hassel, A., Skjoldal, H. R., Gjøsæter, H., Loeng, H., and Omli, L. 1991. Impact of grazing from capelin (Mallotus villosus) on zooplankton: a case study in the northern Barents Sea in August 1985. Polar Research, 10: 371-388.
Holt, R. E., Bogstad, B., Durant, J. M., Dolgov, A. V., and Ottersen, G. 2019. Barents Sea cod (Gadus morhua) diet composition: long-term interannual, seasonal, and ontogenetic patterns. ICES Journal of Marine Science, 76: 1641-1652.
Huse, G., and Toresen, R. 2000. Juvenile herring prey on Barents Sea capelin larvae. Sarsia, 85: 385-391.
Johannesen, E., Lindström, U., Michalsen, K., Skern-Mauritzen, M., Fauchald, P., Bogstad, B., and Dolgov, A. 2012. Feeding in a heterogeneous environment: spatial dynamics in summer foraging Barents Sea cod. Marine Ecology Progress Series, 458: 181-197.
Orlova, E. L., Dolgov, A. V., Rudneva, G. B., Oganin, I. A., and Konstantinova, L. L. 2009. Trophic relations of capelin Mallotus villosus and polar cod Boreogadus saida in the Barents Sea as a factor of impact on the ecosystem. Deep-Sea Research Part Ii-Topical Studies in Oceanography, 56: 2054-2067.
Renaud, P. E., Daase, M., Banas, N. S., Gabrielsen, T. M., Soreide, J. E., Varpe, O., Cottier, F., et al. 2018. Pelagic food-webs in a changing Arctic: a trait-based perspective suggests a mode of resilience. ICES Journal of Marine Science, 75: 1871-1881.
Rose, G. A. 2005. Capelin (Mallotus villosus) distribution and climate: a sea "canary" for marine ecosystem change. ICES Journal of Marine Science, 62: 1524-1530.
Cod [AI24]
Phenomenon: Change in cod total stock size [AP24]
Ecosystem characteristic: Functionally important species and biophysical structures
Under the reference condition, long-term population size of Northeast Atlantic cod is high enough to help supporting top predators on adult fish such as minke whales and harp seals, and also to produce large quantities of larvae and 0-group cod, which are important as food for other organisms in the ecosystem (Eriksen et al., 2011). It is difficult to know how the state of the Northeast Atlantic cod stock was under reference conditions, as it has been exploited by humans for many centuries. However, the impact of the relatively limited fisheries before ca 1900 on this stock was probably moderate.
The most important anthropogenic drivers of change in this indicator are fisheries and climate change (Kjesbu et al., 2014). The Northeast Atlantic cod stock has been exploited by humans for many centuries and was considered to be overharvested from the 1950s and onwards (except for a few years in the early 1990s). However, since 2007 the fisheries have been regulated by a more precautionary management regime, and the NE Atlantic cod stock has recovered to a high level. The pressure from fisheries on the NE Atlantic cod stock is currently regulated through fishing quotas set in cooperation with Russia.
Climate change with higher oceanic temperatures will increase the available feeding area for cod in the Barents Sea. This is suggested as one of the reasons for the increasing density of cod in the northern Barents Sea reported for the period up to the early 2010s (Johansen et al., 2013; Kjesbu et al., 2014; Fossheim et al., 2015). In addition, cod recruitment is positively related to temperature (e.g. Bogstad et al., 2013). The maximal distribution area was observed in 2013, and expansion possibilities outside the area occupied that year are fairly limited as cod is not likely to migrate further northwards as deep waters outside the shelf are not suitable for cod. However, some further expansion to the northeast into the northern Kara Sea is possible if the warming continues. The links between these drivers and cod stock size are assessed as certain.
Cod is a central species in the Barents Sea ecosystem, with many interactions to other organisms in the ecosystem (Kortsch et al., 2015). Cod is an important predator on many fish and shellfish species such as capelin, herring, haddock, shrimp, snow crab, polar cod etc. (see e.g. Dolgov et al., 2011; Holt et al., 2019) and thus changes in the abundance of cod affect the status of these prey species. It is also a competitor with marine mammals as top predators in the ecosystem (Bogstad et al., 2015). Cod is also important as food for other predators, both as larvae and 0-group cod and adults (e.g. Bogstad et al., 2000; Eriksen et al., 2011). It should also be noted that Barents Sea cod is cannibalistic (Yaragina et al., 2009) and thus to some extent regulates itself. Cod is the dominant piscivorous fish species in the Barents Sea, and there is no other fish species which can fill that role if cod abundance becomes very low.
The understanding of the importance of changes in this indicator for other parts of the ecosystem is assessed as good. However, effects of changes in the cod abundance on their prey are more studied than effects on their predators. Weak density-dependence in growth of older (mature) cod was observed in the 2010s when cod abundance was high (ICES, 2020).
Changes in the cod stock biomass can be considered of ecosystem significance if, for example, i) Increasing predation from a larger cod population causes declines in typically Arctic species, e.g., polar cod. This can also have cascading effects on mammals dependent on these Arctic species, such as reduced condition in minke whales and harp seals (Bogstad et al., 2015). ii) Declining cod population has a negative effect on predators on cod eggs and larvae.
Knowledge gaps:
Effects on predators of changes in cod abundance are an important knowledge gap. Also, cod abundance has fortunately never been so low that we have any clues about how a ‘cod-less’ ecosystem in the Barents Sea would function.
References
Bogstad, B., Dingsør, G. E., Ingvaldsen, R. B., and Gjøsæter, H. 2013. Changes in the relationship between sea temperature and recruitment of cod, haddock and herring in the Barents Sea. Marine Biology Research, 9: 895-907.
Bogstad, B., Gjøsæter, H., Haug, T., and Lindström, U. 2015. A review of the battle for food in the Barents Sea: cod vs. marine mammals. Frontiers in Ecology and Evolution, 3.
Bogstad, B., Haug, T., and Mehl, S. 2000. Who eats whom in the Barents Sea? NAMMCO Sci. Publ., 2: 98-119.
Dolgov, A. V., Orlova, E. L., Johannesen, E., and Bogstad, B. 2011. Piscivorous fish. Chapter 8.4. In The Barents Sea. Ecosystem, resources, management. Half a century of Russian-Norwegian cooperation., pp. 466-484. Ed. by T. Jakobsen, and V. K. Ozhigin. Tapir Academic Press.
Eriksen, E., Bogstad, B., and Nakken, O. 2011. Ecological significance of 0-group fish in the Barents Sea ecosystem. Polar Biology, 34: 647-657.
Fossheim, M., Primicerio, R., Johannesen, E., Ingvaldsen, R. B., Aschan, M. M., and Dolgov, A. V. 2015. Recent warming leads to a rapid borealization of fish communities in the Arctic. Nature Climate Change, 5: 673-677.
Holt, R. E., Bogstad, B., Durant, J. M., Dolgov, A. V., and Ottersen, G. 2019. Barents Sea cod (Gadus morhua) diet composition: long-term interannual, seasonal, and ontogenetic patterns. ICES Journal of Marine Science, 76: 1641-1652.
ICES. 2020. Arctic Fisheries Working Group (AFWG). 2:52. 577 pp.
Johansen, G. O., Johannesen, E., Michalsen, K., Aglen, A., and Fotland, Å. 2013. Seasonal variation in geographic distribution of North East Arctic (NEA) cod - survey coverage in a warmer Barents Sea. Marine Biology Research, 9: 908-919.
Kjesbu, O. S., Bogstad, B., Devine, J. A., Gjøsæter, H., Howell, D., Ingvaldsen, R. B., Nash, R. D. M., et al. 2014. Synergies between climate and management for Atlantic cod fisheries at high latitudes. Proceedings of the National Academy of Sciences of the United States of America, 111: 3478-3483.
Kortsch, S., Primicerio, R., Fossheim, M., Dolgov, A. V., and Aschan, M. 2015. Climate change alters the structure of arctic marine food webs due to poleward shifts of boreal generalists. Proceedings of the Royal Society B-Biological Sciences, 282: 31-39.
Yaragina, N. A., Bogstad, B., and Kovalev, Y. A. 2009. Variability in cannibalism in Northeast Arctic cod (Gadus morhua) during the period 1947-2006. Marine Biology Research, 5: 75-85.
Cod size structure [AI25]
Phenomenon: Decreasing biomass of large cod [AP25]
Ecosystem characteristic: Functionally important species and biophysical structures
Under the reference condition, large cod is present in the population to such extent that they represent an important predator in the ecosystem. In addition, the presence of cannibalistic large cod contributes to self-regulation of the cod population. It is likely that the proportion of old, large fish in the stock would be even larger under reference conditions than in the periods with low fishing pressure from which we have data (1940s, 2010s, see Kjesbu et al., 2014). From West Greenland there are observations of age distributions in a previously unfished cod stock (Hansen, 1949), but whether these observations are relevant for a situation where the Barents Sea cod stock is unfished, we do not know.
The most important anthropogenic driver of change in this indicator is fisheries, which typically target the largest cod individuals. The minimum size in the fisheries is 44 cm, but fishing mortality increases with size/age, both because of gear selectivity and because a considerable part of the catch is taken during the spawning season. Heavy exploitation over many generations may also have affected the genetic composition of the stock, as maturation now occurs at lower age and size than before (see Rørvik et al., 2021 for the most recent discussion and literature review on this). In the Barents Sea, cod have been heavily exploited, but following the strong reduction in fishing mortality around 2007 the age structure in the stock has now been rebuilt and resembles the situation in the late 1940s following a period of low fishing mortality during WWII. The link between fisheries and the indicator is assessed as certain.
Large and old cod are important predators on smaller fish, including being cannibalistic (Holt et al., 2019). There are no other abundant fish stocks with large fish (> 70 cm) in the Barents Sea, so that niche in the ecosystem cannot be filled by other species. Also, the age/size structure in the spawning stock is important for the recruitment to the stock (see references in Kjesbu et al., 2014). The understanding of the importance of changes in the indicator for other parts of the ecosystem is assessed as less good.
Decreasing or stable low biomass of large cod can be considered of ecosystem significance if, for example i) the genetic composition of cod is changed due to selective removal of large individuals, ii) it leads to bad recruitment and reduced population size.
Knowledge gaps:
Effects on genetic composition.
References
Hansen, P. M. 1949. Studies of the biology of cod in Greenland waters. ICES Rapports et Procésverbaux des Réunions, 123: 1-77.
Holt, R. E., Bogstad, B., Durant, J. M., Dolgov, A. V., and Ottersen, G. 2019. Barents Sea cod (Gadus morhua) diet composition: long-term interannual, seasonal, and ontogenetic patterns. ICES Journal of Marine Science, 76: 1641-1652.
Kjesbu, O. S., Bogstad, B., Devine, J. A., Gjøsæter, H., Howell, D., Ingvaldsen, R. B., Nash, R. D. M., et al. 2014. Synergies between climate and management for Atlantic cod fisheries at high latitudes. Proceedings of the National Academy of Sciences of the United States of America, 111: 3478-3483.
Rørvik, C. J., Bogstad, B., Ottersen, G., and Kjesbu, O. S. 2021. Long-term interplay between harvest regimes and biophysical conditions may lead to persistent changes in age-at-sexual maturity of Northeast Arctic cod (Gadus morhua). Canadian Journal of Fisheries and Aquatic Sciences: accepted.
Cod distribution [AI26]
Phenomenon: Increasing biomass of cod in the Arctic Barents Sea [AP26]
Ecosystem characteristic: Functionally important species and biophysical structures
Under the reference condition, Northeast Atlantic cod is present in the Arctic part of the Barents Sea, but the “center of distribution” is further south. The northern distribution limit is typically determined by water temperature and population size. We know that cod have been distributed in the Arctic in previous periods, e.g., in the 1930s, but a reference condition is hard to determine, and historic records are sparse.
The most important anthropogenic driver of change in this indicator is climate change, but stock size also has an impact. Cod abundance is low in waters colder than 0° C (Yaragina et al., 2011), so the location of this isotherm for bottom temperatures is a good indication of the distribution range. Cod distribution in the Barents Sea is also density dependent, and more cod are found in northern areas when stock sizes are large (Johansen et al., 2013; Kjesbu et al., 2014; Fossheim et al., 2015; Johannesen et al., 2020). Although temperature has a positive effect on recruitment of cod, stock size is affected by a multitude of natural and anthropogenic factors. The link between climate change and the indicator is assessed as certain (but we need to separate natural fluctuations from anthropogenic influence in this context).
There are few other piscivorous fish species in the Arctic part of the Barents Sea, so the occurrence of cod in the Arctic part of the Barents Sea may affect the fish community in this area significantly, as a part of the ‘borealization’ of the Barents Sea (Fossheim et al., 2015). The understanding of the importance of changes in the indicator for other parts of the ecosystem is rated as good.
Increasing trend NEA cod biomass in the Arctic Barents Sea can be considered of ecosystem significance if, for example i) typically Arctic fish species are affected negatively by NEA cod.
Knowledge gaps:
Sensitivity of various prey species to cod abundance is not well known.
References
Fossheim, M., Primicerio, R., Johannesen, E., Ingvaldsen, R. B., Aschan, M. M., and Dolgov, A. V. 2015. Recent warming leads to a rapid borealization of fish communities in the Arctic. Nature Climate Change, 5: 673-677.
Johannesen, E., Yoccoz, N. G., Tveraa, T., Shackell, N. L., Ellingsen, K. E., Dolgov, A. V., and Frank, K. T. 2020. Resource-driven colonization by cod in a high Arctic food web. Ecology and Evolution, 10: 14272-14281.
Johansen, G. O., Johannesen, E., Michalsen, K., Aglen, A., and Fotland, Å. 2013. Seasonal variation in geographic distribution of North East Arctic (NEA) cod - survey coverage in a warmer Barents Sea. Marine Biology Research, 9: 908-919.
Kjesbu, O. S., Bogstad, B., Devine, J. A., Gjøsæter, H., Howell, D., Ingvaldsen, R. B., Nash, R. D. M., et al. 2014. Synergies between climate and management for Atlantic cod fisheries at high latitudes. Proceedings of the National Academy of Sciences of the United States of America, 111: 3478-3483.
Yaragina, N. A., Aglen, A., and Sokolov, K. M. 2011. Cod. Chapter 5.4. In The Barents Sea. Ecosystem, resources, management. Half a century of Russian-Norwegian cooperation, pp. 225-270. Ed. by T. Jakobsen, and V. K. Ozhigin. Tapir Academic Press.
Bottom thermal niches [AI27]
Phenomenon: Decreasing area of bottom cold-water temperature niches [AP27]
Ecosystem characteristic: Landscape-ecological patterns
Under the reference condition, which for abiotic factors is predefined as the climate in the period 1961-1990, the Arctic part of the Barents Sea was characterised by an Arctic climate. That is, large areas with cold-water temperatures were dominating, and seasonal or whole-year ice cover were common. Regions dominated by Arctic climate provides permanent habitat for Arctic species and seasonal feeding habitat for migrating boreal species. Data on temperature exist from 1970 (Johannesen et al., 2012; Michalsen et al., 2013), implying that quantitative information for the indicator exists only for part of the reference condition.
The most important anthropogenic driver of change in this indicator is climate change (IPCC, 2019). Waters characterized by sub-zero temperatures, are common near bottom in the northern Barents Sea (Loeng, 1991; Lind and Ingvaldsen, 2012). This contrasts with the southern Barents Sea which is dominated by warmer waters (Loeng, 1991). Anthropogenic global warming leads to northward expansion of the warmer waters thereby reducing the area of the colder waters in the Barents Sea (Smedsrud et al., 2010; Smedsrud et al., 2013; Oziel et al., 2016). Given the massive evidence of anthropogenic influence on the climate in general (Masson-Delmotte et al., 2021) and for the Barents Sea locally described above, the understanding of the link between driver and change in the indicator is rated as certain.
The decreasing extent of cold-water temperature niches at bottom has profound impacts on the local and regional Arctic climate and ecosystems. Examples of changes which can be considered of ecosystem significance as a result of decline in waters with sub-zero temperatures include reductions in habitat for Arctic demersal fish and benthic species (Johannesen et al., 2012; Fossheim et al., 2015; Jørgensen et al., 2015; Johannesen et al., 2017; Jørgensen et al., 2019). The understanding of the importance of changes in the indicator for the rest of the ecosystem is thus rated as good.
The extent of cold-water temperature niches near bottom depends on sea-ice formation and inflow, cooling during winter and the inflow of Atlantic and Arctic Water. Improved understanding is needed to address the relative contribution from these sources on the formation and distribution of cold-water temperature niches.
References
Fossheim, M., Primicerio, R., Johannesen, E., Ingvaldsen, R. B., Aschan, M. M., and Dolgov, A. V. 2015. Recent warming leads to a rapid borealization of fish communities in the Arctic. Nature Clim. Change, 5: 673-677.
IPCC 2019. IPCC Special Report on the Ocean and Cryosphere in a Changing Climate. Ed. by H.-O. Pörtner, D. C. Roberts, V. Masson-Delmotte, P. Zhai, M. Tignor, E. Poloczanska, K. Mintenbeck, A. Alegría, M. Nicolai, A. Okem, J. Petzold, B. Rama, and N. M. Weyer. Cambridge University Press, Cambridge.
Johannesen, E., Ingvaldsen, R. B., Bogstad, B., Dalpadado, P., Eriksen, E., Gjøsæter, H., Knutsen, T., et al. 2012. Changes in Barents Sea ecosystem state, 1970–2009: climate fluctuations, human impact, and trophic interactions. ICES Journal of Marine Science, 69: 880-889.
Johannesen, E., Mørk, H. L., Korsbrekke, K., Wienerroither, R., Eriksen, E., Fossheim, M., de Lange Wenneck, T., et al. 2017. Arctic fishes in the Barents Sea 2004-2015: Changes in abundance and distribution.
Jørgensen, L. L.., Ljubin, P., Skjoldal, H. R., Ingvaldsen, R. B., Anisimova, N., and Manushin, I. 2015. Distribution of benthic megafauna in the Barents Sea: baseline for an ecosystem approach to management. ICES Journal of Marine Science, 72: 595-613.
Jørgensen, L. L.., Primicerio, R., Ingvaldsen, R. B., Fossheim, M., Strelkova, N., Thangstad, T. H., Manushin, I., et al. 2019. Impact of multiple stressors on sea bed fauna in a warming Arctic. Marine Ecology Progress Series, 608: 1-12.
Lind, S., and Ingvaldsen, R. 2012. Variability and impacts of Atlantic Water entering the Barents Sea from the north. Deep Sea Research, 62: 70-88.
Loeng, H. 1991. Features of the physical oceanographic conditions of the Barents Sea. Polar Research, 10: 5-18.
Masson-Delmotte, V., Zhai, P., Pirani, A., Connors, S. L., Péan, C., Berger, S., Caud, N., et al. 2021. Climate Change 2021: The Physical Science Basis. Contribution of Working Group I to the Sixth Assessment Report of the Intergovernmental Panel on Climate Change. Cambridge University Press, Cambridge.
Michalsen, K., Dalpadado, P., Eriksen, E., Gjøsæter, H., Ingvaldsen, R. B., Johannesen, E., Jørgensen, L. L.., et al. 2013. Marine living resources of the Barents Sea – Ecosystem understanding and monitoring in a climate change perspective. Marine Biology Research, 9: 932-947.
Oziel, L., Sirven, J., and Gascard, J. C. 2016. The Barents Sea frontal zones and water masses variability (1980–2011). Ocean Sci., 12: 169-184.
Smedsrud, L. H., Esau, I., Ingvaldsen, R. B., Eldevik, T., Haugan, P. M., Li, C., Lien, V. S., et al. 2013. The role of the Barents Sea in the Arctic climate system. Reviews of Geophysics, 51: 415-449.
Smedsrud, L. H., Ingvaldsen, R., Nilsen, J. E. Ø., and Skagseth, Ø. 2010. Heat in the Barents Sea: transport, storage, and surface fluxes. Ocean Sci., 6: 219-234.
Sea-ice area [AI28]
Phenomenon: Decreasing sea-ice area in winter and summer [AP28]
Ecosystem characteristic: Landscape-ecological patterns, Abiotic factors
Under the reference condition, which for abiotic factors is predefined as the climate in the period 1961-1990, the Arctic part of the Barents Sea is characterised by an Arctic climate. Arctic water masses are dominating (Loeng, 1991; Lind and Ingvaldsen, 2012), and seasonal or whole-year ice cover can generally be expected. The climate provides habitat for Arctic species. Data on sea-ice extent from satellite monitoring is available from 1979, thus covering only a small part of the 1961-1990 period.
The most important anthropogenic drivers of change in the indicator are related to climate change. Several forcings and processes lead to later ice formation, less ice extent and earlier seasonal melt in the Arctic (IPCC, 2019). Other drivers, which may be linked to climate change, can come in addition, such as advection of sea ice due to wind and currents (Onarheim et al., 2018; Stroeve and Notz, 2018; Årthun et al., 2019). The understanding of the link between drivers and change in the indicator is rated as certain.
Sea ice makes up the habitat for large numbers of species and affects physical and ecological processes beyond the ice itself. A large number of studies have shown that decreasing sea-ice extent can have significant effects on Arctic ecosystems (Grebmeier et al., 2006; Wassmann and Reigstad, 2011; Hamilton et al., 2015; Descamps et al., 2017; Eriksen et al., 2017, 2019; Frainer et al., 2017; Renaud et al., 2018; Huserbråten et al., 2019; Stige et al., 2019; Dalpadado et al., 2020; Gjøsæter et al., 2020; Daase et al., 2021; Mueter et al., 2021). The understanding of the importance of change in the indicator for other parts of the ecosystem is thus rated as good.
Examples of changes resulting from declines in sea ice which can be of ecosystem significance include i) declines in ice dependent marine mammals, such as ringed seals, white whales, narwhales, and polar bears (Hamilton et al., 2015; Stern and Laidre, 2016; Descamps et al., 2017) ii) declines in pelagic amphipods, such as Themisto libelulla (Stige et al., 2019) iii) declines in sea-ice associated mesozooplankton, such as Calanus glacialis (Stige et al., 2019; Dalpadado et al., 2020) iv) reduced recruitment of polar cod (Huserbråten et al., 2019).
There are different knowledge gaps associated with sea ice in summer and winter. Among knowledge gaps connected to summer sea-ice extent are details about surface features such as melt-pond development, as well as ice thickness changes. For winter conditions, there is in general less observational in situ data available. Among knowledge gaps are needs for more information about snow and ice thickness changes (e.g. (Gerland et al., 2019)).
References
Daase, M., Berge, J., Søreide, J. E., and Falk-Petersen, S. 2021. Ecology of Arctic Pelagic Communities. In Arctic Ecology, pp. 219-259. Ed. by D. Thomas. John Wiley & Sons Ltd.
Dalpadado, P., Arrigo, K. R., van Dijken, G. L., Skjoldal, H. R., Bagøien, E., Dolgov, A., Prokopchuk, I., et al. 2020. Climate effects on temporal and spatial dynamics of phytoplankton and zooplankton in the Barents Sea. Progress in Oceanography, 185: 102320.
Descamps, S., Aars, J., Fuglei, E., Kovacs, K. M., Lydersen, C., Pavlova, O., Pedersen, A. O., et al. 2017. Climate change impacts on wildlife in a High Arctic archipelago - Svalbard, Norway. Global Change Biology, 23: 490-502.
Eriksen, E., Huserbråten, M., Gjøsæter, H., Vikebø, F., and Albretsen, J. 2019. Polar cod egg and larval drift patterns in the Svalbard archipelago. Polar Biology.
Eriksen, E., Skjoldal, H. R., Gjosaeter, H., and Primicerio, R. 2017. Spatial and temporal changes in the Barents Sea pelagic compartment during the recent warming. Progress in Oceanography, 151: 206-226.
Frainer, A., Primicerio, R., Kortsch, S., Aune, M., Dolgov, A. V., Fossheim, M., and Aschan, M. M. 2017. Climate-driven changes in functional biogeography of Arctic marine fish communities. Proceedings of the National Academy of Sciences, 114: 12202-12207.
Gerland, S., Barber, D., Meier, W., Mundy, C. J., Holland, M., Kern, S., Li, Z. J., et al. 2019. Essential gaps and uncertainties in the understanding of the roles and functions of Arctic sea ice. Environmental Research Letters, 14.
Gjøsæter, H., Huserbråten, M., Vikebø, F., and Eriksen, E. 2020. Key processes regulating the early life history of Barents Sea polar cod. Polar Biology.
Grebmeier, J. M., Overland, J. E., Moore, S. E., Farley, E. V., Carmack, E. C., Cooper, L. W., Frey, K. E., et al. 2006. A major ecosystem shift in the northern Bering Sea. Science, 311: 1461-1464.
Hamilton, C. D., Lydersen, C., Ims, R. A., and Kovacs, K. M. 2015. Predictions replaced by facts: a keystone species' behavioural responses to declining arctic sea-ice. Biology Letters, 11.
Huserbråten, M. B. O., Eriksen, E., Gjøsæter, H., and Vikebø, F. 2019. Polar cod in jeopardy under the retreating Arctic sea ice. Communications Biology, 2: 407.
IPCC 2019. IPCC Special Report on the Ocean and Cryosphere in a Changing Climate. Ed. by H.-O. Pörtner, D. C. Roberts, V. Masson-Delmotte, P. Zhai, M. Tignor, E. Poloczanska, K. Mintenbeck, A. Alegría, M. Nicolai, A. Okem, J. Petzold, B. Rama, and N. M. Weyer. Cambridge University Press, Cambridge.
Lind, S., and Ingvaldsen, R. 2012. Variability and impacts of Atlantic Water entering the Barents Sea from the north. Deep Sea Research, 62: 70-88.
Loeng, H. 1991. Features of the physical oceanographic conditions of the Barents Sea. Polar Research, 10: 5-18.
Mueter, F. J., Planque, B., Hunt, G. L., Alabia, I. D., Hirawake, T., Eisner, L., Dalpadado, P., et al. 2021. Possible future scenarios in the gateways to the Arctic for Subarctic and Arctic marine systems: II. prey resources, food webs, fish, and fisheries. ICES Journal of Marine Science.
Onarheim, I. H., Eldevik, T., Smedsrud, L. H., and Stroeve, J. C. 2018. Seasonal and Regional Manifestation of Arctic Sea Ice Loss. Journal of Climate, 31: 4917-4932.
Renaud, P. E., Daase, M., Banas, N. S., Gabrielsen, T. M., Søreide, J. E., Varpe, Ø., Cottier, F., et al. 2018. Pelagic food-webs in a changing Arctic: a trait-based perspective suggests a mode of resilience. ICES Journal of Marine Science, 75: 1871-1881.
Stern, H. L., and Laidre, K. L. 2016. Sea-ice indicators of polar bear habitat. The Cryosphere, 10: 2027-2041.
Stige, L. C., Eriksen, E., Dalpadado, P., and Ono, K. 2019. Direct and indirect effects of sea ice cover on major zooplankton groups and planktivorous fishes in the Barents Sea. ICES Journal of Marine Science, 76: I24-I36.
Stroeve, J. C., and Notz, D. 2018. Changing state of Arctic sea ice across all seasons. Environmental Research Letters, 13.
Wassmann, P., and Reigstad, M. 2011. Future Arctic Ocean seasonal ice zones and implications for pelagic-benthic coupling. Oceanography 24: 220-231.
Årthun, M., Eldevik, T., and Smedsrud, L. H. 2019. The Role of Atlantic Heat Transport in Future Arctic Winter Sea Ice Loss. Journal of Climate, 32: 3327-3341.
Arctic amphipod [AI29]
Phenomenon: Decreasing biomass of the Arctic amphipod Themisto libellula [AP29]
Ecosystem characteristic: Biological diversity
Amphipods of the genus Themisto are the dominant pelagic amphipod species in the Barents Sea. Themisto libellula is regarded as an Arctic species and T. abyssorum and, particularly, T. compressa as sub-Arctic (Dalpadado et al., 2001; Kraft et al., 2012; Havermans et al., 2019). Under the reference condition, Arctic amphipods are important prey for fish, seabirds and marine mammals in the Arctic part of the Barents Sea and considered important for sustaining the lipid-dependent Arctic predator community, including polar cod (Dalpadado et al., 2001, 2016; Descamps et al., 2017; Hop and Wiencke, 2019; ICES, 2020). Under the reference conditions they are also important predators of Calanus species (Auel et al., 2002; Kraft et al., 2013). In the Barents Sea, they can be found in ice-covered waters, both associated with sea ice and the open water close to the ice edge. They are considered key species in the ice-associated food web (Poltermann, 1998), especially as prey item for juvenile polar cod (Lønne and Gulliksen, 1989) and seabirds feeding in the marginal ice zone (Lønne and Gabrielsen, 1992). Thus, under the reference condition, ice-associated species may also contribute to the pelagic amphipod community.
The most important anthropogenic driver of change in the indicator is climate change. Time series analyses (1980-2015) on pelagic Arctic amphipods covering both the Norwegian and Russian part of the Barents Sea show that increasing temperatures and subsequent reduced ice cover had a corresponding direct effect with likely decrease in their biomass (Stige et al., 2019). Another study from the west and north of Svalbard (Kongsfjorden, Isfjorden and Rijpfjorden) also indicates that if the warming trend persists, these conditions will favour the smaller Atlantic/boreal amphipods (T. abyssorum), over the larger Arctic species T. libellula (Dalpadado, 2006). The decline in Arctic species could be due to loss of habitat (less Arctic water masses) during warming periods (Dalpadado et al., 2020; ICES, 2020). Given the extensive knowledge on the influence of climate change on T. libellula, the understanding of the link between driver and indicator is rated as certain.
Given the importance of Arctic pelagic amphipods in the diet of many species (Dalpadado et al., 2001, 2016; Descamps et al., 2017; Hop and Wiencke, 2019; ICES, 2020), a decline in the biomass of T. libellula is expected to have significant effects on Arctic predator communities. The understanding of the importance of changes in the indicator for other parts of the ecosystem is thus rated as good.
Examples of changes that would be of ecosystem significance include declines in pelagic biomass that would affect polar cod recruitment, growth and survival and reproduction of seabirds.
An important knowledge gap is that systematic monitoring of species composition is lacking.
References
Auel, H., Harjes, M., da Rocha, R., Stubing, D., and Hagen, W. 2002. Lipid biomarkers indicate different ecological niches and trophic relationships of the Arctic hyperiid amphipods Themisto abyssorum and T. libellula. Polar Biology, 25: 374-383.
Dalpadado, P. 2006. Distribution and reproduction strategies of krill (Euphausiacea) on the Norwegian shelf. Polar Biology, 29: 849-859.
Dalpadado, P., Arrigo, K. R., van Dijken, G. L., Skjoldal, H. R., Bagøien, E., Dolgov, A., Prokopchuk, I., et al. 2020. Climate effects on temporal and spatial dynamics of phytoplankton and zooplankton in the Barents Sea. Progress in Oceanography, 185: 102320.
Dalpadado, P., Borkner, N., Bogstad, B., and Mehl, S. 2001. Distribution of Themisto (Amphipoda) spp in the Barents Sea and predator-prey interactions. ICES Journal of Marine Science, 58: 876-895.
Dalpadado, P., Hop, H., Rønning, J., Pavlov, V., Sperfeld, E., Buchholz, F., Rey, A., et al. 2016. Distribution and abundance of euphausiids and pelagic amphipods in Kongsfjorden, Isfjorden and Rijpfjorden (Svalbard) and changes in their relative importance as key prey in a warming marine ecosystem. Polar Biology, 39: 1765-1784.
Descamps, S., Aars, J., Fuglei, E., Kovacs, K. M., Lydersen, C., Pavlova, O., Pedersen, A. O., et al. 2017. Climate change impacts on wildlife in a High Arctic archipelago - Svalbard, Norway. Global Change Biology, 23: 490-502.
Havermans, C., Auel, H., Hagen, W., Held, C., Ensor, N. S., and A. Tarling, G. 2019. Chapter Two - Predatory zooplankton on the move: Themisto amphipods in high-latitude marine pelagic food webs. In Advances in Marine Biology, pp. 51-92. Ed. by C. Sheppard. Academic Press.
Hop, H., and Wiencke, C. 2019. The Ecosystem of Kongsfjorden, Svalbard. In Advances in Polar Ecology. Springer, Cham, Zwitzerland.
ICES. 2020. Working Group on the Integrated Assessments of the Barents Sea (WGIBAR). ICES Scientific Reports. 2:30. 206 pp.
Kraft, A., Bauerfeind, E., Nöthig, E.-M., and Bathmann, U. V. 2012. Size structure and life cycle patterns of dominant pelagic amphipods collected as swimmers in sediment traps in the eastern Fram Strait. Journal of Marine Systems, 95: 1-15.
Kraft, A., Berge, J., Varpe, Ø., and Falk-Petersen, S. 2013. Feeding in Arctic darkness: mid-winter diet of the pelagic amphipods Themisto abyssorum and T. libellula. Marine Biology, 160: 241-248.
Lønne, O. J., and Gabrielsen, G. W. 1992. Summer diet of seabirds feeding in sea-ice-covered waters near Svalbard. Polar Biology 12: 685-692.
Lønne, O. J., and Gulliksen, B. 1989. Size, age and diet of polar cod, Boreogadus saida (Lepechin 1773) in ice covered waters. Polar Biology, 9: 187-191.
Poltermann, M. 1998. Abundance, biomass and small-scale distribution of cryopelagic amphipods in the Franz Josef Land area (Arctic). Polar Biology, 20: 134-138.
Stige, L. C., Eriksen, E., Dalpadado, P., and Ono, K. 2019. Direct and indirect effects of sea ice cover on major zooplankton groups and planktivorous fishes in the Barents Sea. ICES Journal of Marine Science, 76: I24-I36.
Cold-water benthos [AI30]
Phenomenon: Decrease of proportion of Arctic benthos species [AP30]
Ecosystem characteristic: Biological diversity
Under reference conditions, megabenthos species sensitive to climate change are unaffected. They are adapted to cool areas with at least seasonal ice cover, which is not the case of more boreal species. Thus, they contribute to the biodiversity in the Barents Sea.
The most important anthropogenic driver of change in this indicator is climate change. The area containing communities with a calculated lower temperature preference was reduced in the central Barents Sea in later years, whereas the transition zone expanded north and east, and communities with higher temperature preference covered the entire shelf area west of Svalbard (analyses using data up to 2015, Jørgensen et al. 2019). Early Russian studies have reported biomass fluctuations in macrofauna due to climate variability in the Barents Sea (Anisimova et al. 2011), suggesting that a northward displacement of subarctic and temperate species is a response to climate warming in the Arctic (see review by Wassmann et al. 2011). There is considerable agreement that climate change will result in significant alteration of benthic community structure throughout the Arctic, and within the Barents Sea (Renaud et al., 2008, 2015, 2019; Matishov et al., 2012). Species distributions are both directly and indirectly linked to climate parameters (temperature, ice cover), and these parameters are changing more rapidly in the Arctic than elsewhere on the planet (AMAP 2017). Thus, the understanding of the link between climate change and the indicator is rated as certain.
Removal or arrival of individual species represent a development away from 'intact nature' and will significantly affect regional biodiversity if it is/can become a dominant species or is a habitat-forming species which will have cascading effects on presence/absence of other taxa. Biodiversity is known to affect ecosystem functioning by both optimizing energy flow and resource use (Duffy et al., 2007; Barnes et al., 2018), and by providing functional redundancy, which may make a system more resilient to future changes in species composition (Oliver et al., 2015). Displacement of Arctic species may have no appreciable effects if the taxa play similar ecological roles (Węsławski et al., 2018).
Whereas we are quite certain about the link to the driver, the impact on the ecosystem is less well understood since this is very much dependent on which taxa (and thus which ecosystem roles) that will be impacted. Available information already suggests some taxa that have been or are likely to be changing in the Arctic (Berge et al., 2005; Renaud et al., 2019), and at least some of these play important roles. Thus, the understanding of the importance of change in the indicator for other parts of the ecosystem impact is rated as good.
Even modest changes diversity may have large effects if the changes relate to community dominants, habitat-forming taxa, or species playing key roles in diets of other organisms. Changing benthic species composition associated with measured differences in secondary production, energy flows through food webs, etc. will indicate ecosystem-significant effects.
Species compositions among different habitats, and how these values vary temporally, are not well known such that climate-driven changes may not be noticed until there is already a significant ecosystem effect.
References
Anisimova NA, Jørgensen LL, Lubin P, Manushin I (2011) Benthos. In: Jakobsen T, Ozhigin V (eds) The Barents Sea ecosystem: Russian-Norwegian cooperation in research and management. Tapir Academic Press, Trondheim,
Barnes, A. D., Jochum, M., Lefcheck, J. S., Eisenhauer, N., Scherber, C., O’Connor, M. I., de Ruiter, P., et al. 2018. Energy Flux: The Link between Multitrophic Biodiversity and Ecosystem Functioning. Trends in Ecology & Evolution, 33: 186–197.
Berge, J., Johnsen, G., Nilsen, F., Gulliksen, B., and Slagstad, D. 2005. Ocean temperature oscillations enable reappearance of blue mussels Mytilus edulis in Svalbard after a 1000 year absence. Marine Ecology Progress Series, 303: 167–175.
Duffy, J. E., Cardinale, B. J., France, K. E., McIntyre, P. B., Thébault, E., and Loreau, M. 2007. The functional role of biodiversity in ecosystems: incorporating trophic complexity. Ecology Letters, 10: 522–538.
Jørgensen et al.2019. Impact of multiple stressors on sea bed fauna in a warming Arctic https://doi.org/10.3354/meps12803
Matishov, G., Moiseev, D., Lyubina, O., Zhichkin, A., Dzhenyuk, S., Karamushko, O., and Frolova, E. 2012. Climate and cyclic hydrobiological changes of the Barents Sea from the twentieth to twenty-first centuries. Polar Biology, 35: 1773–1790.
Oliver, T. H., Heard, M. S., Isaac, N. J. B., Roy, D. B., Procter, D., Eigenbrod, F., Freckleton, R., et al. 2015. Biodiversity and Resilience of Ecosystem Functions. Trends in Ecology & Evolution, 30: 673–684.
AMAP. 2017. Adaptation Actions for a Changing Arctic: Perspectives from the Barents Area. Technical Report. Arctic Monitoring and Assessment Programme (AMAP). https://oaarchive.arctic-council.org/handle/11374/2078 (Accessed 19 November 2021).
Renaud, P. E., Carroll, M. L., and Ambrose Jr, W. G. J. 2008. Effects of global warming on Arctic sea-floor communities and its consequences for higher trophic levels. Fundación BBVA. https://scholar.google.com/scholar_lookup?title=Effects+of+global+warming+on+Arctic+sea-floor+communities+and+its+consequences+for+higher+trophic+levels&author=Renaud%2C+P.E.&publication_year=2008 (Accessed 28 March 2022).
Renaud, P. E., Sejr, M. K., Bluhm, B. A., Sirenko, B., and Ellingsen, I. H. 2015. The future of Arctic benthos: Expansion, invasion, and biodiversity. Progress in Oceanography, 139: 244–257.
Renaud, P. E., Wallhead, P., Kotta, J., Włodarska-Kowalczuk, M., Bellerby, R. G. J., Rätsep, M., Slagstad, D., et al. 2019. Arctic Sensitivity? Suitable Habitat for Benthic Taxa Is Surprisingly Robust to Climate Change. Frontiers in Marine Science, 6. https://www.frontiersin.org/articles/10.3389/fmars.2019.00538/full (Accessed 1 October 2019).
Wassmann P, Duarte CM, Agusti S, Sejr MK (2011) Footprints of climate change in the Arctic marine ecosystem. Glob Change Biol 17: 1235−1249
Węsławski, J. M., Dragańska-Deja, K., Legeżyńska, J., and Walczowski, W. 2018. Range extension of a boreal amphipod Gammarus oceanicus in the warming Arctic. Ecology and Evolution, 8: 7624–7632.
Arctic fish [AI31]
Phenomenon: Decreasing abundance of Arctic fish species [AP31]
Ecosystem characteristic: Biological diversity
Under the reference condition, Arctic fish species dominate the Arctic waters found north and east of the polar front (Fossheim et al., 2015).
The most important anthropogenic driver of change in this indicator is climate change. Reduction in sea-ice cover and increase in sea water temperature are related to a decrease in the abundance of Arctic fish species in Arctic communities (Fossheim et al., 2015; Frainer et al., 2017). Arctic fish species are often ice-associated or are tightly coupled with the demersal habitat, where biomass production is dependent on the sinking of organic matter originated in the surface ice or in the pelagic zone (Degen et al., 2016). Arctic fish species have small body sizes, which makes them particularly vulnerable to the larger body sizes and more generalist diet of the boreal species (Frainer et al., 2017). The link to climate change is assessed as certain.
A decrease in the total abundance of Arctic fish species indicates a shift in the functioning of Arctic ecosystems. The boreal and Sub-Arctic species that replace the Arctic ones have different characteristics and life histories that will lead to changes in the ecosystem function and structure of the Arctic. Whereas Arctic fish species are year-round residents of the Arctic region, the boreal fish species are most likely residing in the Arctic during a short season. The effect of the boreal species over the Arctic ones, with the boreal species consuming or out-competing the Arctic ones due to larger body sizes and more generalist diet of the former, will likely have strong effects on the recruitment of Arctic fish species. This will also reduce resource cycling in the Arctic during the months when boreal species are not present. This will likely also reduce the diversity of functional traits present in the Arctic (Frainer et al., 2021), affecting the niche space occupied by the Arctic species in the Arctic. The understanding of the importance of decreasing abundance of Arctic fish species for other parts of the ecosystem is assessed as good.
Decreasing trend in the abundance of Arctic fish species can be considered of ecosystem significance if, for example, the Arctic ecosystem becomes dominated by boreal-like species. This would significantly change the character of the Arctic, from ice- or benthic-associated small fish to demersal-pelagic large fish dominating communities.
References
Degen, R., Jorgensen, L. L., Ljubin, P., Ellingsen, I. H., Pehlke, H., and Brey, T. 2016. Patterns and drivers of megabenthic secondary production on the Barents Sea shelf. Marine Ecology Progress Series, 546: 1-16.
Fossheim, M., Primicerio, R., Johannesen, E., Ingvaldsen, R. B., Aschan, M. M., and Dolgov, A. V. 2015. Recent warming leads to a rapid borealization of fish communities in the Arctic. Nature Climate Change, 5: 673-677.
Frainer, A., Primicerio, R., Dolgov, A., Fossheim, M., Johannesen, E., Lind, S., and Aschan, M. 2021. Increased functional diversity warns of ecological transition in the Arctic. Proceedings of the Royal Society B-Biological Sciences, 288: 7.
Frainer, A., Primicerio, R., Kortsch, S., Aune, M., Dolgov, A. V., Fossheim, M., and Aschan, M. M. 2017. Climate-driven changes in functional biogeography of Arctic marine fish communities. Proceedings of the National Academy of Sciences of the United States of America, 114: 12202-12207.
Fish sensitive to fisheries [AI32]
Phenomenon: Decreasing abundance of fish species sensitive to fisheries [AP32]
Ecosystem characteristic: Biological diversity
Note: This text is similar to the indicator “Fish life history” in the Sub-Arctic Barents Sea which is focusing on Equilibrium species decline. However, the life history indicator focuses on the life history strategy biomass changes, while this indicator focuses on abundance of species with typical Equilibrium life history strategy.
Under the reference condition, fish species sensitive to increased mortality from fisheries are well represented in the demersal fish community. These species can be identified by their typically “slow-type” life-history traits, having a large body size, long life-span, late maturation and low fecundity. They typically have stable population dynamics and very low rate of intrinsic population increase, making them vulnerable to additional sources of mortality (Jennings et al., 1998; Hutchings et al., 2012; Le Quesne and Jennings, 2012). In addition, these species are often top predators in the system, and have an important structuring role in the ecosystem.
The most important anthropogenic driver of change in this indicator is fisheries. Fisheries preferentially harvest large bodied species and individuals. In addition, species life-history traits are known to be related to their vulnerability to increase in mortality from fisheries (Jennings et al., 1998; Le Quesne and Jennings, 2012). Species with a slow-type, Equilibrium life history have a large body size, produce few but large offspring with high survival rate; this strategy is typically followed by sharks and rays (Pecuchet et al., 2017). Some typical Equilibrium species in the Barents Sea are sharks and rays such Greenland shark (Somniosus microcephalus), Velvet belly lanternshark (Etmopterus spinax), Rabbit fish (Chimaera monstrosa), Spinytail skate (Bathyraja spinicauda), and Thorny skate (Amblyraja radiata. These large, slow growing, and low fecundity species are characterized by a low intrinsic productivity, which make them especially vulnerable to fishing pressure (Stevens et al., 2000; King and McFarlane, 2003; Winemiller, 2005; Quetglas et al., 2016; Mérillet et al., 2021). Even though fisheries activities are rarely targeting these species, they are often suffering from high by-catch fishing mortality. In addition to the sharks and rays, also Redfishes (Sebastes spp.) are vulnerable to additional mortality from fisheries due to slow growth and late maturation, even though they have higher fecundity compared to the elasmobranchs. The understanding of the link between fisheries and the indicator is assessed as certain.
Slow-type, Equilibrium life-history species are often top predators in the marine environment. The removal of these top predators can impact the size structure of the communities and as a result impact the structure of the food web. A decline in top predators can also lead to trophic cascades (Myers and Worm, 2003; Myers et al., 2007), it can have implications for top-down and bottom-up control in the ecosystem (Brose et al., 2012) and affect the energy flow across trophic levels. The understanding of the importance of changes in the abundance of fisheries sensitive species for other parts of the ecosystem is assessed as good.
Decreasing trend in the abundance of fish species sensitive to increased mortality from fisheries can be considered of ecosystem significance if, for example, i) some of the species goes extinct, ii) reduced abundance of these species triggers a trophic cascade through reduced predation pressure on its prey.
Knowledge gaps:
Climate change effects on these species may interact with fisheries impacts.
References
Brose, U., Dunne, J. A., Montoya, J. M., Petchey, O. L., Schneider, F. D., and Jacob, U. 2012. Climate change in size-structured ecosystems. Philosophical Transactions of the Royal Society B-Biological Sciences, 367: 2903-2912.
Hutchings, J. A., Myers, R. A., Garcia, V. B., Lucifora, L. O., and Kuparinen, A. 2012. Life-history correlates of extinction risk and recovery potential. Ecological Applications, 22: 1061-1067.
Jennings, S., Reynolds, J. D., and Mills, S. C. 1998. Life history correlates of responses to fisheries exploitation. Proceedings of the Royal Society B-Biological Sciences, 265: 333-339.
King, J. R., and McFarlane, G. A. 2003. Marine fish life history strategies: applications to fishery management. Fisheries Management and Ecology, 10: 249-264.
Le Quesne, W. J. F., and Jennings, S. 2012. Predicting species vulnerability with minimal data to support rapid risk assessment of fishing impacts on biodiversity. Journal of Applied Ecology, 49: 20-28.
Mérillet, L., Pavoine, S., Kopp, D., Robert, M., and Mouchet, M. 2021. Biomass of slow life history species increases as local bottom trawl effort decreases in the Celtic sea. Journal of Environmental Management, 290: 112634.
Myers, R. A., Baum, J. K., Shepherd, T. D., Powers, S. P., and Peterson, C. H. 2007. Cascading effects of the loss of apex predatory sharks from a coastal ocean. Science, 315: 1846-1850.
Myers, R. A., and Worm, B. 2003. Rapid worldwide depletion of predatory fish communities. Nature, 423: 280-283.
Pecuchet, L., Lindegren, M., Hidalgo, M., Delgado, M., Esteban, A., Fock, H. O., de Sola, L. G., et al. 2017. From traits to life-history strategies: Deconstructing fish community composition across European seas. Global Ecology and Biogeography, 26: 812-822.
Quetglas, A., Rueda, L., Alvarez-Berastegui, D., Guijarro, B., and Massut, E. 2016. Contrasting responses to harvesting and environmental drivers of fast and slow life history species. Plos One, 11: 1-15.
Stevens, J. D., Bonfil, R., Dulvy, N. K., and Walker, P. A. 2000. The effects of fishing on sharks, rays, and chimaeras (chondrichthyans), and the implications for marine ecosystems. ICES Journal of Marine Science, 57: 476-494.
Winemiller, K. O. 2005. Life history strategies, population regulation, and implications for fisheries management. Canadian Journal of Fisheries and Aquatic Sciences, 62: 872-885.
Seabirds sensitive to pollution [AI33]
Phenomenon: Decreasing abundance of Glaucous gull [AP33]
Ecosystem characteristic: Biological diversity
Under the reference condition, glaucous gull (Larus hyperboreus) is an important top predator in the Arctic and Sub-Arctic parts of the Barents Sea (ICES, 2020).
The most important anthropogenic driver of change in this indicator is long-transported pollution (Erikstad and Strøm, 2012). High levels of long-transported organochlorine pollutants (OC) in adults have reduced adult survival and reproduction on Bjørnøya (Bustnes et al., 2003) and this factor has contributed strongly to the observed decline in the population (Erikstad and Strøm, 2012). However, other environmental factors have probably also had an impact (Erikstad and Strøm, 2012), such as OC, which show intensified effects under poor environmental conditions (Bustnes et al., 2006). The links between pollution and the indicator are well described and the understanding about this thus assessed as certain.
The Glaucous gull is an Arctic generalist top predator and scavenger who exploits a variety of prey, including fish, molluscs, echinoderms, crustaceans, eggs, young and adult seabirds, carcasses of whales and marine mammals, fish discards and garbage. Birds nesting in or near seabird colonies often specialize on eggs, chicks or adults of other seabird species (Strøm, 2007). The species is listed as near threatened on the red list for Svalbard (Henriksen and Hilmo, 2015). The understanding of the importance of changes in the indicator for other parts of the ecosystem is assessed as good.
A decreasing trend in abundance of glaucous gulls can be considered of ecosystem significance when there is a significant and long-term (>10 years) decrease in the abundance of the species associated with elevated concentrations of organic pollutants.
Knowledge gaps:
The abundance of glaucous gull is monitored on Bear Island and Spitsbergen. Several other factors could contribute to declining abundance, such as shortage of food including reduced availability of fishery discards, predation by a growing arctic fox population and increased competition with great skuas.
References
Bustnes, J. O., Erikstad, K. E., Hanssen, S. A., Tveraa, T., Folstad, I., and Skaare, J. U. 2006. Anti-parasite treatment removes negative effects of environmental pollutants on reproduction in an Arctic seabird. Proceedings of the Royal Society B-Biological Sciences, 273: 3117-3122.
Bustnes, J. O., Erikstad, K. E., Skaare, J. U., Bakken, V., and Mehlum, F. 2003. Ecological effects of organochlorine pollutants in the Arctic: A study of the Glaucous Gull. Ecological Applications, 13: 504-515.
Erikstad, K. E., and Strøm, H. 2012. Effekter av miljøgifter på bestanden av polarmåke på Bjørnøya.
Henriksen, S., and Hilmo, O. 2015. Norsk rødliste for arter 2015, Artsdatabanken, Norge.
ICES. 2020. Working Group on the Integrated Assessments of the Barents Sea (WGIBAR). 2:30. 206 pp.
Strøm, H. 2007. Birds of Svalbard. In Polar Handbook No. 13, pp. 86-191. Ed. by K. M. Kovacs, and C. Lydersen. Norwegian Polar Institute.
Arctic seabirds [AI34]
Phenomenon: Decreasing abundance of Arctic seabird species [AP34]
Ecosystem characteristic: Biological diversity
Under the reference condition, Arctic seabird species are abundant in the Arctic part of the Barents Sea (ICES, 2020). Historical hunting and industrial fishing of important prey items had large impacts on the population dynamics of these species during the 20th century (Krashnov and Barrett, 1995). In addition, the historical extirpation of cetaceans around Spitsbergen did probably also influence the abundance of Arctic seabirds (Hacquebord, 2001).
The most important anthropogenic driver of change in this indicator is climate change (Descamps and Strøm, 2021). Under climate warming, a borealization of the ecosystem is expected. This mechanism involves a shift in species composition from Arctic to boreal species (Fossheim et al., 2015; Descamps and Strøm, 2021). The most abundant Arctic species observed during the ecosystem survey are Brünnich’s guillemot (Uria lomvia), little auk (Alle alle) and black-legged kittiwake (Rissa tridactyla) (ICES, 2020). In addition, black guillemot (Cephus grylle) and ivory gull (Pagophila eburnea) are frequently observed close to sea ice. These species are expected to decrease in abundance under climate warming (Descamps and Strøm, 2021). The understanding of the link between climate change and the indicator is assessed as certain.
Arctic seabirds are an important and conspicuous part of the sympagic fauna. They forage on polar cod and ice-associated amphipods, krill and copepods (Mehlum and Gabrielsen, 1993; Mehlum, 1997). Arctic species that are unable to adapt to a changing environment and are expected to decrease in abundance under climate warming. As a consequence, several of the characteristic Arctic species are listed on national and international red lists. Brünnich’s guillemot and Black-legged kittiwake are listed as near threatened and Ivory gull is listed as vulnerable on the red list for Svalbard (Henriksen and Hilmo, 2015). The understanding of the importance of changes in the indicator for other parts of the ecosystem is assessed as good
A decreasing trend in the indicator can be considered of ecosystem significance if there is a significant gradual long-term (> 10 years) decrease in the biomass associated with climate warming and a borealization of the ecosystem.
Knowledge gaps:
The time series from the ecosystem survey in the Barents Sea is relatively short (2004-2020). The indicator is sensitive to natural fluctuations in the Barents Sea climate and the abundance and distribution of key species such as capelin. Lagged responses could be expected with respect to the effects of borealization.
References
Descamps, S., and Strøm, H. 2021. As the Arctic becomes boreal: ongoing shifts in a high-Arctic seabird community. Ecology, e03485.
Fossheim, M., Primicerio, R., Johannesen, E., Ingvaldsen, R. B., Aschan, M. M., and Dolgov, A. V. 2015. Recent warming leads to a rapid borealization of fish communities in the Arctic. Nature Climate Change, 5: 673-677.
Hacquebord, L. 2001. Three centuries of whaling and walrus hunting in Svalbard and its impact on the Arctic ecosystem. Environment and History, 7: 169-185.
Henriksen, S., and Hilmo, O. 2015. Norsk rødliste for arter 2015, Artsdatabanken, Norge.
ICES. 2020. Working Group on the Integrated Assessments of the Barents Sea (WGIBAR). 2:30. 206 pp.
Krashnov, Y. V., and Barrett, R. T. 1995. Large-scale interactions between seabirds, their prey and man in the southern Barents Sea. In Ecology of Fjords and Coastal Waters, pp. 443-456. Ed. by H. R. Skjoldal, C. C. E. Hopkins, K. E. Erikstad, and H. P. Leinaas. Elsevier Science, Amsterdam.
Mehlum, F. 1997. Seabird species associations and affinities to areas covered with sea ice in the northern Greenland and Barents Seas. Polar Biology, 18: 116-127.
Mehlum, F., and Gabrielsen, G. W. 1993. The diet of High-Arctic seabirds in coastal and ice-covered, pelagic areas near the Svalbard archipelago. Polar Research, 12: 1-20.
Mammals sensitive to pollution [AI35]
Phenomenon: Decreasing abundance of mammal species sensitive to pollution [AP35]
Ecosystem characteristic: Biological diversity
All marine mammals are exposed to anthropogenic pollutants, thus there are no places on earth with “intact nature” in this respect.
The drivers are dumping of waste, industrial production of various substances that are released into the environment (often used in agriculture as pesticides or treatment of plant diseases), emissions during industrial processes that in addition to local pollution are transported around the globe with ocean currents and via atmospheric transport – thus reaching the entire planet. Many of the substances bioaccumulate in food webs and are therefore found in higher concentrations in upper trophic level animals such as many marine mammal species. In addition, many contaminants are lipophilic and thus accumulate in lipid tissues, which all marine mammals have in large quantities as an adaptation by homeothermic mammals living in the world’s oceans; Arctic marine mammals are highly dependent on their blubber layer to get them through periods of low production/feeding. Polar bears, which are pinnacle predators, have high concentrations of many pollutants (e.g., Desforges et al. 2018, Routti et al. 2019), reaching levels in the Norwegian Arctic that are thought to disrupt hormone systems, lipid metabolism and neurochemistry (Routti et al. 2019). All toothed whales have poor capacity to metabolize toxic substances and hence white whales are particularly vulnerable to the toxins to which they are exposed in the Barents Sea (e.g., Wolkers et al. 2006, Desforges et al. 2018, Lydersen and Kovacs 2021). Some Arctic seal species also have high concentrations of various pollutants (e.g., Wolkers et al. 2000, Scotter et al. 2019). However, some of the most problematic, lipophilic compounds such as PCBs and DDEs that have been banned from production, are declining rapidly as a result of substance bans (e.g., Wolkers et al. 2008, Routti et al. 2014).
The MOSJ programme monitors selected pollutants in polar bears and ringed seals. Most of the parameters measured in polar bears (HCB, BetaHCH an dDDE, BDE-47, PCB.153 and oxychlordane and PFOS) have declined through the monitoring period. PFNA and PFUnDA show no significant trends. Mercury might be increasing over the monitoring period. The patterns in ringed seals are similar (See MOSJ https://www.mosj.no/no/pavirkning/forurensning) although data appear more variable because sampling is less frequent.
The understanding of the links between the driver and indicators is assessed are less certain, as most effect studies are correlative not causal.
High levels of various pollutants have the potential to impact mammalian functions related to metabolism, reproduction and other vital processes. This can lead to decreased numbers of marine mammals via increased mortality and reduced reproductive rates, which then will alter the structure of the whole ecosystem. The greatest concern is that pollutants are part of a multi-stressor system, where animals weakened by one stressor are more vulnerable to other threats. Thus, top predators are believed to be at risk of being impacted by contaminants and reduction in top predators might have cascading effects on the whole ecosystem (see above- top-down control).
The understanding of the importance of change in the indicator for other parts of the ecosystem is thus assessed as less good.
Understanding of the indicator is less good, because most studies on effects are still based on correlations and not causality, and reduction of reproductive capacity has not been demonstrated to be due to pollution in Arctic marine mammal population in the Barents Sea.
Knowledge gaps: More studies of the effects of pollutants on animal physiology and endocrinology are needed.
References
Desforges, J.-P., Hall, A., McConnell, B., Rosing-Asvid, A., Barber, J. L., Brownlow, A. Guise, S. de, Eulaers, I., Jepson, P. D., Letcher, R. J., Levin, M., Ross, P.S., Samarra, F., Vikingsson, G., Sonne, C. and Dietz, R. 2018. Predicting global killer whale population collapse from PCB pollution. Science 361: 1373-1376.
Lydersen, C. and Kovacs, K. M. 2021. A review of the ecology and status of white whales (Delphinapterus leucas) in Svalbard, Norway. Polar Res. In press
Routti, H., Atwood, T. C., Bechshoft, T., Boltunov, A., Ciesielski, T. M., Desforges, J.-P., Dietz, R., Gabrielsen, G. W., Jenssen, B. M., Letcher, R. L., McKinney, M. A., Morris, A. D., Riget, F. F., Sonne, C., Styrishave, B. and Tartu, S. 2019. State of knowledge on current exposure, fate and potential health effects of contaminants in polar bears from the circumpolar Arctic. Sci. Total Environ. 664: 1063-1083.
Routti, H., Lydersen, C., Hansen, L. and Kovacs, K. M. 2014. Contaminant levels in the world's northernmost harbor seals (Phoca vitulina). Mar. Pollut. Bull. 87: 140-146.
Scotter, S. E., Tryland, M., Nymo, I. H., Hanssen, L., Harju, M., Lydersen, C., Kovacs, K. M., Klein, J., Fisk, A. T. and Routti, H. 2019. Contaminants in Atlantic walruses in Svalbard Part 1: Relationships between exposure, diet and pathogen prevalence. Environ. Pollut. 244: 9-18.
Wolkers, H., Burkow, I. C., Lydersen, C. and Witkamp, R. F. 2000. Chlorinated pesticide concentrations with emphasis on the polychlorinated camphenes (toxaphenes), in relation to cytochrome P450 enzyme activities in Barents Sea harp seals (Phoca groenlandica). Environ. Toxicol. Chem. 19: 1632-1637.
Wolkers, H., Krafft, B. A., Bavel, B. Van, Helgason, L. B., Lydersen, C. and Kovacs, K. M. 2008. Biomarker responses and decreasing contaminant levels in ringed seals (Pusa hispida) from Svalbard, Norway. J. Toxicol. Environ. Health A 71: 1009-1018.
Wolkers, H., Lydersen, C., Kovacs, K. M., Burkow, I. and Bavel, B. van. 2006. Accumulation, metabolism, and food-chain transfer of chlorinated and brominated contaminants in subadult white whales (Delphinapterus leucas) and narwhals (Monodon monoceros) from Svalbard, Norway. Arch. Environ. Contam. Toxicol. 50: 69-78.
Arctic mammals [AI36]
Phenomenon: Decreasing abundance of Arctic mammal species [AP36]
Ecosystem characteristic: Biological diversity
Historical stock sizes for most Arctic endemic marine mammals were much higher than they are currently for most species (see above). Overharvesting took some species to the brink of extinction. Under such circumstances, most mammalian populations exhibit reduced genetic diversity. Additionally, small populations are at increasingly risk of genetic drift, and disease events which can result in further reduction of diversity and resilience.
Remarkably, despite the extreme harvest levels for bowhead whales in the Barents Sea, the population seems to have maintained a high level of genetic diversity (Bachmann et al., 2021). Similarly, current evidence does not support large genetic losses for walruses in Svalbard (Lindqvist et al., 2016). However, polar bears in the Barents Sea population appear to be undergoing loss of genetic diversity on a decadal scale currently, which is thought to be linked to declining sea-ice conditions inducing habitat fragmentation (Maduna et al., 2021).
There are considerable knowledge gaps in our understanding of genetic diversity of many Arctic marine mammal populations in the Barents Sea that prevents a holistic assessment of potential diversity losses due to overharvesting in the past and current environmental change. For the species for which there are some data, the signals are mixed. The understanding of the linkage between drivers and the indicator is thus ranked as less certain.
The understanding of the importance of change in the indicator for other parts of the ecosystem is ranked as less good.
References
Bachmann, L., Cabrera, A.A., Heide-Jørgensen, M-P., Shpak, O.V., Lydersen, C., Wiig, Ø., and Kovacs, K.M. 2021. Mitogenomics and the genetic differentiation of contemporary bowhead whales (Balaena mysticetus (Cetacea)) from Svalbard. Zoological Journal of the Linnean Society 191: 1192–1203.
Lindqvist, C., Roy, T., Lydersen, C., Kovacs, K.M., Aars, J., Wiig, Ø., and Bachmann, L. 2016. Genetic diversity of historical Atlantic walruses (Odobenus rosmarus rosmarus) from Bjørnøya and Håøya (Tusenøyane), Svalbard, Norway. BMC Research Notes 9: 112, doi: 10.1186/s13104-016-1907-8.
Maduna, S.N., Aars, J., Fløystad, I., Klütsch, C.F.C., Zeyl Fiskebeck, E.M.L., Wiig, Ø., Ehrich, D., Andersen, M., Bachmann, L., Derocher, A.E., Nyman, T., Eiken,, H.G,. and Hagen, S.B. 2021. Sea ice reduction drives genetic differentiation among Barents Sea polar bears. Proc. R. Soc. B 288: 20211741. https://doi.org/10.1098/rspb.2021.1741
Temperature [AI37]
Phenomenon: Warming of the water column [AP37]
Ecosystem characteristic: Abiotic factors
Under the reference condition, which for abiotic factors are predefined as the climate in the period 1961-1990, the Arctic part of the Barents Sea was characterised by an Arctic climate dominated by low ocean temperatures (Loeng, 1991; Lind and Ingvaldsen, 2012). Regions with Arctic climate provide permanent habitat for Arctic species and seasonal feeding habitat for migrating boreal species. Data on temperature exist from 1970 (Johannesen et al., 2012; Michalsen et al., 2013), implying that quantitative information for the indicator exists only for part of the reference condition.
The most important anthropogenic driver of change in the indicator is climate change, causing the water column to warm (IPCC, 2019). More open water during summer increases the seasonal warming of the surface layers with subsequent heating of the Arctic Water below at the end of summer (Perovich et al., 2008; Lind et al., 2016; Lind et al., 2018) also beyond the melt season (Timmermans, 2015; Ivanov et al., 2016). Anthropogenic global warming leads to increasing ocean temperature in the inflowing Atlantic Water (Sandø et al., 2014; Årthun et al., 2019). Given the massive evidence of anthropogenic influence on the climate in general (Masson-Delmotte et al., 2021) and for the Barents Sea locally described above, the understanding of the link between drivers and change in the indicator is rated as certain.
Change in temperature has large implications for the ecosystem in the Arctic part of the Barents Sea, either directly or through an influence on other aspects of the abiotic environment, such as sea-ice extent. Impact of increasing temperature and decreasing sea ice has been documented through a large number of studies (Søreide et al., 2010; Dalpadado et al., 2012; Kortsch et al., 2012; Fossheim et al., 2015; Hamilton et al., 2015; Kortsch et al., 2015; Hamilton et al., 2016; Descamps et al., 2017a; Descamps et al., 2017b; Eriksen et al., 2017; Frainer et al., 2017; Hamilton et al., 2017; Lind et al., 2018; Hop and Wiencke, 2019; Dalpadado et al., 2020; Gjøsæter et al., 2020; Mueter et al., 2021), and the understanding of the importance of changes in the indicator for the rest of the ecosystem is thus rated as good.
Examples of changes which can be considered of ecosystem significance as a result of warming of the water include increases in total primary and secondary production (Dalpadado et al., 2012, 2020), and increases in production and growth further up in the food chain, with contrasting responses between boreal and Arctic species (Dalpadado et al., 2012; Kjesbu et al., 2014; Aarflot et al., 2018; Stige et al., 2019).
A knowledge gap concerns the link between surface fluxes and intermediate water layers. More open water during summer increases the solar input and results in higher temperatures at the end of summer (Perovich et al., 2008; Timmermans, 2015; Ivanov et al., 2016; Lind et al., 2016; Lind et al., 2018). However, sea-ice reduction in winter increases the winter ventilation and thus the heat loss from the water column during the cold season (Asbjørnsen et al., 2020; Polyakov et al., 2020). The understanding of how altered surface fluxes through the year affect the intermediate water layers in the Arctic Barents Sea is not fully understood.
References
Aarflot, J. M., Skjoldal, H. R., Dalpadado, P., and Skern-Mauritzen, M. 2018. Contribution of Calanus species to the mesozooplankton biomass in the Barents Sea. ICES Journal of Marine Science, 75: 2342-2354.
Asbjørnsen, H., Årthun, M., Skagseth, Ø., and Eldevik, T. 2020. Mechanisms Underlying Recent Arctic Atlantification. Geophysical Research Letters, 47: e2020GL088036.
Dalpadado, P., Arrigo, K. R., van Dijken, G. L., Skjoldal, H. R., Bagøien, E., Dolgov, A., Prokopchuk, I., et al. 2020. Climate effects on temporal and spatial dynamics of phytoplankton and zooplankton in the Barents Sea. Progress in Oceanography, 185: 102320.
Dalpadado, P., Ingvaldsen, R. B., Stige, L. C., Bogstad, B., Knutsen, T., Ottersen, G., and Ellertsen, B. 2012. Climate effects on Barents Sea ecosystem dynamics. ICES Journal of Marine Science, 69: 1303-1316.
Descamps, S., Aars, J., Fuglei, E., Kovacs, K. M., Lydersen, C., Pavlova, O., Pedersen, A. O., et al. 2017a. Climate change impacts on wildlife in a High Arctic archipelago - Svalbard, Norway. Global Change Biology, 23: 490-502.
Descamps, S., Anker-Nilssen, T., Barrett, R. T., Irons, D. B., Merkel, F., Robertson, G. J., Yoccoz, N. G., et al. 2017b. Circumpolar dynamics of a marine top-predator track ocean warming rates. Global Change Biology, 23: 3770-3780.
Eriksen, E., Skjoldal, H. R., Gjosaeter, H., and Primicerio, R. 2017. Spatial and temporal changes in the Barents Sea pelagic compartment during the recent warming. Progress in Oceanography, 151: 206-226.
Fossheim, M., Primicerio, R., Johannesen, E., Ingvaldsen, R. B., Aschan, M. M., and Dolgov, A. V. 2015. Recent warming leads to a rapid borealization of fish communities in the Arctic. Nature Clim. Change, 5: 673-677.
Frainer, A., Primicerio, R., Kortsch, S., Aune, M., Dolgov, A. V., Fossheim, M., and Aschan, M. M. 2017. Climate-driven changes in functional biogeography of Arctic marine fish communities. Proceedings of the National Academy of Sciences, 114: 12202-12207.
Gjøsæter, H., Huserbråten, M., Vikebø, F., and Eriksen, E. 2020. Key processes regulating the early life history of Barents Sea polar cod. Polar Biology.
Hamilton, C. D., Kovacs, K. M., Ims, R. A., Aars, J., and Lydersen, C. 2017. An Arctic predator-prey system in flux: climate change impacts on coastal space use by polar bears and ringed seals. J Anim Ecol, 86: 1054-1064.
Hamilton, C. D., Lydersen, C., Ims, R. A., and Kovacs, K. M. 2015. Predictions replaced by facts: a keystone species' behavioural responses to declining arctic sea-ice. Biology Letters, 11.
Hamilton, C. D., Lydersen, C., Ims, R. A., and Kovacs, K. M. 2016. Coastal habitat use by ringed seals Pusa hispida following a regional sea-ice collapse: importance of glacial refugia in a changing Arctic. Marine Ecology Progress Series, 545: 261-277.
Hop, H., and Wiencke, C. 2019. The Ecosystem of Kongsfjorden, Svalbard. In Advances in Polar Ecology. Springer, Cham, Zwitzerland.
IPCC 2019. IPCC Special Report on the Ocean and Cryosphere in a Changing Climate. Ed. by H.-O. Pörtner, D. C. Roberts, V. Masson-Delmotte, P. Zhai, M. Tignor, E. Poloczanska, K. Mintenbeck, A. Alegría, M. Nicolai, A. Okem, J. Petzold, B. Rama, and N. M. Weyer. Cambridge University Press, Cambridge.
Ivanov, V., Alexeev, V., Koldunov, N. V., Repina, I., Sandø, A. B., Smedsrud, L. H., and Smirnov, A. 2016. Arctic Ocean Heat Impact on Regional Ice Decay: A Suggested Positive Feedback. Journal of Physical Oceanography, 46: 1437-1456.
Johannesen, E., Ingvaldsen, R. B., Bogstad, B., Dalpadado, P., Eriksen, E., Gjøsæter, H., Knutsen, T., et al. 2012. Changes in Barents Sea ecosystem state, 1970–2009: climate fluctuations, human impact, and trophic interactions. ICES Journal of Marine Science, 69: 880-889.
Kjesbu, O. S., Bogstad, B., Devine, J. A., Gjøsæter, H., Howell, D., Ingvaldsen, R. B., Nash, R. D. M., et al. 2014. Synergies between climate and management for Atlantic cod fisheries at high latitudes. Proceedings of the National Academy of Sciences of the United States of America, 111: 3478-3483.
Kortsch, S., Primicerio, R., Beuchel, F., Renaud, P. E., Rodrigues, J., Lonne, O. J., and Gulliksen, B. 2012. Climate-driven regime shifts in Arctic marine benthos. Proceedings of the National Academy of Sciences of the United States of America, 109: 14052-14057.
Kortsch, S., Primicerio, R., Fossheim, M., Dolgov, A. V., and Aschan, M. 2015. Climate change alters the structure of arctic marine food webs due to poleward shifts of boreal generalists. Proceedings of the Royal Society B-Biological Sciences, 282: 31-39.
Lind, S., and Ingvaldsen, R. 2012. Variability and impacts of Atlantic Water entering the Barents Sea from the north. Deep Sea Research, 62: 70-88.
Lind, S., Ingvaldsen, R., and Furevik, T. 2016. Arctic layer salinity controls heat loss from deep Atlantic layer in seasonally ice-covered areas of the Barents Sea. Geophysical Research Letters, 43.
Lind, S., Ingvaldsen, R. B., and Furevik, T. 2018. Arctic warming hotspot in the northern Barents Sea linked to declining sea-ice import. Nature Climate Change.
Loeng, H. 1991. Features of the physical oceanographic conditions of the Barents Sea. Polar Research, 10: 5-18.
Masson-Delmotte, V., Zhai, P., Pirani, A., Connors, S. L., Péan, C., Berger, S., Caud, N., et al. 2021. Climate Change 2021: The Physical Science Basis. Contribution of Working Group I to the Sixth Assessment Report of the Intergovernmental Panel on Climate Change. Cambridge University Press, Cambridge.
Michalsen, K., Dalpadado, P., Eriksen, E., Gjøsæter, H., Ingvaldsen, R. B., Johannesen, E., Jørgensen, L. L.., et al. 2013. Marine living resources of the Barents Sea – Ecosystem understanding and monitoring in a climate change perspective. Marine Biology Research, 9: 932-947.
Mueter, F. J., Planque, B., Hunt, G. L., Alabia, I. D., Hirawake, T., Eisner, L., Dalpadado, P., et al. 2021. Possible future scenarios in the gateways to the Arctic for Subarctic and Arctic marine systems: II. prey resources, food webs, fish, and fisheries. ICES Journal of Marine Science.
Perovich, D. K., Richter-Menge, J. A., Jones, K. F., and Light, B. 2008. Sunlight, water, and ice: Extreme Arctic sea ice melt during the summer of 2007. Geophysical Research Letters, 35.
Polyakov, I. V., Rippeth, T. P., Fer, I., Alkire, M. B., Baumann, T. M., Carmack, E. C., Ingvaldsen, R., et al. 2020. Weakening of Cold Halocline Layer Exposes Sea Ice to Oceanic Heat in the Eastern Arctic Ocean. Journal of Climate, 33: 8107-8123.
Sandø, A. B., Gao, Y., and Langehaug, H. R. 2014. Poleward ocean heat transports, sea ice processes, and Arctic sea ice variability in NorESM1 M simulations. Journal of Geophysical Research, 119: 2095-2108.
Stige, L. C., Eriksen, E., Dalpadado, P., and Ono, K. 2019. Direct and indirect effects of sea ice cover on major zooplankton groups and planktivorous fishes in the Barents Sea. ICES Journal of Marine Science, 76: I24-I36.
Søreide, J. E., Leu, E., Berge, J., Graeve, M., and Falk-Petersen, S. 2010. Timing of blooms, algal food quality and Calanus glacialis reproduction and growth in a changing Arctic. Global Change Biology, 16: 3154-3163.
Timmermans, M.-L. 2015. The impact of stored solar heat on Arctic sea ice growth. Geophysical Research Letters, 42: 6399-6406.
Årthun, M., Eldevik, T., and Smedsrud, L. H. 2019. The Role of Atlantic Heat Transport in Future Arctic Winter Sea Ice Loss. Journal of Climate, 32: 3327-3341.
Area of water masses [AI38]
Phenomenon: Decreasing area covered by Arctic Water [AP38]
Ecosystem characteristic: Abiotic factors
Under the reference condition, which for abiotic factors are predefined as the climate in the period 1961-1990, the Arctic part of the Barents Sea is characterised by an Arctic climate. Arctic water masses are dominating (Loeng, 1991; Lind and Ingvaldsen, 2012), and seasonal whole-year ice cover can generally be expected. The climate provides permanent habitat for Arctic species and seasonal feeding habitat for migrating boreal species. Data on temperature exist from 1970 (Johannesen et al., 2012; Michalsen et al., 2013), implying that quantitative information for the indicator exists only for part of the reference condition.
The most important anthropogenic driver of change in this indicator is climate change (IPCC, 2019). Arctic Water, characterized by sub-zero temperatures and low salinity, dominates in the northern Barents Sea (Loeng, 1991; Lind and Ingvaldsen, 2012). This contrasts with the southern Barents Sea which is dominated by warmer Atlantic Water. Anthropogenic global warming leads to northward expansion of Atlantic Water thereby reducing the area of Arctic Water (Smedsrud et al., 2010; Smedsrud et al., 2013; Oziel et al., 2016). The associated reductions in regional sea ice (Årthun et al., 2012; Onarheim et al., 2018) and sea-ice import (Lind et al., 2018) accelerate the loss of the Arctic Water area. Given the massive evidence of anthropogenic influence on the climate in general (Masson-Delmotte et al., 2021) and for the Barents Sea locally described above, the understanding of the link between driver and change in the indicator is rated as certain.
The decreasing extent of Arctic Water has profound impacts on the local and regional Arctic climate (Smedsrud et al., 2010; Smedsrud et al., 2013) and ecosystems (Dalpadado et al., 2012, 2014, 2020; Huserbråten et al., 2019; Stige et al., 2019; Gjøsæter et al., 2020). Northward expansion of Atlantic Water has decreased the area of Arctic Water and promoted invasion by boreal species, as documented for plankton (Wassmann and Reigstad, 2011; Orlova et al., 2015; Wassmann et al., 2015; Neukermans et al., 2018; Oziel et al., 2020; Vernet et al., 2020), pelagic and demersal fish (Berge et al., 2015; Fossheim et al., 2015), marine mammals (Hamilton et al., 2019; Moore et al., 2019) and seabirds (Descamps et al., 2017; Vihtakari et al., 2018). The biogeographic process of borealization modifies Arctic biodiversity, community structure, food web organization and ecosystem functioning (Kortsch et al., 2015; Frainer et al., 2017; Pécuchet et al., 2020; Ingvaldsen et al., 2021). The understanding of the importance of changes in the indicator for the rest of the ecosystem is thus rated as good.
Examples of changes which can be considered of ecosystem significance as a result of decline in Arctic Water includes reductions in habitat for Arctic species like e.g., the copepod Calanus glacialis, the amphipod Themisto libellula and polar cod (Dalpadado et al., 2012, 2020; Aarflot et al., 2018; Huserbråten et al., 2019; Stige et al., 2019).
Arctic Water extent decline depend on sea-ice inflow and formation, inflow of Atlantic Water and inflow of Arctic Water formed elsewhere in the Arctic. Improved understanding is needed to address the relative contribution from the three sources on the formation and distribution of Arctic Water.
References
Aarflot, J. M., Skjoldal, H. R., Dalpadado, P., and Skern-Mauritzen, M. 2018. Contribution of Calanus species to the mesozooplankton biomass in the Barents Sea. ICES Journal of Marine Science, 75: 2342-2354.
Berge, J., Heggland, K., Lønne, O. J., Cottier, F., Hop, H., Gabrielsen, G. W., and Misund, O. A. 2015. First Records of Atlantic Mackerel (Scomber scombrus) from the Svalbard Archipelago, Norway, with Possible Explanations for the Extension of Its Distribution. Arctic, 68: 54-61.
Dalpadado, P., Arrigo, K. R., Hjøllo, S. S., Rey, F., Ingvaldsen, R. B., Sperfeld, E., van Dijken, G. L., et al. 2014. Productivity in the Barents Sea - Response to Recent Climate Variability. Plos One, 9.
Dalpadado, P., Arrigo, K. R., van Dijken, G. L., Skjoldal, H. R., Bagøien, E., Dolgov, A., Prokopchuk, I., et al. 2020. Climate effects on temporal and spatial dynamics of phytoplankton and zooplankton in the Barents Sea. Progress in Oceanography, 185: 102320.
Dalpadado, P., Ingvaldsen, R. B., Stige, L. C., Bogstad, B., Knutsen, T., Ottersen, G., and Ellertsen, B. 2012. Climate effects on Barents Sea ecosystem dynamics. ICES Journal of Marine Science, 69: 1303-1316.
Descamps, S., Anker-Nilssen, T., Barrett, R. T., Irons, D. B., Merkel, F., Robertson, G. J., Yoccoz, N. G., et al. 2017. Circumpolar dynamics of a marine top-predator track ocean warming rates. Global Change Biology, 23: 3770-3780.
Fossheim, M., Primicerio, R., Johannesen, E., Ingvaldsen, R. B., Aschan, M. M., and Dolgov, A. V. 2015. Recent warming leads to a rapid borealization of fish communities in the Arctic. Nature Clim. Change, 5: 673-677.
Frainer, A., Primicerio, R., Kortsch, S., Aune, M., Dolgov, A. V., Fossheim, M., and Aschan, M. M. 2017. Climate-driven changes in functional biogeography of Arctic marine fish communities. Proceedings of the National Academy of Sciences, 114: 12202-12207.
Gjøsæter, H., Huserbråten, M., Vikebø, F., and Eriksen, E. 2020. Key processes regulating the early life history of Barents Sea polar cod. Polar Biology.
Hamilton, C. D., Vacquié-Garcia, J., Kovacs, K. M., Ims, R. A., Kohler, J., and Lydersen, C. 2019. Contrasting changes in space use induced by climate change in two Arctic marine mammal species. Biology Letters, 15: 20180834.
Huserbråten, M. B. O., Eriksen, E., Gjøsæter, H., and Vikebø, F. 2019. Polar cod in jeopardy under the retreating Arctic sea ice. Communications Biology, 2: 407.
Ingvaldsen, R. B., Assmann, K. A., Primicerio, R., Fossheim, M., Polyakov, I. V., and Dolgov, R. 2021. Physical manifestations and ecological implications of Arctic Atlantification. Nature Reviews Earth and Environment.
IPCC 2019. IPCC Special Report on the Ocean and Cryosphere in a Changing Climate. Ed. by H.-O. Pörtner, D. C. Roberts, V. Masson-Delmotte, P. Zhai, M. Tignor, E. Poloczanska, K. Mintenbeck, A. Alegría, M. Nicolai, A. Okem, J. Petzold, B. Rama, and N. M. Weyer. Cambridge University Press, Cambridge.
Johannesen, E., Ingvaldsen, R. B., Bogstad, B., Dalpadado, P., Eriksen, E., Gjøsæter, H., Knutsen, T., et al. 2012. Changes in Barents Sea ecosystem state, 1970–2009: climate fluctuations, human impact, and trophic interactions. ICES Journal of Marine Science, 69: 880-889.
Kortsch, S., Primicerio, R., Fossheim, M., Dolgov, A. V., and Aschan, M. 2015. Climate change alters the structure of arctic marine food webs due to poleward shifts of boreal generalists. Proceedings of the Royal Society B-Biological Sciences, 282: 31-39.
Lind, S., and Ingvaldsen, R. 2012. Variability and impacts of Atlantic Water entering the Barents Sea from the north. Deep Sea Research, 62: 70-88.
Lind, S., Ingvaldsen, R. B., and Furevik, T. 2018. Arctic warming hotspot in the northern Barents Sea linked to declining sea-ice import. Nature Climate Change.
Loeng, H. 1991. Features of the physical oceanographic conditions of the Barents Sea. Polar Research, 10: 5-18.
Masson-Delmotte, V., Zhai, P., Pirani, A., Connors, S. L., Péan, C., Berger, S., Caud, N., et al. 2021. Climate Change 2021: The Physical Science Basis. Contribution of Working Group I to the Sixth Assessment Report of the Intergovernmental Panel on Climate Change. Cambridge University Press, Cambridge.
Michalsen, K., Dalpadado, P., Eriksen, E., Gjøsæter, H., Ingvaldsen, R. B., Johannesen, E., Jørgensen, L. L.., et al. 2013. Marine living resources of the Barents Sea – Ecosystem understanding and monitoring in a climate change perspective. Marine Biology Research, 9: 932-947.
Moore, S. E., Haug, T., Víkingsson, G. A., and Stenson, G. B. 2019. Baleen whale ecology in arctic and subarctic seas in an era of rapid habitat alteration. Progress in Oceanography, 176: 102118.
Neukermans, G., Oziel, L., and Babin, M. 2018. Increased intrusion of warming Atlantic water leads to rapid expansion of temperate phytoplankton in the Arctic. Glob Chang Biol, 24: 2545-2553.
Onarheim, I. H., Eldevik, T., Smedsrud, L. H., and Stroeve, J. C. 2018. Seasonal and Regional Manifestation of Arctic Sea Ice Loss. Journal of Climate, 31: 4917-4932.
Orlova, E. L., Dolgov, A. V., Renaud, P. E., Greenacre, M., Halsband, C., and Ivshin, V. A. 2015. Climatic and ecological drivers of euphausiid community structure vary spatially in the Barents Sea: relationships from a long time series (1952–2009). Frontiers in Marine Science, 1.
Oziel, L., Baudena, A., Ardyna, M., Massicotte, P., Randelhoff, A., Sallée, J. B., Ingvaldsen, R. B., et al. 2020. Faster Atlantic currents drive poleward expansion of temperate phytoplankton in the Arctic Ocean. Nature Communications, 11: 1705.
Oziel, L., Sirven, J., and Gascard, J. C. 2016. The Barents Sea frontal zones and water masses variability (1980–2011). Ocean Sci., 12: 169-184.
Pécuchet, L., Blanchet, M.-A., Frainer, A., Husson, B., Jørgensen, L. L.., Kortsch, S., and Primicerio, R. 2020. Novel feeding interactions amplify the impact of species redistribution on an Arctic food web. Global Change Biology.
Smedsrud, L. H., Esau, I., Ingvaldsen, R. B., Eldevik, T., Haugan, P. M., Li, C., Lien, V. S., et al. 2013. The role of the Barents Sea in the Arctic climate system. Reviews of Geophysics, 51: 415-449.
Smedsrud, L. H., Ingvaldsen, R., Nilsen, J. E. Ø., and Skagseth, Ø. 2010. Heat in the Barents Sea: transport, storage, and surface fluxes. Ocean Sci., 6: 219-234.
Stige, L. C., Eriksen, E., Dalpadado, P., and Ono, K. 2019. Direct and indirect effects of sea ice cover on major zooplankton groups and planktivorous fishes in the Barents Sea. ICES Journal of Marine Science, 76: I24-I36.
Vernet, M., Carstensen, J., Reigstad, M., and Svensen, C. 2020. Editorial: Carbon Bridge to the Arctic. Frontiers in Marine Science, 7.
Vihtakari, M., Welcker, J., Moe, B., Chastel, O., Tartu, S., Hop, H., Bech, C., et al. 2018. Black-legged kittiwakes as messengers of Atlantification in the Arctic. Scientific Reports, 8: 1178.
Wassmann, P., Kosobokova, K. N., Slagstad, D., Drinkwater, K. F., Hopcroft, R. R., Moore, S. E., Ellingsen, I., et al. 2015. The contiguous domains of Arctic Ocean advection: Trails of life and death. Progress in Oceanography, 139: 42-65.
Wassmann, P., and Reigstad, M. 2011. Future Arctic Ocean seasonal ice zones and implications for pelagic-benthic coupling. Oceanography 24: 220-231.
Årthun, M., Eldevik, T., Smedsrud, L. H., Skagseth, Ø., and Ingvaldsen, R. B. 2012. Quantifying the Influence of Atlantic Heat on Barents Sea Ice Variability and Retreat. Journal of Climate, 25: 4736-4743.
Freshwater content [AI39]
Phenomenon: Decreasing freshwater content [AP39]
Ecosystem characteristic: Abiotic factors
Under the reference condition, the Arctic part of the Barents Sea is characterised by its freshwater content in the upper part of the water column, approximately in the upper 100 m (Lind et al., 2018). The freshwater content is sustained over several years, but eroded slowly (over years) from vertical mixing with the more saline Atlantic layer below 100 m. The primary source of freshwater input to it comes from import of sea ice to the Barents Sea that melts in summer (Ellingsen et al., 2009; Koenigk et al., 2009; Lind et al., 2018). The freshwater content of the upper 100 m is a key indicator of vertical and temporal stability for the Arctic part because it sets up the stratification between the Arctic layer and the Atlantic layer. The stratification limits vertical mixing, which constitutes a heat flux up to the upper 100 m, as well a salt and nutrient flux (Lind et al., 2016; Randelhoff et al., 2016; Lind et al., 2018). Thus, a high freshwater content contributes to keeping the upper 100 m cool and fresh, thus acting positively to local sea-ice formation in winter (Lind et al., 2018). Quantitative estimates of freshwater content under the reference condition are 2–3.5 m of freshwater mixed into the upper 100 m when using 35.0 (in psu) as reference salinity (Lind et al., 2018; Aaboe et al., 2021).
The most important anthropogenic driver of change in the indicator is climate change from Arctic warming and sea-ice loss in response to global warming, leading to reduced sea-ice import to the Barents Sea due to sea-ice reductions in the Arctic Ocean. I.e., Arctic sea ice is becoming thinner, less concentrated and has reduced extents in summer (Carmack et al., 2015), and sea-ice imports to the Barents Sea has been declining after 2005 (Lind et al., 2018). It is likely that the reductions of sea ice in the areas nearby the Barents Sea have greatest impact on sea-ice inflows to the Barents Sea, and the Eurasian Basin has suffered the largest loss of thicker multiyear ice since the 2000s (Carmack et al., 2015). This very likely largely stems from Arctic amplification of global warming due to anthropogenic CO2 emissions (IPCC, 2019; Masson-Delmotte et al., 2021) and is also likely a part of the Atlantification process occurring in the Barents Sea and further eastwards into the Eurasian Basin (Polyakov et al., 2017; Lind et al., 2018). The understanding of the link between drivers and indicator is rated as certain.
The freshwater content of the upper 100 m signifies how resilient the Arctic-type water column is towards 1) continued vertical mixing with the Atlantic layer and 2) longer time periods (several years) without significant sea-ice import and thus low or absent freshwater input. This impacts the ecosystem directly due to increased vertical mixing giving higher nutrient and heat fluxes upward to the halocline. In the longer run, it means that the whole ecosystem is prone to being changed from an Arctic to an Atlantic climate regime unless the sea-ice import and thus freshwater input recover in time, before the stratification breaks down (Lind et al., 2018). A resilience loss will have net negative consequences for the Arctic species because they are adapted to the stratified, cold and nutrient-poor conditions and suffer from increased competition and predation from boreal species (e.g., Fossheim et al., 2015; Kortsch et al., 2015; Husson et al., 2020; Frainer et al., 2021). Although the full ecosystem impact of resilience loss is unknown, or less understood, the overall understanding of the role of the indicator is that declines in freshwater have negative total impact for the Arctic species. The understanding of the importance of changes in the indicator for the rest of the ecosystem is thus rated as good.
There are knowledge gaps concerning the qualitative understanding of the dynamics related to the phenomenon and regarding potential threshold values for which levels of freshwater content the Arctic-type water column become vulnerable/less resilient, prone to transition to an Atlantic climate regime. There is a knowledge gap as to how easily the stratification may be re-established once it has been lost from an area. This likely depends on how easily the freshwater content is re-established from potential inflowing sea ice and related melt.
References
Aaboe, S., Lind, S., Hendricks, S., Down, E., Lavergne, T., and Ricker, R. 2021. Ch. 4.1 Sea-ice and ocean conditions surprisingly normal in the Svalbard-Barents Sea region after large sea-ice inflows in 2019. In von Schuckmann, K., Le Traon, P. Y., Smith, N., Pascual, A., Djavidnia, S., Gattuso, J. P., and Grégoire, M. (Eds.), Copernicus Marine Service Ocean State Report, Issue 5. Journal of Operational Oceanography, 14: 1-185.
Carmack, E., Polyakov, I., Padman, L., Fer, I., Hunke, E., Hutchings, J., Jackson, J., et al. 2015. Toward Quantifying the Increasing Role of Oceanic Heat in Sea Ice Loss in the New Arctic. Bulletin of the American Meteorological Society, 96: 2079-2105.
Ellingsen, I., Slagstad, D., and Sundfjord, A. 2009. Modification of water masses in the Barents Sea and its coupling to ice dynamics: a model study. Ocean Dynamics, 59: 1095-1108.
Fossheim, M., Primicerio, R., Johannesen, E., Ingvaldsen, R. B., Aschan, M. M., and Dolgov, A. V. 2015. Recent warming leads to a rapid borealization of fish communities in the Arctic. Nature Clim. Change, 5: 673-677.
Frainer, A., Primicerio, R., Dolgov, A., Fossheim, M., Johannesen, E., Lind, S., and Aschan, M. 2021. Increased functional diversity warns of ecological transition in the Arctic. Proceedings of the Royal Society B-Biological Sciences, 288.
Husson, B., Certain, G., Filin, A., and Planque, B. 2020. Suitable habitats of fish species in the Barents Sea. Fisheries Oceanography, 29: 526-540.
IPCC 2019. IPCC Special Report on the Ocean and Cryosphere in a Changing Climate. Ed. by H.-O. Pörtner, D. C. Roberts, V. Masson-Delmotte, P. Zhai, M. Tignor, E. Poloczanska, K. Mintenbeck, A. Alegría, M. Nicolai, A. Okem, J. Petzold, B. Rama, and N. M. Weyer. Cambridge University Press, Cambridge.
Koenigk, T., Mikolajewicz, U., Jungclaus, J. H., and Kroll, A. 2009. Sea ice in the Barents Sea: seasonal to interannual variability and climate feedbacks in a global coupled model. Climate Dynamics, 32: 1119-1138.
Kortsch, S., Primicerio, R., Fossheim, M., Dolgov, A. V., and Aschan, M. 2015. Climate change alters the structure of arctic marine food webs due to poleward shifts of boreal generalists. Proceedings of the Royal Society B-Biological Sciences, 282: 31-39.
Lind, S., Ingvaldsen, R., and Furevik, T. 2016. Arctic layer salinity controls heat loss from deep Atlantic layer in seasonally ice-covered areas of the Barents Sea. Geophysical Research Letters, 43.
Lind, S., Ingvaldsen, R. B., and Furevik, T. 2018. Arctic warming hotspot in the northern Barents Sea linked to declining sea-ice import. Nature Climate Change.
Masson-Delmotte, V., Zhai, P., Pirani, A., Connors, S. L., Péan, C., Berger, S., Caud, N., et al. 2021. Climate Change 2021: The Physical Science Basis. Contribution of Working Group I to the Sixth Assessment Report of the Intergovernmental Panel on Climate Change. Cambridge University Press, Cambridge.
Polyakov, I. V., Pnyushkov, A. V., Alkire, M. B., Ashik, I. M., Baumann, T. M., Carmack, E. C., Goszczko, I., et al. 2017. Greater role for Atlantic inflows on sea-ice loss in the Eurasian Basin of the Arctic Ocean. Science, 356: 285-291.
Randelhoff, A., Fer, I., Sundfjord, A., Tremblay, J.-É., and Reigstad, M. 2016. Vertical fluxes of nitrate in the seasonal nitracline of the Atlantic sector of the Arctic Ocean. Journal of Geophysical Research: Oceans, 121: 5282-5295.
Stratification [AI40]
Phenomenon: Decreasing stratification of the upper water column [AP40]
Ecosystem characteristic: Abiotic factors
Under the reference condition, there is strong stratification of the upper water column in the Arctic part due to input of freshwater from melting sea ice, causing increasing salinity (and thus density) with depth (Aagaard et al., 1981; Loeng, 1991). Data on temperature and salinity exist from 1970 (Johannesen et al., 2012; Michalsen et al., 2013), implying that quantitative information for the indicator exists only for part of the reference condition.
The most important anthropogenic driver of change in the indicator is climate change (IPCC 2019). Anthropogenic global warming leads to sea-ice decline thereby reducing the surface salinity in the Arctic part (Lind et al., 2018), increase the summertime solar heating (Perovich et al., 2008) also beyond the melt season (Timmermans, 2015; Ivanov et al., 2016) and strengthened air-sea-ice fluxes and ventilation (Ivanov et al., 2016; Asbjørnsen et al., 2020; Polyakov et al., 2020a). All of these reduce the stratification in seasonal sea-ice covered areas. Decreasing stratification in the upper water column amplifies the sea-ice loss by increasing the heat fluxes from the warm Atlantic Water at depth (Ivanov et al., 2016; Lind et al., 2016; Polyakov et al., 2020a). Thus, decreasing stratification in the upper water column has profound impacts on Arctic climate. The understanding of the link between driver and change in the indicator is rated as certain.
Stratification of the water column can be considered of ecosystem significance as it strongly affects the local sea-ice formation and melting thereby influencing the sea-ice habitat and associated species (Macias-Fauria and Post, 2018). It also affects the vertical fluxes of new nutrients into the euphotic zone thereby controlling the primary production (Randelhoff et al., 2020). Weaker vertical stratification enhances the vertical fluxes of nutrients (during winter) setting mixed-layer properties, thereby facilitating larger new production (Randelhoff et al., 2020). The understanding of the importance of changes in the indicator for the rest of the ecosystem is thus rated as good.
Sea-ice reduction in winter increases the winter ventilation and thus the mixing of the water column during the cold season (Asbjørnsen et al., 2020; Polyakov et al., 2020b). The understanding of how altered surface fluxes through the year affect the stratification in the Arctic Barents Sea is an important knowledge gap.
References
Aagaard, K., Coachman, L. K., and Carmack, E. 1981. On the halocline of the Arctic Ocean. Deep Sea Res. Deep Sea Research, 28: 529-545.
Asbjørnsen, H., Årthun, M., Skagseth, Ø., and Eldevik, T. 2020. Mechanisms Underlying Recent Arctic Atlantification. Geophysical Research Letters, 47: e2020GL088036.
Ivanov, V., Alexeev, V., Koldunov, N. V., Repina, I., Sandø, A. B., Smedsrud, L. H., and Smirnov, A. 2016. Arctic Ocean Heat Impact on Regional Ice Decay: A Suggested Positive Feedback. Journal of Physical Oceanography, 46: 1437-1456.
Johannesen, E., Ingvaldsen, R. B., Bogstad, B., Dalpadado, P., Eriksen, E., Gjøsæter, H., Knutsen, T., et al. 2012. Changes in Barents Sea ecosystem state, 1970–2009: climate fluctuations, human impact, and trophic interactions. ICES Journal of Marine Science, 69: 880-889.
Lind, S., Ingvaldsen, R., and Furevik, T. 2016. Arctic layer salinity controls heat loss from deep Atlantic layer in seasonally ice-covered areas of the Barents Sea. Geophysical Research Letters, 43.
Lind, S., Ingvaldsen, R. B., and Furevik, T. 2018. Arctic warming hotspot in the northern Barents Sea linked to declining sea-ice import. Nature Climate Change.
Loeng, H. 1991. Features of the physical oceanographic conditions of the Barents Sea. Polar Research, 10: 5-18.
Macias-Fauria, M., and Post, E. 2018. Effects of sea ice on Arctic biota: an emerging crisis discipline. Biology Letters, 14.
Michalsen, K., Dalpadado, P., Eriksen, E., Gjøsæter, H., Ingvaldsen, R. B., Johannesen, E., Jørgensen, L. L.., et al. 2013. Marine living resources of the Barents Sea – Ecosystem understanding and monitoring in a climate change perspective. Marine Biology Research, 9: 932-947.
Perovich, D. K., Richter-Menge, J. A., Jones, K. F., and Light, B. 2008. Sunlight, water, and ice: Extreme Arctic sea ice melt during the summer of 2007. Geophysical Research Letters, 35.
Polyakov, I. V., Alkire, M. B., Bluhm, B. A., Brown, K. A., Carmack, E. C., Chierici, M., Danielson, S. L., et al. 2020a. Borealization of the Arctic Ocean in Response to Anomalous Advection From Sub-Arctic Seas. Frontiers in Marine Science, 7.
Polyakov, I. V., Rippeth, T. P., Fer, I., Alkire, M. B., Baumann, T. M., Carmack, E. C., Ingvaldsen, R., et al. 2020b. Weakening of Cold Halocline Layer Exposes Sea Ice to Oceanic Heat in the Eastern Arctic Ocean. Journal of Climate, 33: 8107-8123.
Randelhoff, A., Holding, J., Janout, M., Sejr, M. K., Babin, M., Tremblay, J.-É., and Alkire, M. B. 2020. Pan-Arctic Ocean Primary Production Constrained by Turbulent Nitrate Fluxes. Frontiers in Marine Science, 7.
Timmermans, M.-L. 2015. The impact of stored solar heat on Arctic sea ice growth. Geophysical Research Letters, 42: 6399-6406.
pH [AI41]
Phenomenon: Decreasing pH [AP41]
Ecosystem characteristic: Abiotic factors
Under the reference condition, the water column is basic with a surface pH of about 8.
The most important anthropogenic driver of change in the indicator is climate change. Ocean uptake of excess atmospheric CO2 caused by human activities, such as fossil fuel burning, and industrialization, has increased ocean CO2 over a relatively short time period. Since 1750, the pH has decreased by about 0.1 units, corresponding to a 30% increase of hydrogen ions (less basic ocean). Currently, observations show a continued pH decrease of 0.02 per decade (Copernicus Marine Services, 2021). Continued pH decrease is rated as highly likely (IPCC, 2019). The understanding of the link between driver and change in the indicator is rated as certain.
Altered pH may directly affect the internal cellular processes in marine organisms, such as the ion pump and other redox reactions. pH may also change the availability and toxicity of vital metals, potentially changing the biological production. Also, increased pCO2 may lead to hypercapnia in fish if exceeding levels 1000 ppm (McNeil and Sasse, 2016). However, the current understanding of the effect of reduced pH on ecosystems, is mainly based on acute, short term-experiments and ecosystem modelling (Browman, 2016). Hence the understanding of the importance of changes in the indicator for the ecosystem is rated as less good.
There are large knowledge gaps on the effect of reduced pH on organisms and marine ecosystems. The effects need to be related to studies of adaptive capacity and should include multi-stressors. This also requires multi-disciplinary observational long-term data sets in relevant areas (Browman, 2016).
References
Browman, H. I. 2016. Applying organized scepticism to ocean acidification research Introduction. ICES Journal of Marine Science, 73: 529-536.
Copernicus Marine Services 2021. Copernicus Marine Services.
IPCC 2019. IPCC Special Report on the Ocean and Cryosphere in a Changing Climate. Ed. by H.-O. Pörtner, D. C. Roberts, V. Masson-Delmotte, P. Zhai, M. Tignor, E. Poloczanska, K. Mintenbeck, A. Alegría, M. Nicolai, A. Okem, J. Petzold, B. Rama, and N. M. Weyer. Cambridge University Press, Cambridge.
McNeil, B. I., and Sasse, T. P. 2016. Future ocean hypercapnia driven by anthropogenic amplification of the natural CO2 cycle. Nature, 529: 383-386.
Aragonite saturation [AI42]
Phenomenon: Decreasing aragonite saturation [AP42]
Ecosystem characteristic: Abiotic factors
Under the reference condition, aragonite saturation sufficient for calcifying organisms to occur with biomasses high enough to sustain Arctic and Sub-Arctic food webs and ecological processes characterizing Arctic and Sub-Arctic ecosystems.
The most important anthropogenic driver of change in the indicator is climate change. Ocean uptake of excess atmospheric CO2 caused by human activities, such as fossil fuel burning and industrialization, is causing ocean CO2 to increase. The ocean carbonate ion concentration (CO32-) is driving the aragonite saturation (ΩAr) and the chemical dissolution of the aragonite. Decreasing pH (increasing ocean CO2) has resulted in decreasing saturation state with regard to calcium carbonate (CaCO3), with consequences for the dissolution potential and calcification process. Aragonite is the most labile form of CaCO3 in the ocean and the Arctic Ocean already has the lowest ΩAr compared to the world oceans (e.g. (Chierici and Fransson, 2009)). Continued decrease of Ω is expected is rated highly likely (IPCC, 2019). The understanding of the link between driver and change in the indicator is thus rated as certain.
The lowering of CaCO3 saturation states (Ω), impacts shell-forming marine organisms from plankton to benthic molluscs, echinoderms, and corals. Many calcifying species exhibit reduced calcification and growth rates in laboratory experiments under high-CO2 conditions (e.g., Kroeker et al., 2013; Manno et al., 2017). Another consequence is also the shoaling of aragonite saturation horizon (ΩAr<1, i.e., dissolution of aragonite) which will continue and has consequences for cold-water corals and their ability to withstand erosion and continue to grow (ICES, 2014; AMAP, 2018). At Ω<1 more energy is required to build CaCO3 (e.g., Comeau et al., 2013). Climate change, such as warming, enhances the effect of low saturation states. However, the current understanding of the effect of Ω in the ecosystem is mainly based on acute, short term-experiments and ecosystem modelling (Browman, 2016). There are ocean observations, especially in upwelling sites and other low-aragonite areas that show clear evidence of shell deformation on shelled butterfly snails, crabs and mussels. This has been observed in the Pacific Arctic also where saturation states are lowest (Cross et al., 2018; Bednaršek et al., 2021; Niemi et al., 2021). Although this implies that the knowledge on the effect on calcifying organisms is good, the overall understanding of the importance of changes in the indicator for the ecosystem is rated as less good.
There are large knowledge gaps about the thresholds and adaptive capacity to perform calcification at low saturation states. Amplification and occurrence of corrosive events have been observed in the Arctic Ocean. However, the effects on the marine ecosystem are little understood. The effects need to be related to studies of adaptive capacity and should include multi-stressors (Rastrick et al., 2018). This also requires multi-disciplinary observational long-term data sets in relevant areas.
References
AMAP. 2018. AMAP Assessment 2018: Arctic Ocean Acidification. Arctic Monitoring and Assessment Programme (AMAP). vi+187pp pp.
Bednaršek, N., Calosi, P., Feely, R. A., Ambrose, R., Byrne, M., Chan, K. Y. K., Dupont, S., et al. 2021. Synthesis of Thresholds of Ocean Acidification Impacts on Echinoderms. Frontiers in Marine Science, 8.
Browman, H. I. 2016. Applying organized scepticism to ocean acidification research Introduction. ICES Journal of Marine Science, 73: 529-536.
Chierici, M., and Fransson, A. 2009. Calcium carbonate saturation in the surface water of the Arctic Ocean: undersaturation in freshwater influenced shelves. Biogeosciences, 6: 2421-2431.
Comeau, S., Carpenter, R. C., and Edmunds, P. J. 2013. Coral reef calcifiers buffer their response to ocean acidification using both bicarbonate and carbonate. Proceedings of the Royal Society B: Biological Sciences, 280: 20122374.
Cross, J., Mathis, J., Pickart, R., and Bates, N. 2018. Formation and transport of corrosive water in the Pacific Arctic region. Deep Sea Research Part II, 152.
ICES. 2014. Final Report to OSPAR of the Joint OSPAR/ICES Ocean Acidification Study Group (SGOA). ICES CM 2014/ACOM:67. 141 pp.
IPCC 2019. IPCC Special Report on the Ocean and Cryosphere in a Changing Climate. Ed. by H.-O. Pörtner, D. C. Roberts, V. Masson-Delmotte, P. Zhai, M. Tignor, E. Poloczanska, K. Mintenbeck, A. Alegría, M. Nicolai, A. Okem, J. Petzold, B. Rama, and N. M. Weyer. Cambridge University Press, Cambridge.
Kroeker, K. J., Kordas, R. L., Crim, R., Hendriks, I. E., Ramajo, L., Singh, G. S., Duarte, C. M., et al. 2013. Impacts of ocean acidification on marine organisms: quantifying sensitivities and interaction with warming. Global Change Biology, 19: 1884-1896.
Manno, C., Bednaršek, N., Tarling, G. A., Peck, V. L., Comeau, S., Adhikari, D., Bakker, D. C. E., et al. 2017. Shelled pteropods in peril: Assessing vulnerability in a high CO2 ocean. Earth-Science Reviews, 169: 132-145.
Niemi, A., Bednaršek, N., Michel, C., Feely, R. A., Williams, W., Azetsu-Scott, K., Walkusz, W., et al. 2021. Biological Impact of Ocean Acidification in the Canadian Arctic: Widespread Severe Pteropod Shell Dissolution in Amundsen Gulf. Frontiers in Marine Science, 8.
Rastrick, S. S. P., Graham, H., Azetsu-Scott, K., Calosi, P., Chierici, M., Fransson, A., Hop, H., et al. 2018. Using natural analogues to investigate the effects of climate change and ocean acidification on Northern ecosystems. ICES Journal of Marine Science, 75: 2299-2311.
5.2 Scientific evidence base for the phenomena in the Sub-Arctic Barents Sea
Annual primary productivity [SI01]
Phenomenon: Stable and later decreasing annual primary productivity [SP01]
Ecosystem characteristic: Primary productivity, Biomass distribution among trophic levels
Under the reference condition, primary production in the Sub-Arctic part of the Barents Sea is contributed by phytoplankton. Under the reference condition, there is a weak, but significant, stratification during summer in the upper water column of the Sub-Arctic, in part due to solar heating of the surface layer and input of freshwater from rivers (Loeng, 1991; Hordoir et al., 2022). The spring bloom can start when the upper water column stabilised through stratification and irradiance is high enough, typically in May-June (Sakshaug et al., 2009). Links found with variation in climate during the recent decades suggest that natural variation in key climatic parameters, such as temperature in advected waters, would have similar effects on primary production under the reference condition.
The most important anthropogenic driver of change in the indicator is climate change. Upper water column stratification in the Sub-Arctic part in summer and autumn is created by increasing temperatures and decreasing salinity (and thus density) toward the surface. Anthropogenic global warming leads to surface warming as well as freshening due to increased precipitation (Drinkwater et al., 2021). This causes a strengthening of the stratification and a shallower mixed-layer depth in summer (Hordoir et al., 2022). Stratification of the water column affects the vertical fluxes of new nutrients into the euphotic zone, thereby controlling new production (Randelhoff et al., 2020). Stronger vertical stratification decreases the vertical fluxes of nutrients into the surface mixed layer, and a shallower mixed layer decreases the inventory of nutrients available for primary production. Observed declining trends in phytoplankton concentrations have been linked to increased stratification (Boyce et al., 2010). A stronger stratification in Sub-Arctic parts is expected to decrease primary production (Drinkwater et al., 2021), although biogeochemical models differ when predicting future changes in primary production (Skaret et al., 2014; Slagstad et al., 2015; Skogen et al., 2018; Sandø et al., 2021). Also, for the North Atlantic sub-tropical gyre it has been shown that the upper-ocean stratification is at best weakly related to primary production on an interannual scale, pointing to a weaker effect of increased stratification (Lozier et al., 2011). Given this and the uncertainties indicated from the differences in model predictions, the understanding of the link between the driver (climate change) and change in the indicator is rated as less certain.
Both models and observations show that primary production is generally positively related to fisheries yield (Iverson, 1990; Ware and Thomson, 2005; Chassot et al., 2007; Chassot et al., 2010), thus providing strong evidence that changes in primary production have substantial impacts on other parts of marine ecosystems. The understanding of the importance of changes in the indicator for the rest of the ecosystem is thus rated as good.
Specific levels of increase in primary production are hard to relate to specific ecosystem changes.
Knowledge gaps include a need for more in situ measurements and measurements of the ratio of new to regenerated production. It also includes a need for more information on changes in phytoplankton bloom phenology and the impact of changes in phytoplankton species composition on annual primary production and trophic transfer as well as high spatial resolution models with high-quality atmospheric forcing.
References
Boyce, D. G., Lewis, M. R., and Worm, B. 2010. Global phytoplankton decline over the past century. Nature, 466: 591-596.
Drinkwater, K. F., Harada, N., Nishino, S., Chierici, M., Danielson, S. L., Ingvaldsen, R. B., Kristiansen, T., et al. 2021. Possible future scenarios for two major Arctic Gateways connecting Subarctic and Arctic marine systems: I. Climate and physical–chemical oceanography. ICES Journal of Marine Science.
Hordoir, R., Skagseth, Ø., Ingvaldsen, R. B., Sandø, A. B., Löptien, U., Dietze, H., Gierisch, A. M. U., et al. 2022. Changes in Arctic Stratification and Mixed Layer 1 Depth Cycle, A Modeling Analysis. Journal of Geophysical Research. https://doi.org/10.1029/2021JC017270
Loeng, H. 1991. Features of the physical oceanographic conditions of the Barents Sea. Polar Research, 10: 5-18.
Lozier, M. S., Dave, A. C., Palter, J. B., Gerber, L. M., and Barber, R. T. 2011. On the relationship between stratification and primary productivity in the North Atlantic. Geophysical Research Letters, 38.
Randelhoff, A., Holding, J., Janout, M., Sejr, M. K., Babin, M., Tremblay, J.-É., and Alkire, M. B. 2020. Pan-Arctic Ocean Primary Production Constrained by Turbulent Nitrate Fluxes. Frontiers in Marine Science, 7.
Sakshaug, E., Johnsen, G., Kristiansen, S., von Quillfeldt, C., Rey, F., Slagstad, D., and Thingstad, F. 2009. 7. Phyotplankton and primary production. In Ecosystem Baremts Sea, pp. 167-208. Ed. by E. Sakshaug, G. Johnsen, and K. Kovacs. Tapir Academic Press, Trondheim, Norway.
Sandø, A. B., Mousing, E. A., Budgell, W. P., Hjøllo, S. S., Skogen, M. D., and Ådlandsvik, B. 2021. Barents Sea plankton production and controlling factors in a fluctuating climate. ICES Journal of Marine Science, 78: 1999-2016.
Skaret, G., Dalpadado, P., Hjøllo, S. S., Skogen, M. D., and Strand, E. 2014. Calanus finmarchicus abundance, production and population dynamics in the Barents Sea in a future climate. Progress in Oceanography, 125: 26-39.
Skogen, M. D., Hjøllo, S. S., Sandø, A. B., and Tjiputra, J. 2018. Future ecosystem changes in the Northeast Atlantic: a comparison between a global and a regional model system. ICES Journal of Marine Science, 75: 2355-2369.
Slagstad, D., Wassmann, P. F. J., and Ellingsen, I. 2015. Physical constrains and productivity in the future Arctic Ocean. Frontiers in Marine Science, 2.
Timing of spring bloom [SI02]
Phenomenon: Earlier start of the spring bloom [SP02]
Ecosystem characteristic: Primary productivity
The description of the indicator under the reference condition is as given for the phenomenon for annual net primary productivity [SI01].
The most important anthropogenic driver of change in the indicator is climate change. Increased thermal stratification, caused by increased temperature, and changed storms tracks, may cause the spring bloom to start earlier, but satellite observations do not indicate pronounced changes and variability in spring-bloom timing for the open water part of the Barents Sea (Oziel et al., 2017; Dalpadado et al., 2020). The current understanding of the link between climate change and changes in the indicator is rated as less certain.
Altered timing of the spring bloom may result in mismatches between phytoplankton and zooplankton grazers, which may affect zooplankton production and other parts of the ecosystem. However, little is known about this for the Sub-Arctic part of the Barents Sea or other Sub-Arctic systems. The understanding of the importance of changes in the indicator for the rest of the ecosystem is thus rated as less good.
Too little is known about the relationship between magnitude of spring bloom timing shift and effects on the ecosystem to evaluate how large changes should be for effects with ecosystem significance to occur.
Knowledge gaps include a need for more in situ measurements, as well as high spatial resolution models and better remote sensing data
References
Dalpadado, P., Arrigo, K. R., van Dijken, G. L., Skjoldal, H. R., Bagøien, E., Dolgov, A., Prokopchuk, I., et al. 2020. Climate effects on temporal and spatial dynamics of phytoplankton and zooplankton in the Barents Sea. Progress in Oceanography, 185: 102320.
Hordoir, R., Skagseth, Ø., Ingvaldsen, R. B., Sandø, A. B., Löptien, U., Dietze, H., Gierisch, A. M. U., et al. In prep. Changes in Arctic Stratification and Mixed Layer 1 Depth Cycle, A Modeling Analysis. Journal of Geophysical Research.
Loeng, H. 1991. Features of the physical oceanographic conditions of the Barents Sea. Polar Research, 10: 5-18.
Oziel, L., Neukermans, G., Ardyna, M., Lancelot, C., Tison, J.-L., Wassmann, P., Sirven, J., et al. 2017. Role for Atlantic inflows and sea ice loss on shifting phytoplankton blooms in the Barents Sea. Journal of Geophysical Research: Oceans, 122: 5121-5139.
Sakshaug, E., Johnsen, G., Kristiansen, S., von Quillfeldt, C., Rey, F., Slagstad, D., and Thingstad, F. 2009. 7. Phyotplankton and primary production. In Ecosystem Baremts Sea, pp. 167-208. Ed. by E. Sakshaug, G. Johnsen, and K. Kovacs. Tapir Academic Press, Trondheim, Norway.
Zooplankton TL < 2.5 [SI03]
Phenomenon: Decreasing biomass of zooplankton that is predominantly herbivorous [SP03]
Ecosystem characteristic: Biomass distribution among trophic levels
Under the reference condition, the biomass and turnover of herbivorous zooplankton is large enough to support populations of a variety of predators in the Sub-Arctic part of the Barents Sea, including pelagic fish such as capelin and herring (Clupea harengus), 0-group of both demersal and pelagic fish, carnivorous zooplankton such as the krill species Meganyctiphanes norvegica, and harp seals (Pagophilus groenlandicus) (Sakshaug et al., 1994; Haug et al., 2011; Planque et al., 2014; Eriksen et al., 2020). Copepod mesozooplankton is dominating, particularly Calanus finmarchicus, as well as the herbivorous krill Thysanoessa inermis (Dalpadado and Skjoldal, 1991, 1996; Eriksen et al., 2017; Aarflot et al., 2018; Dalpadado et al., 2020). A significant fraction of the mesozooplankton community in the northern regions of the Sub-Arctic part of the Barents Sea is made up of Arctic species under the reference condition, in particular Calanus glacialis and Calanus hyperboreus, although the Atlantic C. finmarchicus dominates in all parts of the Sub-Arctic regions (Aarflot et al., 2018).
The most important anthropogenic driver of change in this indicator is climate change, such as increased inflow of Atlantic Water, increased water temperatures and changes in bloom phenology, making the Sub-Arctic Barents Sea more favourable for Atlantic boreal zooplankton species that are extending their distribution into the Sub-Arctic areas while at the same time some of the larger, more Arctic species in the northern areas of the Sub-Arctic are decreasing in abundance (Eriksen et al., 2017; Dalpadado et al., 2020). Generally, we can expect similar changes in the zooplankton community in the Sub-Arctic part of the Barents Sea as observed further south in the North Sea, the shelf ecosystem adjacent to the Barents Sea, during the warming in the 1980-90s. The community in the North Sea before the warming in the 1980s was dominated by Calanus finmarchicus, but surface water warming could be related to a biogeographical shift in calanoid copepods assemblages with an increase in warm-water species (such as C. helgolandicus) and a decrease in boreal species (such as C. finmarchicus) as well as Arctic species residing in boreal areas (e.g. C. glacialis in Norwegian fjords) (Beaugrand, 2004; Helaouët and Beaugrand, 2007; Beaugrand et al., 2014; Hinder et al., 2014). Further northwards shift of C. helgolandicus towards the Sub-Arctic Barents Sea may be possible. Likely is also a shift in life history strategies in C. finmarchicus and C. glacialis, which tend to be smaller with higher turnover further south. Southern species such as C. helgolandicus often have shorter life cycles and may produce multiple generations per year, whereas C. finmarchicus in the Norwegian Sea may enter diapause earlier, in June-July (Bandara et al., 2021). With warming, earlier onset of spring bloom and more common occurrences of autumn blooms in the Sub-Arctic Barents Sea, we can expect that boreal species such as C. finmarchicus are able to develop faster and may even have a second generation in the autumn of the year. There are large uncertainties associated with what the overall effect on zooplankton biomass could be. A northward shift in larger Arctic spring spawning mesozooplankton and an increase in occurrence of small species such as Calanus helgolandicus may cause reductions zooplankton biomass in some areas. However, increased primary production and faster turnover in secondary producers will likely result in higher copepod biomass under a climate warming scenario in the Sub-Arctic Barents Sea. The annual mean production of Calanus finmarchicus will increase 23% in a 50-year future scenario, mostly in the southern and western area of the Barents Sea (Skaret et al., 2014; Renaud et al., 2018). Boreal krill species are more omnivorous/carnivorous than Sub-Arctic species (Falk-Petersen, 1981) meaning that the relative contribution of herbivorous krill may change as biomass of boreal species, e.g., Meganyctiphanes norvegica, is increasing, although the exact nature of this is hard to anticipate as the process will depend on trajectories of change of individual krill species. Given the uncertainties highlighted here, the understanding of the link between driver and indicator should be rated as less certain.
A s herbivorous species are efficient in transforming algae diet into high energy lipids, a reduction in herbivorous biomass could potentially lead to reduced food quality and/or energy content in the food web. However, there are uncertainties associated with this, and increased turn-over rates may compensate for decrease in individual biomass. Our understanding of the importance of changes in the indicator for other parts of the ecosystem should thus be rated as less good.
An example of a change that would be of ecosystem significance, is a decline in herbivore zooplankton biomass accompanied by an increase in carnivore zooplankton biomass, which, as described above, could profoundly alter energy flow in the ecosystem.
Knowledge gaps include lack of data on response of C. finmarchicus to warming and upper limit of warming it can cope with; and lack of data on ability of boreal species such as C. helgolandicus to establish themselves at high latitudes. It may be noted that the upper thermal limit for boreal zooplankton is probably rather high, so more influential will be changes in water masses and distribution ranges of more southern species.
References
Bandara, K., Varpe, Ø., Maps, F., Ji, R., Eiane, K., and Tverberg, V. 2021. Timing of Calanus finmarchicus diapause in stochastic environments. Ecological Modelling, 460: 109739.
Beaugrand, G. 2004. The North Sea regime shift: evidence, causes, mechanisms and consequences. Progress in Oceanography, 60: 245-262.
Beaugrand, G., Harlay, X., and Edwards, M. 2014. Detecting plankton shifts in the North Sea: a new abrupt ecosystem shift between 1996 and 2003. Marine Ecology Progress Series, 502: 85-104.
Dalpadado, P., Arrigo, K. R., van Dijken, G. L., Skjoldal, H. R., Bagøien, E., Dolgov, A., Prokopchuk, I., et al. 2020. Climate effects on temporal and spatial dynamics of phytoplankton and zooplankton in the Barents Sea. Progress in Oceanography, 185: 102320.
Dalpadado, P., and Skjoldal, H. R. 1991. Distribution and life-history of krill from the Barents Sea. Polar Research, 10: 443-460.
Dalpadado, P., and Skjoldal, H. R. 1996. Abundance, maturity and growth of the krill species Thysanoessa inermis and T. longicaudata in the Barents Sea. Marine Ecology Progress Series, 144: 175-183.
Eriksen, E., Benzik, A. N., Dolgov, A. V., Skjoldal, H. R., Vihtakari, M., Johannesen, E., Prokhorova, T. A., et al. 2020. Diet and trophic structure of fishes in the Barents Sea: The Norwegian-Russian program “Year of stomachs” 2015 – Establishing a baseline. Progress in Oceanography, 183: 102262.
Eriksen, E., Skjoldal, H. R., Gjøsæter, H., and Primicerio, R. 2017. Spatial and temporal changes in the Barents Sea pelagic compartment during the recent warming. Progress in Oceanography, 151: 206-226.
Falk-Petersen, S. 1981. Ecological investigations of the zooplankton community of Balsfjorden, Northern Norway - Seasonal changes in body weight and the main biohemical composition of Thysanoessa inermis (Kroyer), Thysanoessa raschii (M. Sars), and Meganyctiphanes norvegica (M. Sars) in relation to environmental factors. Journal of Experimental Marine Biology and Ecology, 49: 103-120.
Haug, T., Skren-Mauritzen, M., and Lindstrøm, U. 2011. Predation by marine mammals. In The Barents Sea: Ecosystem, Resources, Management: Half a century of Russian-Norwegian Cooperation, pp. 485-494. Ed. by T. Jakobsen, and V. K. Ozhigin. Tapir Academic Press, Trondheim, Norway.
Helaouët, P., and Beaugrand, G. 2007. Macroecology of Calanus finmarchicus and C. helgolandicus in the North Atlantic Ocean and adjacent seas. Marine Ecology Progress Series, 345: 147-165.
Hinder, S. L., Gravenor, M. B., Edwards, M., Ostle, C., Bodger, O. G., Lee, P. L. M., Walne, A. W., et al. 2014. Multi-decadal range changes vs. thermal adaptation for north east Atlantic oceanic copepods in the face of climate change. Global Change Biology, 20: 140-146.
Planque, B., Primicerio, R., Michalsen, K., Aschan, M., Certain, G., Dalpadado, P., Gjøsæter, H., et al. 2014. Who eats whom in the Barents Sea: a food web topology from plankton to whales. Ecology, 95: 1430-1430.
Renaud, P. E., Daase, M., Banas, N. S., Gabrielsen, T. M., Soreide, J. E., Varpe, O., Cottier, F., et al. 2018. Pelagic food-webs in a changing Arctic: a trait-based perspective suggests a mode of resilience. ICES Journal of Marine Science, 75: 1871-1881.
Sakshaug, E., Bjørge, A., Gulliksen, B., Loeng, H., and Mehlum, F. 1994. Structure, biomass distribution, and energetics of the pelagic ecosystem in the Barents Sea: A synopsis. Polar Biology, 14: 405-411.
Skaret, G., Dalpadado, P., Hjøllo, S. S., Skogen, M. D., and Strand, E. 2014. Calanus finmarchicus abundance, production and population dynamics in the Barents Sea in a future climate. Progress in Oceanography, 125: 26-39.
Aarflot, J. M., Skjoldal, H. R., Dalpadado, P., and Skern-Mauritzen, M. 2018. Contribution of Calanus species to the mesozooplankton biomass in the Barents Sea. ICES Journal of Marine Science, 75: 2342-2354.
Zooplankton TL > 2.5 [SI04]
Phenomenon: Increasing biomass of zooplankton that is predominantly carnivorous [SP04]
Ecosystem characteristic: Biomass distribution among trophic levels
Under the reference condition, carnivorous zooplankton community in the Sub-Arctic part of the Barents Sea is likely dominated by chaetognaths, gelatinous species and carnivorous copepods and amphipods.
The most important anthropogenic driver of change in this indicator is likely climate change, with increasing temperature, less ice and reduced areas of Arctic Water as the important factors. The zooplankton community will likely develop towards what is seen further south. The omnivorous/carnivorous krill species Thysanoessa longicaudata and Meganyctiphanes norvegica are widely distributed in the Nordic Seas, while larger pelagic amphipods are less abundant (Dalpadado et al., 1998). Gelatinous species may also become more abundant, particularly large medusas, such as the Lion’s mane jellyfish (Cyanea capillata) (Lynam et al., 2005). A northward expansion of these species may contribute to an increase in biomass of carnivorous zooplankton, although if gelatinous species increase to large densities, they can cause reductions in prey biomass. Given the uncertainties described here the knowledge about link between driver and indicator should be rated as less certain.
Although it is reasonable to assume that an increase in the biomass of carnivorous zooplankton in the Sub-Arctic part of the Barents Sea will have effects on at least parts of the ecosystem, such effects cannot be reasonably predicted. Increased biomass of macrozooplankton could benefit predatory fishes, seabirds and marine mammal species (Haug et al., 2007; Planque et al., 2014; Eriksen et al., 2020). Given these uncertainties, the understanding of the importance of changes in the indicator for other parts of the ecosystem is rated as less good.
The uncertainties also mean that examples of changes that can be of ecosystem significance are hard to determine with a reasonable degree of confidence.
Knowledge gaps: Lack of long-term data, particularly on gelatinous taxa; gelatinous taxa are generally poorly studied, and we have poor knowledge of life-history strategies, species interactions, ecophysiology and productivity hampering our ability to predict how they will cope with environmental changes such as changes in temperature and predators-prey field. In addition, there is lack of species-specific krill data, which could be used to correctly identify herbivorous and carnivorous krill biomass.
References
Dalpadado, P., Ellertsen, B., Melle, W., and Skjoldal, H. R. 1998. Summer distribution patterns and biomass estimates of macrozooplankton and micronekton in the Nordic Seas. Sarsia, 83: 103-116.
Eriksen, E., Benzik, A. N., Dolgov, A. V., Skjoldal, H. R., Vihtakari, M., Johannesen, E., Prokhorova, T. A., et al. 2020. Diet and trophic structure of fishes in the Barents Sea: The Norwegian-Russian program “Year of stomachs” 2015 – Establishing a baseline. Progress in Oceanography, 183: 102262.
Haug, T., Nilssen, K. T., Lindblom, L., and Lindstrøm, U. 2007. Diets of hooded seals (Cystophora cristata) in coastal waters and drift ice waters along the east coast of Greenland. Marine Biology Research, 3: 123-133.
Lynam, C. P., Hay, S. J., and Brierley, A. S. 2005. Jellyfish abundance and climatic variation: contrasting responses in oceanographically distinct regions of the North Sea, and possible implications for fisheries. Journal of the Marine Biological Association of the United Kingdom, 85: 435-450.
Planque, B., Primicerio, R., Michalsen, K., Aschan, M., Certain, G., Dalpadado, P., Gjøsæter, H., et al. 2014. Who eats whom in the Barents Sea: a food web topology from plankton to whales. Ecology, 95: 1430-1430.
Benthic suspensivores [SI05]
Phenomenon: Change in biomass of suspension feeding species [SP05]
Ecosystem characteristic: Biomass distribution among trophic levels
No description of the state of the indicator under reference conditions can be done.
The most important anthropogenic driver of change in this indicator may be climate change, which can directly and indirectly affect the phenology, quality, and quantity of phytodetritus reaching the seafloor. This is expected to occur due to changes in light climate because of altered ice cover (extent, thickness, seasonality). For instance, the production of coastal Arctic benthos is tightly linked to surface primary production and ice cover (Tremblay et al., 2011). Trawling will likely also lead to this phenomenon (Jørgensen et al., 2015, 2019), as it would tend to reduce the biomass of generally tall animals, more easily captured by the bottom trawls. In addition, potentially increased importance of advection/establishment of more southern phytoplankton taxa and/or elevated grazing by zooplankton may result in possibly lower likelihood of phytodetritus reaching the seafloor. The link to trawling needs to be verified through testing existing data and for now is moderately certain. The role of climatic change here is less certain. The overall knowledge of the link of the indicator to the driver is thus less certain.
Suspension-feeding benthos such as sponges, bryozoans, hydroids, some sea cucumbers, and other species make up local large biomass of the seabed fauna (Kędra et al., 2013). Epibenthos plays a major role in the carbon cycling of the Arctic ecosystems (Grebmeier et al., 1995; Klages et al., 2004), thus suspension feeders may be central for the functioning in the ecosystem. Such local biomass accumulations with complex, large bodied species may be refuge and feeding areas for fish and other benthic invertebrates (Kędra et al., 2015). The understanding of the importance for the rest of the ecosystem of decreasing proportion of suspension feeding biomass is good.
The ecosystem significance of decreasing proportion of suspension feeding biomass has not been verified for the Barents Sea, but the effect of structure-forming corals and sponges and their use as fish habitat have been described for the Bering Sea submarine canyons (Miller et al., 2012), and effects on fish habitat and general support of higher biodiversity are expected to be similar for Norwegian cold-water coral habitats.
Knowledge gaps that require further research include better insights into the functional importance of suspension feeders in the ecosystem and their sensitivity to climate change.
References
Grebmeier, J. M., Smith Jr., W. O., and Conover, R. J. 1995. Biological Processes on Arctic Continental Shelves: Ice-Ocean-Biotic Interactions. In Arctic Oceanography: Marginal Ice Zones and Continental Shelves, pp. 231–261. American Geophysical Union (AGU). https://onlinelibrary.wiley.com/doi/abs/10.1029/CE049p0231 (Accessed 9 November 2021).
Jørgensen, L. L.., Ljubin, P., Skjoldal, H. R., Ingvaldsen, R. B., Anisimova, N., and Manushin, I. 2015. Distribution of benthic megafauna in the Barents Sea: baseline for an ecosystem approach to management. ICES Journal of Marine Science, 72: 595–613.
Jørgensen, L. L.., Primicerio, R., Ingvaldsen, R. B., Fossheim, M., Strelkova, N., Thangstad, T. H., Manushin, I., et al. 2019. Impact of multiple stressors on sea bed fauna in a warming Arctic. Marine Ecology Progress Series, 608: 1–12.
Kędra, M., Renaud, P. E., Andrade, H., Goszczko, I., and Ambrose Jr, W. G. 2013. Benthic community structure, diversity, and productivity in the shallow Barents Sea bank (Svalbard Bank). Marine Biology, 160: 805–819.
Kędra, M., Moritz, C., Choy, E. S., David, C., Degen, R., Duerksen, S., Ellingsen, I., et al. 2015. Status and trends in the structure of Arctic benthic food webs. Polar Research, 34: 23775. Routledge.
Klages, M., Boetius, A., Christensen, J. P., Deubel, H., Piepenburg, D., Schewe, I., and Soltwedel, T. 2004. The Benthos of Arctic Seas and its Role for the Organic Carbon Cycle at the Seafloor. The Organic Carbon Cycle in the Arctic Ocean: 139–167. Springer, Berlin, Heidelberg.
Miller, R. J., Hocevar, J., Stone, R. P., and Fedorov, D. V. 2012. Structure-Forming Corals and Sponges and Their Use as Fish Habitat in Bering Sea Submarine Canyons. PLOS ONE, 7: e33885. Public Library of Science.
Tremblay, J.-É., Bélanger, S., Barber, D. G., Asplin, M., Martin, J., Darnis, G., Fortier, L., et al. 2011. Climate forcing multiplies biological productivity in the coastal Arctic Ocean. Geophysical Research Letters, 38. https://onlinelibrary.wiley.com/doi/abs/10.1029/2011GL048825 (Accessed 9 November 2021).
0 group fish [SI06]
Phenomenon: Increasing biomass of 0-group fish [SP06]
Ecosystem characteristic: Biomass distribution among trophic levels
Under the reference condition, the biomass of 0-group fish is large enough to support predator populations dependent on these fish larvae as prey, and also large enough to ensure sufficiently high recruitment to sustain the fish stocks themselves.
The most important anthropogenic drivers of change for this indicator in the Sub-Arctic part of the Barents Sea are i) climate change, through direct effects on their distribution and abundance, and ii) fisheries, through indirect effects on spawning stocks size and structure, and thus recruitment and 0-group abundance. Climate change is expected to be the main driver of 0-group biomass, and growth and survival of cod, haddock and herring juveniles has been shown to covary with interannual environmental variability (Ottersen and Loeng, 2000). Their core area of distribution has been shown to expand during warm years (Eriksen et al., 2011). However, positive relationships between temperature and recruitment of cod, haddock and herring have weakened since the 2000s (Eriksen et al., 2012). Links between variation in climate and fish recruitment have been explored, but so far evidence is weak for species in the Barents Sea (e.g. Garcia et al., 2021). It is thus uncertain how climate is going to affect 0-group biomass, although most of the southern 0-group stocks (haddock, herring) seem positively impacted by increasing temperatures. Fisheries strongly affect the spawning stock biomass and the size structure of the exploited stock. It is thus quite certain that 0-group biomass is negatively affected by fisheries. The knowledge about the links to these anthropogenic drivers are assessed as less certain.
The four most abundant 0-group fish species are capelin, cod, haddock and herring. Strong year classes of those species lead to better stock development of adults in the following years. Those species are key to the Barents Sea and have huge impacts on the ecosystem as prey (capelin and younger stages of haddock and cod), plankton consumers (capelin and herring) and predators (herring, cod and haddock). In addition, 0-group fish have a wide distribution in the entire Barents Sea and are an important part of the pelagic stock in the summer and early autumn (Eriksen et al., 2011). Because of their large consumption/biomass ratio, 0-group fish have a central role in the energy transfer across trophic levels and between regions. They are preyed upon by many piscivorous fish, birds and marine mammals (Barrett and Krasnov, 1996; Skaug et al., 1997; Dalpadado and Bogstad, 2004). The understanding of the importance of changes in the biomass of 0-group fish is assessed as good.
References
Barrett, R. T., and Krasnov, Y. V. 1996. Recent responses to changes in stocks of prey species by seabirds breeding in the southern Barents Sea. ICES Journal of Marine Science, 53: 713-722.
Dalpadado, P., and Bogstad, B. 2004. Diet of juvenile cod (age 0-2) in the Barents Sea in relation to food availability and cod growth. Polar Biology, 27: 140-154.
Eriksen, E., Bogstad, B., and Nakken, O. 2011. Ecological significance of 0-group fish in the Barents Sea ecosystem. Polar Biology, 34: 647-657.
Eriksen, E., Ingvaldsen, R., Stiansen, J. E., and Johansen, G. O. 2012. Thermal habitat for 0-group fish in the Barents Sea; how climate variability impacts their density, length, and geographic distribution. ICES Journal of Marine Science, 69: 870-879.
Garcia, T., Planque, B., Arneberg, P., Bogstad, B., Skagseth, O., and Tiedemann, M. 2021. An appraisal of the drivers of Norwegian spring-spawning herring (Clupea harengus) recruitment. Fisheries Oceanography, 30: 159-173.
Ottersen, G., and Loeng, H. 2000. Covariability in early growth and year-class strength of Barents Sea cod, haddock, and herring: the environmental link. ICES Journal of Marine Science, 57: 339-348.
Skaug, H. J., Gjøsæter, H., Haug, T., Nilssen, K. T., and Lindstrøm, U. 1997. Do minke whales (Balaenoptera acutorostrata) exhibit particular prey preferences? J Northw Atl Fish Sci, 22: 91-104.
Pelagic planktivorous fish [SI07]
Phenomenon: Change in biomass of pelagic planktivorous fish [SP07]
Ecosystem characteristic: Biomass distribution among trophic levels
Under the reference condition, the biomass of planktivorous fish stocks of herring, blue whiting, and capelin is large enough to support predator populations dependent on these species as prey, e.g., cod, redfish, Greenland halibut, saithe and skates (Eriksen et al., 2020). Pelagic planktivorous fish are predators on zooplankton and are important for energy transfer to higher trophic levels such as marine mammals, seabirds and fish (Sakshaug et al., 2009; Jakobsen and Ozhigin, 2011).
The most important anthropogenic drivers of change in the biomass of pelagic planktivores are fisheries and climate change. Fishing is expected to cause a decrease in planktivorous fish biomass if these are the target species, or an increase for fisheries targeting higher trophic level species. The understanding of the link to fisheries is assessed as certain. With climate change, the diversity of pelagic planktivores is expected to increase due to northward expansion of southern species. There is also a positive effect of temperature on recruitment, at least for herring (Garcia et al., 2021), but the presence and possible increase of piscivores may reduce any increase in biomass. NEA cod is one of the important predators on planktivorous fish that is expected to benefit from climate change in the Barents Sea (Kjesbu et al., 2014; Årthun et al., 2018). Thus, the net effect on planktivorous fishes from climate change is uncertain, and the understanding of the link to climate change is assessed as less certain.
Planktivorous fish have a key role in top-down regulation of pelagic consumers (zooplankton) (Gjøsæter et al., 2009), and are important for energy transfer to top predators, such as piscivorous fish, seabirds, and marine mammals (Planque et al., 2014; Eriksen et al., 2020). Capelin plays a key role in the Sub-Arctic part of the Barents Sea as the most important mid-trophic level species efficiently making energy from plankton available to top-predators (Dolgov, 2002; Orlova et al., 2009). In particular NEA cod is dependent upon capelin for sustaining its high abundance. Capelin is also key diet items for whales, several seabird species, harp seals and other fish species (Dolgov, 2002; Planque et al., 2014; Eriksen et al., 2020). There is also evidence that capelin can inflict top-down effects on its zooplankton prey (Hassel et al., 1991; Dalpadado and Skjoldal, 1996; Gjøsæter et al., 2009). Less is known about the influence of NSS herring and blue whiting on the dynamics of prey and predator species, but they are known to be prey of large numbers of piscivorous fish, seabirds and marine mammals (Planque et al., 2014), and thus likely to be of importance for many species. In addition, there are important direct trophic interactions between the pelagic fish stocks (Planque et al., 2014), in particular between herring and capelin, with herring being an important predator on capelin larvae and a likely significant contributor to collapses in the capelin stock (Hjermann et al., 2004; Hjermann et al., 2010). The understanding of the importance of changes in biomass of pelagic planktivores is thus assessed as good.
Increasing or decreasing biomass of pelagic planktivores can be considered of ecosystem significance if, for example, i) it has direct effects on zooplankton, such as increasing biomass causing a reduction in biomass and decreasing proportion of large species and size-classes, ii) increasing biomass has negative indirect effects on other planktivores through increased competition, e.g. seabirds, marine mammals (such as Atlantic puffin, common murre, minke whales, fin whales and harbor porpoises, (Planque et al., 2014)), iii) it has direct positive or negative effects on piscivores, e.g. seabirds, fish, mammals (cod, redfish, saithe, Greenland halibut, skates, (Planque et al., 2014; Eriksen et al., 2020)).
References
Årthun, M., Bogstad, B., Daewel, U., Keenlyside, N. S., Sandø, A. B., Schrum, C., and Ottersen, G. 2018. Climate based multi-year predictions of the Barents Sea cod stock. Plos One, 13.
Dalpadado, P., and Skjoldal, H. R. 1996. Abundance, maturity and growth of the krill species Thysanoessa inermis and T-longicaudata in the Barents Sea. Marine Ecology Progress Series, 144: 175-183.
Dolgov, A. V. 2002. The role of capelin (Mallotus villosus) in the foodweb of the Barents Sea. ICES Journal of Marine Science, 59: 1034-1045.
Eriksen, E., Benzik, A. N., Dolgov, A. V., Skjoldal, H. R., Vihtakari, M., Johannesen, E., Prokhorova, T. A., et al. 2020. Diet and trophic structure of fishes in the Barents Sea: The Norwegian-Russian program "Year of stomachs" 2015-Establishing a baseline. Progress in Oceanography, 183: 102262.
Garcia, T., Planque, B., Arneberg, P., Bogstad, B., Skagseth, O., and Tiedemann, M. 2021. An appraisal of the drivers of Norwegian spring-spawning herring (Clupea harengus) recruitment. Fisheries Oceanography, 30: 159-173.
Gjøsæter, H., Bogstad, B., and Tjelmeland, S. 2009. Ecosystem effects of the three capelin stock collapses in the Barents Sea. Marine Biology Research, 5: 40-53.
Hassel, A., Skjoldal, H. R., Gjøsæter, H., Loeng, H., and Omli, L. 1991. Impact of grazing from capelin (Mallotus villosus) on zooplankton: a case study in the northern Barents Sea in August 1985. Polar Research, 10: 371-388.
Hjermann, D. O., Bogstad, B., Dingsør, G. E., Gjøsæter, H., Ottersen, G., Eikeset, A. M., and Stenseth, N. C. 2010. Trophic interactions affecting a key ecosystem component: a multistage analysis of the recruitment of the Barents Sea capelin (Mallotus villosus). Canadian Journal of Fisheries and Aquatic Sciences, 67: 1363-1375.
Hjermann, D. O., Ottersen, G., and Stenseth, N. C. 2004. Competition among fishermen and fish causes the collapse of Barents Sea capelin. Proceedings of the National Academy of Sciences of the United States of America, 101: 11679-11684.
Jakobsen, T., and Ozhigin, V. K. 2011. The Barents Sea: ecosystem, resources, management. Half a century of Russian-Norwegian cooperation. p. 825. Tapir Akademisk Forlag, Trondheim, Norway.
Kjesbu, O. S., Bogstad, B., Devine, J. A., Gjøsæter, H., Howell, D., Ingvaldsen, R. B., Nash, R. D. M., et al. 2014. Synergies between climate and management for Atlantic cod fisheries at high latitudes. Proceedings of the National Academy of Sciences of the United States of America, 111: 3478-3483.
Orlova, E. L., Dolgov, A. V., Rudneva, G. B., Oganin, I. A., and Konstantinova, L. L. 2009. Trophic relations of capelin Mallotus villosus and polar cod Boreogadus saida in the Barents Sea as a factor of impact on the ecosystem. Deep-Sea Research Part Ii-Topical Studies in Oceanography, 56: 2054-2067.
Planque, B., Primicerio, R., Michalsen, K., Aschan, M., Certain, G., Dalpadado, P., Gjøsæter, H., et al. 2014. Who eats whom in the Barents Sea: a food web topology from plankton to whales. Ecology, 95: 1430-1430.
Sakshaug, E., Johnsen, G., and Kovacs, K. M. 2009. Ecosystem Barents Sea, Tapir Academic Press, Trondheim.
High trophic level seabirds [SI08]
Phenomenon: Change in biomass of high trophic level seabirds [SP08]
Ecosystem characteristic: Biomass distribution among trophic levels
Under the reference condition, Atlantic puffin (Fratercula arctica) and common murre (Uria aalge) are important piscivorous predators in the Barents Sea ecosystem and a dominant part of the avifauna in the southern part of the Barents Sea (ICES, 2020). By-catch in fisheries (Strann et al., 1991) and fishery-induced collapses in the stocks of Norwegian spring spawning herring (Cury et al., 2011) and the Barents Sea capelin (Erikstad et al., 2013) had large impacts on the population dynamics of these species during the second half of the 20th century.
Climate change combined with prey availability are considered to be dominant drivers affecting the populations of common murres and puffins (Krashnov and Barrett, 1995; Durant et al., 2003; Erikstad et al., 2013). Puffins depend heavily on juvenile fish, and puffins from the colonies in northern Norway follow the drift of fish larvae into the Barents Sea after breeding, i.e., during late summer and early autumn. Juvenile fish, capelin and sand lance are important prey items for common murres (Barrett and Krasnov, 1996). Both seabird species are considered to be boreal, and the gradual borealization of the ecosystem following climate warming is expected to favor the two species, suggesting an increased abundance (e.g. Descamps and Strøm, 2021).
An unprecedented mass die-off of seabirds, most notably murres, was recently observed in the North Pacific following a marine heat wave causing widespread changes at lower trophic levels and subsequent starvation among seabirds (Piatt et al., 2020). The Barents Sea population of common murres experienced an incident of mass mortality and breeding failure in 1986-87 following a collapse in the capelin stock (Krashnov and Barrett, 1995; Erikstad et al., 2013). The Barents Sea common murre population stays in the southern Barents Sea throughout the winter, and the population is likely to be particularly vulnerable to collapses in local prey stocks caused by climate extremes such as heat waves. Such extremes are likely to increase in frequency under climate warming.
Most puffins leave the Barents Sea during winter and spread out over a large area in the North Atlantic. Recent studies suggest that seabirds could experience increased mortality during severe winter storms in the North Atlantic (Clairbaux et al., 2021). Storms are expected to increase in frequency and severity under climate change and could cause incidents of mass die-offs in puffins.
Competition with industrial fisheries targeting small pelagic fish has been argued to be an important factor affecting seabird populations worldwide (Cury et al., 2011; Grémillet et al., 2018). As experienced during the 1960s-80s, the pelagic fisheries of capelin and herring could cause collapses in the fish stocks with severe consequences for the populations of common murres and puffins. The current prudent regulations of the fisheries suggests that fisheries-induced collapses are a much less severe threat today, although capelin abundance is still very variable even at the low fishing pressure applied in the 2000s.
The knowledge about the links to climate change and fishery are assessed as certain. Fisheries are expected to affect populations negatively while climate change could affect populations both negatively, through increased frequency of extreme events, and positively through a borealization of the ecosystem. The mechanisms are well understood and there is good empirical evidence for anthropogenic impacts caused by over-fishing and climate change.
Atlantic puffin and common murres are, together with marine mammals and cod, important predators on pelagic fish in the Barents Sea and constitute a significant part of the top predator guild in the ecosystem (ICES, 2020). A large relative drop in the abundance of these species could impact their role as top predators in the ecosystem and would signal negative changes at lower trophic levels (Krashnov and Barrett, 1995; Barrett and Krasnov, 1996; Durant et al., 2003; Erikstad et al., 2013; Descamps and Strøm, 2021). The understanding of the importance of changes in the biomass of Atlantic puffin and common murre is assessed as good.
Changes in the biomass of high trophic level boreal seabirds can be considered of ecosystem significance if, i) there is a sudden drop in the biomass caused by a mass die-off of birds following a collapse in the availability of prey due to climate extremes or over-fishing, ii) there is a significant gradual long-term (> 10 years) increase in the biomass associated with climate warming and borealization of the ecosystem.
Knowledge gaps:
The time series from the ecosystem survey in the Barents Sea is relatively short (2004-2020). The indicator is sensitive to natural fluctuations in the Barents Sea climate and the abundance and distribution of key species such as capelin. The impact from anthropogenic drivers, such as fishing and climate change, are mediated through multiple direct and indirect pathways, and the relative importance of these drivers is therefore often unclear. More knowledge is needed to understand the mechanisms and dynamics related to these drivers.
References
Barrett, R. T., and Krasnov, Y. V. 1996. Recent responses to changes in stocks of prey species by seabirds breeding in the southern Barents Sea. ICES Journal of Marine Science, 53: 713-722.
Clairbaux, M., Mathewson, P., Porter, W., Fort, J., Strøm, H., Moe, B., Fauchald, P., et al. 2021. North Atlantic winter cyclones starve seabirds. Current Biology, 31: 3964-3971.e3963.
Cury, P. M., Boyd, I. L., Bonhommeau, S., Anker-Nilssen, T., Crawford, R. J. M., Furness, R. W., Mills, J. A., et al. 2011. Global seabird response to forage fish depletion - One-fhird for the birds. Science, 334: 1703-1706.
Descamps, S., and Strøm, H. 2021. As the Arctic becomes boreal: ongoing shifts in a high-Arctic seabird community. Ecology, e03485.
Durant, J. M., Anker-Nilssen, T., and Stenseth, N. C. 2003. Trophic interactions under climate fluctuations: the Atlantic puffin as an example. Proceedings of the Royal Society B-Biological Sciences, 270: 1461-1466.
Erikstad, K. E., Reiertsen, T. K., Barrett, R. T., Vikebø, F., and Sandvik, H. 2013. Seabird-fish interactions: the fall and rise of a common guillemot Uria aalge population. Marine Ecology Progress Series, 475: 267-276.
Grémillet, D., Ponchon, A., Paleczny, M., Palomares, M. L. D., Karpouzi, V., and Pauly, D. 2018. Persisting worldwide seabird-fishery competition despite seabird community decline. Current Biology, 28: 4009-4013.e4002.
ICES. 2020. Working Group on the Integrated Assessments of the Barents Sea (WGIBAR). 2:30. 206 pp.
Krashnov, Y. V., and Barrett, R. T. 1995. Large-scale interactions between seabirds, their prey and man in the southern Barents Sea. In Ecology of Fjords and Coastal Waters, pp. 443-456. Ed. by H. R. Skjoldal, C. C. E. Hopkins, K. E. Erikstad, and H. P. Leinaas. Elsevier Science, Amsterdam.
Piatt, J. F., Parrish, J. K., Renner, H. M., Schoen, S. K., Jones, T. T., Arimitsu, M. L., Kuletz, K. J., et al. 2020. Extreme mortality and reproductive failure of common murres resulting from the northeast Pacific marine heatwave of 2014-2016. Plos One, 15: e0226087.
Strann, K. B., Vader, W., and Barrett, R. T. 1991. Auk mortality in fishing nets in north Norway. Seabird, 13: 22-29.
Low trophic level marine mammals [SI09]
Phenomenon: Change in abundance of low trophic level mammals [SP09]
Ecosystem characteristic: Biomass distribution among trophic levels
Blue whales and fin whales both feed at low trophic levels in the Barents Sea (Mackenzie et al. 2022). Both species were hunted extensively, but blue whales were hunted to near extirpation and remain at levels dramatically lower than the historical state. Fin whales appear to have recovered somewhat; however, the original stock sizes for both species are unknown.
Commercial whaling is the cause for the reduced current population size (biomass) of these species. Currently, climate change is likely to be a major driver (Kaschner et al., 2011, Kovacs et al., 2021). Blue whales are thought to be recovering, with an estimated 3,000 in the central north Atlantic (Pike et al., 2019), many of which have moved into the Svalbard area during recent summers (Bengtsson et al., 2022). Fin whales are increasing and thought to be recovering or mostly recovered to their pre-whaling state (Vikingsson et al., 2015, Leonard and Øien, 2020a, b). Blue whale and fin whale numbers will likely continue to increase as long as pelagic production increases, which is expected with ocean warming and less sea-ice cover (Dalpadado et al., 2012). The abundance of krill is currently increasing in the Sub-Arctic (Erikson et al., 2017); if sufficient densities occur this will, be an attractant for more blue and fin whales. These species are already extending their range northward, tracking the sea-ice retreat and may be spending a longer period in the Norwegian waters seasonally (Storrie et al. 2018, Ahonen et al., 2021; Bengtsson et al., 2022)
The knowledge about the link to anthropogenic drivers is assessed as certain ; however, confounding the effect of climate warming as a driver is the recovery from commercial whaling and lack of historical population-size data. It is not possible to separate these effects.
These lower trophic feeding species are thought to have considerable impacts on the ecosystems they occupy, similar to other marine mammals, largely because of their extreme (large) body size(s). They influence their ecosystems through nutrient recycling, competition, and top-down control, but these effects are not well measured. An increasing blue whale population would almost certainly have at least local influences on krill abundance. The understanding of the link to ecosystem impact is thus assessed as less good.
References
Ahonen, H., Stafford, K. M., Lydersen, C., Berchok, C. L., Moore, S. E. and Kovacs, K. M. 2021. Inter-annual variability in acoustic detection of blue and fin whale calls in the Northeast Atlantic High Arctic between 2008 and 2018. Endang. Species Res. 45: 209–224. https://doi.org/10.3354/esr01132.
Bengtsson, O., Lydersen, C. and Kovacs, K.M. 2022. Cetacean spatial trends over time (2005-2019) in Svalbard, Norway. Polar Research 41: 10.33265. http://dx.doi.org/10.33265/polar.v41.7773.
Dalpadado, P., Ingvaldsen, R. B., Stige, L. C., Bogstad, B., Knutsen, T., Ottersen, G., and Ellertsen, B. 2012. Climate effects on Barents Sea ecosystem dynamics. ICES Journal of Marine Science, 69(7): 1303-1316.
Eriksen, E., Skjoldal, H. R., Gjøsæter, H., and Primicerio, R. 2017. Spatial and temporal changes in the Barents Sea pelagic compartment during the recent warming. Progress in Oceanography, 151, 206-226.
Kaschner, K., Tittensor, D. P., Ready, J. Gerrodette, T. and Worme, B. 2011. Current and future patterns of global marine mammal biodiversity. PLoS ONE 6: e19653.
Kovacs, K.M., Belikov, S., Boveng, P., Desportes, G., Ferguson, S., Hansen, R.G., Laidre, K., Stenson, G., Thomas, P., Ugarte, F., and Vongraven, D. 2021. SAMBR Update and Overview of Circumpolar Arctic Scientific Monitoring – Marine Mammals. Conservation of Arctic Flora and Fauna International Secretariat, Akureyri, Iceland.
Leonard, D., and Øien, N. 2020a. Estimated Abundances of Cetacean Species in the Northeast Atlantic from Norwegian Shipboard Surveys Conducted in 2014–2018. NAMMCO Sci. Publ. 11: https://doi.org/10.7557/3.4694
Leonard, D., and Øien, N. 2020b. Estimated Abundances of Cetacean Species in the Northeast Atlantic from Two Multiyear Surveys Conducted by Norwegian Vessels between 2002–2013. NAMMCO Sci. Publ. 11: https://doi.org/10.7557/3.4695
MacKenzie, K.M., Lydersen, C., Haug, T., Routti, H., Aars, J., Andvik, C.M., Borgå, K., Fisk, A.T., Meier, S., Biuw, M., Lowther, A.D., Lindstrom, U., and Kovacs, K.M. 2022. Niches of marine mammals in the European Arctic. Ecological Indicators, 136, p.108661.
Pike, D. G., Gunnlaugsson, T., Mikkelsen, B., Halldorson, S. D. and Vikingsson, G. A. 2019. Estimates of the abundance of cetaceans in the central North Atlantic based on the NASS Icelandic and Faroese shipboard surveys conducted in 2015. NAMMCO Sci. Publ. 11: 1-22.
Storrie, L., Lydersen, C., Andersen, M., Wynn, R. B. and Kovacs K. M. 2018. Determining the species assemblage and habitat use of cetaceans in the Svalbard Archipelago, based on recorded observations from 2002-2014. Polar Res. 37, 1463065, doi: 10.1080/17518369.2018.1463065.22pp.
Vikingsson, G. A., Pike, D. G., Valdimarrson, H., Schleimer, A., Gunnlaugsson, T., Silva, T., Elvarsson, B. T., Mikkelsen, B., Øien, N., Desportes, G., Bogason, V. and Hammond, P. S. 2015. Distribution, abundance, and feeding ecology of baleen whales in Icelandic waters: have recent environmental changes had an effect? Front. Ecol. Evol. 3: 1- 18.
Generalist mammals [SI10]
Phenomenon: Change in abundance of generalist mammals [SP10]
Ecosystem characteristic: Biomass distribution among trophic levels
Humpback whales and minke whales both have diets that vary across trophic levels in the Barents Sea (Mackenzie et al. 2022). Both species are likely depleted from their historical condition due to commercial whaling. Humpback whales were hunted extensively during the historical whaling period, while minke whales have been hunted continuously since the 1920’s. Although original stock sizes are not known with certainty, it is thought that humpback whale numbers have recovered somewhat in recent decades (Vikingsson et al., 2015; Leonard and Øien, 2020a, b).
Commercial harvest was a major driver of the abundance/biomass of humpback whales (historically) and minke whales (currently) in the Sub-Arctic. Commercial harvests are currently conducted within sustainable limits for minke whales, so are not defining population levels. Climate change is a current driver for the increasing biomass of generalist-feeding marine mammal species in the Sub-Arctic. Pelagic-feeding, seasonally resident minke and humpback whales are likely to continue to increase in response to temperature increases that drive prey species expansions northward with longer production seasons, warmer temperature and less sea ice (Dalpadado et al., 2012; Erikson et al., 2017). As generalists, these species are more successful in changing environments such as the Barents Sea, because they are able to take advantage of prey at varying trophic levels (Berta and Lanzetti, 2020). Since 1995, the number of humpback whales occurring in the Barents Sea during the summer months has increased from near zero in 1995 to an estimated 5000 animals, according to recent survey estimates (Leonard and Øien 2020a, b). In addition, the minke whale population in the North Atlantic, while remaining relatively constant in abundance, has undergone a shift in spatial distribution with a near doubling of the number of minke whales present in the Barents Sea in recent years (see Bengtsson et al., 2022 for sightings in Svalbard).
The understanding of the link of this indicator to anthropogenic drivers is assessed as certain.
Alteration of numbers/biomass of this indicator can alter the abundance of other species as well as altering the structure and functioning of the ecosystem. Similar to the other marine mammals, generalist feeding marine mammals are thought to exert considerable influences on the ecosystems they occupy, including, trophic structuring, nutrient recycling and carbon sequestration; however, quantifying these dynamics is complex and requires further study. The knowledge about the link to ecosystem impact is thus assessed as less good.
Minke and humpback whales occupy similar ecological niches as generalist predators of schooling fish and euphausiids. Both species can adapt by switching between prey species in response to their relative abundance (Haug et al., 2002); however, given the minke whale’s smaller body size, they are less able to buffer against interannual variation in food availability. There is evidence from the Southern Ocean that humpback whales tend to outcompete minke whales for prime feeding habitats, as the larger whales require larger prey patches and engage in cooperative feeding behaviors to concentrate prey (Friedlaender et al. 2006). A decline in body condition of minke whales between 1992-2013 may be an indication of an increase in competition for prey (Solvang et al., 2017). This decline coincides with higher abundances of humpback whales (Leonard and Øien 2020a, b) and also a higher abundance Atlantic cod, which are also a competitor of generalist marine mammals, and are thought to be increasing due to climate warming (Kjesbu et al., 2014; Bogstad et al., 2015). Thus, while the short-term changes in abundance of generalist marine mammals may be somewhat clear, the long-term trajectory is less clear and must account for competition with other species and fisheries, predator-prey dynamics, and corresponding food-web shifts.
References
Bengtsson, O., Lydersen, C., and Kovacs, K.M. 2022. Cetacean spatial trends over time (2005-2019) in Svalbard, Norway. Polar Research 41: 10.33265. http://dx.doi.org/10.33265/polar.v41.7773. Berta, A., & Lanzetti, A. (2020). Feeding in marine mammals: an integration of evolution and ecology through time. Palaeontologia Electronica, 23, a40.
Bogstad, B., Gjøsæter, H., Haug, T., and Lindstrøm, U. 2015. A review of the battle for food in the Barents Sea: cod vs. marine mammals. Frontiers in Ecology and Evolution, 3, 29.
Dalpadado, P., Ingvaldsen, R. B., Stige, L. C., Bogstad, B., Knutsen, T., Ottersen, G., and Ellertsen, B. 2012. Climate effects on Barents Sea ecosystem dynamics. ICES Journal of Marine Science, 69(7): 1303-1316.
Eriksen, E., Skjoldal, H. R., Gjøsæter, H., and Primicerio, R. 2017. Spatial and temporal changes in the Barents Sea pelagic compartment during the recent warming. Progress in Oceanography, 151, 206-226.
Folkow, L. P., Nordøy, E. S. and Blix, A. S. 2004. Distribution and diving behaviour of harp seals (Pagophilus groenlandicus) from the Greenland Sea stock. Polar Biol. 27: 281-298.
Fossheim, M., Primicerio, R., Johannesen, E., Ingvaldsen, R.B., Aschan, M.M., and Dolgov, A.V. 2015. Recent warming leads to a rapid borealization of fish communities in the Arctic. Nat Clim Change 5:673–677.
Friedlaender, A. S., Lawson, G. L., and Halpin, P. N. 2006. Evidence of resource partitioning and niche separation between humpback and minke whales in Antarctica: implications for interspecific competition. International whaling commission scientific committee document SC/58 E, 32, 37.
Haug, T., Lindstrøm, U., and Nilssen, K. T. 2002. Variations in minke whale (Balaenoptera acutorostrata) diet and body condition in response to ecosystem changes in the Barents Sea. Sarsia: North Atlantic Marine Science, 87(6), 409-422.
Kjesbu, O. S., Bogstad, B., Devine, J. A., Gjøsæter, H., Howell, D., Ingvaldsen, R., et al. 2014. Synergies between climate and management for Atlantic cod fisheries at high latitudes. Proc. Natl. Acad. Sci. U.S.A. 111, 3478–3483.
Leonard, D., and Øien, N. 2020a. Estimated Abundances of Cetacean Species in the Northeast Atlantic from Norwegian Shipboard Surveys Conducted in 2014–2018. NAMMCO Sci. Publ. 11: https://doi.org/10.7557/3.4694
Leonard, D., and Øien, N. 2020b. Estimated Abundances of Cetacean Species in the Northeast Atlantic from Two Multiyear Surveys Conducted by Norwegian Vessels between 2002–2013. NAMMCO Sci. Publ. 11: https://doi.org/10.7557/3.4695
MacKenzie, K.M., Lydersen, C., Haug, T., Routti, H., Aars, J., Andvik, C.M., Borgå, K., Fisk, A.T., Meier, S., Biuw, M., Lowther, A.D., Lindstrom, U., and Kovacs, K.M. 2022. Niches of marine mammals in the European Arctic. Ecological Indicators, 136: 108661.
Solvang, H. K., Yanagihara, H., Øien, N., and Haug, T. 2017. Temporal and geographical variation in body condition of common minke whales (Balaenoptera acutorostrata acutorostrata) in the Northeast Atlantic. Polar Biology, 40(3), 667-683.
Vikingsson, G. A., Pike, D. G., Valdimarrson, H., Schleimer, A., Gunnlaugsson, T., Silva, T., Elvarsson, B. T., Mikkelsen, B., Øien, N., Desportes, G., Bogason, V. and Hammond, P. S. 2015. Distribution, abundance, and feeding ecology of baleen whales in Icelandic waters: have recent environmental changes had an effect? Front. Ecol. Evol. 3: 1- 18.
High trophic level mammals [SI11]
Phenomenon: Change in abundance of high trophic level mammals [SP11]
Ecosystem characteristic: Biomass distribution among trophic levels
Sperm whales, killer whales, bottlenose whales, harbour porpoises, white-beaked dolphins, and harp seals, harbour seals, and grey seals, all feed at a high trophic level, are represented in this indicator. Most cetacean species, including those feeding on higher trophic levels, that occupy Norwegian waters in the Sub-Arctic were hunted extensively, though white-beaked dolphins have not been exploited commercially. Bottlenose whales were present historically in the Sub-Arctic, as evident from harvest records, but remain at very low levels today, with few observations in the Barents Sea (Leonard and Øien 2020a, b).
Historically, harvest was the most important driver for most of these species. Presently climate change, competition with fisheries, by-catch in fisheries, and pollutants are the most likely anthropogenic drivers. Sperm whales, and possibly bottlenose whales may be increasing after protection, and their squid prey is unlikely to be negative impacted by climate change. However, they may be vulnerable due to their reduced genetic diversity and narrow dietary niche (Sousa et al., 2019). Increased underwater noise (ship traffic, sonars, airguns) may impact these two species in addition to pollutants, that all toothed whales have problems metabolizing. Killer whales will likely increase in a warming Arctic and may expand northwards following prey species, such as mackerel and herring (Bentley et al., 2017). Additionally, an increase in pelagic feeding whales and less protection for ice-associated whales will result in an increase in the prey base for mammal-eating killer whales. High levels of pollutants are common in all high trophic level marine mammals (Desforges et al., 2018). Harp seals numbers are reduced from earlier levels, but this species is still the most numerous pinnipeds in the Barents Sea (Haug et al., 2021). Commercial harvests are currently conducted within sustainable limits, so are not defining population levels. In the Sub-Arctic, harp seal numbers will likely decline as sea ice retreats northward and there is increased competition from seal species that are not ice dependent, such as harbour seals and grey seals, which are expanding their ranges northward and are expected to be “climate winners” (Blanchet et al. 2014). White beaked dolphins and harbour porpoises are pelagic feeders; thus, increases in production are likely to have positive effects. However, they are also likely to face increased competition from dolphin species moving northwards (i.e., white-sided and common dolphins) and from other pelagic predators. The understanding of the link to anthropogenic drivers is assessed as certain.
Similar to the lower-trophic feeders, top-trophic feeding marine mammals are thought to exert considerable influences on the ecosystems they occupy, including top-down control of lower trophic species and vertical circulation of nutrients (e.g., Devred et al. 2021; Katija, 2012; Lavery et al. 2014). Higher trophic consumers are likely to have greater impact because the energy that they draw from the system is greater than for lower trophic feeders, but the exact effects of species losses (or major reductions) are difficult to predict. The link to ecosystem impact is thus assessed as less good.
References
Bentley, J. W., Serpetti, N., and Heymans, J. J. 2017. Investigating the potential impacts of ocean warming on the Norwegian and Barents Seas ecosystem using a time-dynamic food-web model. Ecological Modelling, 360, 94-107.
Blanchet, M.-A., Lydersen, C., Ims, R. A., Lowther, A. D., and Kovacs, K. M. 2014. Harbour seal (Phoca vitulina) movement patterns in the High Arctic archipelago of Svalbard, Norway. Aquat. Biol. 21: 167-181.
Dalpadado, P., Ingvaldsen, R. B., Stige, L. C., Bogstad, B., Knutsen, T., Ottersen, G., & Ellertsen, B. (2012). Climate effects on Barents Sea ecosystem dynamics. ICES Journal of Marine Science, 69(7), 1303-1316.
Desforges, J.-P., Hall, A., McConnell, B., Rosing-Asvid, A., Barber, J. L., Brownlow, A. Guise, S. de, Eulaers, I., Jepson, P. D., Letcher, R. J., Levin, M., Ross, P.S., Samarra, F., Vikingsson, G., Sonne, C., and Dietz, R. 2018. Predicting global killer whale population collapse from PCB pollution. Science 361: 1373-1376.
Devred, E., Hilborn, A., and den Heyer, C.E. 2021. Enhanced chlorophyll-a concentration in the wake of Sable Island, eastern Canada, revealed by two decades of satellite observations:a response to grey seal population dynamics? Biogeosciences, 18, 6115–6132, https://doi.org/10.5194/bg-18-6115-2021
Haug, T., Biuw, M., Gjøsæther, H., Knutsen, T., Lindstrom, T., Mackenzie, K. M., Meier, S., and Nilssen, K. T. 2021. Harp seal body condition and trophic interactions with prey in Norwegian high Arctic waters in early autumn. Prog. Oceanogr. 191, art. No. 102498: 1-18.
Katija K. 2012. Biogenic inputs to ocean mixing. J Exp Biol 215(6): 1040-1049.
Laverty, T.J., Roudnew, B., Seymour, J., Mitchell, J.G., Smetacek, V., and Nicol. S. 2014. Whales sustain fisheries: blue whales stimulate primary production in the Southern Ocean. Marine Mammal Science 30: 888-904.
Leonard, D., and Øien, N. 2020a. Estimated Abundances of Cetacean Species in the Northeast Atlantic from Norwegian Shipboard Surveys Conducted in 2014–2018. NAMMCO Sci. Publ. 11: https://doi.org/10.7557/3.4694
Leonard, D., and Øien, N. 2020b. Estimated Abundances of Cetacean Species in the Northeast Atlantic from Two Multiyear Surveys Conducted by Norwegian Vessels between 2002–2013. NAMMCO Sci. Publ. 11: https://doi.org/10.7557/3.4695
Sousa, A., Alves, F., Dinis, A., Bentz, J., Cruz, M. J. and Nunes, J. N. 2019. How vulnerable are cetaceans to climate change? Developing and testing a new index. Ecol. Indicators 98: 9-18.
High TL zooplankton functional groups [SI12]
Phenomenon: Change in biomass of carnivorous krill relative to gelatinous zooplankton [SP12]
Ecosystem characteristic: Functional groups within trophic levels
Under the reference condition, the most important carnivorous krill species in the Barents Sea is Meganyctiphanes norvegica which preys on smaller zooplankton and is prey for fish, seabirds and marine mammals (Cabrol et al., 2019; Eriksen et al., 2020). Under the reference condition, the species is strongly associated with inflowing Atlantic Water in the southwestern part of the Barents Sea (Eriksen et al., 2016). Gelatinous zooplankton, with >95% water content in their body are generalist predators, feeding on zooplankton, fish larvae and eggs as well as other types of prey (Purcell and Arai, 2001). They are prey for many groups, including fish (such as cod) in the Barents Sea (Eriksen et al., 2018). Their role as prey is poorly known but has probably been underestimated in diet studies based on visual examinations of predator guts, as studies using stable isotope analysis of predator tissues, animal-borne cameras, and DNA analysis of faecal and gut samples (metabarcoding) are all indicating that many taxa routinely consume jellyfish (Hays et al., 2018). The latter approaches need to be further validated and, consequently, the understanding of role gelatinous zooplankton in ecosystems is still rather limited (Stoltenberg et al., 2021).
The most important anthropogenic driver of change in the indicator is likely climate change. Looking across both the Norwegian and Russian sector of the Barents Sea and for the time period from 1984 to 2005 and 2000 to 2011, an increase in the amount of krill has been observed, likely as a response to climate warming (Dalpadado et al., 2012; Eriksen et al., 2016). There are also indications that important groups of gelatinous zooplankton in the Barents Sea have been favoured by climate change in the same period (Eriksen et al., 2012, 2018). Given the uncertainties associated with the latter, the understanding of the link between driver and indicator is rated as less certain.
A considerable change in the biomass of carnivorous krill relative to that of gelatinous zooplankton may have a significant impact on both predator and prey functions in the carnivorous zooplankton community. However, as the understanding of the predator and prey dynamics of gelatinous zooplankton is limited generally (Purcell and Arai, 2001; Stoltenberg et al., 2021), and also for the Barents Sea (Eriksen et al., 2012, 2018), the understanding of the importance of changes in the indicator for other parts of the ecosystem is rated as less good.
References
Cabrol, J., Trombetta, T. S., Amaudrut, S., Aulanier, F., Sage, R. F., Tremblay, R., Nozais, C., et al. 2019. Trophic niche partitioning of dominant North Atlantic krill species, Meganyctiphanes norvegica, Thysanoessa inermis, and T. raschii. Limnology and Oceanography, 64: 165-181.
Dalpadado, P., Ingvaldsen, R. B., Stige, L. C., Bogstad, B., Knutsen, T., Ottersen, G., and Ellertsen, B. 2012. Climate effects on Barents Sea ecosystem dynamics. ICES Journal of Marine Science, 69: 1303-1316.
Eriksen, E., Benzik, A. N., Dolgov, A. V., Skjoldal, H. R., Vihtakari, M., Johannesen, E., Prokhorova, T. A., et al. 2020. Diet and trophic structure of fishes in the Barents Sea: The Norwegian-Russian program “Year of stomachs” 2015 – Establishing a baseline. Progress in Oceanography, 183: 102262.
Eriksen, E., Bogstad, B., Dolgov, A., and Beck, I. M. 2018. Cod diet as an indicator of Ctenophora abundance dynamics in the Barents Sea. Marine Ecology Progress Series, 591: 87-100.
Eriksen, E., Prozorkevich, D., Trofimov, A., and Howell, D. 2012. Biomass of Scyphozoan jellyfish, and its spatial association with 0-group fish in the Barents Sea. Plos One, 7.
Eriksen, E., Skjoldal, H. R., Dolgov, A. V., Dalpadado, P., Orlova, E. L., and Prozorkevich, D. V. 2016. The Barents Sea euphausiids: methodological aspects of monitoring and estimation of abundance and biomass. ICES Journal of Marine Science, 73: 1533-1544.
Hays, G. C., Doyle, T. K., and Houghton, J. D. R. 2018. A paradigm shift in the trophic Importance of jellyfish? Trends in Ecology & Evolution, 33: 874-884.
Purcell, J. E., and Arai, M. N. 2001. Interactions of pelagic cnidarians and ctenophores with fish: a review. Hydrobiologia, 451: 27-44.
Stoltenberg, I., Dierking, J., Muller-Navarra, D. C., and Javidpour, J. 2021. Review of jellyfish trophic interactions in the Baltic Sea. Marine Biology Research, 17: 311-326.
Benthic habitat engineers [SI13]
Phenomenon: Decreasing biomass of benthic habitat engineers [SP13]
Ecosystem characteristic: Functional groups within trophic levels
Under reference conditions, biomass of benthic habitat engineers should be sufficient to host local biodiversity hot spots and provide the ecosystem with habitat complexity promoting nursing and feeding.
The most important anthropogenic driver of change in this indicator is bottom-trawling impact. Local, large, erected, and immobile species will have a high likelihood of being hit by a bottom trawl compared to small, cryptic infaunal species. The effect of bottom trawling on habitat engineers has been assessed (Jørgensen et al., 2016, 2019).
The understanding of the effect of drivers is thus rated as certain.
Removal of existing benthic species constitutes a development away from intact nature (i.e. without human pressures). Habitat engineers provide substrate and food for a large number of species, and reduction in these habitat-forming species can reduce biodiversity levels.
The ecosystem significance of decreasing benthic habitat engineers has not been verified for the Barents Sea but the effect of structure-forming corals and sponges and their use as fish habitat have been described for the Barents Sea (Jørgensen et al., 2022) and for the Bering Sea Submarine Canyons (Miller et al., 2018). The term 'habitat engineer' specifically indicates how the species modifies the environment. Changes in seafloor/habitat heterogeneity, altered bottom-currents, and changes in resuspension and particle loads are just a few changes in the seafloor environment that will likely lead to changes in other components of the system. Indeed, some of the species forming habitat are highlighted as specifically important or vulnerable (sponges, corals, sea pens). Studies have addressed the vulnerability of such habitats in the northern or southern Barents Sea (Jørgensen et al.2015, 2019, 2020, 2022), but these patterns of impact have been observed elsewhere and can be expected to occur in the Barents Sea as well.
The understanding of the importance for the rest of the ecosystem of decreasing benthic habitat engineers is thus good.
Reference
Jørgensen L.L, Ljubin P, Skjoldal HR, Ingvaldsen RB, Anisimova N, Manushin I. (2015). Distribution of benthic megafauna in the Barents Sea: baseline for an ecosystem approach to management. ICES Journal of Marine Science; 72 (2): 595-613
Jørgensen, L. L.., Planque, B., Thangstad, T. H., and Certain, G. 2016. Vulnerability of megabenthic species to trawling in the Barents Sea. ICES Journal of Marine Science, 73: i84–i97.
Jørgensen, L. L.., Primicerio, R., Ingvaldsen, R. B., Fossheim, M., Strelkova, N., Thangstad, T. H., Manushin, I., et al. 2019. Impact of multiple stressors on sea bed fauna in a warming Arctic. Marine Ecology Progress Series, 608: 1–12.
Jørgensen LL, Bakke G, Hoel AH (2020) Responding to global warming: new fisheries management measures in the Arctic. Progress in Oceanography, p.102423
Jørgensen, L. L.., Pecuchet, L., Ingvaldsen, R. B., & Primicerio, R. (2022). Benthic transition zones in the Atlantic gateway to a changing Arctic Ocean. Progress in Oceanography, 102792. Miller, D. D., Ota, Y., Sumaila, U. R., Cisneros‐Montemayor, A. M., and Cheung, W. W. L. 2018. Adaptation strategies to climate change in marine systems. Global Change Biology, 24: e1–e14.
Fish size [SI14]
Phenomenon: Decreasing body length at maturity across species in a fish community [SP14]
Ecosystem characteristic: Functional groups within trophic levels
Under the reference condition, fish species with large body size are present in the demersal fish community. They have an important structuring role in the ecosystem, since larger species typically are feeding on a larger range of prey types.
The most important anthropogenic drivers of change in this indicator are fisheries and climate change. Fisheries are preferentially harvesting large size individuals and species, and as a result many fish communities in exploited ecosystems have a truncated size structure with lower abundance of large-sized individuals and species than expected under the absence of fisheries (Jennings and Blanchard, 2004). The understanding of the link between fisheries and community body size is assessed as certain. Climate might affect the size composition in the fish communities through climate-driven redistribution of species. It is, however, uncertain in what direction climate will affect size-structure of the Sub-Arctic demersal fish communities, and the knowledge about this link is assessed as less certain. Climate and fisheries might have antagonistic effect on changes in the size structure in the community; the understanding of the cumulative effect of these two pressures is thus less certain.
Body size is considered a master trait in the ocean, as an organism’s body size can characterize many other traits such as metabolism and feeding ecology (Brown et al., 2004; Andersen et al., 2016). At the fish population level, changes in body-size composition can affect the regenerative capacity of the population, by for example affecting the reproduction potential of the population and impacting the resilience of the population to further climate change and fishery pressures (Hsieh et al., 2010). Body size truncation can also have impacts at higher organizational level, such as the community and food web level. Marine food webs are largely structured by species body size (Brose et al., 2006; Andersen, 2019) with large species generally eating a wider size range of prey. The Barents Sea food web is also size-structured (Pecuchet et al., 2020). As fisheries target large-size individuals, the abundance of large fish is decreasing, impacting the structure of the food web. Changes in the size structure of fish communities can have implications for top-down and bottom-up control in the ecosystem (Brose et al., 2012) and affect the energy flow across trophic levels. Changes in the body size composition in the community will thus impact the structure of the Sub-Arctic food web, and ultimately its functioning. The understanding of the importance of changes in the fish community body size is assessed as good.
Changes in the fish community mean length can be considered of ecosystem significance if, for example, i) the size structure of the fish community is truncated, e.g., no big fish, which could be seen by ii) an increased abundance of medium-sized individuals.
References
Andersen, K. H. 2019. Fish ecology, evolution, and exploitation - a new theoretical synthesis, Princeton University Press, Princeton and Oxford.
Andersen, K. H., Berge, T., Goncalves, R. J., Hartvig, M., Heuschele, J., Hylander, S., Jacobsen, N. S., et al. 2016. Characteristic sizes of life in the oceans, from bacteria to whales. Annual Review of Marine Science, 8: 217-241.
Brose, U., Dunne, J. A., Montoya, J. M., Petchey, O. L., Schneider, F. D., and Jacob, U. 2012. Climate change in size-structured ecosystems. Philosophical Transactions of the Royal Society B-Biological Sciences, 367: 2903-2912.
Brose, U., Jonsson, T., Berlow, E. L., Warren, P., Banasek-Richter, C., Bersier, L. F., Blanchard, J. L., et al. 2006. Consumer-resource body-size relationships in natural food webs. Ecology, 87: 2411-2417.
Brown, J. H., Gillooly, J. F., Allen, A. P., Savage, V. M., and West, G. B. 2004. Toward a metabolic theory of ecology. Ecology, 85: 1771-1789.
Hsieh, C. H., Yamauchi, A., Nakazawa, T., and Wang, W. F. 2010. Fishing effects on age and spatial structures undermine population stability of fishes. Aquatic Sciences, 72: 165-178.
Jennings, S., and Blanchard, J. L. 2004. Fish abundance with no fishing: predictions based on macroecological theory. Journal of Animal Ecology, 73: 632-642.
Pecuchet, L., Blanchet, M. A., Frainer, A., Husson, B., Jorgensen, L. L., Kortsch, S., and Primicerio, R. 2020. Novel feeding interactions amplify the impact of species redistribution on an Arctic food web. Global Change Biology, 26: 4894-4906.
Fish life history [SI15]
Phenomenon: Decreasing slow-life, equilibrium fish species [SP15]
Ecosystem characteristic: Functional groups within trophic levels
Under the reference condition, species with Equilibrium/slow life history strategies are an important part of the Sub-Arctic demersal fish community. Due to their long lifespan, late maturation and low fecundity, they typically have stable population dynamics and very low rates of intrinsic population increase, and are vulnerable to increased mortality. Under the reference condition, Equilibrium/slow-life species are not affected by increased mortality, e.g., from fisheries, and the total biomass is expected to have been higher compared to today.
One of the most important anthropogenic drivers of change in this indicator in the Sub-Arctic is fisheries. The ‘Equilibrium/slow-life species’ have a large body size, produce few but large offspring which have a higher chance of surviving the juvenile stage. Some typical Equilibrium species in the Barents Sea are sharks and rays such Velvet belly lanternshark (Etmopterus spinax), Rabbit fish (Chimaera monstrosa), Spinytail skate (Bathyraja spinicauda), and Thorny skate (Amblyraja radiata). These large, slow-growing, and low-fecundity species are characterized by a low intrinsic productivity, which make them especially vulnerable to fishing pressure (Stevens et al., 2000; King and McFarlane, 2003; Winemiller, 2005; Quetglas et al., 2016). These species are often suffering from high by-catch fishing mortality. The understanding of the link to fishing pressure is assesses as certain. However, the understanding of the combined effect of fisheries, climate and other pressures on the biomass of the Equilibrium/ slow-life species is less certain, and as a result it might be hard to disentangle the effect of only the fishing pressure.
Equilibrium/slow-life species are often top predators in the marine environment. The removal of these top predators can impact the size structure of the communities and as a result impact the structure of the food web. A decline in top predators can also lead to trophic cascades (Myers and Worm, 2003; Myers et al., 2007), it can have implications for top-down and bottom-up control in the ecosystem (Brose et al., 2012) and affect the energy flow across trophic levels. The understanding of the importance of changes in the biomass of Equilibrium/slow-life history strategies is assessed as good.
Decreasing trend in the biomass of Equilibrium/slow-life species can be considered of ecosystem significance if, for example, i) the top fish predator in the ecosystem are no longer slow-life/Equilibrium species, ii) it caused a trophic cascade.
References
Brose, U., Dunne, J. A., Montoya, J. M., Petchey, O. L., Schneider, F. D., and Jacob, U. 2012. Climate change in size-structured ecosystems. Philosophical Transactions of the Royal Society B-Biological Sciences, 367: 2903-2912.
King, J. R., and McFarlane, G. A. 2003. Marine fish life history strategies: applications to fishery management. Fisheries Management and Ecology, 10: 249-264.
Myers, R. A., Baum, J. K., Shepherd, T. D., Powers, S. P., and Peterson, C. H. 2007. Cascading effects of the loss of apex predatory sharks from a coastal ocean. Science, 315: 1846-1850.
Myers, R. A., and Worm, B. 2003. Rapid worldwide depletion of predatory fish communities. Nature, 423: 280-283.
Quetglas, A., Rueda, L., Alvarez-Berastegui, D., Guijarro, B., and Massut, E. 2016. Contrasting responses to harvesting and environmental drivers of fast and slow life history species. Plos One, 11: 1-15.
Stevens, J. D., Bonfil, R., Dulvy, N. K., and Walker, P. A. 2000. The effects of fishing on sharks, rays, and chimaeras (chondrichthyans), and the implications for marine ecosystems. ICES Journal of Marine Science, 57: 476-494.
Winemiller, K. O. 2005. Life history strategies, population regulation, and implications for fisheries management. Canadian Journal of Fisheries and Aquatic Sciences, 62: 872-885.
Fish habitat use [SI16]
Phenomenon: Change in proportion of benthic fish [SP16]
Ecosystem characteristic: Functional groups within trophic levels
Under the reference condition, fish species belonging to both benthic, bentho-pelagic and pelagic communities are present, and energy in the ecosystem is channelled through both benthic and pelagic pathways. However, large populations of bentho-pelagic species are common, and benthic species are not as dominating as in the Arctic parts of the Barents Sea.
The most important anthropogenic drivers of change in this indicator are climate change and fisheries. Climate change can influence fish recruitment and species distribution (e.g. Landa et al., 2014). Boreal fish species are expected to increase in biomass with climate change, and several of these are typically bentho-pelagic generalists and the most influential of these is NEA cod (Fossheim et al., 2015; Kortsch et al., 2015). The proportion of typically benthic fish species is thus expected to decrease with increased climate change due to the increase in typically boreal bentho-pelagic generalists. However, the NEA cod population is also affected by fisheries, and thus the fisheries management regime. Thus, the expected increase in cod biomass with climate change may be counteracted by decreasing biomass due to intensified fisheries. The knowledge about the links to these anthropogenic drivers are assessed as certain, although with antagonistic effects from climate and fisheries on the major bentho-pelagic fish species (NEA cod) the understanding of the cumulative effect is assessed as less certain.
The indicator reflects the biomass allocation in pelagic (bentho-pelagic) and benthic ecosystem compartments, respectively, and thus changes in the pelagic-benthic coupling (Griffiths et al., 2017). This is a key feature of ecosystem structure in aquatic ecosystems, providing a simple measure of the status of a fish community (e.g. Pennino and Bellido, 2012). Changes in the ratio likely reflects community-wide alterations in community structure and biomass allocation, and the indicator may therefore be indicative of regime shifts (Aschan et al., 2013). When interpreting changes in the ratio, many factors will need to be accounted for simultaneously, and the understanding of the importance of changes in this indicator is thus assessed as less good.
Changes in this indicator can be considered of ecosystem significance if, for example, i) a higher proportion of pelagic and bentho-pelagic species results in a higher proportion of the energy produced by lower trophic levels is being kept in the upper water layers, which in turn may negatively influence benthic biota.
Knowledge gaps:
Description of knowledge gaps related to the phenomenon include i) uncertainty as to what species will establish and dominate in the system under future anthropogenic disturbance, ii) uncertainty as to how future changes in species' relative abundance will be affected by cascade effects. Although changes may be expected, the definition of whether a species is "benthic" or "bentho-pelagic" clearly affects the temporal development of the indicator.
References
Aschan, M., Fossheim, M., Greenacre, M., and Primicerio, R. 2013. Change in fish community structure in the Barents Sea. Plos One, 8: 1-12.
Fossheim, M., Primicerio, R., Johannesen, E., Ingvaldsen, R. B., Aschan, M. M., and Dolgov, A. V. 2015. Recent warming leads to a rapid borealization of fish communities in the Arctic. Nature Climate Change, 5: 673-677.
Griffiths, J. R., Kadin, M., Nascimento, F. J. A., Tamelander, T., Törnroos, A., Bonaglia, S., Bonsdorff, E., et al. 2017. The importance of benthic-pelagic coupling for marine ecosystem functioning in a changing world. Global Change Biology, 23: 2179-2196.
Kortsch, S., Primicerio, R., Fossheim, M., Dolgov, A. V., and Aschan, M. 2015. Climate change alters the structure of arctic marine food webs due to poleward shifts of boreal generalists. Proceedings of the Royal Society B-Biological Sciences, 282: 31-39.
Landa, C. S., Ottersen, G., Sundby, S., Dingsor, G. E., and Stiansen, J. E. 2014. Recruitment, distribution boundary and habitat temperature of an arcto-boreal gadoid in a climatically changing environment: a case study on Northeast Arctic haddock (Melanogrammus aeglefinus). Fisheries Oceanography, 23: 506-520.
Pennino, M. G., and Bellido, J. M. 2012. Can simple pelagic-demersal ratio explain ecosystem functioning? Biodiversity Journal, 3: 69-78.
Seabird feeding types [SI17]
Phenomenon: Decreasing proportion of diving to surface-feeding seabirds [SP17]
Ecosystem characteristic: Functional groups within trophic levels
Under the reference condition, the diving seabirds are important piscivorous predators in the Barents Sea ecosystem and a dominant part of the avifauna (ICES, 2020). Surface-feeding seabirds are, to a large degree, dependent on diving seabirds and other top predators for food accessibility (Harrison et al., 1991; Camphuysen and Webb, 1999). Extensive industrial fisheries and historical extirpation of cetaceans by the whaling industry during the 19th and 20th centuries did probably alter the ratio between diving and surface-feeding seabirds to an unknown extent.
Fisheries is the most important anthropogenic driver of change affecting the proportion of diving to surface-feeding seabirds. Surface-feeding seabirds typically forage in the upper meter of the ocean and are largely dependent on other top-predators (predatory fish, diving seabirds and marine mammals) for driving fish and krill to the surface and making the food accessible (Harrison et al., 1991; Camphuysen and Webb, 1999). In contrast, diving seabirds hunt in a larger portion of the water column and are less dependent on other top predators to access food (Fauchald, 2009; Veit and Harrison, 2017). During the last 50 years, surface-feeding seabirds have profited from large amounts of discards from the fishing industry (Garthe et al., 1996; Votier et al., 2004). At the same time, the same pelagic fisheries are competing with diving piscivorous seabirds, such as auks (Cury et al., 2011; Grémillet et al., 2018). It is therefore expected that increased industrial fisheries could change the functional composition of the seabird community, implying reduced abundance of diving piscivorous seabirds and increased abundance of surface-feeding and scavenging seabirds. In the Barents Sea, dominant surface-feeding birds include gulls (Rissa tridactyla, Larus argentaus, L. marinus, L. hyperboreus) and northern fulmar (Fulmarus glacialis); and dominant diving piscivorous seabirds include the large auks (Fratercula arctica, Uria aalge, U. lomvia) (ICES, 2020). While increased fisheries and discards are expected to result in a decreased proportion of diving to surface-feeding birds, regulatory measures aimed at reducing the discards (i.e., the “discard ban”, Gullestad et al. 2015) and sustainable harvesting could reverse this trend.
The understanding of the link to fisheries is assessed as certain. The mechanisms relating seabird abundance to fishery discards and competition with pelagic fisheries are well understood and have been documented extensively. A decreasing ratio of diving relative to surface-feeding seabirds is expected to be related to unsustainable pelagic fishing practices (i.e., high discard rates and poor regulation of catches). An increased ratio can be expected for reduced discards and sustainable catch regulations.
Seabirds are important top predators in the Barents Sea ecosystem. Facilitation (i.e., positive interactions) between top predators with different functions is considered to be important for top predators in the pelagic ecosystem (Fauchald et al., 2011; Veit and Harrison, 2017), and the function of the top predator guild is accordingly sensitive to changes in functional diversity. There is however still a relatively weak understanding of the importance of these mechanisms. The understanding of the importance of changes in the indicator is assessed as less good.
A decreasing trend in the indicator can be considered of ecosystem significance if there is a persistent and relatively large reduction in the ratio related to unsustainable pelagic fishing practices (i.e., high discard rates and poor regulation of catches). An increased ratio can be expected for reduced discards and sustainable catch regulations.
Knowledge gaps:
How functional diversity and facilitation affect top predators and their role in the pelagic ecosystem is poorly known. The time series from the ecosystem survey in the Barents Sea is relatively short (2004-2020) and the relative abundance of surface-feeding seabirds is biased by their attraction to the survey vessel. How climate change could affect the ratio is unknown.
References
Camphuysen, K., and Webb, A. 1999. Multi-species feeding associations in North Sea seabirds: Jointly exploiting a patchy environment. Ardea, 87: 177-198.
Cury, P. M., Boyd, I. L., Bonhommeau, S., Anker-Nilssen, T., Crawford, R. J. M., Furness, R. W., Mills, J. A., et al. 2011. Global seabird response to forage fish depletion - One-fhird for the birds. Science, 334: 1703-1706.
Fauchald, P. 2009. Spatial interaction between seabirds and prey: review and synthesis. Marine Ecology Progress Series, 391: 139-151.
Fauchald, P., Skov, H., Skern-Mauritzen, M., Hausner, V. H., Johns, D., and Tveraa, T. 2011. Scale-dependent response diversity of seabirds to prey in the North Sea. Ecology, 92: 228-239.
Garthe, S., Camphuysen, C. J., and Furness, R. W. 1996. Amounts of discards by commercial fisheries and their significance as food for seabirds in the North Sea. Marine Ecology Progress Series, 136: 1-11.
Grémillet, D., Ponchon, A., Paleczny, M., Palomares, M. L. D., Karpouzi, V., and Pauly, D. 2018. Persisting worldwide seabird-fishery competition despite seabird community decline. Current Biology, 28: 4009-4013.e4002.
Gullestad, P., Blom, G., Bakke, G. and Bogstad, B. 2015. The “Discard Ban Package”: experiences in efforts to improve the exploitation pattern in Norwegian fisheries. Marine Policy 54(5): 1-9.
Harrison, N. M., Whitehouse, M. J., Heinemann, D., Prince, P. A., Hunt, G. L., and Veit, R. R. 1991. Observations of multispecies seabird flocks around South Georgia. Auk, 108: 801-810.
ICES. 2020. Working Group on the Integrated Assessments of the Barents Sea (WGIBAR). 2:30. 206 pp.
Veit, R. R., and Harrison, N. M. 2017. Positive interactions among foraging seabirds, marine mammals and fishes and implications for their conservation. Frontiers in Ecology and Evolution, 5: 121.
Votier, S. C., Furness, R. W., Bearhop, S., Crane, J. E., Caldow, R. W. G., Catry, P., Ensor, K., et al. 2004. Changes in fisheries discard rates and seabird communities. Nature, 427: 727-730.
Mammals top-down control [SI18]
Phenomenon: Change in ratio of high vs low trophic level mammals [SP18]
Ecosystem characteristic: Functional groups within trophic levels
The marine mammal community in the Norwegian Sub-Arctic has been greatly changed from the historical condition by anthropogenic activities, first and foremost overharvesting (see above). All of the large whales and some smaller species of marine mammals (e.g., both whales and seals) have been reduced from the reference state.
The drivers of changes in this indicator have largely been described above in the phenomena SP09 to SP11, but harvest (both of marine mammals and their prey) and climate change are the greatest drivers of marine mammal community composition and diversity in the Norwegian Sub-Arctic. As whale populations recover to pre-industrial-harvesting levels and move northward, interspecific competition and changes to predator-prey relationships will become more likely. Pelagic species will likely increase with increasing productivity (Eriksen et al. 2014). Warming of the Arctic will likely lengthen food chains, dissipating energy flow, and reducing the feeding efficiency of top predators (Wesławski et al., 2009). Competition could shift the current balance between tropic levels and possibly lead to diet switching between trophic levels for some species (e.g., killer whales from herring to marine mammals (Vongraven and Bisther, 2014), or white-beaked dolphins from smaller fish to larger species). Other generalist marine mammal species could switch to lower trophic level prey species (planktonic species) (MacKenzie et al., 2022) due to competition with fisheries for higher trophic levels (small fish). Understanding how competitive predators of the Barents Sea ecosystem interact and respond to different prey stock regimes is especially important given the dynamic nature of the Barents Sea ecosystem and its current transition from polar to a more temperate ecoregion (Dalpadado et al., 2012).
The understanding of the link between drivers and change in the indicator is rated as certain.
Changes in the trophic levels of the marine mammal community are likely to have cascading impacts on the broader ecosystem. It is not currently possible to predict which marine mammal species are of greatest importance to ecosystems stability and function. Higher trophic consumers are likely to have greater impact at an individual level because the energy that they draw from the system is greater than for lower trophic feeders, but effects of species losses (or major reductions) are difficult to predict (Skern-Mauritzen et al., 2022). Modelling efforts that incorporate marine mammal community structure and function are much needed.
The understanding of the impact on the ecosystem is assessed as less good.
References
Dalpadado, P., Ingvaldsen, R. B., Stige, L. C., Bogstad, B., Knutsen, T., Ottersen, G., and Ellertsen, B. 2012. Climate effects on Barents Sea ecosystem dynamics. ICES Journal of Marine Science, 69(7); 1303-1316.
Eriksen, E., Skjoldal, H. R., Gjøsæter, H., and Primicerio, R. 2017. Spatial and temporal changes in the Barents Sea pelagic compartment during the recent warming. Progress in Oceanography, 151, 206-226.
MacKenzie, K.M., Lydersen, C., Haug, T., Routti, H., Aars, J., Andvik, C.M., Borgå, K., Fisk, A.T., Meier, S., Biuw, M., Lowther, A.D., Lindstrom, U., and Kovacs, K.M. 2022. Niches of marine mammals in the European Arctic. Ecological Indicators, 136: 108661.
Skern-Mauritzen, M., Lindtrøm, U., Biuw, M. Elvarsson, B., Gunnlaugsson, T., Haug, T., Kovacs, K.M., Lydersen, C., McBride, M.M., Mikkelsen, B., Øien, N. and Vikengsson, G. Marine mammal consumption and fisheries removals in the Nordic and _Barents Seas. ICES Journal of Marine Science, 79: 1583-1603.
Vongraven, D. and Bisther, A., 2014. Prey switching by killer whales in the north-east Atlantic: observational evidence and experimental insights. Journal of the Marine Biological Association of the United Kingdom, 94(6), pp.1357-1365.
Wesławski, J.M., Kwasniewski, S. and Stempniewicz, L., 2009. Warming in the Arctic may result in the negative effects of increased biodiversity. Polarforschung, 78(3), pp.105-108.
Arctic Calanus [SI19]
Phenomenon: Decreasing abundance of Arctic Calanus species [SP19]
Ecosystem characteristic: Functionally important species and biophysical structures
Three Calanus species occur in the Barents Sea, Calanus finmarchicus, Calanus glacialis and Calanus hyperboreus. Calanus finmarchicus is mainly an Atlantic species and C. glacialis is a typical Arctic species that is distributed mainly in Arctic water masses in the Barents Sea. However, both species can co-occur in mixed water masses (Conover, 1988; Tande, 1991; Melle and Skjoldal, 1998; Hirche and Kosobokova, 2007; Aarflot et al., 2018), including coastal areas and fjords in mainland Norway (Choquet et al., 2018). Calanus hyperboreus is an Arctic deep-water species with low abundance in the Barents Sea (Aarflot et al., 2018). Approximately 80% of the total biomass of mesozooplankton in the Barents Sea consists of the Calanus species (Aarflot et al., 2018). Thus, this species complex is central for the functioning in the ecosystem. Under the reference condition, the two Arctic Calanus species made up a significant part of the zooplankton community even in the Sub-Arctic part of the region where they are also important for predators (Sakshaug et al., 1994; Orlova et al., 2009).
The most important anthropogenic driver of change in the indicator is climate change. The Arctic Calanus species, in particular, are adapted to deal with the high environmental variability in ice-covered seas and the extreme seasonality in primary production at high latitudes. They have large lipid reserves, can reproduce independently of the phytoplankton bloom, utilize ice algal blooms, and have flexible multi-year life cycles (Falk-Petersen et al., 2009; Daase et al., 2013; Daase et al., 2021). Arctic species may have declined in the southern margins of their oceanic distribution range (Chust et al., 2014; Aarflot et al., 2018), while coastal populations of C. glacialis show stable population levels (Weydmann et al., 2014; Aarflot et al., 2018; Hop et al., 2019; Møller and Nielsen, 2020). A northwards shift has been observed concomitant with the retreat of sea ice in the Arctic Ocean (Ershova et al., 2021). The understanding of the link between driver and indicator is rated as certain.
The two Arctic Calanus species are larger and have a higher lipid content than the Atlantic species. Thus, a decline in biomass of the Arctic species may have large effects on many of the species feeding on zooplankton and Calanus in particular (Karnovsky et al., 2003; Steen et al., 2007; Rogachev et al., 2008; Dalpadado and Mowbray, 2013). A change towards lower biomass of Arctic species will likely alter the overturning and availability of energy in the pelagic ecosystem due to the smaller size, lower lipid content, and faster life cycle of Sub-Arctic species compared to Arctic congeners. For example, in the Bering Sea, an unprecedented warm and ice-free year led to an increase in small, low-lipid zooplankton with concurrent poor catches of pelagic fish, low reproductive success and mass mortality in seabird colonies (Duffy-Anderson et al., 2019). However, a boreal plankton life-history also brings a shorter generation time and faster population turnover, which may compensate for, or possibly enhance, the transfer of energy to predators (Renaud et al., 2018). Given the evidence from the Barents Sea, the understanding of the importance of changes in the indicator for other parts of the ecosystem is rated as good.
Declining biomass of Arctic Calanus species might be important for the marine ecosystem if, for example: i) the decrease is large relative to historic variation, ii) the magnitude of the decrease is similar to what has been observed in the North Sea, where it has caused substantial ecosystem changes and iii) there is a concurrent decrease in recruitment or survival or both of key predators such as pelagic amphipods and little auks.
Knowledge gaps include some uncertainty in species identification between C. finmarchicus and C. glacialis (Gabrielsen et al., 2012; Choquet et al., 2018). These species are traditionally separated based on size classes (Kwasniewski et al., 2003). Recent studies based on molecular methods have shown that there is a much larger overlap in size than previously assumed (Choquet et al., 2017), especially in Sub-Arctic/boreal Calanus populations that can lead to an underestimation of C. glacialis and overestimation of C. finmarchicus. Changes in species distribution patterns (historically and current observations) may thus be biased, although less so in the high-Arctic.
References
Choquet, M., Hatlebakk, M., Dhanasiri, A. K. S., Kosobokova, K., Smolina, I., Søreide, J. E., Svensen, C., et al. 2017. Genetics redraws pelagic biogeography of Calanus. Biology Letters, 13.
Choquet, M., Kosobokova, K., Kwaśniewski, S., Hatlebakk, M., Dhanasiri, A. K. S., Melle, W., Daase, M., et al. 2018. Can morphology reliably distinguish between the copepods Calanus finmarchicus and C. glacialis, or is DNA the only way? Limnology and Oceanography: Methods, 16: 237-252.
Chust, G., Castellani, C., Licandro, P., Ibaibarriaga, L., Sagarminaga, Y., and Irigoien, X. 2014. Are Calanus spp. shifting poleward in the North Atlantic? A habitat modelling approach. ICES Journal of Marine Science, 71: 241-253.
Conover, R. J. 1988. Comparative life histories in the genera Calanus and Neocalanus in high latitudes of the Northern Hemisphere. Hydrobiologia, 167: 127-142.
Dalpadado, P., and Mowbray, F. 2013. Comparative analysis of feeding ecology of capelin from two shelf ecosystems, off Newfoundland and in the Barents Sea. Progress in Oceanography, 114: 97-105.
Duffy-Anderson, J. T., Stabeno, P., Andrews III, A. G., Cieciel, K., Deary, A., Farley, E., Fugate, C., et al. 2019. Responses of the northern Bering Sea and southeastern Bering Sea pelagic ecosystems following record-breaking low winter sea ice. Geophysical Research Letters, 46: 9833-9842.
Daase, M., Berge, J., Søreide, J. E., and Falk-Petersen, S. 2021. Ecology of Arctic Pelagic Communities. In Arctic Ecology, pp. 219-259. Ed. by D. Thomas. John Wiley & Sons Ltd.
Daase, M., Falk-Petersen, S., Varpe, Ø., Darnis, G., Søreide, J. E., Wold, A., Leu, E., et al. 2013. Timing of reproductive events in the marine copepod Calanus glacialis : a pan-Arctic perspective. Canadian Journal of Fisheries and Aquatic Sciences, 70: 871-884.
Ershova, E. A., Kosobokova, K. N., Banas, N. S., Ellingsen, I., Niehoff, B., Hildebrandt, N., and Hirche, H.-J. 2021. Sea ice decline drives biogeographical shifts of key Calanus species in the central Arctic Ocean. Global Change Biology, 27: 2128-2143.
Falk-Petersen, S., Mayzaud, P., Kattner, G., and Sargent, J. R. 2009. Lipids and life strategy of Arctic Calanus. Marine Biology Research, 5: 18-39.
Gabrielsen, T. M., Merkel, B., Søreide, J. E., Johansson-Karlsson, E., Bailey, A., Vogedes, D., Nygård, H., et al. 2012. Potential misidentifications of two climate indicator species of the marine arctic ecosystem: Calanus glacialis and C. finmarchicus. Polar Biology, 35: 1621-1628.
Hirche, H.-J., and Kosobokova, K. 2007. Distribution of Calanus finmarchicus in the northern North Atlantic and Arctic Ocean—Expatriation and potential colonization. Deep Sea Research Part II, 54: 2729-2747.
Hop, H., Wold, A., Vihtakari, M., Daase, M., Kwasniewski, S., Gluchowska, M., Lischka, S., et al. 2019. Zooplankton in Kongsfjorden (1996–2016) in relation to climate change. In The Ecosystem of Kongsfjorden, Svalbard, pp. 229-300. Ed. by H. Hop, and C. Wiencke. Springer International Publishing, Cham.
Karnovsky, N. J., Kwaśniewski, S., Węsławski, J. M., Walkusz, W., and Beszczyńska-Möller, A. 2003. Foraging behavior of little auks in a heterogeneous environment. Marine Ecology Progress Series, 253: 289-303.
Kwasniewski, S., Hop, H., Falk-Petersen, S., and Pedersen, G. 2003. Distribution of Calanus species in Kongsfjorden, a glacial fjord in Svalbard. Journal of Plankton Research, 25: 1-20.
Melle, W., and Skjoldal, H. R. 1998. Reproduction and development of Calanus finmarchicus, C. glacialis and C. hyperboreus in the Barents Sea. Marine Ecology-Progress Series, 169: 211-228.
Møller, E. F., and Nielsen, T. G. 2020. Borealization of Arctic zooplankton—smaller and less fat zooplankton species in Disko Bay, Western Greenland. Limnology and Oceanography, 65: 1175-1188.
Orlova, E. L., Dolgov, A. V., Rudneva, G. B., Oganin, I. A., and Konstantinova, L. L. 2009. Trophic relations of capelin Mallotus villosus and polar cod Boreogadus saida in the Barents Sea as a factor of impact on the ecosystem. Deep-Sea Research Part Ii-Topical Studies in Oceanography, 56: 2054-2067.
Renaud, P. E., Daase, M., Banas, N. S., Gabrielsen, T. M., Soreide, J. E., Varpe, O., Cottier, F., et al. 2018. Pelagic food-webs in a changing Arctic: a trait-based perspective suggests a mode of resilience. ICES Journal of Marine Science, 75: 1871-1881.
Rogachev, K. A., Carmack, E. C., and Foreman, M. G. G. 2008. Bowhead whales feed on plankton concentrated by estuarine and tidal currents in Academy Bay, Sea of Okhotsk. Continental Shelf Research, 28: 1811-1826.
Sakshaug, E., Bjørge, A., Gulliksen, B., Loeng, H., and Mehlum, F. 1994. Structure, biomass distribution, and energetics of the pelagic ecosystem in the Barents Sea: A synopsis. Polar Biology, 14: 405-411.
Steen, H., Vogedes, D., Broms, F., Falk-Petersen, S., and Berge, J. 2007. Little auks (Alle alle) breeding in a High Arctic fjord system: bimodal foraging strategies as a response to poor food quality? Polar Research, 26: 118-125.
Tande, K. S. 1991. Calanus in North Norwegian fjords and in the Barents Sea. Polar Research, 10: 389-408.
Weydmann, A., Carstensen, J., Goszczko, I., Dmoch, K., Olszewska, A., and Kwasniewski, S. 2014. Shift towards the dominance of boreal species in the Arctic: inter-annual and spatial zooplankton variability in the West Spitsbergen Current. Marine Ecology Progress Series, 501: 41-52.
Aarflot, J. M., Skjoldal, H. R., Dalpadado, P., and Skern-Mauritzen, M. 2018. Contribution of Calanus species to the mesozooplankton biomass in the Barents Sea. ICES Journal of Marine Science, 75: 2342-2354.
Atlantic Calanus [SI20]
Phenomenon: Increasing abundance of Atlantic Calanus species [SP20]
Ecosystem characteristic: Functionally important species and biophysical structures
A general description of the Calanus species under the reference condition is given in the phenomenon text for the indicator for Arctic Calanus [SP19]. Under the reference condition, C. finmarchicus is important for sustaining populations of predators in the Sub-Arctic part of the Barents Sea, such as 0 group fish, pelagic zooplankton feeding fish and carnivorous krill (Schmidt, 2010; Dalpadado and Mowbray, 2013; Eriksen et al., 2020; ICES, 2020).
The most important anthropogenic driver of change in the indicator is climate change. The Arctic Calanus species are adapted to the high environmental variability in ice-covered seas with prolonged life cycles, large body size with lipid reserves and overall flexible multi-year life cycles (Falk-Petersen et al., 2009; Daase et al., 2013; Daase et al., 2021). Calanus finmarchicus on the other hand, have smaller lipid reserves, rely on the open-water phytoplankton bloom as their main food source to fuel reproduction, growth and development, and must complete their life cycle in a single year (Jónasdóttir et al., 2002; Melle et al., 2014). While C. finmarchicus is constantly advected to the Arctic/northern Barents Sea with northward flowing Atlantic currents (Wassmann et al., 2015), this species seems to be incapable of Arctic residency over multiple generations (Melle et al., 2014). A late start of the algal bloom and short growing season, as well as slow development rates at low Arctic temperatures, impair the ability of C. finmarchicus to reach late developmental stages that can pack their lipid sacs sufficiently to overwinter successfully and reproduce the following spring (Ji et al., 2012; Melle et al., 2014). Looking over both the Norwegian and Russian parts of the Barents Sea, the habitat area of boreal-Atlantic species has increased in the Sub-Arctic and Arctic regions (increase in Atlantic water masses; (ICES, 2020)) in addition to increased primary production due to warming observed between 1998 and 2017 (more open water due to less ice; (Dalpadado et al., 2020)) providing good growth conditions for C. finmarchicus. With loss of sea ice, bloom phenology is expected to change (earlier, longer blooms) (Song et al., 2021), and increased temperature may accelerate developmental rates, thus C. finmarchicus may become more successful in surviving and establishing itself at higher latitudes. Indeed, increased habitat suitability has recently been demonstrated for C. finmarchicus in areas that were previously ice covered (Freer et al., 2021; Traling et al., 2021), and C. finmarchicus has recently undergone a poleward distributional shift (Chust et al., 2014), increasing its contribution to the total Calanus community biomass in several Arctic regions (Weydmann et al., 2014; Aarflot et al., 2018; Møller and Nielsen, 2020; Hop et al., 2021). Given the extensive knowledge basis on the influence on climate variation on occurrence of Calanus species, the understanding of the link between driver and indicator is rated as certain.
The two arctic Calanus species are larger and have higher lipid content than the Atlantic C. finmarchicus species. Thus, a change towards a dominance of the Atlantic species may have large effects on many of the species feeding on zooplankton and larger Calanus in particular (Karnovsky et al., 2003; Steen et al., 2007; Rogachev et al., 2008). A change towards C. finmarchicus will likely alter the overturning and availability of energy in the pelagic ecosystem due to their smaller size, lower lipid content, and faster life cycle compared to Arctic congeners. For example, in the Bering Sea, an unprecedented warm and ice-free year led to an increase in small, low-lipid zooplankton and concurrent poor catches of pelagic fish, low reproductive success and mass mortality at seabird colonies (Duffy-Anderson et al., 2019). However, a C. finmarchicus-like life history also brings a shorter generation time and faster population turnover, which may compensate or even enhance the transfer of energy to predators (Renaud et al., 2018). Biogeographical shifts in the Calanus community observed in the North Sea illustrate possible consequences of changes in the Arctic Barents Sea. There, a change towards more southern zooplankton species, including change in relative abundance from Calanus finmarchicus (a northern species there) towards Calanus helgolandicus (southern species) has been related to changes in water temperature (Planque and Fromentin, 1996; Beaugrand, 2004; Jónasdóttir et al., 2005; Beaugrand et al., 2014). Changes in distribution and abundance of C. finmarchicus have been related to the low recruitment observed in several fish populations (Beaugrand and Kirby, 2010; Clausen et al., 2018). The shift towards more southern species also contributes to a lower production of zooplankton in general (Edwards et al., 2016), which is expected to impact not only the recruitment of fish but the whole fish community, especially planktivorous species (Clausen et al., 2018). Changes in the zooplankton community are likely one of the causes for the decreased production in several fish stocks (ICES, 2016; Clausen et al., 2018). Given the evidence from both the Barents Sea and the North Sea, the understanding of importance of changes in the indicator for other parts of the ecosystem is rated as good.
Increasing the proportion of Atlantic Calanus species can be considered important for the ecosystem if, for example, i) the increase is large relative to historic variation, ii) the magnitude of the increase is similar to what has been observed for Calanus helgolandicus in the North Sea, where it caused significant ecosystem changes or iii) reduced pelagic fish production and/or reduced seabird recruitment and survival take place, as has been seen in the Bering Sea.
Knowledge gaps related to this phenomenon include some uncertainty in species identification between C. finmarchicus and C. glacialis (Gabrielsen et al., 2012; Choquet et al., 2018). These species are traditionally separated based on size classes. Recent studies based on molecular methods have shown that there is larger overlap in size than previously assumed (Choquet et al., 2017), especially in Sub-Arctic/boreal Calanus populations that can lead to an underestimation of C. glacialis and overestimation of C. finmarchicus. Changes in species distribution patterns (historically and current observations) are therefore likely biased.
References
Beaugrand, G. 2004. The North Sea regime shift: evidence, causes, mechanisms and consequences. Progress in Oceanography, 60: 245-262.
Beaugrand, G., Harlay, X., and Edwards, M. 2014. Detecting plankton shifts in the North Sea: a new abrupt ecosystem shift between 1996 and 2003. Marine Ecology Progress Series, 502: 85-104.
Beaugrand, G., and Kirby, R. R. 2010. Climate, plankton and cod. Global Change Biology, 16: 1268-1280.
Choquet, M., Hatlebakk, M., Dhanasiri, A. K. S., Kosobokova, K., Smolina, I., Søreide, J. E., Svensen, C., et al. 2017. Genetics redraws pelagic biogeography of Calanus. Biology Letters, 13.
Choquet, M., Kosobokova, K., Kwaśniewski, S., Hatlebakk, M., Dhanasiri, A. K. S., Melle, W., Daase, M., et al. 2018. Can morphology reliably distinguish between the copepods Calanus finmarchicus and C. glacialis, or is DNA the only way? Limnology and Oceanography: Methods, 16: 237-252.
Chust, G., Castellani, C., Licandro, P., Ibaibarriaga, L., Sagarminaga, Y., and Irigoien, X. 2014. Are Calanus spp. shifting poleward in the North Atlantic? A habitat modelling approach. ICES Journal of Marine Science, 71: 241-253.
Clausen, L., Rindorf, A., Deurs, M., Dickey‐Collas, M., Hintzen, N. T., and Arlinghaus, R. 2018. Shifts in North Sea forage fish productivity and potential fisheries yield. Journal of Applied Ecology, 55: 1092-1101.
Conover, R. J. 1988. Comparative life histories in the genera Calanus and Neocalanus in high latitudes of the Northern Hemisphere. Hydrobiologia, 167: 127-142.
Dalpadado, P., Arrigo, K. R., van Dijken, G. L., Skjoldal, H. R., Bagøien, E., Dolgov, A., Prokopchuk, I., et al. 2020. Climate effects on temporal and spatial dynamics of phytoplankton and zooplankton in the Barents Sea. Progress in Oceanography, 185: 102320.
Dalpadado, P., and Mowbray, F. 2013. Comparative analysis of feeding ecology of capelin from two shelf ecosystems, off Newfoundland and in the Barents Sea. Progress in Oceanography, 114: 97-105.
Duffy-Anderson, J. T., Stabeno, P., Andrews III, A. G., Cieciel, K., Deary, A., Farley, E., Fugate, C., et al. 2019. Responses of the northern Bering Sea and southeastern Bering Sea pelagic ecosystems following record-breaking low winter sea ice. Geophysical Research Letters, 46: 9833-9842.
Daase, M., Berge, J., Søreide, J. E., and Falk-Petersen, S. 2021. Ecology of Arctic Pelagic Communities. In Arctic Ecology, pp. 219-259. Ed. by D. Thomas. John Wiley & Sons Ltd.
Daase, M., Falk-Petersen, S., Varpe, Ø., Darnis, G., Søreide, J. E., Wold, A., Leu, E., et al. 2013. Timing of reproductive events in the marine copepod Calanus glacialis : a pan-Arctic perspective. Canadian Journal of Fisheries and Aquatic Sciences, 70: 871-884.
Edwards, M., Helaouet, P., Alhaija, R. A., Batten, S., Beaugrand, G., Chiba, S., Horaeb, R. R., et al. 2016. Global Marine Ecological Status Report: results from the global CPR Survey 2014/2015. SAHFOS Technical Report, 11: 1-32. Plymouth, U.K. ISSN 1744-0750.
Eriksen, E., Benzik, A. N., Dolgov, A. V., Skjoldal, H. R., Vihtakari, M., Johannesen, E., Prokhorova, T. A., et al. 2020. Diet and trophic structure of fishes in the Barents Sea: The Norwegian-Russian program “Year of stomachs” 2015 – Establishing a baseline. Progress in Oceanography, 183: 102262.
Falk-Petersen, S., Mayzaud, P., Kattner, G., and Sargent, J. R. 2009. Lipids and life strategy of Arctic Calanus. Marine Biology Research, 5: 18-39.
Freer JJ, Daase M, Tarling GA (2021) Modelling the biogeographic boundary shift of Calanus finmarchicus reveals drivers of Arctic Atlantification by subarctic zooplankton. Glob Change Biol 28:429-440. doi:https://doi.org/10.1111/gcb.15937
Gabrielsen, T. M., Merkel, B., Søreide, J. E., Johansson-Karlsson, E., Bailey, A., Vogedes, D., Nygård, H., et al. 2012. Potential misidentifications of two climate indicator species of the marine arctic ecosystem: Calanus glacialis and C. finmarchicus. Polar Biology, 35: 1621-1628.
Hirche, H.-J., and Kosobokova, K. 2007. Distribution of Calanus finmarchicus in the northern North Atlantic and Arctic Ocean—Expatriation and potential colonization. Deep Sea Research Part II, 54: 2729-2747.
Hop, H., Wold, A., Meyer, A., Bailey, A., Hatlebakk, M., Kwasniewski, S., Leopold, P., et al. 2021. Winter-spring development of the zooplankton community below sea ice in the Arctic Ocean. Frontiers in Marine Science, 8: 609480.
ICES. 2016. Greater North Sea Ecoregion – Ecosystem overview. Version 2. ICES Advice 2016, Book 6.
ICES. 2020. Working Group on the Integrated Assessments of the Barents Sea (WGIBAR). ICES Scientific Reports. 2:30. 206 pp.
Ji, R. B., Ashjian, C. J., Campbell, R. G., Chen, C. S., Gao, G. P., Davis, C. S., Cowles, G. W., et al. 2012. Life history and biogeography of Calanus copepods in the Arctic Ocean: An individual-based modeling study. Progress in Oceanography, 96: 40-56.
Jónasdóttir, S., Gudfinnsson, H., Gislason, A., and Astthorsson, O. 2002. Diet composition and quality for Calanus finmarchicus egg production and hatching success off south-west Iceland. Marine Biology, 140: 1195-1206.
Jónasdóttir, S. H., Trung, N. H., Hansen, F., and Gärtner, S. 2005. Egg production and hatching success in the calanoid copepods Calanus helgolandicus and Calanus finmarchicus in the North Sea from March to September 2001. Journal of Plankton Research, 27: 1239-1259.
Karnovsky, N. J., Kwaśniewski, S., Węsławski, J. M., Walkusz, W., and Beszczyńska-Möller, A. 2003. Foraging behavior of little auks in a heterogeneous environment. Marine Ecology Progress Series, 253: 289-303.
Melle, W., Runge, J., Head, E., Plourde, S., Castellani, C., Licandro, P., Pierson, J., et al. 2014. The North Atlantic Ocean as habitat for Calanus finmarchicus : Environmental factors and life history traits. Progress in Oceanography, 129: 244-284.
Melle, W., and Skjoldal, H. R. 1998. Reproduction and development of Calanus finmarchicus, C. glacialis and C. hyperboreus in the Barents Sea. Marine Ecology-Progress Series, 169: 211-228.
Møller, E. F., and Nielsen, T. G. 2020. Borealization of Arctic zooplankton—smaller and less fat zooplankton species in Disko Bay, Western Greenland. Limnology and Oceanography, 65: 1175-1188.
Planque, B., and Fromentin, J. M. 1996. Calanus and environment in the eastern North Atlantic. I. Spatial and temporal patterns of C. finmarchicus and C. helgolandicus. Marine Ecology Progress Series, 134: 101-109.
Renaud, P. E., Daase, M., Banas, N. S., Gabrielsen, T. M., Soreide, J. E., Varpe, O., Cottier, F., et al. 2018. Pelagic food-webs in a changing Arctic: a trait-based perspective suggests a mode of resilience. ICES Journal of Marine Science, 75: 1871-1881.
Rogachev, K. A., Carmack, E. C., and Foreman, M. G. G. 2008. Bowhead whales feed on plankton concentrated by estuarine and tidal currents in Academy Bay, Sea of Okhotsk. Continental Shelf Research, 28: 1811-1826.
Schmidt, K. 2010. Chapter Five - Food and Feeding in Northern Krill (Meganyctiphanes norvegica Sars). In Advances in Marine Biology, pp. 127-171. Ed. by G. A. Tarling. Academic Press.
Song, H., Ji, R., Jin, M., Li, Y., Feng, Z., Varpe, Ø., and Davis, C. S. 2021. Strong and regionally distinct links between ice-retreat timing and phytoplankton production in the Arctic Ocean. Limnology and Oceanography, n/a.
Steen, H., Vogedes, D., Broms, F., Falk-Petersen, S., and Berge, J. 2007. Little auks (Alle alle) breeding in a High Arctic fjord system: bimodal foraging strategies as a response to poor food quality? Polar Research, 26: 118-125.
Tande, K. S. 1991. Calanus in North Norwegian fjords and in the Barents Sea. Polar Research, 10: 389-408.
Tarling GA, Freer JJ, Banas NS, Belcher A, Blackwell M, Castellani C, Cook KB, Cottier FR, Daase M, Johnson ML, Last KS, Lindeque PK, Mayor DJ, Mitchell E, Parry HE, Speirs DC, Stowasser G, Wootton M (2021) Can a key boreal Calanus copepod species now complete its life-cycle in the Arctic? Evidence and implications for Arctic food-webs. Ambio 51:333–344. doi:10.1007/s13280-021-01667-y
Wassmann, P., Kosobokova, K. N., Slagstad, D., Drinkwater, K. F., Hopcroft, R. R., Moore, S. E., Ellingsen, I., et al. 2015. The contiguous domains of Arctic Ocean advection: Trails of life and death. Progress in Oceanography, 139: 42-65.
Weydmann, A., Carstensen, J., Goszczko, I., Dmoch, K., Olszewska, A., and Kwasniewski, S. 2014. Shift towards the dominance of boreal species in the Arctic: inter-annual and spatial zooplankton variability in the West Spitsbergen Current. Marine Ecology Progress Series, 501: 41-52.
Aarflot, J. M., Skjoldal, H. R., Dalpadado, P., and Skern-Mauritzen, M. 2018. Contribution of Calanus species to the mesozooplankton biomass in the Barents Sea. ICES Journal of Marine Science, 75: 2342-2354.
Krill [SI21]
Phenomenon: Increasing biomass of krill [SP21]
Ecosystem characteristic: Functionally important species and biophysical structures
Under the reference condition, krill made up an important component of the zooplankton community in the Sub-Arctic part of the Barents Sea. Several boreal and Sub-Arctic species contribute to the krill community, in particular Thysanessa inermis, T. raschii, T. longicaudata and Meganyctiphanes norvegica (Dalpadado and Skjoldal, 1991). Thysanoessa inermis and T. longicaudata are likely dominant species and are found mainly in Atlantic Water, not penetrating far into Arctic waters. Thysanoessa raschii is only common in the shallow waters of the eastern Barents Sea and is not a common species in the Norwegian sector of the Sub-Arctic Barents Sea. The largest of the krill species, M. norvegica, is restricted to the core area of Atlantic Water in the west (Dalpadado and Skjoldal, 1996). Krill is important prey for several predators, including cod, capelin, redfish and a number of other species as well as seabirds and harp seals (Planque et al., 2014; Eriksen et al., 2020; ICES, 2020).
The most important anthropogenic driver of change in the indicator is climate change. Time series analyses (1980-2015) of boreal krill from the entire Barents Sea have shown that warming and reduced ice cover have had positive effects on krill biomass (Stige et al., 2019). Other studies have shown that the Atlantic boreal M. norvegica, which was almost absent during cooler periods during 1970-1990’s, has reentered the Barents Sea following warming over the last two decades (Zhukova et al., 2009; Eriksen et al., 2017; ICES, 2019). After a nearly 30-year long absence, the sub-tropical Nematoscelis megalops was again observed in early 2000s in the Barents Sea (Zhukova et al., 2009). The robust evidence for the effects of climate change implies that the understanding of the link between driver and indicator is rated as certain.
As outlined above, krill are an important part of the diet of many ecological and commercially important fish species in the Barents Sea and for other groups of predators such as seabirds and whales (ICES, 2020). Krill have been shown to be important for growth of capelin, and krill stock size may be controlled by predator stock size, especially capelin (Dalpadado and Skjoldal, 1996; Gjøsæter et al., 2002). Krill lipids are important for adult capelin growth (Orlova et al., 2010). Different krill species are likely to function differently as prey. The largest species, M. norvegica, is twice the size of the Thysanoessa species, implying that a single individual of the former will contribute with significantly more biomass and lipids than individuals of the smaller species. Given the substantial knowledge about predator-prey dynamics and the importance of krill as prey, the understanding of the importance of changes in the indicator for other parts of the ecosystem is rated as good.
A significant increase in krill biomass in the Sub-Arctic part of the Barents Sea will provide higher availability of food for a number of predators, thus affecting the dynamics of a large part of the ecosystem. Increase in abundance of important predators may be the result, exemplified by the recent growth of the cod stock (Kjesbu et al., 2014). This may also initiate changes in the structure of entire food webs (Kortsch et al., 2015). If the carnivorous M. norvegica becomes relatively more abundant than the more herbivorous/omnivorous krill species, feeding chains from phytoplankton to fish and birds may be lengthened, with implication for energy transfer to higher trophic levels. It should be noted that there is still no evidence that M. norvegica reproduces in the Barents Sea.
An important knowledge gap is the lack of quantitative systematic monitoring of species composition of the krill community.
References
Dalpadado, P., and Skjoldal, H. R. 1991. Distribution and life-history of krill from the Barents Sea. Polar Research, 10: 443-460.
Dalpadado, P., and Skjoldal, H. R. 1996. Abundance, maturity and growth of the krill species Thysanoessa inermis and T. longicaudata in the Barents Sea. Marine Ecology Progress Series, 144: 175-183.
Eriksen, E., Benzik, A. N., Dolgov, A. V., Skjoldal, H. R., Vihtakari, M., Johannesen, E., Prokhorova, T. A., et al. 2020. Diet and trophic structure of fishes in the Barents Sea: The Norwegian-Russian program “Year of stomachs” 2015 – Establishing a baseline. Progress in Oceanography, 183: 102262.
Eriksen, E., Skjoldal, H. R., Gjøsæter, H., and Primicerio, R. 2017. Spatial and temporal changes in the Barents Sea pelagic compartment during the recent warming. Progress in Oceanography, 151: 206-226.
Gjøsæter, H., Dalpadado, P., and Hassel, A. 2002. Growth of Barents Sea capelin (Mallotus villosus) in relation to zooplankton abundance. ICES Journal of Marine Science, 59: 959-967.
ICES. 2019. The Working Group on the Integrated Assessments of the Barents Sea (WGIBAR). ICES Scientific Reports. 1:42. 157 pp.
ICES. 2020. Working Group on the Integrated Assessments of the Barents Sea (WGIBAR). ICES Scientific Reports. 2:30. 206 pp.
Kjesbu, O. S., Bogstad, B., Devine, J. A., Gjøsæter, H., Howell, D., Ingvaldsen, R. B., Nash, R. D. M., et al. 2014. Synergies between climate and management for Atlantic cod fisheries at high latitudes. Proceedings of the National Academy of Sciences of the United States of America, 111: 3478-3483.
Kortsch, S., Primicerio, R., Fossheim, M., Dolgov, A. V., and Aschan, M. 2015. Climate change alters the structure of arctic marine food webs due to poleward shifts of boreal generalists. Proceedings of the Royal Society B-Biological Sciences, 282: 31-39.
Orlova, E. L., Rudneva, G. B., Renaud, P. E., Eiane, K., Savinov, V. M., and Yurko, A. S. 2010. Climate impacts on feeding and condition of capelin Mallotus villosus in the Barents Sea: evidence and mechanisms from a 30 year data set. Aquatic Biology, 10: 105-118.
Planque, B., Primicerio, R., Michalsen, K., Aschan, M., Certain, G., Dalpadado, P., Gjøsæter, H., et al. 2014. Who eats whom in the Barents Sea: a food web topology from plankton to whales. Ecology, 95: 1430-1430.
Stige, L. C., Eriksen, E., Dalpadado, P., and Ono, K. 2019. Direct and indirect effects of sea ice cover on major zooplankton groups and planktivorous fishes in the Barents Sea. ICES Journal of Marine Science, 76: I24-I36.
Zhukova, N. G., Nesterova, V. N., Prokopchuk, I. P., and Rudneva, G. B. 2009. Winter distribution of euphausiids (Euphausiacea) in the Barents Sea (2000–2005). Deep Sea Research Part II, 56: 1959-1967.
Capelin [SI22]
Phenomenon: Decreasing biomass of the capelin stock [SP22]
Ecosystem characteristic: Functionally important species and biophysical structures
Under the reference condition, long-term population size of capelin is high enough to support viable populations of predators dependent on capelin (e.g., NEA cod, humpback whales, harp seals, puffins, and common murre). However, based on the life history of capelin being short lived and semelparous, it is likely that the capelin population size undergoes large fluctuations also under the reference condition (Gjøsæter, 1998). The capelin population in the Barents Sea has been heavily exploited since the mid-60s, while regular monitoring started in 1972. In addition, the population is heavily affected by Arctic cod, Norwegian spring spawning herring and marine mammals which have been exploited by humans long before that.
The most important anthropogenic driver of change in this indicator today is climate change. Climate change may significantly alter distribution of capelin (Rose, 2005), affect recruitment, and also the strength of the impact of key predators on capelin. Direct effects of warming that can be expected is a northward expansion during feeding which has already been observed (Carscadden et al., 2013), and possibly the use of spawning grounds further north as temperatures increase (Rose, 2005). Climate change is expected to lead to increased productivity in the pelagic zone in Arctic seas (Primary production phenomenon [AP1]), and changes in the zooplankton community composition (Zooplankton phenomena [AP3, AP15, AP25, AP26]), which can have both positive and negative effects on the capelin population (Dalpadado and Mowbray, 2013; Renaud et al., 2018; Duffy-Anderson et al., 2019). The capelin biomass is also strongly and directly affected by other ecosystem components such as Norwegian spring spawning herring, negatively affecting recruitment by feeding on capelin larvae (Gjøsæter and Bogstad, 1998; Huse and Toresen, 2000), and North East Arctic cod, feeding on adult capelin (Johannesen et al., 2012; Fall et al., 2018; Holt et al., 2019). Climate change is expected to lead to a northward expansion of NSS herring spawning possibly increasing the overlap with capelin larvae thereby reducing recruitment success (Gjøsæter and Bogstad, 1998). Similarly, the climate-change related increased distribution of cod may enhance predation pressure on capelin (Fall et al., 2018). These indirect effects of climate change on capelin may be more important drivers of capelin biomass than direct effects, and the net consequences of a warmer ocean for capelin are uncertain. The knowledge about the link to climate change is therefore assessed as less certain.
Fisheries have been an important anthropogenic driver of change in the past for capelin with particularly high harvest level in the 1970s and 1980s (Gjøsæter, 1998). A precautionary management regime in place for capelin where the fishery is only allowed to target a surplus of mature capelin after a proportion is allowed to spawn and after predator consumption (Gjøsæter et al., 2015). With this management regime, the fishery is not expected to be a strong driver of change in capelin biomass. The understanding of the link to fisheries is assessed as certain.
Capelin play a key role in the Sub-Arctic part of the Barents Sea as the most important mid-trophic level species efficiently making energy from plankton available to top-predators (Dolgov, 2002; Orlova et al., 2009). In particular NEA cod is dependent upon capelin for sustaining its high abundance. Capelin is also a key diet items for whales, several seabird species, harp seals and other fish species (Dolgov, 2002). There is also evidence that capelin can inflict top-down effects on its zooplankton prey (Hassel et al., 1991; Dalpadado and Skjoldal, 1996). The capelin population in the Barents Sea has undergone strong fluctuations including collapse periods during the period of monitoring from 1973-present (Gjøsæter et al., 2009). The two collapse periods in the mid-80s and 90s were particularly severe, and in particular the first of these likely lead to a range of cascade effects in the Barents Sea ecosystem, including recruitment failures in seabirds and harp seals and cannibalism and hampered growth in cod (Gjøsæter et al., 2009). The later collapses did not have as severe impacts on the ecosystem (Johannesen et al., 2012). The reason for this is likely the higher abundance of alternative prey in these periods (Gjøsæter et al., 2009). The understanding of the impact of changes in the biomass of capelin on the ecosystem is assessed as good.
Decreasing capelin stock biomass can be considered of ecosystem significance if, for example, i) lack of food affects breeding success in seabirds, distribution of marine mammals or growth and cannibalism in cod (Gjøsæter et al., 2009).
Knowledge gaps:
Capelin has large natural variation in recruitment, which is important for the stock development. It is known that predation by young herring may strongly influence the capelin recruitment, but not much is known about how change in the population of other predators such as whales may influence recruitment. There is also a lack of knowledge about potential change in predation pressure and survival at other life stages.
References
Carscadden, J. E., Gjøsæter, H., and Vilhjálmsson, H. 2013. A comparison of recent changes in distribution of capelin (Mallotus villosus) in the Barents Sea, around Iceland and in the Northwest Atlantic. Progress in Oceanography, 114: 64-83.
Dalpadado, P., and Mowbray, F. 2013. Comparative analysis of feeding ecology of capelin from two shelf ecosystems, off Newfoundland and in the Barents Sea. Progress in Oceanography, 114: 97-105.
Dalpadado, P., and Skjoldal, H. R. 1996. Abundance, maturity and growth of the krill species Thysanoessa inermis and T-longicaudata in the Barents Sea. Marine Ecology Progress Series, 144: 175-183.
Dolgov, A. V. 2002. The role of capelin (Mallotus villosus) in the foodweb of the Barents Sea. ICES Journal of Marine Science, 59: 1034-1045.
Duffy-Anderson, J. T., Stabeno, P., Andrews, A. G., Cieciel, K., Deary, A., Farley, E., Fugate, C., et al. 2019. Responses of the northern Bering Sea and southeastern Bering Sea pelagic ecosystems following record-breaking low winter sea ice. Geophysical Research Letters, 46: 9833-9842.
Fall, J., Ciannelli, L., Skaret, G., and Johannesen, E. 2018. Seasonal dynamics of spatial distributions and overlap between Northeast Arctic cod (Gadus morhua) and capelin (Mallotus villosus) in the Barents Sea. Plos One, 13: e0205921.
Gjøsæter, H. 1998. The population biology and exploitation of capelin (Mallotus villosus) in the Barents Sea. Sarsia, 83: 453-496.
Gjøsæter, H., and Bogstad, B. 1998. Effects of the presence of herring (Clupea harengus) on the stock-recruitment relationship of Barents Sea capelin (Mallotus villosus). Fisheries Research, 38: 57-71.
Gjøsæter, H., Bogstad, B., and Tjelmeland, S. 2009. Ecosystem effects of the three capelin stock collapses in the Barents Sea. Marine Biology Research, 5: 40-53.
Gjøsæter, H., Bogstad, B., Tjelmeland, S., and Subbey, S. 2015. A retrospective evaluation of the Barents Sea capelin management advice. Marine Biology Research, 11: 135-143.
Hassel, A., Skjoldal, H. R., Gjøsæter, H., Loeng, H., and Omli, L. 1991. Impact of grazing from capelin (Mallotus villosus) on zooplankton: a case study in the northern Barents Sea in August 1985. Polar Research, 10: 371-388.
Holt, R. E., Bogstad, B., Durant, J. M., Dolgov, A. V., and Ottersen, G. 2019. Barents Sea cod (Gadus morhua) diet composition: long-term interannual, seasonal, and ontogenetic patterns. ICES Journal of Marine Science, 76: 1641-1652.
Huse, G., and Toresen, R. 2000. Juvenile herring prey on Barents Sea capelin larvae. Sarsia, 85: 385-391.
Johannesen, E., Lindström, U., Michalsen, K., Skern-Mauritzen, M., Fauchald, P., Bogstad, B., and Dolgov, A. 2012. Feeding in a heterogeneous environment: spatial dynamics in summer foraging Barents Sea cod. Marine Ecology Progress Series, 458: 181-197.
Orlova, E. L., Dolgov, A. V., Rudneva, G. B., Oganin, I. A., and Konstantinova, L. L. 2009. Trophic relations of capelin Mallotus villosus and polar cod Boreogadus saida in the Barents Sea as a factor of impact on the ecosystem. Deep-Sea Research Part Ii-Topical Studies in Oceanography, 56: 2054-2067.
Renaud, P. E., Daase, M., Banas, N. S., Gabrielsen, T. M., Soreide, J. E., Varpe, O., Cottier, F., et al. 2018. Pelagic food-webs in a changing Arctic: a trait-based perspective suggests a mode of resilience. ICES Journal of Marine Science, 75: 1871-1881.
Rose, G. A. 2005. Capelin (Mallotus villosus) distribution and climate: a sea "canary" for marine ecosystem change. ICES Journal of Marine Science, 62: 1524-1530.
Cod [SI23]
Phenomenon: Change in cod total stock size [SP23]
Ecosystem characteristic: Functionally important species and biophysical structures
Under the reference condition, long-term population size of North East Arctic cod is high enough to help supporting top predators on adult fish such as minke whales and harp seals, and also to produce large quantities of larvae and 0-group cod, which are important as food for other organisms in the ecosystem (Eriksen et al., 2011). It is difficult to know how the state of the NEA cod stock was under reference conditions, as it had been exploited by humans for many centuries. However, the impact of the relatively limited fisheries before ca 1900 on this stock was probably moderate.
The most important anthropogenic drivers of change in this indicator are fisheries and climate change (Kjesbu et al., 2014). The NEA cod stock has been exploited by humans for many centuries and was considered to be overharvested from the 1950s onwards (except for a few years in the early 1990s). However, since 2007 the fisheries have been regulated by a more precautionary management regime, and the NEA cod stock has recovered to a high level. The pressure from fisheries on the NEA cod stock is currently regulated through fishing quotas set in cooperation with Russia.
Climate change with warmer temperatures will increase the available feeding area for cod in the Barents Sea. This is suggested as one of the reasons for the increasing density of cod in the northern Barents Sea (Johansen et al., 2013; Kjesbu et al., 2014; Fossheim et al., 2015). In addition, cod recruitment is positively related to temperature (e.g. Bogstad et al., 2013). The maximal distribution area was observed in 2013, and expansion possibilities outside the area occupied that year are fairly limited as cod is not likely to migrate further northwards as deep waters outside the shelf are not suitable for cod. However, some further expansion to the northeast into the northern Kara Sea is possible if the warming continues. The understanding of the links to these drivers are assessed as certain.
The cod is a central species in the Barents Sea ecosystem, with many interactions to other organisms in the ecosystem (Kortsch et al., 2015). The cod is an important predator on many fish and shellfish species such as capelin, herring, haddock, shrimp, snow crab, polar cod etc. (see e.g. Dolgov et al., 2011; Holt et al., 2019) and thus changes in the abundance of cod affect the status of these prey species. It is also a competitor with marine mammals as top predators in the ecosystem (Bogstad et al., 2015). Cod are also important as food for other predators, both as larvae and 0-group cod and adults (e.g. Bogstad et al., 2000; Eriksen et al., 2011). It should also be noted that Barents Sea cod is cannibalistic (Yaragina et al., 2009) and thus to some extent regulates itself. The cod is the dominant piscivorous fish species in the Barents Sea, and there is no other fish species which can fill that role if cod abundance becomes very low. The understanding of the effect of changes in this indicator on the ecosystem is assessed as good. However, effects of changes in the cod abundance on their prey are more studied than effects on their predators. Weak density-dependence in growth of older (mature) cod, was observed in the 2010s when cod abundance was high (ICES, 2020).
Changes in the cod stock biomass can be considered of ecosystem significance if, for example, i) Increasing predation from a larger cod population causes declines in important prey populations in the Sub-Arctic Barents Sea. ii) Declining cod population has a negative effect on predators on cod eggs and larvae.
Knowledge gaps:
Effects on predators of changes in cod abundance are an important knowledge gap. Also, cod abundance has fortunately never been so low that we have any clues about how a ‘cod-less’ ecosystem in the Barents Sea would function.
References
Bogstad, B., Dingsør, G. E., Ingvaldsen, R. B., and Gjøsæter, H. 2013. Changes in the relationship between sea temperature and recruitment of cod, haddock and herring in the Barents Sea. Marine Biology Research, 9: 895-907.
Bogstad, B., Gjøsæter, H., Haug, T., and Lindström, U. 2015. A review of the battle for food in the Barents Sea: cod vs. marine mammals. Frontiers in Ecology and Evolution, 3.
Bogstad, B., Haug, T., and Mehl, S. 2000. Who eats whom in the Barents Sea? NAMMCO Sci. Publ., 2: 98-119.
Dolgov, A. V., Orlova, E. L., Johannesen, E., and Bogstad, B. 2011. Piscivorous fish. Chapter 8.4. In The Barents Sea. Ecosystem, resources, management. Half a century of Russian-Norwegian cooperation., pp. 466-484. Ed. by T. Jakobsen, and V. K. Ozhigin. Tapir Academic Press.
Eriksen, E., Bogstad, B., and Nakken, O. 2011. Ecological significance of 0-group fish in the Barents Sea ecosystem. Polar Biology, 34: 647-657.
Fossheim, M., Primicerio, R., Johannesen, E., Ingvaldsen, R. B., Aschan, M. M., and Dolgov, A. V. 2015. Recent warming leads to a rapid borealization of fish communities in the Arctic. Nature Climate Change, 5: 673-677.
Holt, R. E., Bogstad, B., Durant, J. M., Dolgov, A. V., and Ottersen, G. 2019. Barents Sea cod (Gadus morhua) diet composition: long-term interannual, seasonal, and ontogenetic patterns. ICES Journal of Marine Science, 76: 1641-1652.
ICES. 2020. Arctic Fisheries Working Group (AFWG). 2:52. 577 pp.
Johansen, G. O., Johannesen, E., Michalsen, K., Aglen, A., and Fotland, Å. 2013. Seasonal variation in geographic distribution of North East Arctic (NEA) cod - survey coverage in a warmer Barents Sea. Marine Biology Research, 9: 908-919.
Kjesbu, O. S., Bogstad, B., Devine, J. A., Gjøsæter, H., Howell, D., Ingvaldsen, R. B., Nash, R. D. M., et al. 2014. Synergies between climate and management for Atlantic cod fisheries at high latitudes. Proceedings of the National Academy of Sciences of the United States of America, 111: 3478-3483.
Kortsch, S., Primicerio, R., Fossheim, M., Dolgov, A. V., and Aschan, M. 2015. Climate change alters the structure of arctic marine food webs due to poleward shifts of boreal generalists. Proceedings of the Royal Society B-Biological Sciences, 282: 31-39.
Yaragina, N. A., Bogstad, B., and Kovalev, Y. A. 2009. Variability in cannibalism in Northeast Arctic cod (Gadus morhua) during the period 1947-2006. Marine Biology Research, 5: 75-85.
Cod size structure [SI24]
Phenomenon: Decreasing biomass of large cod [SP24]
Ecosystem characteristic: Functionally important species and biophysical structures
Under the reference condition, large cod is present in the population to such extent that they represent an important predator in the ecosystem. In addition, presence of cannibalistic large cod contributes to self-regulation of the cod population. It is likely that the proportion of old, large fish in the stock would be even larger under reference conditions than in the periods with low fishing pressure from which we have data (1940s, 2010s, see Kjesbu et al., 2014). From West Greenland there are observations of age distributions in a previously unfished cod stock (Hansen, 1949), but whether these observations are relevant for a situation where the Barents Sea cod stock is unfished, we do not know.
The most important anthropogenic driver of change in this indicator is fisheries, which typically target the largest cod individuals. The minimum size in the fisheries is 44 cm, but fishing mortality increases with size/age, both because of gear selectivity and because a considerable part of the catch is taken during the spawning season. Heavy exploitation over many generations may also have affected the genetic composition of the stock, as maturation now occurs at lower age and size than before (see Rørvik et al., 2021 for the most recent discussion and literature review on this). In the Barents Sea, cod have been heavily exploited, but following the strong reduction in fishing mortality around 2007 the age structure in the stock has now been rebuilt and resembles the situation in the late 1940s following a period of low fishing mortality during WWII. The understanding of the link to fisheries is assessed as certain.
Large and old cod are important predators on smaller fish, including being cannibalistic (Holt et al., 2019). There are no other abundant fish stocks with large fish (> 70 cm) in the Barents Sea so that niche in the ecosystem cannot be filled by other species. Also, the age/size structure in the spawning stock is important for the recruitment to the stock (see references in Kjesbu et al., 2014). The understanding of the importance of changes in the indicator is assessed as less good.
Decreasing or stable low biomass of large cod can be considered of ecosystem significance if, for example i) the genetic composition of cod has changed due to selective removal of large individuals, ii) it leads to bad recruitment and reduced population size.
Knowledge gaps:
Effects on genetic composition.
References
Hansen, P. M. 1949. Studies of the biology of cod in Greenland waters. ICES Rapports et Procésverbaux des Réunions, 123: 1-77.
Holt, R. E., Bogstad, B., Durant, J. M., Dolgov, A. V., and Ottersen, G. 2019. Barents Sea cod (Gadus morhua) diet composition: long-term interannual, seasonal, and ontogenetic patterns. ICES Journal of Marine Science, 76: 1641-1652.
Kjesbu, O. S., Bogstad, B., Devine, J. A., Gjøsæter, H., Howell, D., Ingvaldsen, R. B., Nash, R. D. M., et al. 2014. Synergies between climate and management for Atlantic cod fisheries at high latitudes. Proceedings of the National Academy of Sciences of the United States of America, 111: 3478-3483.
Rørvik, C. J., Bogstad, B., Ottersen, G., and Kjesbu, O. S. 2021. Long-term interplay between harvest regimes and biophysical conditions may lead to persistent changes in age-at-sexual maturity of Northeast Arctic cod (Gadus morhua). Canadian Journal of Fisheries and Aquatic Sciences: accepted.
Haddock [SI25]
Phenomenon: Change in haddock stock size [SP25]
Ecosystem characteristic: Functionally important species and biophysical structures
Under the reference condition, the haddock stock has large fluctuations in recruitment, but is nevertheless an important fish species in the Barents Sea ecosystem, both as predator and prey.
The most important anthropogenic drivers of change in this indicator are climate change and fisheries (see e.g. Russkikh and Dingsør, 2011 for an overview of haddock biology). Haddock abundance is low in waters colder than 2° C, so the location of this isotherm for bottom temperatures is a good indication of the distribution range. Recruitment of haddock is positively related to temperature (Bogstad et al., 2013). The understanding of the link between climate change and haddock stock size is assessed as certain. Haddock has never been fished as hard as cod, and a large part of the haddock catch is taken as by-catch in cod fisheries. Fisheries as a driver certainly affect haddock abundance, but the haddock has not been fished down to levels low enough to hamper the recruitment to the stock. The understanding of the link between fisheries and haddock stock size is assessed as less certain.
The haddock is an important predator on various benthic organisms (Dolgov et al., 2011), and thus it may impact those organisms considerably. However, effects of variation in haddock abundance on such organisms have not yet been quantified. In recent years, growth of haddock has been observed to be markedly density-dependent (ICES, 2020). Also, the importance of haddock as prey is not well known (but see Johannesen et al., 2016; Holt et al., 2019 for importance in cod diet). The understanding of the importance of changes in the haddock stock size is assessed as less good.
Due to the limited knowledge about the importance of haddock as both predator and prey, there are limited expectations as to when changes in the indicator can be considered of ecosystem significance.
Knowledge gaps:
Effects of variation in haddock abundance on its prey are possible (cf. density-dependence in haddock growth) but have not been documented. Causes of recruitment variability are poorly known. It has also been observed in other areas that haddock recruitment is more variable than cod recruitment, but the reason for this is not well known.
References
Bogstad, B., Dingsør, G. E., Ingvaldsen, R. B., and Gjøsæter, H. 2013. Changes in the relationship between sea temperature and recruitment of cod, haddock and herring in the Barents Sea. Marine Biology Research, 9: 895-907.
Dolgov, A. V., Johannesen, E., and Bogstad, B. 2011. Benthivorous fish. Chapter 8.3. In The Barents Sea. Ecosystem, resources, management. Half a century of Russian-Norwegian cooperation., pp. 455-465. Ed. by T. Jakobsen, and V. K. Ozhigin. Tapir Academic Press.
Holt, R. E., Bogstad, B., Durant, J. M., Dolgov, A. V., and Ottersen, G. 2019. Barents Sea cod (Gadus morhua) diet composition: long-term interannual, seasonal, and ontogenetic patterns. ICES Journal of Marine Science, 76: 1641-1652.
ICES. 2020. Arctic Fisheries Working Group (AFWG). 2:52. 577 pp.
Johannesen, E., Johansen, G. O., and Korsbrekke, K. 2016. Seasonal variation in cod feeding and growth in a changing sea. Canadian Journal of Fisheries and Aquatic Sciences, 73: 235-245.
Russkikh, A. A., and Dingsør, G. E. 2011. Haddock. Chapter 5.5. In The Barents Sea. Ecosystem, resources, management. Half a century of Russian-Norwegian cooperation, pp. 271-280. Ed. by T. Jakobsen, and V. K. Ozhigin. Tapir Academic Press.
Redfish [SI26]
Phenomenon: Decreasing biomass of the beaked redfish stock [SP26]
Ecosystem characteristic: Functionally important species and biophysical structures
Under the reference condition, juvenile redfish are important secondary consumers in the ecosystem, and the biomass of redfish juveniles in the Barents Sea is large enough to constitute a substantial component of the diet of cod and to a lesser extent of halibut (ICES 2018). Several species of redfish are present as juveniles in the Barents Sea (Mukhina et al., 1992; Eriksen et al., 2021), and most adult beaked redfish (Sebastes mentella) migrate into the Norwegian Sea where they take up a pelagic lifestyle (Drevetnyak and Nedreaas, 2009). Still, stock size can be used as indicator since it depends on successful recruitment, which depends on the living conditions that the juveniles encounter in the Barents Sea (Zakharov et al., 1977; Barsukov et al., 1986; Drevetnyak and Nedreaas, 2009).
Historically, the most important anthropogenic driver has been fishing pressure. Beaked redfish was overfished in the 1990s and the early 2000s until directed fishing for the species was banned in 2003 and the stock successfully rebuilt, with a direct fishery in Norwegian waters starting again in 2014 (ICES, 2018). If the current management regime is maintained, it is likely that climate change proves to be a more important driver. Climate change may affect the population rather indirectly, through changes in currents that transport larvae extruded along the shelf break into the Barents Sea (Zakharov et al., 1977; Barsukov et al., 1986; Drevetnyak and Nedreaas, 2009), and through food-web mediated effects on important prey and predators. The former is likely to be negative, whilst the latter is difficult to evaluate. Climate change, including ocean acidification, may have negative effects on the plankton prey of the juvenile redfishes (Whiteley, 2011) and on calcifying benthic organisms that may serve as refuge for juvenile fish (Turley et al., 2007; Andersson et al., 2008). Oil extraction in the Barents Sea nurseries and places of larval extrusion along the Norwegian shelf may negatively affect the stock on a more localized scale (Sundby et al., 2013). The understanding of the link to fishing pressure is assessed as certain and represented by the history of overfishing and subsequent rebuilding of the stock (ICES, 2018). The understanding of the link to climate change is less certain as the several indirect effects are complex and poorly understood.
Juvenile redfish are an important secondary consumer in the Sub-Arctic Barents Sea and contribute to the transfer of energy from zooplankton to higher trophic levels, primarily large predatory fish (ICES, 2018). Before the reduction of the redfish stock by overfishing, and the associated reduction of juvenile redfish in the Barents Sea, juvenile redfish was a major component in the diet of NEA cod (ICES, 2018) and was also consumed by halibut. However, the consumption of juvenile redfish by cod did not increase again to the same extent as the number of juvenile redfish did after 2006 when the redfish stock was rebuilt (ICES, 2018). The understanding of the importance of changes in the indicator for the ecosystem functioning is assessed as less good, given that the increase in juvenile redfish did not have the expected effect on the diet of cod (ICES, 2018).
A decline in the redfish stock biomass can be considered of ecosystem significance if, for example, i) important predators, e.g. cod and halibut, are negatively affected or become more dependent on cannibalism, ii) juveniles of other species are positively affected as a reduction in juvenile redfish may release more copepod prey to them as redfish larvae and juveniles can digest copepod eggs and generally prefer earlier stages (Konchina, 1970; Karamushko and Karamushko, 1995).
Knowledge gaps:
We assume that changes in juvenile beaked redfish in the Barents Sea are related to changes in the beaked redfish stock size (the indicator), even though the adult population mostly resides in the Norwegian Sea. The distribution of areas of larvae extrusion is currently poorly mapped, with the entire shelf break, from Shetland to Bear Island being marked as extrusion area (Jakobsen and Ozhigin, 2011). How changes in ocean currents may affect the distribution of redfish larvae, and later juveniles, in the Barents Sea cannot be accurately assessed. Juvenile redfish, up to a certain size are virtually indistinguishable morphologically and therefore there is no abundance index for separate species; all 0-group redfish are counted together (Eriksen et al., 2021).
References
Andersson, A. J., Mackenzie, F. T., and Bates, N. R. 2008. Life on the margin: implications of ocean acidification on Mg-calcite, high latitude and cold-water marine calcifiers. Marine Ecology Progress Series, 373: 265-273.
Barsukov, V., Shestova, L., and Mukhina, N. 1986. Redfish of Sebastes genus. In Ichtyofauna and its living conditions in the Barents Sea, pp. 48-52. Ed. by G. Matishov. KF AN Press, Apatity, SU.
Drevetnyak, K., and Nedreaas, K. H. 2009. Historical movement pattern of juvenile beaked redfish (Sebastes mentella Travin) in the Barents Sea as inferred from long-term research survey series. Marine Biology Research, 5: 86-100.
Eriksen, E., Prozorkevich, D., and Prokhorova, T. A. 2021. Fish recruitment (young of the year). In Survey report from the joints Norwegian/Russian ecosystems survey in the Barents Sea and adjacent waters. August - November 2020. Ed. by G. van der Meeren, and D. Prozorkevich. IMR/PINRO Joint Report Series 1-2021.
ICES. 2018. Stock annex: Beaked redfish (Sebastes mentella) in subareas 1 and 2 (Northeast Arctic), ICES Stock Annex. 18 pp.
Jakobsen, T., and Ozhigin, V. K. 2011. The Barents Sea: ecosystem, resources, management. Half a century of Russian-Norwegian cooperation. p. 825. Tapir Akademisk Forlag, Trondheim, Norway.
Karamushko, O., and Karamushko, L. 1995. Feeding and bioenergetics of the main commercial fish of the Barents Sea on the different stages of ontogenesis. Kola Science Centre of Russian Academy of Science. 216 pp.
Konchina, U. 1970. Feeding of sea redfish larvae in the Barents Sea. Trudy molodyh uchenyh - Papers of young scientists, 3: 166-181.
Mukhina, N., Drevetnyak, K., and Dvinina, E. 1992. Redfish spawning grounds in the Barents Sea and adjacent waters. G:54. 21 pp.
Sundby, S., Fossum, P., Sandvik, A. D., Vikebø, F., Aglen, A., Buhl-Mortensen, L., and Johannessen, M. 2013. Kunnskapsinnhenting Barentshavet - Lofoten - Vesterålen (KILO). 3.
Turley, C. M., Roberts, J. M., and Guinotte, J. M. 2007. Corals in deep-water: will the unseen hand of ocean acidification destroy cold-water ecosystems? Coral Reefs, 26: 445-448.
Whiteley, N. M. 2011. Physiological and ecological responses of crustaceans to ocean acidification. Marine Ecology Progress Series, 430: 257-271.
Zakharov, G., Nikolskaya, T., Sorokin, V., Chekhova, V., and Shestova, L. 1977. Deep-sea redfish. Commercial biological resources of the North Atlantic and adjacent waters of the Arctic Ocea Part 2., pp. 72-87. Pishchevaya Promyshlennost Press, Moscow, SU.
Bottom thermal niches [SI27]
Phenomenon: Decreasing area of bottom cold-water temperature niches [SP27]
Ecosystem characteristic: Landscape-ecological patterns
Under the reference condition, which for abiotic factors is defined as the climate in the period 1961-1990, the Sub-Arctic part of the Barents Sea is characterised by a climate with relatively warm water and with only limited occurrences of Arctic water masses and seasonal ice cover in the far northern parts of the area. Regions dominated by Sub-Arctic climate provides habitat mainly for boreal species. Data on temperature exists from 1970 (Johannesen et al., 2012; Michalsen et al., 2013), implying that quantitative information for the indicator exists only for part of the reference condition.
The most important anthropogenic driver of change in this indicator is climate change (IPCC, 2019). Waters characterized by warm (T>0°C) temperatures are common near bottom in the Sub-Arctic part (Loeng, 1991; Lind and Ingvaldsen, 2012). Anthropogenic global warming leads to northward expansion of the warm-water temperature niches (Smedsrud et al., 2010; Smedsrud et al., 2013; Oziel et al., 2016). Given the massive evidence of anthropogenic influence on the climate in general (Masson-Delmotte et al., 2021) and for the Barents Sea locally described above, the understanding of the link between driver and change in the indicator is rated as certain.
The increasing extent of warm-water temperature niches at bottom has profound impacts on the local and regional Sub-Arctic climate and ecosystems. Examples of changes which can be considered of ecosystem significance include increases in size of habitat for boreal benthic and demersal fish species (Johannesen et al., 2012; Fossheim et al., 2015; Jørgensen et al., 2015; Johannesen et al., 2017; Jørgensen et al., 2019). Overall, the understanding of the importance of changes in the indicator for the rest of the ecosystem is therefore rated as good.
Knowledge gaps:
The extent of warm-water temperature niches near bottom depends on inflow of Atlantic Water and cooling during winter. Improved understanding is needed to address the relative contribution from these sources on the formation and distribution of warm-water temperature niches.
References
Fossheim, M., Primicerio, R., Johannesen, E., Ingvaldsen, R. B., Aschan, M. M., and Dolgov, A. V. 2015. Recent warming leads to a rapid borealization of fish communities in the Arctic. Nature Clim. Change, 5: 673-677.
IPCC 2019. IPCC Special Report on the Ocean and Cryosphere in a Changing Climate. Ed. by H.-O. Pörtner, D. C. Roberts, V. Masson-Delmotte, P. Zhai, M. Tignor, E. Poloczanska, K. Mintenbeck, A. Alegría, M. Nicolai, A. Okem, J. Petzold, B. Rama, and N. M. Weyer. Cambridge University Press, Cambridge.
Johannesen, E., Ingvaldsen, R. B., Bogstad, B., Dalpadado, P., Eriksen, E., Gjøsæter, H., Knutsen, T., et al. 2012. Changes in Barents Sea ecosystem state, 1970–2009: climate fluctuations, human impact, and trophic interactions. ICES Journal of Marine Science, 69: 880-889.
Johannesen, E., Jørgensen, L. L.., Fossheim, M., Primicerio, R., Greenacre, M., Ljubin, P. A., Dolgov, A. V., et al. 2017. Large-scale patterns in community structure of benthos and fish in the Barents Sea. Polar Biology, 40: 237-246.
Jørgensen, L. L.., Ljubin, P., Skjoldal, H. R., Ingvaldsen, R. B., Anisimova, N., and Manushin, I. 2015. Distribution of benthic megafauna in the Barents Sea: baseline for an ecosystem approach to management. ICES Journal of Marine Science, 72: 595-613.
Jørgensen, L. L.., Primicerio, R., Ingvaldsen, R. B., Fossheim, M., Strelkova, N., Thangstad, T. H., Manushin, I., et al. 2019. Impact of multiple stressors on sea bed fauna in a warming Arctic. Marine Ecology Progress Series, 608: 1-12.
Lind, S., and Ingvaldsen, R. 2012. Variability and impacts of Atlantic Water entering the Barents Sea from the north. Deep Sea Research, 62: 70-88.
Loeng, H. 1991. Features of the physical oceanographic conditions of the Barents Sea. Polar Research, 10: 5-18.
Masson-Delmotte, V., Zhai, P., Pirani, A., Connors, S. L., Péan, C., Berger, S., Caud, N., et al. 2021. Climate Change 2021: The Physical Science Basis. Contribution of Working Group I to the Sixth Assessment Report of the Intergovernmental Panel on Climate Change. Cambridge University Press, Cambridge.
Michalsen, K., Dalpadado, P., Eriksen, E., Gjøsæter, H., Ingvaldsen, R. B., Johannesen, E., Jørgensen, L. L.., et al. 2013. Marine living resources of the Barents Sea – Ecosystem understanding and monitoring in a climate change perspective. Marine Biology Research, 9: 932-947.
Oziel, L., Sirven, J., and Gascard, J. C. 2016. The Barents Sea frontal zones and water masses variability (1980–2011). Ocean Sci., 12: 169-184.
Smedsrud, L. H., Esau, I., Ingvaldsen, R. B., Eldevik, T., Haugan, P. M., Li, C., Lien, V. S., et al. 2013. The role of the Barents Sea in the Arctic climate system. Reviews of Geophysics, 51: 415-449.
Smedsrud, L. H., Ingvaldsen, R., Nilsen, J. E. Ø., and Skagseth, Ø. 2010. Heat in the Barents Sea: transport, storage, and surface fluxes. Ocean Sci., 6: 219-234.
Benthos sensitive to bottom trawling [SI28]
Phenomenon: Decrease in biomass of benthos species sensitive to trawling [SP28]
Ecosystem characteristic: Biological diversity
Areas of the southern Barents Sea are already heavily trawled and determining an intact nature state may be difficult (Jørgensen et al.2016). Other areas have not had considerable trawling, but may in the future, due to shifting distribution of commercial species (Jørgensen et al.2020).
Bottom trawling is the most important driver, although disturbance from cable laying, pipeline construction, and anchored petroleum-industry structures may have similar effects, but on a much smaller scale. The understanding of the link between physical bottom-disturbance and seafloor community biodiversity is certain. Bottom trawling has been compared with forest clearcutting in this regard (Watling and Norse, 1998). These effects are particularly evident in epifaunal organisms, but this may only represent a study bias whereby most studies of effects have focused on video surveys to document impacts. There is also good evidence from the Barents Sea for these impacts (Jørgensen et al., 2016).
Any substantial change in community structure can be viewed as a departure from intact nature, and the ecological significance of this phenomenon can include its effects on food-web interactions, elemental cycling in sedimentary environments, and carbon storage (Pilskaln et al., 1998; März et al., 2022). These effects are due to both changes in faunal composition/biodiversity and the physical disturbance to the seafloor (sediment resuspension and homogenization), which will likely be indicated by altered biodiversity. Knowledge about the link between the phenomenon and potential implications for the ecosystem is assessed as good.
Biodiversity will be likely to capture the expected change, although more subtle changes may not be documented, or may require a number of diversity metrics. There is good general knowledge about spatial variability in benthic biodiversity in the Barents Sea (Zenkevich, 1963; Cochrane et al., 2009; Jørgensen et al., 2015; Zakharov et al., 2020) including some historical data, although these exist with different spatial resolution (Denisenko, 2001).
References
Cochrane, S. K. J., Denisenko, S. G., Renaud, P. E., Emblow, C. S., Ambrose Jr, W. G., Ellingsen, I. H., and Skarðhamar, J. 2009. Benthic macrofauna and productivity regimes in the Barents Sea — Ecological implications in a changing Arctic. Journal of Sea Research, 61: 222–233.
Denisenko, S. G. 2001. Long-term changes of zoobenthos biomass in the Barents Sea. Proceedings of the Zoological Institute of the Russian Academy of Sciences, 289: pp.59-66.
Jørgensen, L. L.., Ljubin, P., Skjoldal, H. R., Ingvaldsen, R. B., Anisimova, N., and Manushin, I. 2015. Distribution of benthic megafauna in the Barents Sea: baseline for an ecosystem approach to management. ICES Journal of Marine Science, 72: 595–613.
Jørgensen, L. L.., Planque, B., Thangstad, T. H., and Certain, G. 2016. Vulnerability of megabenthic species to trawling in the Barents Sea. ICES Journal of Marine Science, 73: i84–i97.
Jørgensen LL, Bakke G, Hoel AH (2020) Responding to global warming: new fisheries management measures in the Arctic. Progress in Oceanography, p.102423
März, C., Freitas, F. S., Faust, J. C., Godbold, J. A., Henley, S. F., Tessin, A. C., Abbott, G. D., et al. 2022. Biogeochemical consequences of a changing Arctic shelf seafloor ecosystem. Ambio, 51: 370–382.
Pilskaln, C. H., Churchill, J. H., and Mayer, L. M. 1998. Resuspension of Sediment by Bottom Trawling in the Gulf of Maine and Potential Geochemical Consequences. Conservation Biology, 12: 1223–1229.
Watling, L., and Norse, E. A. 1998. Disturbance of the Seabed by Mobile Fishing Gear: A Comparison to Forest Clearcutting. Conservation Biology, 12: 1180–1197.
Zakharov, D. V., Jørgensen, L. L.., Manushin, I. E., and Strelkova, N. A. 2020. Barents Sea megabenthos: Spatial and temporal distribution and production. Marine Biological Journal, 5: 19–37.
Zenkevich, L. A. 1963. Biology of seas of the USSR. 739 pp. Acad. Sci. USSR. Publ. House, Moscow (in Russian).
Fish sensitive to fisheries [SI29]
Phenomenon: Decreasing abundance of fish species sensitive to fisheries [SP29]
Ecosystem characteristic: Biological diversity
Note: This text is similar to the indicator “Fish life history” in the Sub-Arctic Barents Sea which is focusing on Equilibrium species decline. However, the life history indicator focuses on the life history strategy biomass changes, while this indicator focuses on abundance of species with typical Equilibrium life history strategy.
Under the reference condition, fish species sensitive to increased mortality from fisheries are well represented in the demersal fish community. These species can be identified by their typically “slow-type” life history traits, having a large body size, long lifespan, late maturation and low fecundity. They typically have stable population dynamics and a very low rate of intrinsic population increase, making them vulnerable to additional sources of mortality (Jennings et al., 1998; Hutchings et al., 2012; Le Quesne and Jennings, 2012). In addition, these species are often top predators in the system, and have an important structuring role in the ecosystem.
The most important anthropogenic driver of change in this indicator is fisheries. Fisheries preferentially harvest large-bodied species and individuals. In addition, species life history traits are known to be related to their vulnerability to increase mortality from fisheries (Jennings et al., 1998; Le Quesne and Jennings, 2012). Species with a slow-type, Equilibrium life history have a large body size, produce few but large offspring with high survival rate, this strategy is typically followed by sharks and rays (Pecuchet et al., 2017). Some typical Equilibrium species in the Barents Sea are sharks and rays such Greenland shark (Somniosus microcephalus), Velvet belly lanternshark (Etmopterus spinax), Rabbit fish (Chimaera monstrosa), Spinytail skate (Bathyraja spinicauda), and Thorny skate (Amblyraja radiata). These large, slow growing, and low fecundity species are characterized by a low intrinsic productivity, which make them especially vulnerable to fishing pressure (Stevens et al., 2000; King and McFarlane, 2003; Winemiller, 2005; Quetglas et al., 2016; Mérillet et al., 2021). Even though fisheries activities are rarely targeting these species, they are often suffering from high by-catch fishing mortality. In addition to the sharks and rays, also Redfishes (Sebastes spp.) are vulnerable to additional mortality from fisheries due to slow growth and late maturation, even though they have higher fecundity compared to the elasmobranch. The understanding of the link to fisheries is assessed as certain.
Slow-type, Equilibrium life history species are often top predators in the marine environment. The removal of these top predators can impact the size structure of the communities and as a result impact the structure of the food web. A decline in top predators can also lead to trophic cascades (Myers and Worm, 2003; Myers et al., 2007), it can have implications for top-down and bottom-up control in the ecosystem (Brose et al., 2012) and affect the energy flow across trophic levels. The understanding of the importance of changes in the abundance of fisheries sensitive species is assessed as good.
Decreasing trend in the abundance of fish species sensitive to increased mortality from fisheries can be considered of ecosystem significance if, for example, i) some of the species go extinct, ii) reduced abundance of these species triggers a trophic cascade through reduced predation pressure on its prey.
Knowledge gaps:
Climate change effects on these species may interact with fisheries impacts.
References
Brose, U., Dunne, J. A., Montoya, J. M., Petchey, O. L., Schneider, F. D., and Jacob, U. 2012. Climate change in size-structured ecosystems. Philosophical Transactions of the Royal Society B-Biological Sciences, 367: 2903-2912.
Hutchings, J. A., Myers, R. A., Garcia, V. B., Lucifora, L. O., and Kuparinen, A. 2012. Life-history correlates of extinction risk and recovery potential. Ecological Applications, 22: 1061-1067.
Jennings, S., Reynolds, J. D., and Mills, S. C. 1998. Life history correlates of responses to fisheries exploitation. Proceedings of the Royal Society B-Biological Sciences, 265: 333-339.
King, J. R., and McFarlane, G. A. 2003. Marine fish life history strategies: applications to fishery management. Fisheries Management and Ecology, 10: 249-264.
Le Quesne, W. J. F., and Jennings, S. 2012. Predicting species vulnerability with minimal data to support rapid risk assessment of fishing impacts on biodiversity. Journal of Applied Ecology, 49: 20-28.
Mérillet, L., Pavoine, S., Kopp, D., Robert, M., and Mouchet, M. 2021. Biomass of slow life history species increases as local bottom trawl effort decreases in the Celtic sea. Journal of Environmental Management, 290: 112634.
Myers, R. A., Baum, J. K., Shepherd, T. D., Powers, S. P., and Peterson, C. H. 2007. Cascading effects of the loss of apex predatory sharks from a coastal ocean. Science, 315: 1846-1850.
Myers, R. A., and Worm, B. 2003. Rapid worldwide depletion of predatory fish communities. Nature, 423: 280-283.
Pecuchet, L., Lindegren, M., Hidalgo, M., Delgado, M., Esteban, A., Fock, H. O., de Sola, L. G., et al. 2017. From traits to life-history strategies: Deconstructing fish community composition across European seas. Global Ecology and Biogeography, 26: 812-822.
Quetglas, A., Rueda, L., Alvarez-Berastegui, D., Guijarro, B., and Massut, E. 2016. Contrasting responses to harvesting and environmental drivers of fast and slow life history species. Plos One, 11: 1-15.
Stevens, J. D., Bonfil, R., Dulvy, N. K., and Walker, P. A. 2000. The effects of fishing on sharks, rays, and chimaeras (chondrichthyans), and the implications for marine ecosystems. ICES Journal of Marine Science, 57: 476-494.
Winemiller, K. O. 2005. Life history strategies, population regulation, and implications for fisheries management. Canadian Journal of Fisheries and Aquatic Sciences, 62: 872-885.
Mammals sensitive to pollution [AI30]
Phenomenon: Decrease in abundance of marine mammals sensitive to pollution [SP30]
Ecosystem characteristic: Biological diversity
Because of their relatively high trophic positions and long lifetimes, all marine mammals are exposed to anthropogenic pollutants. Most higher trophic level marine mammals in the Sub-Arctic are susceptible to pollutants; these animals were hunted extensively and remain at reduced levels compared to the historical conditions, with the exception of white-beaked dolphins which were not exploited commercially.
The drivers are dumping of waste, industrial production of various substances that are released into the environment (often used in agriculture as pesticides or for treatment of plant diseases), emissions during industrial processes that in addition to local pollution are transported around the globe with ocean currents and via atmospheric transport – thus reaching the entire planet. Many of the substances bioaccumulate in food webs and are therefore found in higher concentrations in upper trophic level animals such as many marine mammal species. In addition, many contaminants are lipophilic and thus accumulate in lipid tissues, which all marine mammals have in large quantities as an adaptation for homeothermic mammals living in the world’s oceans. Killer whales, which are pinnacle predators, have high concentrations of most pollutants (Desforges et al., 2018). Toothed whales as a group feed at high trophic levels and have poor capacity to metabolize toxic substances and hence have extremely high contaminant burdens (Pinzone et al., 2015). However, some of the classical pollutants like PCBs and DDEs that have been banned from production, are declining as a result of substance bans (e.g. Wolkers et al. 2008, Routti et al. 2014).
The understanding of the links to drivers are less certain.
High levels of various pollutants have the potential to impact metabolism, reproduction and other vital processes in mammals. This will ultimately lead to decreased numbers (biomass) of marine mammals via increased mortality and reduced reproductive rates. Top predators are at the highest risk of being impacted by contaminants and reduction in top predators might have cascading effects on the whole ecosystem, but to date no direct linkage between pollution and reproductive success/survivorship has been demonstrated for marine mammals in the Barents Sea.
The understanding of the link to ecosystem impact is thus assessed as less good.
References
Desforges, J.-P., Hall, A., McConnell, B., Rosing-Asvid, A., Barber, J. L., Brownlow, A. Guise, S. de, Eulaers, I., Jepson, P. D., Letcher, R. J., Levin, M., Ross, P.S., Samarra, F., Vikingsson, G., Sonne, C. and Dietz, R. 2018. Predicting global killer whale population collapse from PCB pollution. Science 361: 1373-1376.
Pinzone, M., Budzinski, H., Tasciotti, A., Ody, D., Lepoint, G., Schnitzler, J., Scholl, G., Thomé, J.P., Tapie, N., Eppe, G., and Das, K. 2015. POPs in free-ranging pilot whales, sperm whales and fin whales from the Mediterranean Sea: influence of biological and ecological factors. Environmental Research, 142:185-196.
Routti, H., Lydersen, C., Hansen, L. and Kovacs, K. M. 2014. Contaminant levels in the world's northernmost harbor seals (Phoca vitulina). Mar. Pollut. Bull. 87: 140-146.
Wolkers, H., Krafft, B. A., Bavel, B. Van, Helgason, L. B., Lydersen, C. and Kovacs, K. M. 2008. Biomarker responses and decreasing contaminant levels in ringed seals (Pusa hispida) from Svalbard, Norway. J. Toxicol. Environ. Health A 71: 1009-1018.
Mammal diversity [AI31]
Phenomenon: Change in mammal species diversity [SP31]
Ecosystem characteristic: Biological diversity
Historical stock sizes for most marine mammals were much higher than they are currently (see above). Overharvesting removed some species completely from the Sub-Arctic (e.g., North Atlantic right whale); thus, the diversity of marine mammals is likely reduced from the historical condition.
The past driver of the diversity of marine mammals in the Sub-Arctic is harvest and the primary current driver is climate change. Continued recovery from overharvesting and increasing pelagic productivity in the Sub-Arctic due to climate change will likely increase the diversity of species overall (Frainer et al., 2021; Wesławski, 2009), with a shift northward for more southern species such as common dolphins, bottlenose dolphins, pilot whales, and sei whales (Evans and Bjørge, 2013; Silber et al., 2017; Van Weelden et al., 2021).
Understanding of the linkage to the drivers is ranked as certain.
As marine mammal diversity in the Sub-Arctic increases, interspecific competition and changes to predator-prey relationships will become more likely (Baum and Worm, 2009; Gallagher et al., 2022; Gulland et al., 2022), but how this will affect the ecosystem is unclear. Changes in either top-down and bottom-up pressures can influence prey-stock regimes and shift the balance, favoring some competitors over others, which may affect the underlying structure and functioning of the ecosystem in unpredictable ways.
The understanding of the link to ecosystem impact is assessed as less good.
References
Baum, J.K. and Worm, B., 2009. Cascading top‐down effects of changing oceanic predator abundances. Journal of Animal Ecology, 78(4):699-714.
Evans, P.G., and Bjørge, A., 2013. Impacts of climate change on marine mammals. Marine Climate Change Impacts Partnership (MCCIP) Science Review, 2013, pp.134-148.
Gallagher, C.A., Chimienti, M., Grimm, V. and Nabe‐Nielsen, J. 2022. Energy‐mediated responses to changing prey size and distribution in marine top predator movements and population dynamics. Journal of Animal Ecology, 91(1):241-254.
Gulland, F.M., Baker, J., Howe, M., LaBrecque, E., Leach, L., Moore, S.E., Reeves, R.R., and Thomas, P.O. 2022. A Review of Climate Change Effects on Marine Mammals in United States Waters: Past Predictions, Observed Impacts, Current Research and Conservation Imperatives. Climate Change Ecology.100054.
Frainer, A., Primicerio, R., Dolgov, A., Fossheim, M., Johannesen, E., Lind, S., and Aschan, M. 2021. Increased functional diversity warns of ecological transition in the Arctic. Proceedings of the Royal Society B, 288(1948):.20210054.
Silber, G.K., Lettrich, M.D., Thomas, P.O., Baker, J.D., Baumgartner, M., Becker, E.A., Boveng, P., Dick, D.M., Fiechter, J., Forcada, J., and Forney, K.A. 2017. Projecting marine mammal distribution in a changing climate. Frontiers in Marine Science, 4:413.
Van Weelden, C., Towers, J.R., and Bosker, T. 2021. Impacts of climate change on cetacean distribution, habitat and migration. Climate Change Ecology, 1:100009.
Wesławski, J.M., Kwasniewski, S., and Stempniewicz, L. 2009. Warming in the Arctic may result in the negative effects of increased biodiversity. Polarforschung, 78(3):105-108.
Temperature [SI32]
Phenomenon: Warming of the water column [SP32]
Ecosystem characteristic: Abiotic factors
Under the reference condition, which for abiotic factors is predefined as the climate in the period 1961-1990, the Sub-Arctic part of the Barents Sea was characterised by moderate temperatures. Regions with Sub-Arctic climate provides mainly habitat for boreal species. Data on temperature exist from 1970 (Johannesen et al., 2012; Michalsen et al., 2013), implying that quantitative information for the indicator exists only for part of the reference condition.
The most important anthropogenic driver of change in the indicator is climate change, causing the water column to warm (IPCC, 2019). Anthropogenic global warming leads to increasing ocean temperature in the inflowing Atlantic Water (Sandø et al., 2014; Årthun et al., 2019) and less sea ice (Årthun et al., 2012; Onarheim et al., 2018; Årthun et al., 2019). Given the massive evidence of anthropogenic influence on the climate in general (Masson-Delmotte et al., 2021) and for the Barents Sea locally described above, the understanding of the link between driver and change in the indicator is rated as certain.
The ecosystem in the Sub-Arctic part of the Barents Sea is largely characterized by boreal species, and some changes have been observed due to warming for these, including increasing biomass of boreal plankton species like Calanus finmarchicus (Aarflot et al., 2018), krill and jellyfish (Eriksen et al., 2016, 2017; Stige et al., 2019). Increasing temperatures have also caused the total biomass of the pelagic compartment, i.e., macroplankton, pelagic fish and 0-group (young-of-the-year) fish, to increase substantially (Eriksen et al., 2017). The main commercial species in the Barents Sea, the boreal Northeast Arctic cod (Gadus morhua), has responded positively to the observed warming (Kjesbu et al., 2014; Arthun et al., 2018). In addition, warming has caused intrusions of the coccolitophore Emiliana huxleyi (a tracer for temperate ecosystems) in the Barents Sea, (Oziel et al., 2020). The understanding of the importance of changes in the indicator for the rest of the ecosystem is rated as good.
Warming of the water column depends on the inflow of Atlantic Water, surface heating during summer and cooling during winter, and inflow of sea ice and Arctic Water from the north. Improved understanding is needed to address the relative contribution from these sources.
References
Aarflot, J. M., Skjoldal, H. R., Dalpadado, P., and Skern-Mauritzen, M. 2018. Contribution of Calanus species to the mesozooplankton biomass in the Barents Sea. ICES Journal of Marine Science, 75: 2342-2354.
Arthun, M., Bogstad, B., Daewel, U., Keenlyside, N. S., Sando, A. B., Schrum, C., and Ottersen, G. 2018. Climate based multi-year predictions of the Barents Sea cod stock. Plos One, 13.
Eriksen, E., Skjoldal, H. R., Dolgov, A. V., Dalpadado, P., Orlova, E. L., and Prozorkevich, D. V. 2016. The Barents Sea euphausiids: methodological aspects of monitoring and estimation of abundance and biomass. ICES Journal of Marine Science, 73: 1533-1544.
Eriksen, E., Skjoldal, H. R., Gjosaeter, H., and Primicerio, R. 2017. Spatial and temporal changes in the Barents Sea pelagic compartment during the recent warming. Progress in Oceanography, 151: 206-226.
IPCC 2019. IPCC Special Report on the Ocean and Cryosphere in a Changing Climate. Ed. by H.-O. Pörtner, D. C. Roberts, V. Masson-Delmotte, P. Zhai, M. Tignor, E. Poloczanska, K. Mintenbeck, A. Alegría, M. Nicolai, A. Okem, J. Petzold, B. Rama, and N. M. Weyer. Cambridge University Press, Cambridge.
Johannesen, E., Ingvaldsen, R. B., Bogstad, B., Dalpadado, P., Eriksen, E., Gjøsæter, H., Knutsen, T., et al. 2012. Changes in Barents Sea ecosystem state, 1970–2009: climate fluctuations, human impact, and trophic interactions. ICES Journal of Marine Science, 69: 880-889.
Kjesbu, O. S., Bogstad, B., Devine, J. A., Gjøsæter, H., Howell, D., Ingvaldsen, R. B., Nash, R. D. M., et al. 2014. Synergies between climate and management for Atlantic cod fisheries at high latitudes. Proceedings of the National Academy of Sciences of the United States of America, 111: 3478-3483.
Masson-Delmotte, V., Zhai, P., Pirani, A., Connors, S. L., Péan, C., Berger, S., Caud, N., et al. 2021. Climate Change 2021: The Physical Science Basis. Contribution of Working Group I to the Sixth Assessment Report of the Intergovernmental Panel on Climate Change. Cambridge University Press, Cambridge.
Michalsen, K., Dalpadado, P., Eriksen, E., Gjøsæter, H., Ingvaldsen, R. B., Johannesen, E., Jørgensen, L. L.., et al. 2013. Marine living resources of the Barents Sea – Ecosystem understanding and monitoring in a climate change perspective. Marine Biology Research, 9: 932-947.
Onarheim, I. H., Eldevik, T., Smedsrud, L. H., and Stroeve, J. C. 2018. Seasonal and Regional Manifestation of Arctic Sea Ice Loss. Journal of Climate, 31: 4917-4932.
Oziel, L., Baudena, A., Ardyna, M., Massicotte, P., Randelhoff, A., Sallée, J. B., Ingvaldsen, R. B., et al. 2020. Faster Atlantic currents drive poleward expansion of temperate phytoplankton in the Arctic Ocean. Nature Communications, 11: 1705.
Sandø, A. B., Gao, Y., and Langehaug, H. R. 2014. Poleward ocean heat transports, sea ice processes, and Arctic sea ice variability in NorESM1 M simulations. Journal of Geophysical Research, 119: 2095-2108.
Stige, L. C., Eriksen, E., Dalpadado, P., and Ono, K. 2019. Direct and indirect effects of sea ice cover on major zooplankton groups and planktivorous fishes in the Barents Sea. ICES Journal of Marine Science, 76: I24-I36.
Årthun, M., Eldevik, T., and Smedsrud, L. H. 2019. The Role of Atlantic Heat Transport in Future Arctic Winter Sea Ice Loss. Journal of Climate, 32: 3327-3341.
Årthun, M., Eldevik, T., Smedsrud, L. H., Skagseth, Ø., and Ingvaldsen, R. B. 2012. Quantifying the Influence of Atlantic Heat on Barents Sea Ice Variability and Retreat. Journal of Climate, 25: 4736-4743.
Area of water masses [SI33]
Phenomenon: Increasing area covered by Atlantic Water [SP33]
Ecosystem characteristic: Abiotic factors
Under the reference condition, which for abiotic factors are predefined as the climate in the period 1961-1990, the Sub-Arctic part of the Barents Sea is characterised by a climate with some occurrences of Arctic water masses and seasonal ice cover in parts of the area. The climate provides mainly habitat for boreal species. Data on temperature exist from 1970 (Johannesen et al., 2012; Michalsen et al., 2013), implying that quantitative information for the indicator exists only for part of the reference condition.
The most important anthropogenic driver of change in this indicator is climate change (IPCC, 2019). Atlantic Water, characterized by temperatures above 3°C and high salinity, occupies together with mixed waters (0oC<T<3o C), the Sub-Arctic part (Loeng, 1991; Lind and Ingvaldsen, 2012). Anthropogenic global warming leads to northward expansion of Atlantic Water (Smedsrud et al., 2010; Smedsrud et al., 2013; Oziel et al., 2016) thereby reducing the regional sea ice in the Barents Sea (Årthun et al., 2012; Onarheim et al., 2018). Given the massive evidence of anthropogenic influence on the climate in general (Masson-Delmotte et al., 2021) and for the Barents Sea locally described above, the understanding of the link between driver and change in the indicator is rated as certain.
The increasing extent of Atlantic Water profoundly impacts the local and regional Sub-Arctic climate (Smedsrud et al., 2010; Smedsrud et al., 2013) and ecosystems (Dalpadado et al., 2012, 2014). Increasing size of boreal habitat has caused larger occupation area for macroplankton, pelagic fish and 0-group (young-of-the-year) fish (Eriksen et al., 2017). The main commercial species in the Barents Sea, the boreal Northeast Arctic cod (Gadus morhua), has also responded positively to the observed increase in habitat (Kjesbu et al., 2014; Årthun et al., 2018). The understanding of the importance of changes in the indicator for the rest of the ecosystem is therefore rated as good.
Atlantic Water extent increase depend on Atlantic Water inflow, regional heat loss, mixing with fresh water from rivers and formation of Arctic Water. Improved understanding to address water mass modifications during winter, and how this affects the distribution of Atlantic Water, is needed.
References
Årthun, M., Bogstad, B., Daewel, U., Keenlyside, N. S., Sando, A. B., Schrum, C., and Ottersen, G. 2018. Climate based multi-year predictions of the Barents Sea cod stock. Plos One, 13.
Dalpadado, P., Arrigo, K. R., Hjøllo, S. S., Rey, F., Ingvaldsen, R. B., Sperfeld, E., van Dijken, G. L., et al. 2014. Productivity in the Barents Sea - Response to Recent Climate Variability. Plos One, 9.
Dalpadado, P., Ingvaldsen, R. B., Stige, L. C., Bogstad, B., Knutsen, T., Ottersen, G., and Ellertsen, B. 2012. Climate effects on Barents Sea ecosystem dynamics. ICES Journal of Marine Science, 69: 1303-1316.
Eriksen, E., Skjoldal, H. R., Gjosaeter, H., and Primicerio, R. 2017. Spatial and temporal changes in the Barents Sea pelagic compartment during the recent warming. Progress in Oceanography, 151: 206-226.
IPCC 2019. IPCC Special Report on the Ocean and Cryosphere in a Changing Climate. Ed. by H.-O. Pörtner, D. C. Roberts, V. Masson-Delmotte, P. Zhai, M. Tignor, E. Poloczanska, K. Mintenbeck, A. Alegría, M. Nicolai, A. Okem, J. Petzold, B. Rama, and N. M. Weyer. Cambridge University Press, Cambridge.
Johannesen, E., Ingvaldsen, R. B., Bogstad, B., Dalpadado, P., Eriksen, E., Gjøsæter, H., Knutsen, T., et al. 2012. Changes in Barents Sea ecosystem state, 1970–2009: climate fluctuations, human impact, and trophic interactions. ICES Journal of Marine Science, 69: 880-889.
Kjesbu, O. S., Bogstad, B., Devine, J. A., Gjøsæter, H., Howell, D., Ingvaldsen, R. B., Nash, R. D. M., et al. 2014. Synergies between climate and management for Atlantic cod fisheries at high latitudes. Proceedings of the National Academy of Sciences of the United States of America, 111: 3478-3483.
Lind, S., and Ingvaldsen, R. 2012. Variability and impacts of Atlantic Water entering the Barents Sea from the north. Deep Sea Research, 62: 70-88.
Loeng, H. 1991. Features of the physical oceanographic conditions of the Barents Sea. Polar Research, 10: 5-18.
Masson-Delmotte, V., Zhai, P., Pirani, A., Connors, S. L., Péan, C., Berger, S., Caud, N., et al. 2021. Climate Change 2021: The Physical Science Basis. Contribution of Working Group I to the Sixth Assessment Report of the Intergovernmental Panel on Climate Change. Cambridge University Press, Cambridge.
Michalsen, K., Dalpadado, P., Eriksen, E., Gjøsæter, H., Ingvaldsen, R. B., Johannesen, E., Jørgensen, L. L.., et al. 2013. Marine living resources of the Barents Sea – Ecosystem understanding and monitoring in a climate change perspective. Marine Biology Research, 9: 932-947.
Onarheim, I. H., Eldevik, T., Smedsrud, L. H., and Stroeve, J. C. 2018. Seasonal and Regional Manifestation of Arctic Sea Ice Loss. Journal of Climate, 31: 4917-4932.
Oziel, L., Sirven, J., and Gascard, J. C. 2016. The Barents Sea frontal zones and water masses variability (1980–2011). Ocean Sci., 12: 169-184.
Smedsrud, L. H., Esau, I., Ingvaldsen, R. B., Eldevik, T., Haugan, P. M., Li, C., Lien, V. S., et al. 2013. The role of the Barents Sea in the Arctic climate system. Reviews of Geophysics, 51: 415-449.
Smedsrud, L. H., Ingvaldsen, R., Nilsen, J. E. Ø., and Skagseth, Ø. 2010. Heat in the Barents Sea: transport, storage, and surface fluxes. Ocean Sci., 6: 219-234.
Årthun, M., Eldevik, T., Smedsrud, L. H., Skagseth, Ø., and Ingvaldsen, R. B. 2012. Quantifying the Influence of Atlantic Heat on Barents Sea Ice Variability and Retreat. Journal of Climate, 25: 4736-4743.
Stratification [SI34]
Phenomenon: Increasing stratification of the upper water column [SP34]
Ecosystem characteristic: Abiotic factors
Under the reference condition, there was a weak, but significant, stratification during summer in the upper water column of the Sub-Arctic part due to solar heating of the surface layer and input of freshwater from rivers (Loeng, 1991; Hordoir et al., 2022). Data on temperature and salinity exist from 1970 onward (Johannesen et al., 2012; Michalsen et al., 2013), implying that quantitative information for the indicator exists for only part of the reference condition period.
The most important anthropogenic driver of change in the indicator is climate change (IPCC, 2019). Upper water column stratification in the Sub-Arctic part in summer and autumn is created by increasing temperatures and decreasing salinity (and thus density) toward the surface. Anthropogenic global warming leads to surface warming as well as freshening due to increased precipitation, glacier melt in polar regions etc (Drinkwater et al., 2021). This causes a strengthening of the stratification and a shallower mixed layer depth in summer (Hordoir et al., 2022). The understanding of the link between driver and change in the indicator is rated as certain.
Stratification of the water column can be considered of ecosystem significance as it affects the vertical fluxes of new nutrients into the euphotic zone, thereby controlling primary production (Randelhoff et al., 2020). Stronger vertical stratification decreases the vertical fluxes of nutrients into the surface mixed layer, and a shallower mixed layer decreases the inventory of nutrients available for primary production. Observed declining trends in phytoplankton concentrations have been linked to increasing stratification (Boyce et al., 2010). However, studies based on satellite data suggest that the net primary production in the Barents Sea more than doubled between 1998 and 2017 (Dalpadado et al., 2020). A stronger stratification in Sub-Arctic parts in the future is expected to decrease primary productivity (Drinkwater et al., 2021), although biogeochemical models differ when predicting future changes in primary production for this region (Skaret et al., 2014; Slagstad et al., 2015; Skogen et al., 2018; Sandø et al., 2021).
The understanding of the importance of long-term changes in the indicator for the rest of the ecosystem is thus rated as less good.
There are knowledge gaps related to how the interannual variability in Sub-Arctic stratification depend on local wind mixing and buoyancy forcing and how primary production will change with a combined change in stratification and advective supply of nutrients (Nishino et al., 2015; Oziel et al., 2017; Drinkwater et al., 2021).
References
Boyce, D. G., Lewis, M. R., and Worm, B. 2010. Global phytoplankton decline over the past century. Nature, 466: 591-596.
Dalpadado, P., Arrigo, K. R., van Dijken, G. L., Skjoldal, H. R., Bagøien, E., Dolgov, A., Prokopchuk, I., et al. 2020. Climate effects on temporal and spatial dynamics of phytoplankton and zooplankton in the Barents Sea. Progress in Oceanography, 185: 102320.
Drinkwater, K. F., Harada, N., Nishino, S., Chierici, M., Danielson, S. L., Ingvaldsen, R. B., Kristiansen, T., et al. 2021. Possible future scenarios for two major Arctic Gateways connecting Subarctic and Arctic marine systems: I. Climate and physical–chemical oceanography. ICES Journal of Marine Science.
Hordoir, R., Skagseth, Ø., Ingvaldsen, R. B., Sandø, A. B., Löptien, U., Dietze, H., Gierisch, A. M. U., et al. 2022. Changes in Arctic Stratification and Mixed Layer 1 Depth Cycle, A Modeling Analysis. Journal of Geophysical Research: Oceans, 127, e2021JC017270.
IPCC 2019. IPCC Special Report on the Ocean and Cryosphere in a Changing Climate. Ed. by H.-O. Pörtner, D. C. Roberts, V. Masson-Delmotte, P. Zhai, M. Tignor, E. Poloczanska, K. Mintenbeck, A. Alegría, M. Nicolai, A. Okem, J. Petzold, B. Rama, and N. M. Weyer. Cambridge University Press, Cambridge.
Johannesen, E., Ingvaldsen, R. B., Bogstad, B., Dalpadado, P., Eriksen, E., Gjøsæter, H., Knutsen, T., et al. 2012. Changes in Barents Sea ecosystem state, 1970–2009: climate fluctuations, human impact, and trophic interactions. ICES Journal of Marine Science, 69: 880-889.
Loeng, H. 1991. Features of the physical oceanographic conditions of the Barents Sea. Polar Research, 10: 5-18.
Michalsen, K., Dalpadado, P., Eriksen, E., Gjøsæter, H., Ingvaldsen, R. B., Johannesen, E., Jørgensen, L. L.., et al. 2013. Marine living resources of the Barents Sea – Ecosystem understanding and monitoring in a climate change perspective. Marine Biology Research, 9: 932-947.
Nishino, S., Kawaguchi, Y., Inoue, J., Hirawake, T., Fujiwara, A., Futsuki, R., Onodera, J., et al. 2015. Nutrient supply and biological response to wind-induced mixing, inertial motion, internal waves, and currents in the northern Chukchi Sea. Journal of Geophysical Research: Oceans, 120: 1975-1992.
Oziel, L., Neukermans, G., Ardyna, M., Lancelot, C., Tison, J.-L., Wassmann, P., Sirven, J., et al. 2017. Role for Atlantic inflows and sea ice loss on shifting phytoplankton blooms in the Barents Sea. Journal of Geophysical Research: Oceans, 122: 5121-5139.
Randelhoff, A., Holding, J., Janout, M., Sejr, M. K., Babin, M., Tremblay, J.-É., and Alkire, M. B. 2020. Pan-Arctic Ocean Primary Production Constrained by Turbulent Nitrate Fluxes. Frontiers in Marine Science, 7.
Sandø, A. B., Mousing, E. A., Budgell, W. P., Hjøllo, S. S., Skogen, M. D., and Ådlandsvik, B. 2021. Barents Sea plankton production and controlling factors in a fluctuating climate. ICES Journal of Marine Science, 78: 1999-2016.
Skaret, G., Dalpadado, P., Hjøllo, S. S., Skogen, M. D., and Strand, E. 2014. Calanus finmarchicus abundance, production and population dynamics in the Barents Sea in a future climate. Progress in Oceanography, 125: 26-39.
Skogen, M. D., Hjøllo, S. S., Sandø, A. B., and Tjiputra, J. 2018. Future ecosystem changes in the Northeast Atlantic: a comparison between a global and a regional model system. ICES Journal of Marine Science, 75: 2355-2369.
Slagstad, D., Wassmann, P. F. J., and Ellingsen, I. 2015. Physical constrains and productivity in the future Arctic Ocean. Frontiers in Marine Science, 2.
pH [SI35]
Phenomenon: Decreasing pH [SP35]
Ecosystem characteristic: Abiotic factors
Under the reference condition, the water column is basic with a surface pH of about 8.
The most important anthropogenic driver of change in the indicator is climate change and increased CO2. Ocean uptake of excess atmospheric CO2 caused by human activities, such as fossil fuel burning, and industrialization, has increased ocean CO2 over a relatively short time period. Since 1750, the pH has decreased by about 0.1 units, corresponding to a 30% increase of hydrogen ions (less basic ocean). Currently, observations show a continued pH decrease of 0.02 per decade (Copernicus Marine Services, 2021). Continued pH decrease is rated as highly likely (IPCC, 2019). The understanding of the link between driver and change in the indicator is rated as certain.
Altered pH may directly affect the internal cellular processes in marine organisms, such as the ion pump and other redox reactions. pH may also change the availability and toxicity of vital metals, potentially changing the biological production. Also, increased pCO2 may lead to hypercapnia in fish if exceeding levels above 1000 ppm (McNeil and Sasse, 2016). However, the current understanding of the effect of reduced pH on ecosystem is mainly based on acute, short term-experiments and ecosystem modelling (Browman, 2016). Hence the understanding of the importance of changes in the indicator for the ecosystem is rated as less good.
There are large knowledge gaps on the effect of reduced pH on organisms and marine ecosystems. The effects need to be related to studies of adaptive capacity and should include multi-stressors. This requires multi-disciplinary observational long-term data sets in relevant areas (Browman, 2016).
References
Browman, H. I. 2016. Applying organized scepticism to ocean acidification research Introduction. ICES Journal of Marine Science, 73: 529-536.
Copernicus Marine Services 2021. Copernicus Marine Services.
IPCC 2019. IPCC Special Report on the Ocean and Cryosphere in a Changing Climate. Ed. by H.-O. Pörtner, D. C. Roberts, V. Masson-Delmotte, P. Zhai, M. Tignor, E. Poloczanska, K. Mintenbeck, A. Alegría, M. Nicolai, A. Okem, J. Petzold, B. Rama, and N. M. Weyer. Cambridge University Press, Cambridge.
McNeil, B. I., and Sasse, T. P. 2016. Future ocean hypercapnia driven by anthropogenic amplification of the natural CO2 cycle. Nature, 529: 383-386.
Aragonite saturation [SI36]
Phenomenon: Decreasing aragonite saturation [SP36]
Ecosystem characteristic: Abiotic factors
Under the reference condition, aragonite saturation is high enough for calcifying organisms to occur with biomasses high enough to sustain Arctic and Sub-Arctic food webs and ecological processes characterizing Arctic and Sub-Arctic ecosystems.
The most important anthropogenic driver of change in the indicator is climate change and increased CO2. Ocean uptake of excess atmospheric CO2 caused by human activities, such as fossil fuel burning and industrialization, is causing ocean CO2 to increase. The ocean carbonate ion concentration (CO32-) is driving the aragonite saturation (ΩAr) and the chemical dissolution of the aragonite. Decreasing pH (increasing ocean CO2) has resulted in decreasing saturation state with regards to calcium carbonate (CaCO3), with consequences for the dissolution potential and calcification process. Aragonite is the most labile form of CaCO3 in the ocean and the Arctic Ocean already has the lowest ΩAr compared to the world oceans (e.g., Chierici and Fransson, 2009). Continued decrease of ΩAr is expected is rated highly likely (IPCC, 2019). The understanding of the link between driver and change in the indicator is thus rated as certain.
The lowering of CaCO3 saturation states (Ω), impacts shell-forming marine organisms from plankton to benthic molluscs, echinoderms, and corals. Many calcifying species exhibit reduced calcification and growth rates in laboratory experiments under high-CO2 conditions (e.g. Kroeker et al., 2013; Manno et al., 2017). Another consequence is also the shoaling of aragonite saturation horizon (ΩAr<1, i.e dissolution of aragonite) which will continue and has consequences for cold-water corals and their ability to withstand erosion and continue to grow (ICES, 2014; AMAP, 2018). At Ω<1 more energy is required to build CaCO3 (e.g., Comeau et al., 2013). Climate change, such as warming, enhances the effect of low saturation states. However, the current understanding of the effect of Ω in the ecosystem is mainly based on acute, short-term experiments and ecosystem modelling (Browman, 2016). There are ocean observations, especially in upwelling sites and other low-aragonite areas that show clear evidence of shell deformation on shelled butterfly snails, crabs and mussels. This has been observed in the Pacific Arctic also where saturation states are lowest (Cross et al., 2018; Bednaršek et al., 2021; Niemi et al., 2021). Although this implies that the knowledge on the effect on calcifying organisms is good, the overall understanding of the importance of changes in the indicator for the ecosystem is rated as less good.
There are large knowledge gaps about the thresholds and adaptive capacity to perform calcification at low saturation states. Amplification and occurrence of corrosive events have been observed in the Arctic Ocean. However, the effects on the marine ecosystem are poorly understood. The effects need to be related to studies of adaptive capacity and should include multi-stressors (Rastrick et al., 2018). This also requires multi-disciplinary observational long-term data sets in relevant areas.
References
AMAP. 2018. AMAP Assessment 2018: Arctic Ocean Acidification. Arctic Monitoring and Assessment Programme (AMAP). vi+187pp pp.
Bednaršek, N., Calosi, P., Feely, R. A., Ambrose, R., Byrne, M., Chan, K. Y. K., Dupont, S., et al. 2021. Synthesis of Thresholds of Ocean Acidification Impacts on Echinoderms. Frontiers in Marine Science, 8.
Browman, H. I. 2016. Applying organized scepticism to ocean acidification research Introduction. ICES Journal of Marine Science, 73: 529-536.
Chierici, M., and Fransson, A. 2009. Calcium carbonate saturation in the surface water of the Arctic Ocean: undersaturation in freshwater influenced shelves. Biogeosciences, 6: 2421-2431.
Comeau, S., Carpenter, R. C., and Edmunds, P. J. 2013. Coral reef calcifiers buffer their response to ocean acidification using both bicarbonate and carbonate. Proceedings of the Royal Society B: Biological Sciences, 280: 20122374.
Cross, J., Mathis, J., Pickart, R., and Bates, N. 2018. Formation and transport of corrosive water in the Pacific Arctic region. Deep Sea Research Part II, 152.
ICES. 2014. Final Report to OSPAR of the Joint OSPAR/ICES Ocean Acidification Study Group (SGOA). ICES CM 2014/ACOM:67. 141 pp.
IPCC 2019. IPCC Special Report on the Ocean and Cryosphere in a Changing Climate. Ed. by H.-O. Pörtner, D. C. Roberts, V. Masson-Delmotte, P. Zhai, M. Tignor, E. Poloczanska, K. Mintenbeck, A. Alegría, M. Nicolai, A. Okem, J. Petzold, B. Rama, and N. M. Weyer. Cambridge University Press, Cambridge.
Kroeker, K. J., Kordas, R. L., Crim, R., Hendriks, I. E., Ramajo, L., Singh, G. S., Duarte, C. M., et al. 2013. Impacts of ocean acidification on marine organisms: quantifying sensitivities and interaction with warming. Global Change Biology, 19: 1884-1896.
Manno, C., Bednaršek, N., Tarling, G. A., Peck, V. L., Comeau, S., Adhikari, D., Bakker, D. C. E., et al. 2017. Shelled pteropods in peril: Assessing vulnerability in a high CO2 ocean. Earth-Science Reviews, 169: 132-145.
Niemi, A., Bednaršek, N., Michel, C., Feely, R. A., Williams, W., Azetsu-Scott, K., Walkusz, W., et al. 2021. Biological Impact of Ocean Acidification in the Canadian Arctic: Widespread Severe Pteropod Shell Dissolution in Amundsen Gulf. Frontiers in Marine Science, 8.
Rastrick, S. S. P., Graham, H., Azetsu-Scott, K., Calosi, P., Chierici, M., Fransson, A., Hop, H., et al. 2018. Using natural analogues to investigate the effects of climate change and ocean acidification on Northern ecosystems. ICES Journal of Marine Science, 75: 2299-2311.