Denne toktrapporten gjelder Mareano-metodetoktet gjennomført i juni 2022 som hovedsakelig var fokusert på bruken av AUV-en Munin+ i habitatkartlegging og testing av en ny skips-ADCP. Denne rapporten både registrerer aktivitetene til toktet og gir en foreløpig evaluering av dette utstyret og dataene de samler inn.
Cruise report 2022106
— MAREANO methods cruise: AUV testing (Munin +)
Report series:
Toktrapport 2023-6
ISSN: 1503-6294
Published: 22.05.2023
Cruise no.: 2022106
Project No.: 15312-11
On request by: Mareano
Research group(s):
Bunnsamfunn
Program:
Marine prosesser og menneskelig påvirkning
Research group leader(s):
Sigurd Heiberg Espeland (Bunnsamfunn)
Approved by:
Research Director(s):
Geir Lasse Taranger
Program leader(s):
Frode Vikebø
Norsk sammendrag
Summary
This cruise report relates to the Mareano methods testing cruise undertaken in June 2022 which was mainly focussed on the use of the AUV Munin+ in habitat mapping, and the testing of a new shipborne ADCP. This report both records the activities of the cruise and provides some initial evalutaiton of these equiment and the data they collect.
1 - Overview
Cruise 2022106 was planned to test HI’s Kongsberg Munin+ (1500m rated) AUVs for use in MAREANO and similar mapping programmes, to begin to design standard operating procedures for using AUVs in general, and to evaluate the Kongsberg Simrad EC150-3C Shipboard ADCP for future purchase amongst the HI fleet. In practice the cruise encountered many issues including technical issues with the Munin+ AUVs and bad weather, so the AUV testing was not as extensive as planned while ADCP testing was comprehensive and additional opportunistic sub-bottom profiler data was collected over a known pockmark field. Three AUV dives did collect data, and example data from each sensor on board the Munin+ is available for evaluation.
We conclude that AUVs show great potential in their ability to gather high quality and high resolution datasets, but the Munin+ in particular seems to still have too many technical issues to be of practical use in mapping programmes at present. We are hopeful that Kongsberg can rectify the main issues (inability to dive unassisted in calm conditions, inability to dive when the start depth is >200m) and that further testing when the Munin+ is fully operational will allow approval for use in mapping programmes in the near future. The ADCP testing was successful and promising and includes the collection of a dataset that will allow comparison of the EC150-3C and the RDI Ocean Surveyor 150 kHz ADCPs performance in 200-400m waters.
2 - Summary Statistics
18 AUV missions planned
-
13 before the cruise
-
5 on board
-
10 with detailed plans in HuginOS designed on board
11 attempted launches of the AUV
3 missions collected data
-
Testfelt: «Mission_55_20220601_4»
-
AUV møre: «Mission_55_20220606_2»
-
AUV Rovdefjorden: «Mission_55_20220608_3»
1 mission completed the entire mission plan
-
AUV møre: «Mission_55_20220606_2»
1 application to FOH sent and approved while on board
~175km Topas Data collected, and
~101 hours of ADCP testing completed whilst:
- under transit
-
there was bad weather
-
we waited for solutions and approvals.
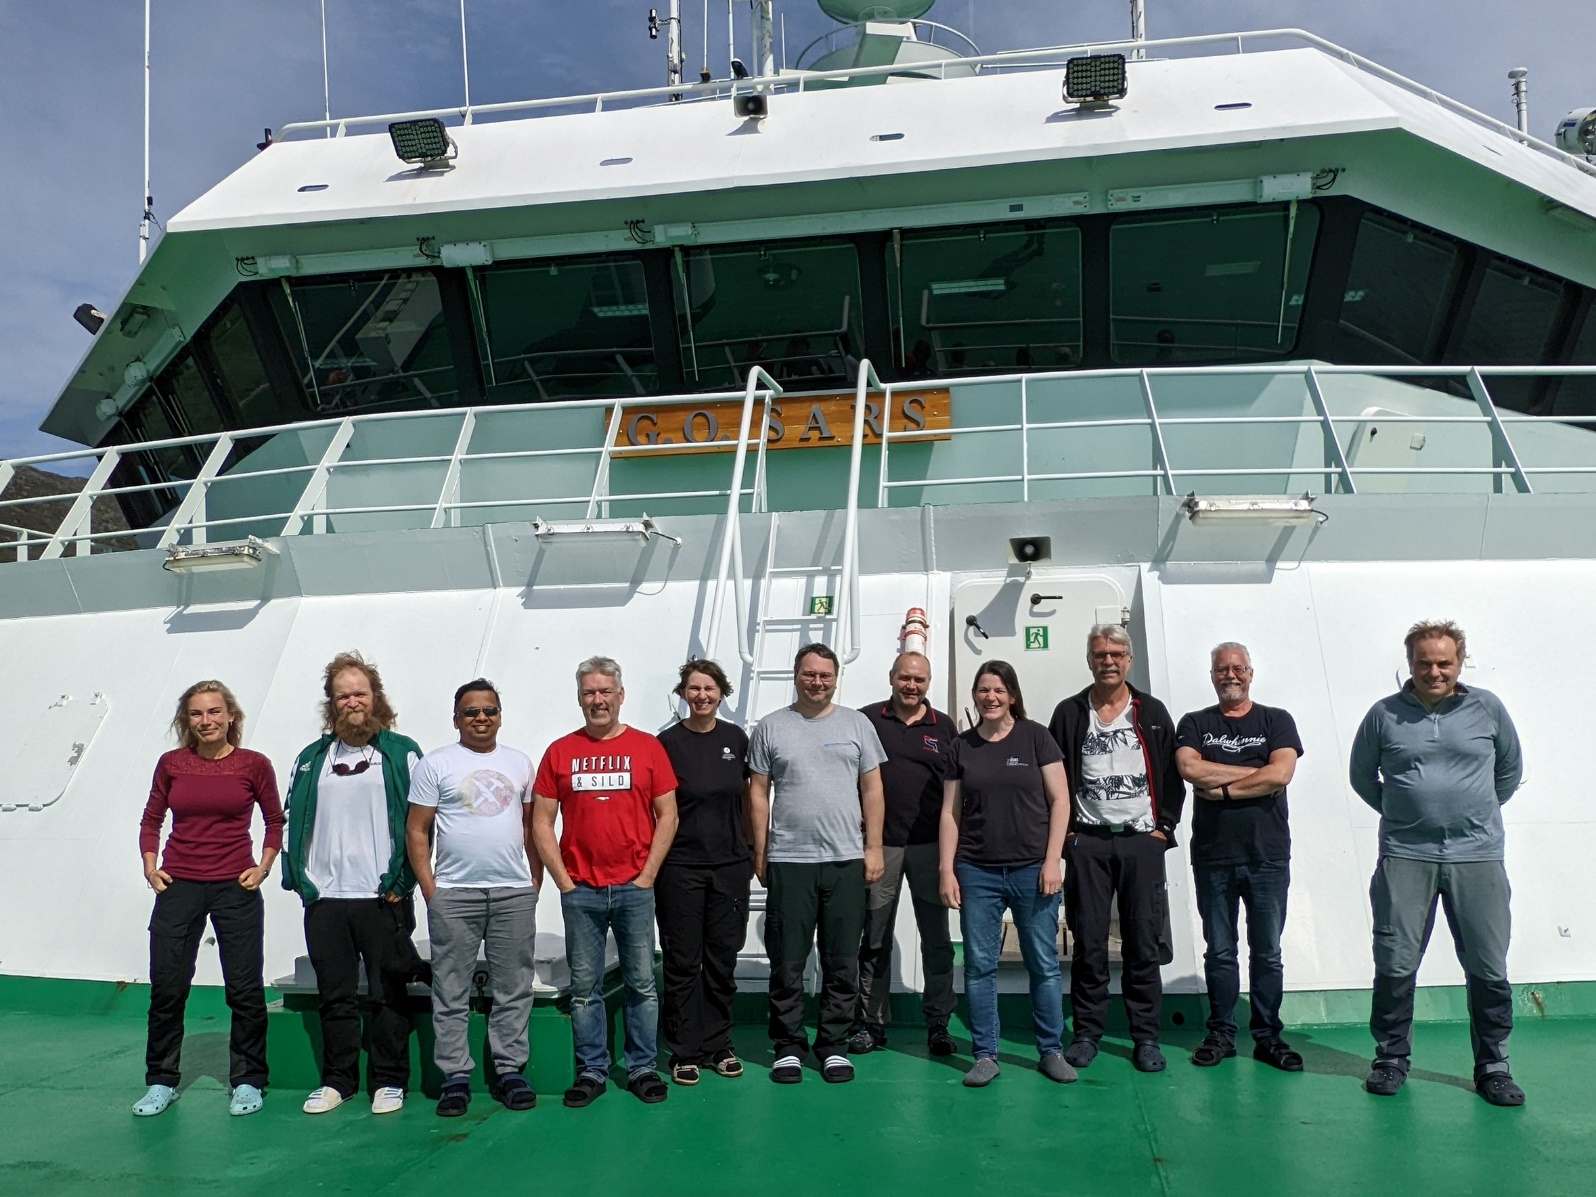
3 - Cruise Participants
-
Institute Person Rolle NB HI Rebecca Ross Cruise leader, Photos HI Kyrre Heldal Kartveit HiSAS, BioAcoustic HI Lene Christensen HiSAS, BioAcoustic, Photos HI Arnfinn Morvik NMD HI Martin Dahl Instrument, ship HI Leif Johan Ohnstad Instrument, AUV operator HI Jan Arne Vågenes Instrument, AUV operator HI Marek Ostrowski Oceanographer - ship ADCP HI Karsten Arne Kvalsund Oceanographer - AUV NGU Margaret Dolan Backscatter, Photos NGU Shyam Chand Backscatter, SBP Kartverket Tor Jan Meek Bathymetry Kongsberg Ivar Wangen Ship ADCP support Kongsberg Stig Raen AUV support Mobilisation & Test dive only Kongsberg Kenneth Fredriksen AUV support
4 - Main Aims
To test the use of the Munin+ AUV for use in MAREANO/ similar surveys in the future. Testing should include:
-
Combined MBES/ HiSAS surveys, over varying terrains and MBES/ HiSAS comparison
-
Photo survey planning/ modification based on acoustics collected in previous mission
-
Photo surveys with varying patterns over varying terrains and previous (Campod/Chimera) video lines to compare results
-
General testing of AUV survey limits
-
Compilation of standard operating procedure protocols for MAREANO and similar surveys
Additional aim to test shipboard ADCP prior to fleetwide purchase. This has lower priority but is accommodated as far as possible.
5 - Equipment
Kongsberg Munin+ AUV (1500m depth limit) with:
| EM2040M | Magnetisk kompassLeica DMC |
| HISAS 20401 | DybdesensorParoscientific DigiQuartz 8000-series |
| EdgeTech SSS (230/540 kHz) | CT SensorNeil Brown Ocean Sensors |
| EdgeTech SBP (4-24 kHz) | GPS mottakerNovatel L1/L2 |
| Cathx Ocean still image color camera 48.5 deg FOV and laser profiler | Forward Looking Sonar(FLS)/Anti-Collision SystemImagenex |
| DVL med ADCP Nortek DVL500 | cNODE transponder for posisjonering via HiPAP |
| IMUHoneywell HG9900 |
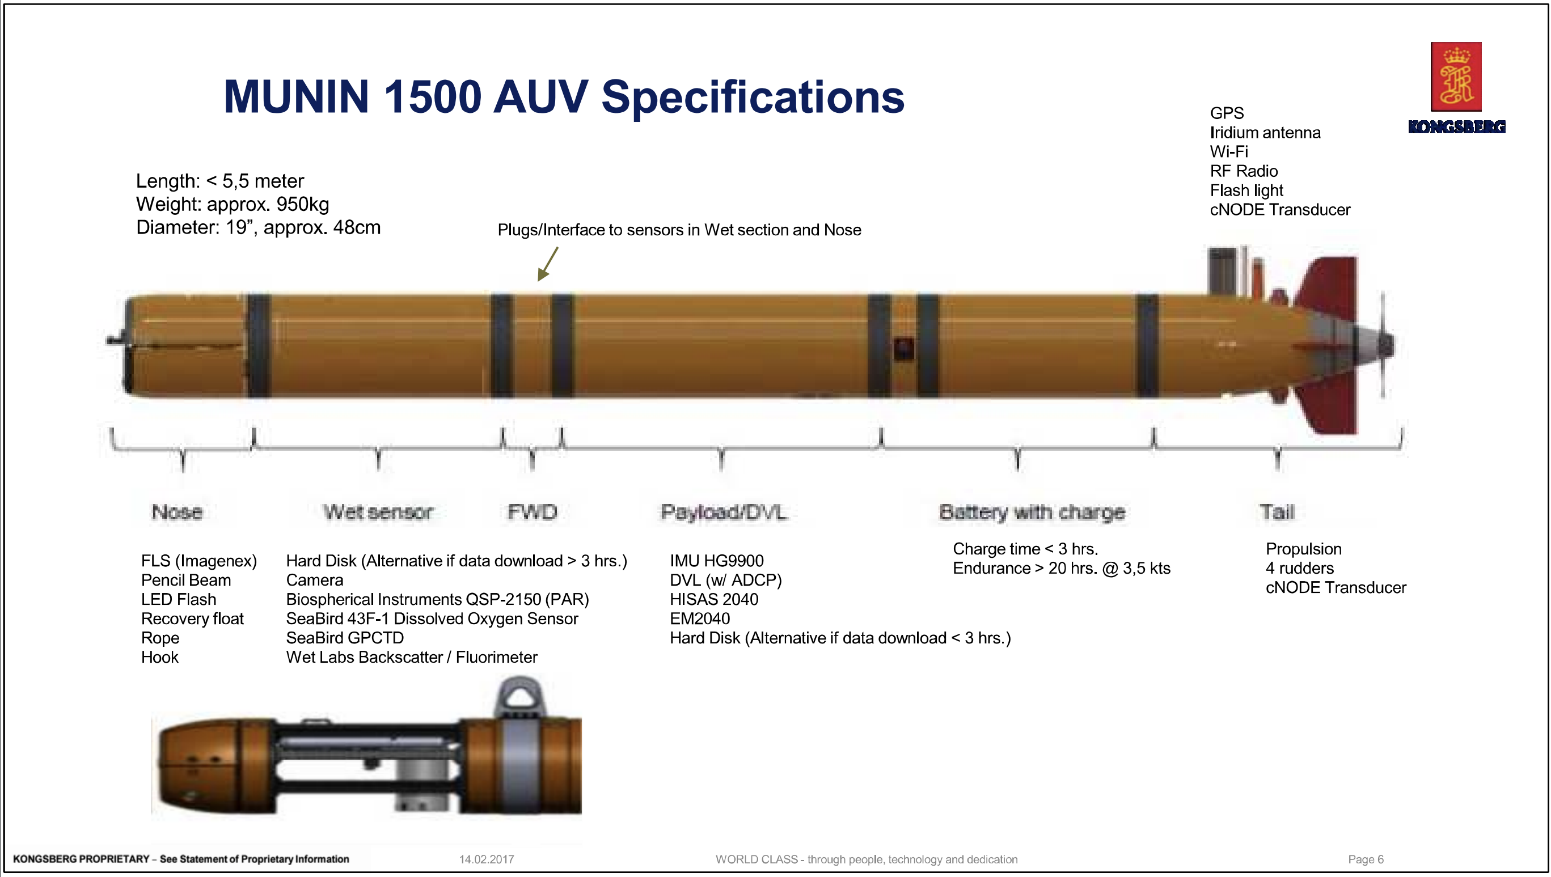
HISAS 20401:
"HISAS bathymetry, combining HISAS and EM2040 MBES in HUGIN and MUNIN 1500+… In addition to the HISAS the AUV is equipped with an EM 2040 multibeam echo sounder (MBES), combining the HISAS and MBES results in a coverage for a singular track of more than 20 times the flying altitude above the seabed of the AUV used compared to 3-4 times the altitude using MBES alone.” https://argeo.no/referanse/side-scan-sonar-sss-og-hisas/
Kongsberg Simrad EC150-3C Shipboard ADCP:
Optimised for operation to depths of 200-400m, this ADCP was tested on this cruise to compare with the existing shipboard ADCP (RDI Ocean Surveyor 150 kHz) and evaluate whether the EC150-3C should be purchased for all ships in the fleet.
Topas PS 18 Shipboard sub-bottom profiler:
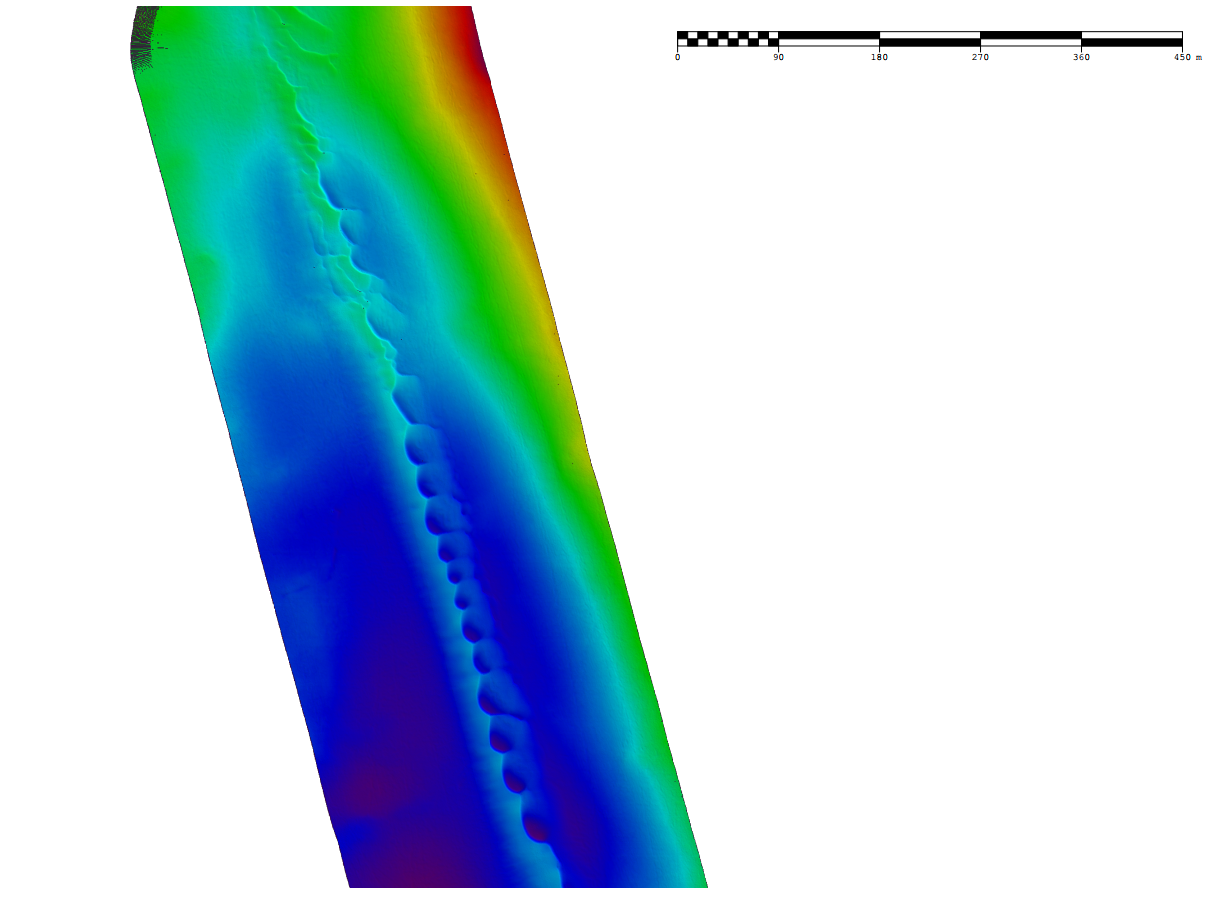
This was used opportunistically during weather and technical downtime to run SBP transects over known pockmark fields.
EM302 Shipboard Multibeam Echosounder:
Used to collect water column MB data during SBP transects
6 - Cruise track
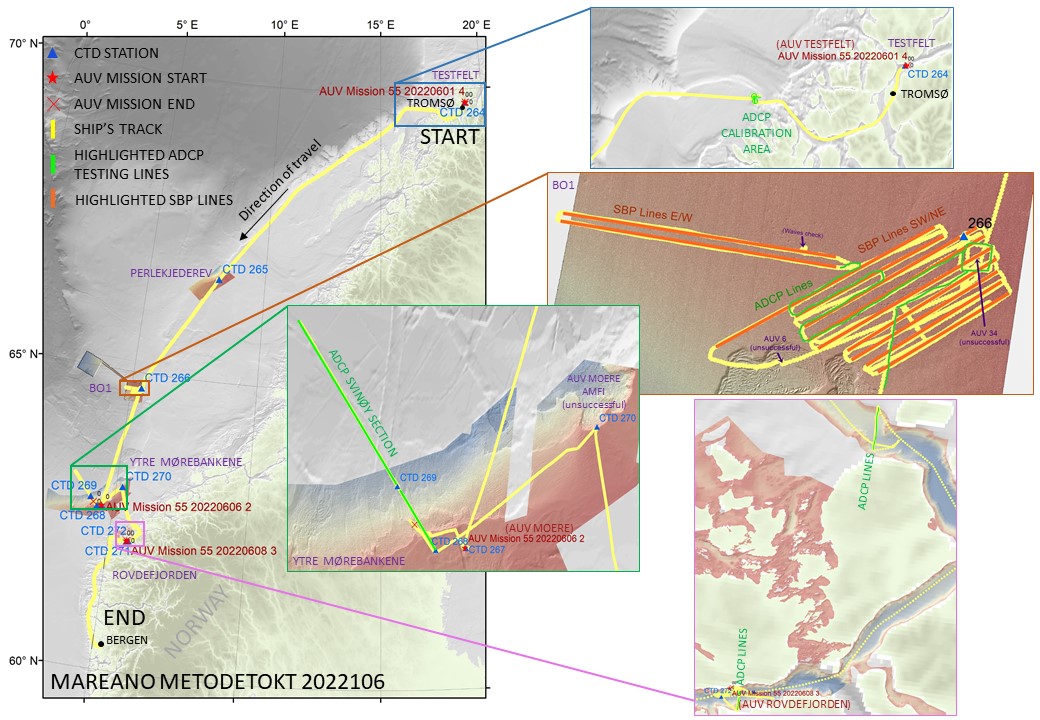
Start Tromsø 31.05.22
BLUE BOX ON MAP
-
Transit to Testfelt
-
Transit to Tromsø (drop off kongsbrg)
-
Transit to ADCP calibration W of Tromsø
TRANSIT
-
Follow 200-400m contour SW to Perlekjedere
-
Continue to BO1
ORANGE BOX ON MAP
-
SBP/WC lines SW to NE
-
SBP/WC lines E to W
-
ADCP lines retracing part of SBP SW to NE lines
-
ADCP lines square around AUV34
TRANSIT
-
Transit to AUV Moere
GREEN BOX ON MAP
-
Follow AUV to NW
-
Transit to start of Svinøy Section
-
ADCP Svinøy Section SE to NW
-
Transit to AUV Moere Amfi
PURPLE BOX ON MAP
-
Transit to ADCP lines W of Ålesund
-
Transit to AUV Rovdefjorden
-
ADCP lines crossing Rovdefjorden overnight
TRANSIT
-
Transit to Måløy
-
Transit to Bergen
End Bergen 09.06.22
7 - Activity Log
NB. Shifts were 08:00 – 20:00 – no night shift except occasional scientific cover (no AUV/ instrument due to understaffing) so nights were reserved for transits, shipmounted ADCP testing, or shipmounted SBP/ water column MBE lines (the latter two were predominantly unmanned with occasional reviews).
| Date | Approx Time | UTC | Activity | Site | Long_E | Lat_N | Comment |
| 31.mai | 08:00 | Mobilisation | Tromsø | 018° 59.506 | 69° 40.718 | Science team from 11/last one at 14.00. Mounting of stinger took a while due to waiting for parts (ok for next time) | |
| 01.jun | 08:30 | Transit to test site | |||||
| 01.jun | 09:30 | Arrive at test site | AUV 0 | 019° 09.842 | 69° 46.577 | Some time spent making sure all systems were operational and ready | |
| 01.jun | 11:30 | 09:27 | CTD 264 | AUV 0 | 019° 09.842 | 69° 46.577 | Needed for sound velocity profile & AUV CT groundtruthing |
| 01.jun | 13:20 | AUV Mission 55 20220601 1 | AUV 0 | 019° 09.842 | 69° 46.577 | Float test, then aborted - unable to dive. NB Mission name = farkost # 55, date yyyymmdd, dive number | |
| 01.jun | 14:05 | AUV Mission 55 20220601 2 | AUV 0 | 019° 09.842 | 69° 46.577 | Aborted - unable to dive | |
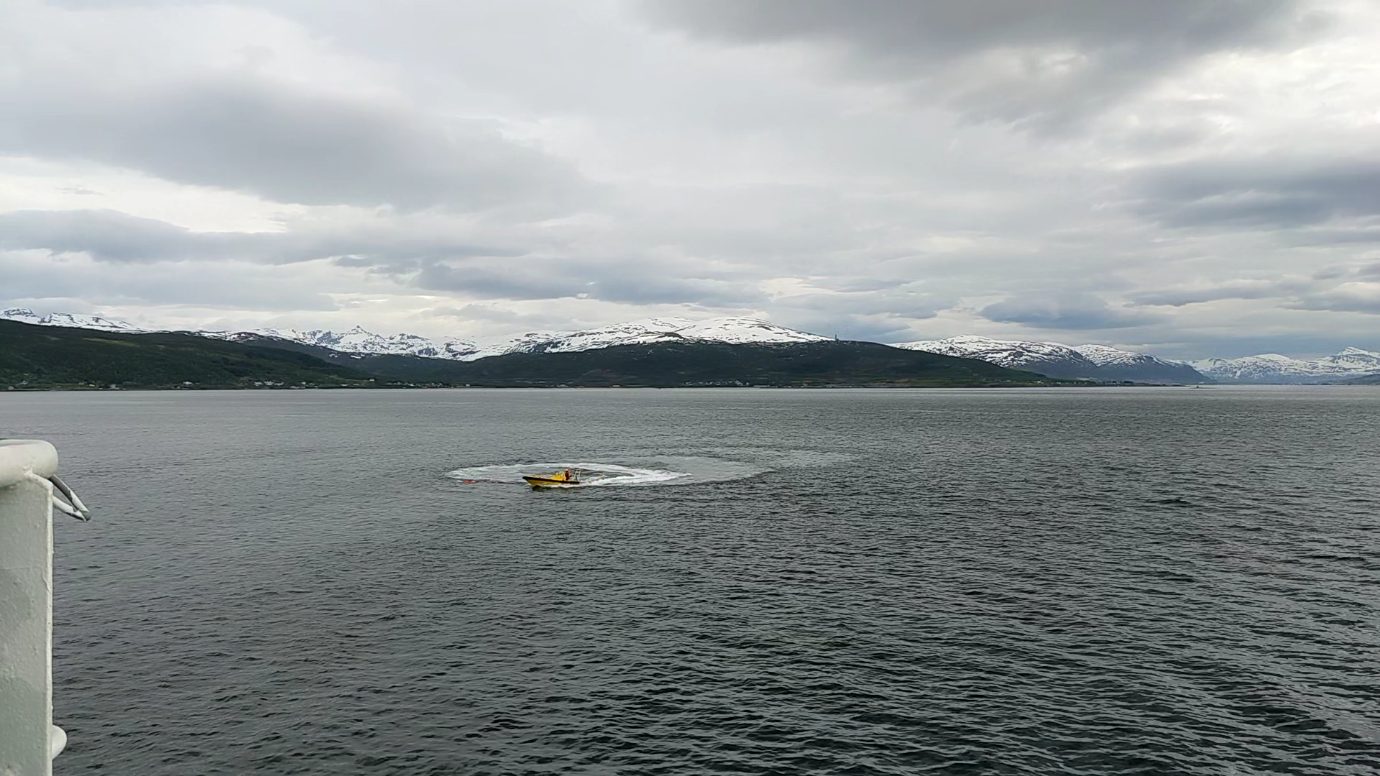
| 01.jun | 15:55 | AUV Mission 55 20220601 3 | AUV 0 | 019° 09.842 | 69° 46.577 | Aborted - unable to dive, used MOB boat to try to create waves to sink it but failed | |
| 01.jun | 18:00 | AUV Mission 55 20220601 4 | AUV 0 | 019° 09.842 | 69° 46.577 | Successful - MOB boat used again and was successful - NB dive reduced length compared to plan to return kongsberg pair | |
| 01.jun | 19:50 | AUV back on deck | AUV 0 | 019° 10.718 | 69° 46.660 | ||
| 01.jun | 20:00 | Transit to Tromsø | |||||
| 01.jun | 20:50 | Arrive Tromsøysundet for kongsberg dropoff | 019° 00.570 | 69° 40.701 | Dropped off Kongsberg support ~kl. 22:30 via MOB boar (they helped fix a few more things before leaving) | ||
| 01.jun | 22:45 | Transit to ADCP calibration | |||||
| 02.jun | 02:30 | ADCP cailbration start | 017° 27.399 | 69° 39.899 | Involved ship driving perpendicular lines and figure of 8 circles | ||
| 02.jun | 04:30 | ADCP calibration end | 017° 27.1197 | 69° 40.992 | |||
| 02.jun | 04:30 | Transit to Perlekjederev | Followed ADCP calibration route - out to shelf edge then follow shelf S at 200-400m contour | ||||
| 03.jun | 09:30 | Arrive at Perlekjederev | AUV 1 | 007° 58.856 | 66° 42.669 | ||
| 03.jun | 09:45 | 07:45 | CTD 265 | AUV 1 | 007° 58.856 | 66° 42.669 | Needed for sound velocity profile & AUV CT groundtruthing |
| 03.jun | 10:30 | AUV Mission 55 20220603 1 | AUV 1 | 007° 58.856 | 66° 42.669 | Aborted - dove to 20m then emergency ascent (unknown reason, spent long time fixing) | |
| 03.jun | 16:00 | AUV Mission 55 20220603 2 | AUV 1 | 007° 58.856 | 66° 42.669 | Aborted - dove to 40m then emergency ascent (unknown reason again - issue & near shift end, decide to transit to BO1) | |
| 03.jun | 16:50 | Transit to AUV6 | |||||
| 04.jun | 08:10 | Arrive at AUV6 | AUV 6 | 005° 09.550 | 64° 38.509 | Weather is unsuitable for launch until Sunday 05.06 so dives cancelled for today, plan SBP lines | |
| 04.jun | 09:35 | Transit to SBP/WC MBE lines | |||||
| 04.jun | 09:45 | Begin SBP/WC MBE Lines 1st set | SW to NE SBP lines | 005° 02.982 | 64° 38.154 | 9km lines from AUV6 to NE and back - 9 lines at 4-5knot | |
| 04.jun | 15:40 | Start taking every other line | SW to NE SBP lines | NE to SW legs were too bad quality, so sped down those and focussed on collecting good SW to NE legs at 4-5knot | |||
| 05.jun | 00:00 | Return to opposite lines in good direction | SW to NE SBP lines | Time approx.. - begin returning to bad legs and collecting them in good SW to NE direction - completed coverage | |||
| 05.jun | 08:00 | Begin SBP/WC MBE Lines 2d set | E to W SBP lines | Completed 2 lines (although stopped briefly ~20m before end of 2nd line to check waves for AUV) | |||
| 05.jun | 13:40 | End of SBP collection | E to W SBP lines | Short transit back to middle of 1st set of SB/WC MBE sampling lines | |||
| 05.jun | 13:40 | ADCP testing pattern | SW to NE ADCP lines | Southern half of first set of SBP/WC MBE lines at 10knot i.e. ~4.5 km turn, 4.5km turn etc | |||
| 05.jun | 15:55 | ADCP testing square around AUV34 | ADCP Square @ AUV 34 | 005° 24.085 | 64° 44.062 | ADCP square surrounding AUV34 awaiting weather improvement to start AUV dive asap | |
| 05.jun | 17:00 | 15:00 | CTD 266 | near AUV 34 | 005° 24.433 | 64° 44.733 | Weather improved enough to try dive, stop ADCP testing |
| 05.jun | 17:25 | Transit to AUV34 start point | AUV 34 | ||||
| 05.jun | 17:45 | In postion | AUV 34 | 005° 25.122 | 64° 42.678 | ||
| 05.jun | 18:00 | Pre-flight checks start | AUV 34 | 005° 25.122 | 64° 42.678 | Recorded to see what time budget should be for pre-dive | |
| 05.jun | 18:17 | AUV Mission 55 20220605 1 in water | AUV 34 | 005° 25.122 | 64° 42.678 | ||
| 05.jun | 18:24 | AUV diving | AUV 34 | 005° 25.122 | 64° 42.678 | ||
| 05.jun | 18:34 | AUV dropped weights | AUV 34 | 005° 25.122 | 64° 42.678 | got to 335m then error -"received external command" without one being sent | |
| 05.jun | 19:10 | AUV on deck | AUV 34 | 005° 25.122 | 64° 42.678 | ||
| 05.jun | 19:10 | Resume ADCP testing pattern | SW to NE ADCP lines | ||||
| 05.jun | 21:50 | Start transit to Møre | Suggestion that AUV errors can be overcome if start depth is <200m, so selected site in Møre - transit ~13hrs | ||||
| 06.jun | 10:45 | On station | AUV moere | 005° 30.363 | 62° 40.950 | ||
| 06.jun | 10:45 | 08:46 | CTD 267 | AUV moere | 005° 30.363 | 62° 40.950 | |
| 06.jun | 11:24 | AUV in water Mission 55 20220606 2 | AUV moere | 005° 30.363 | 62° 40.950 | Successful dive (Software restart resulted in dive number 2 on this date - there was no dive 1) | |
| 06.jun | 17:35 | AUV on deck | AUV moere | 004° 15.399 | 62° 45.240 | ||
| 06.jun | 17:40 | Transit to start svinøy section | |||||
| 06.jun | 18:20 | 16:19 | CTD 268 | Svinøy section | 004° 24.000 | 62° 42.000 | |
| 06.jun | 18:30 | Start svinøy section towards NW | Svinøy section | 004° 24.000 | 62° 42.000 | ||
| 06.jun | 19:50 | 17:51 | CTD 269 | Svinøy section | 004° 07.247 | 62° 50.413 | |
| 06.jun | 23:30 | Reverse svinøy section (towards SE) | Svinøy section | 003° 23.515 | 63° 11.724 | ||
| 07.jun | 03:40 | Finish Svinøy section / transit to AUVmoereAmfi | 004° 07.247 | 62° 50.413 | |||
| 07.jun | 07:45 | In postion | AUV moere Amfi | 005° 14.314 | 63° 04.248 | ||
| 07.jun | 08:00 | 06:01 | CTD 270 | AUV moere Amfi | 005° 14.314 | 63° 04.248 | |
| 07.jun | 08:30 | Transit to near Ålesund | Transited to wait near Ålesund between Godøya and Hareid (awaiting permissions else will transit to Viking Banken) | ||||
| 07.jun | 13:50 | Arrived at waiting point | W of Ålesund | Awaited permissions until realising we could be doing ADCP testing lines while we wait | |||
| 07.jun | 14:30 | Begin ADCP testing lines N/S | ADCP lines W of Ålesund | 005° 54.109 | 62° 26.047 | Moved between 2 waypoints ~4.5km apart in this area in a N/S direction. | |
| 07.jun | 15:45 | Transit into Rovdefjorden | Oral permissions received, awaiting written permissions | ||||
| 07.jun | 18:30 | On site | AUV Rovdefjord Test | 005° 44.635 | 62° 12.478 | ||
| 07.jun | 18:30 | 16:30 | CTD 271 | AUV Rovdefjord Test | 005° 44.635 | 62° 12.478 | |
| 07.jun | 19:09 | AUV in water Mission 55 20220607 1 | AUV Rovdefjord Test | 005° 40.286 | 62° 11.181 | Decided to switch off all sensors/ data collection and test AUV diving ability after fixes while awaiting written permission | |
| 07.jun | 19:50 | AUV on deck | AUV Rovdefjord Test | 005° 39.400 | 62° 11.219 | ||
| 07.jun | 20:30 | Begin ADCP transit lines across Rovdefjorden | ADCP Rovdefjord lines N/S | 005° 42.319 | 62° 11.571 | Back and forth ~2km across fjord like a ferry - done throughout night (start in N) | |
| 08.jun | 08:00 | Transit to AUV Rovdefjorden | 005° 42.323 | 62° 10.543 | |||
| 08.jun | 08:24 | 06:24 | CTD 272 | 005° 40.298 | 62° 11.166 | ||
| 08.jun | 10:24 | Permission received | Clarified that Arnstein Osvik (Kartverket) could email permission - RR forwarded to GOSars Bro | ||||
| 08.jun | 10:30 | In position for AUV Rovdefjord1 | AUV Rovdefjord1 | 005° 41.125 | 62° 11.693 | ||
| 08.jun | 11:03 | AUV in water Mission 55 20220608 3 | AUV Rovdefjord1 | 005° 41.125 | 62° 11.693 | 2 lines acoustics collected, emergency ascent | |
| 08.jun | 12:00 | AUV on deck | AUV Rovdefjord1 | 005° 41.125 | 62° 11.693 | ||
| 08.jun | 13:52 | AUV in water Mission 55 20220608 4 | AUV Rovdefjord1 | 005° 41.125 | 62° 11.693 | 2nd attempt, emergency ascent before reaching bottom - last attempt | |
| 08.jun | 14:50 | AUV on deck | AUV Rovdefjord1 | 005° 41.125 | 62° 11.693 | End of Survey, begin transit to Bergen via Måløy (GO Sars needed to pick up parts) | |
| 08.jun | 14:55 | Begin transit to Måløy (for ships part) | |||||
| 08.jun | 18:15 | At quay in Måløy | 005° 08.529 | 61° 58.377 | |||
| 08.jun | 20:30 | Begin transit to Bergen | |||||
| 09.jun | 07:30 | Arrive in Bergen | 005° 18.835 | 60° 23.153 |
8 - Summary feedback by data type
Some feedback is here compiled from the scientists onboard and provided as an initial assessment of the data types collected/ tested during the cruise.
8.1 - Munin+ AUV sensors:
8.1.1 - Multibeam
8.1.1.1 - Bathymetry
Feedback from Tor Jan Meek, Kartverket
At the Tromsø test site there was an issue with an average 20cm difference in depth between overlapping swaths, with the photo lines (up /down slope) showing 20-50cm discrepancy. However this seems to have resolved at subsequent sites without any action taken. Apart from the problems at the Tromsø test site, the MBE data so far has been of very good quality. The MBE data from Mørebanken is much more consistent and of very good quality. Hardly any noise, just a few outliers which is expected, but no “real noise”, no visible sound velocity error, no visible position drift and less than 10cm depth difference between survey lines.
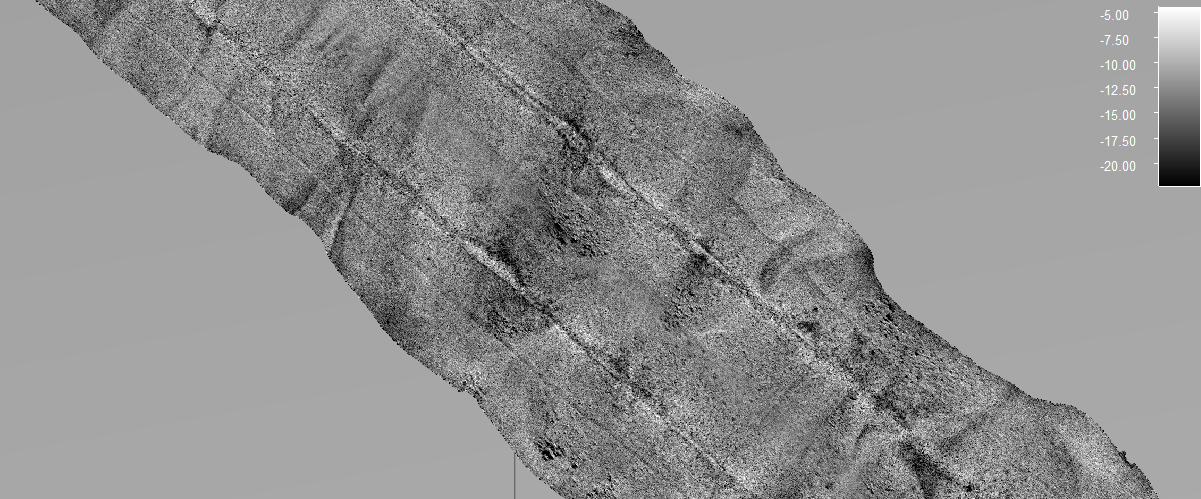
8.1.1.2 - Backscatter
Feedback from Margaret Dolan & Shyam Chand, NGU; Tor Jan Meek, Kartverket
Data resolution good and data are of reasonably good quality. There is striping in the data when processed with CARIS, this is improved when processed in FMGT. The data do not appear to be sector calibrated – requires KM support – extended backscatter calibration service (approx. 12 hour vessel time and 50 000 NOK fee). Some problems could also be linked to incomplete CTD information.
Processing with corrected navigation data not yet tested.
Updating CTD information from AUV CT sensor not yet tested.
Too little data collected for full evaluation. Further testing required.
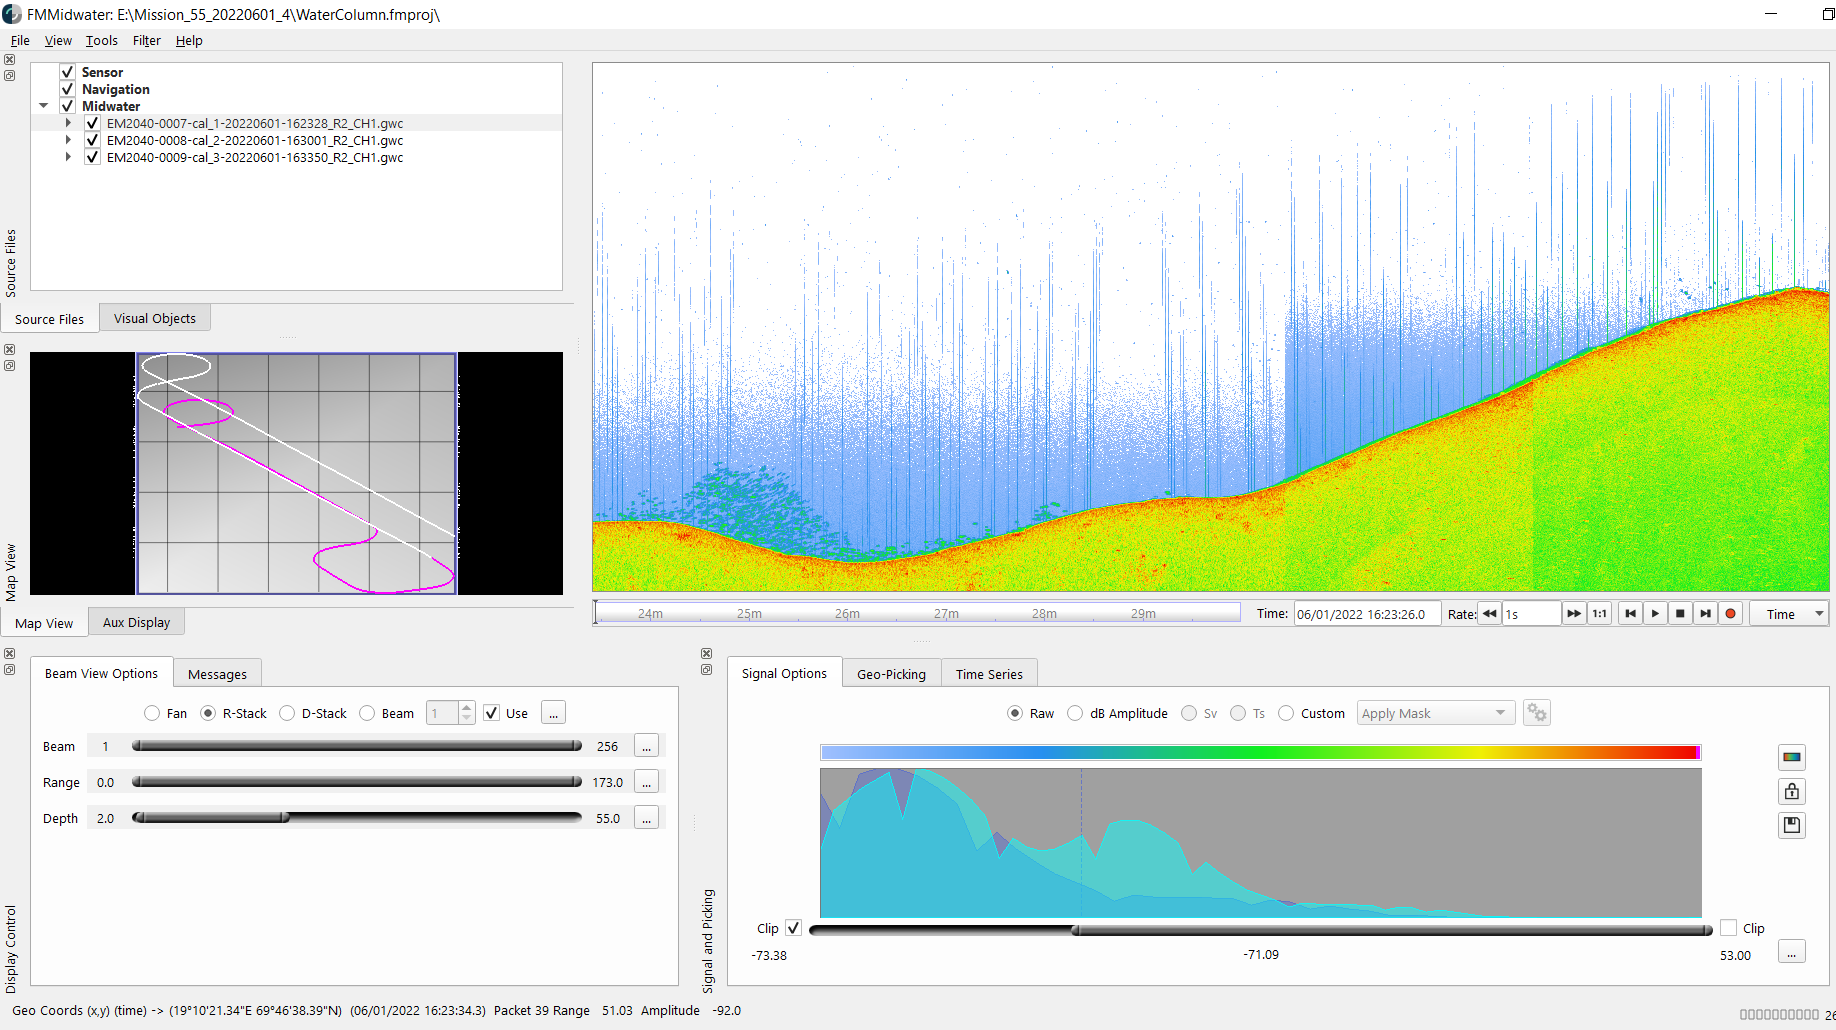
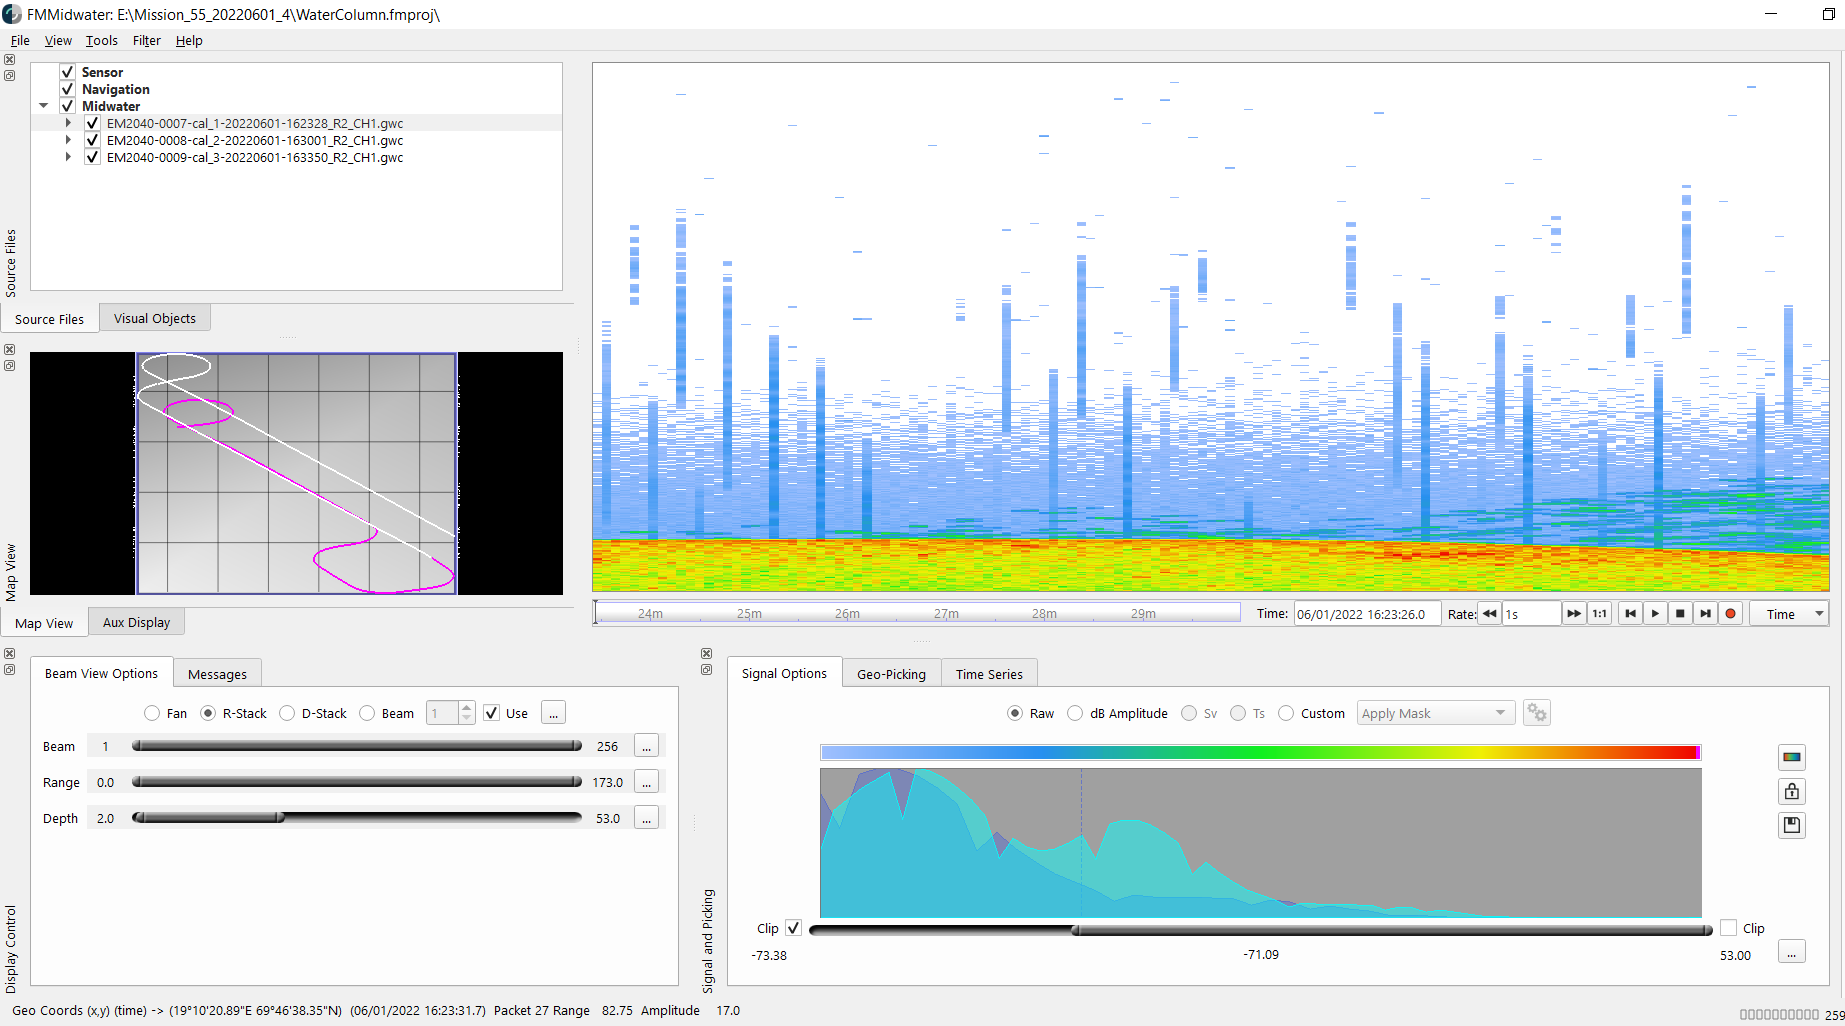
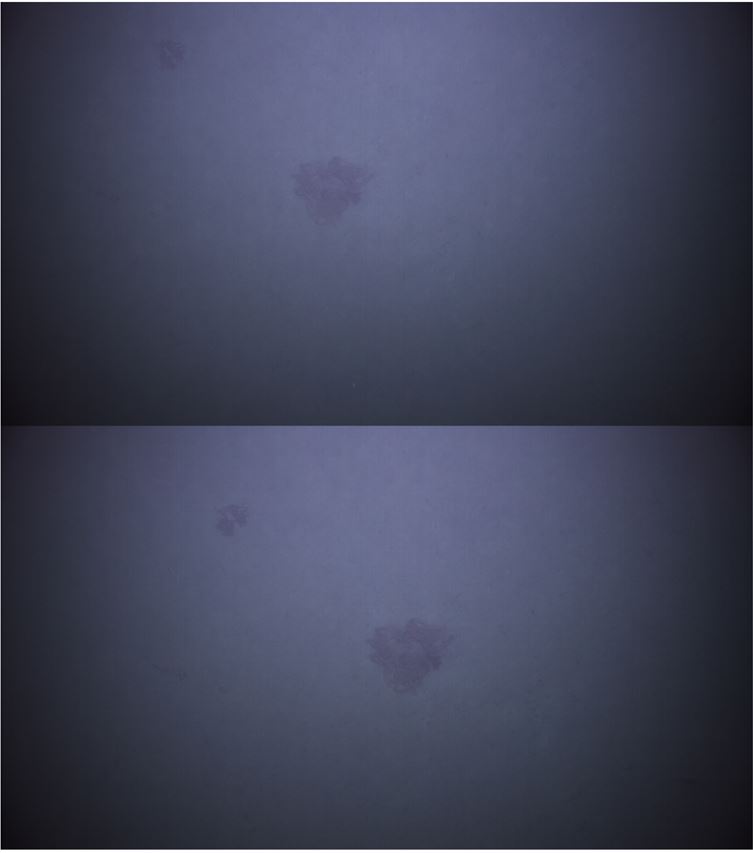
8.1.1.3 - Water column
Feedback from Margaret Dolan & Shyam Chand, NGU
Water column data is fine but interference from other systems were noticed. More testing is needed to single out the noise sources and efficiently avoid them.
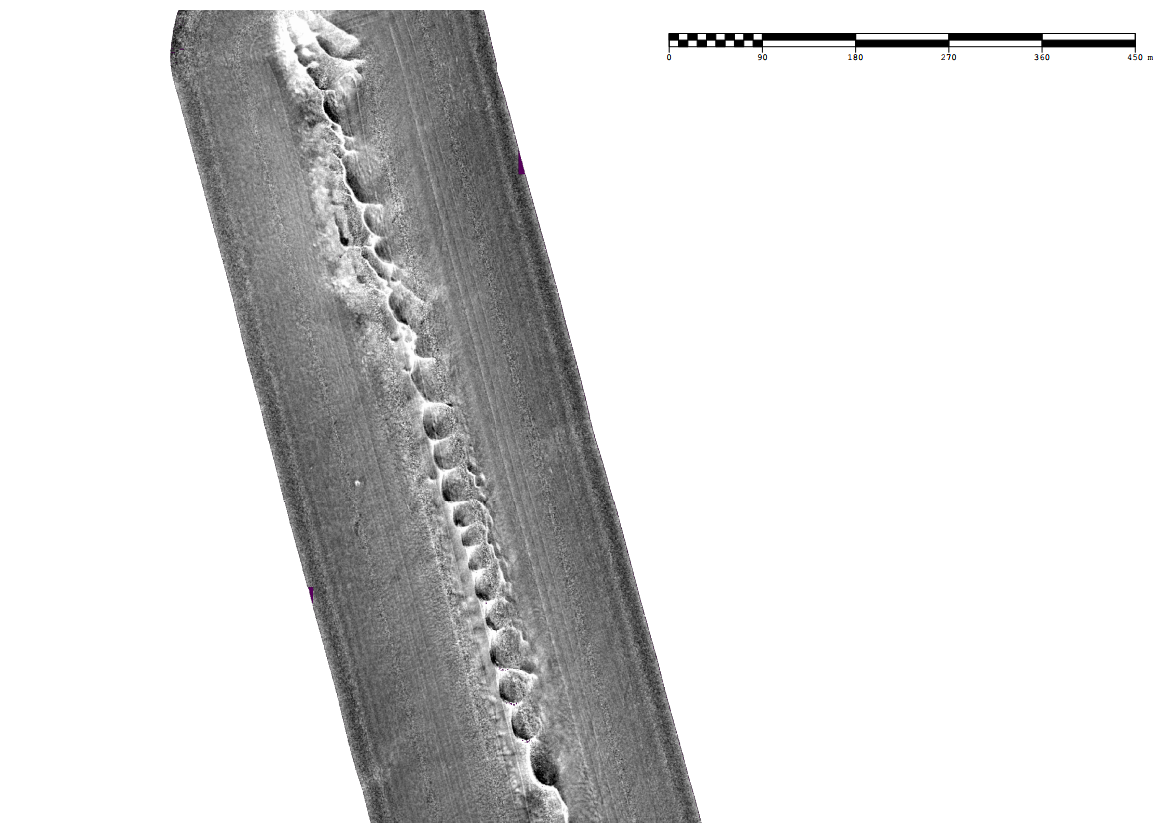
8.1.2 - HiSAS
Feedback from Kyrre Heldal Kartveit (HI), Margaret Dolan (NGU), Shyam Chand (NGU) & Rebecca Ross (HI)
The quality of the acquired data is generally regarded as good, although the HiSAS seems to be struggling to provide good quality imagery in rugged and/or sloping terrain. The KM Reflection software is needed to process the HiSAS imagery but is not ideal for working with the data. The internal navigation of the vehicle is impressive, but some work is still needed to generate Navlab files of superior quality than the raw data. Additional training from the manufacturer should be considered. Updating the position during surveying a lawnmower-pattern should be avoided due to that this might shift the position of some of the lines.
Post-cruise there is a need to compare processed HiSAS bathy and imagery with multibeam. However insufficient data was collected for a proper evaluation.
8.1.2.1 - SSS
The “Standard Sidescan” data (without the high resolution synthetic aperture capability) is of relatively low quality, but the resolution will suffice to identify large objects or structures.
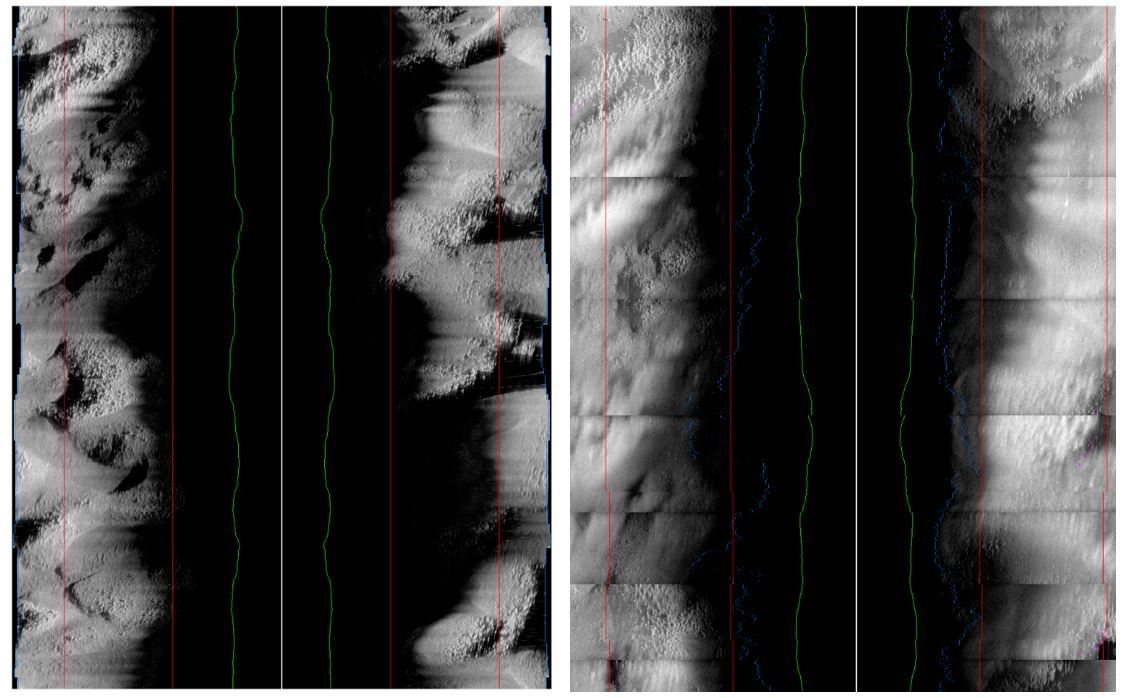
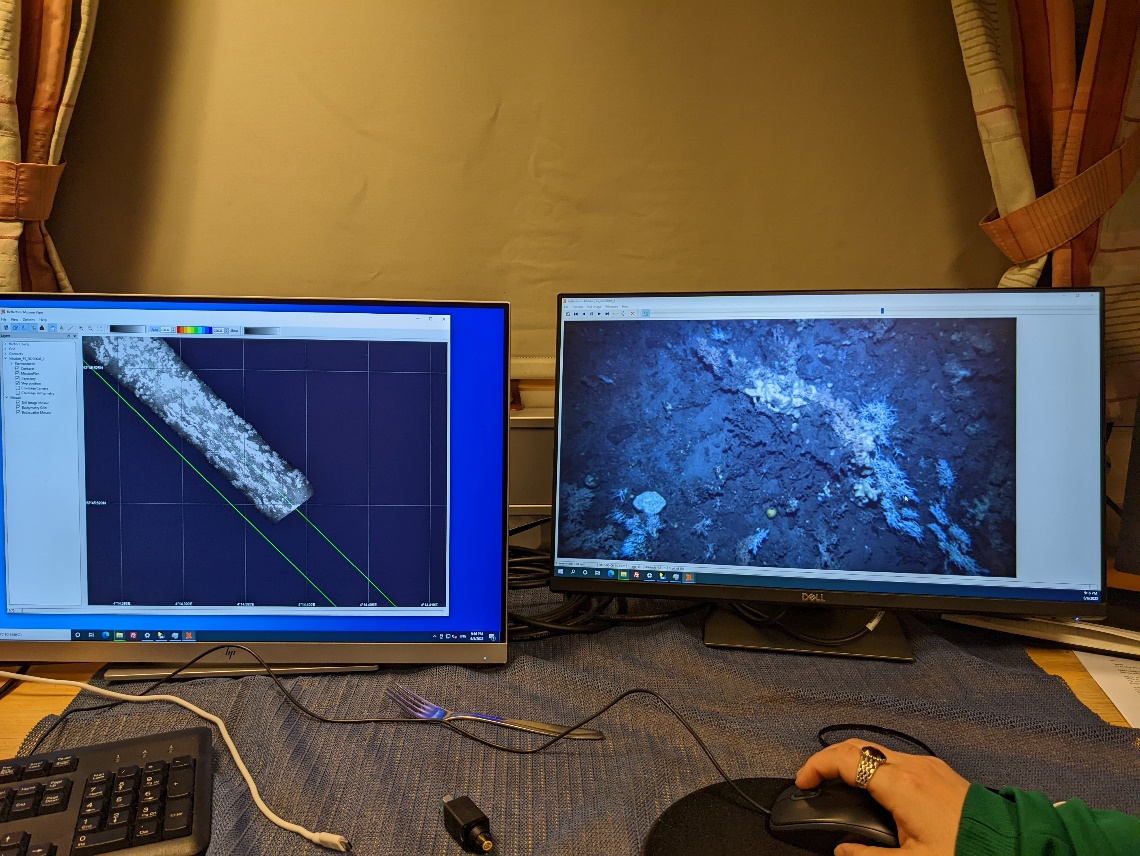
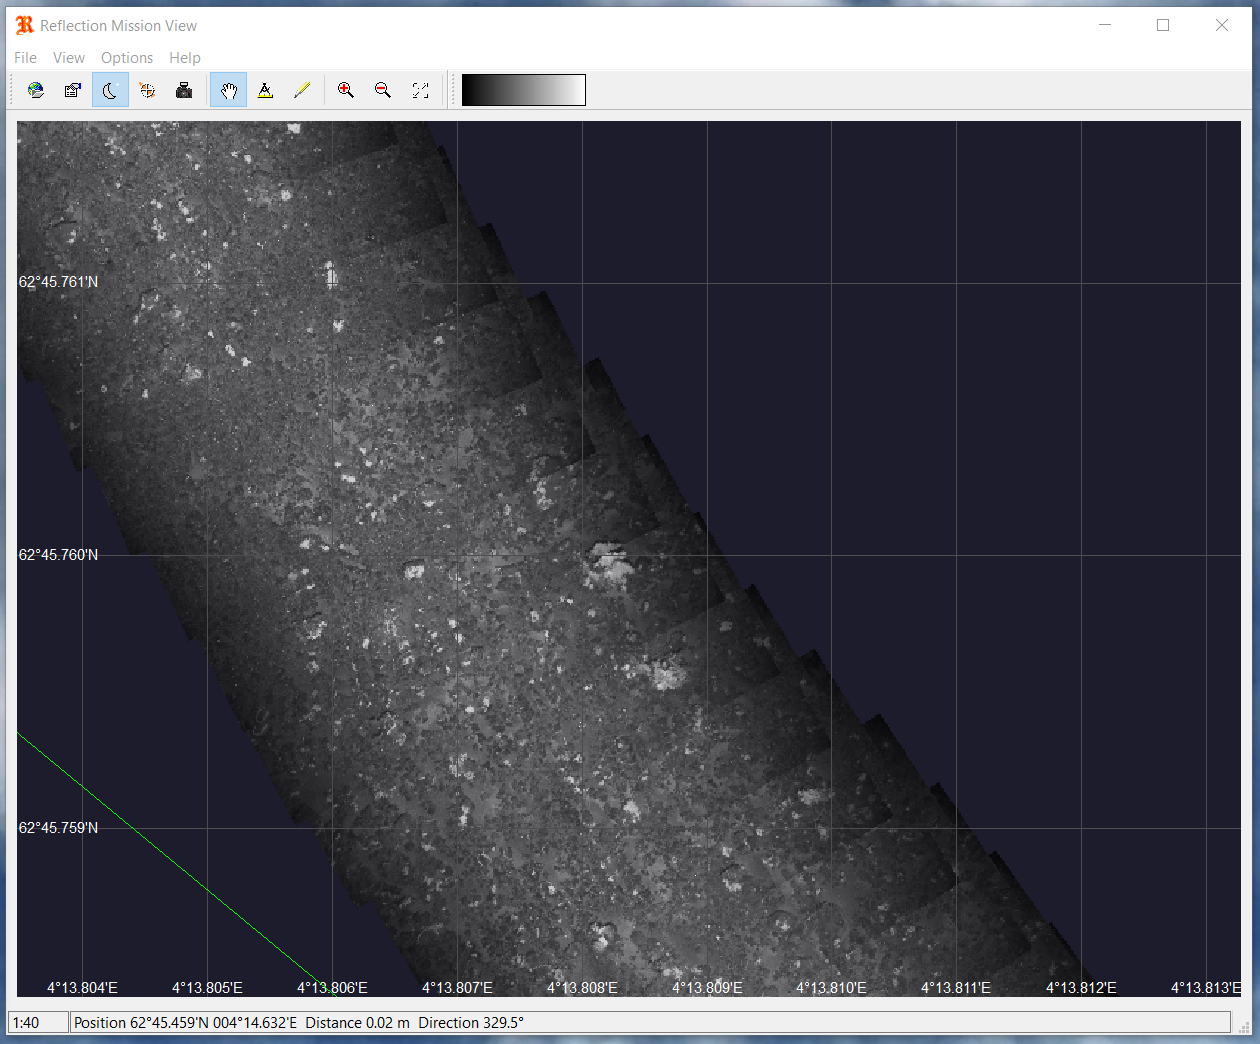
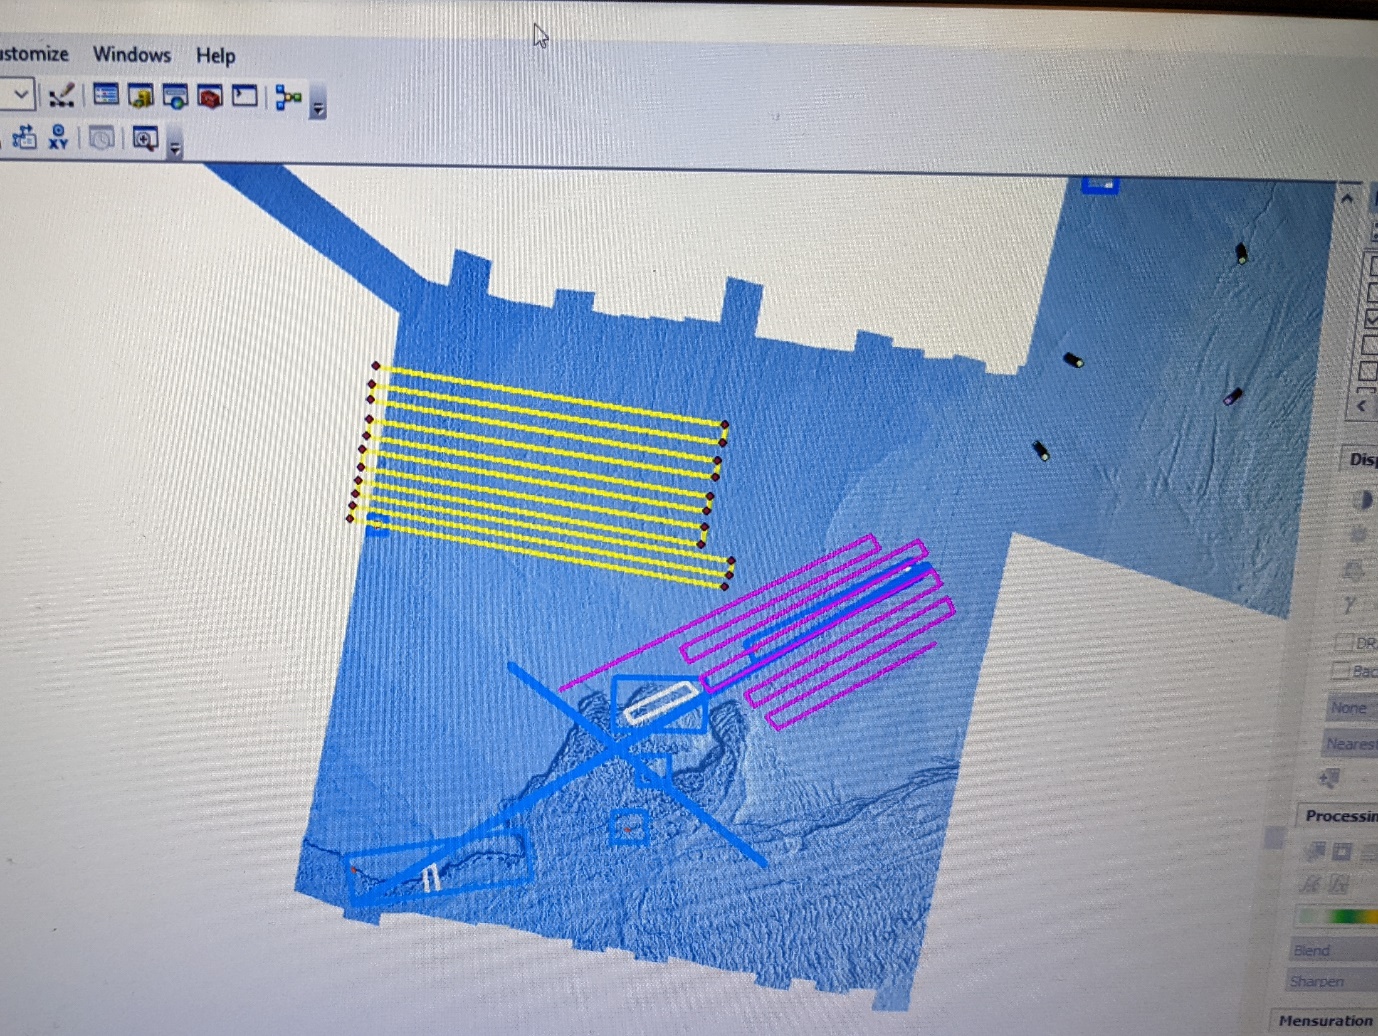
8.1.2.2 - Imagery
The HiSAS imagery as seen after the on-board processing was not as good as expected. The processing algorithm seemed to struggle to display the data correctly in the Reflection software. As seen on the figure, the resolution of the data is impressive, but the dataset is severely obscured by some sort of artificial striping perpendicular to the flying direction. The sharp stripes occur on the border between the individual sas-files (each <100 MB), but blurry lines are related to the processing algorithm. Part of the reason of this is believed to be a software issue and it is believed that the quality of the data will be much better after proper processing, but it is likely that as we gain more experience and are able to plan HiSAS surveys in more detail that this will also improve the results. The HiSAS processing algorithm favours a flat seabed, and the instrument is very susceptible to “pitch” and “crab”.
8.1.2.3 - Bathymetry
Currently the HiSAS bathymetry must be processed and extracted by Kongsberg alone. This is therefore yet to be evaluated. Note that as a workflow this is not acceptable long term, there is a need for Kongsberg to support training of users in this process/ provide a software to enable this or an output filetype that is processable in common 3rd party software (e.g. Caris).
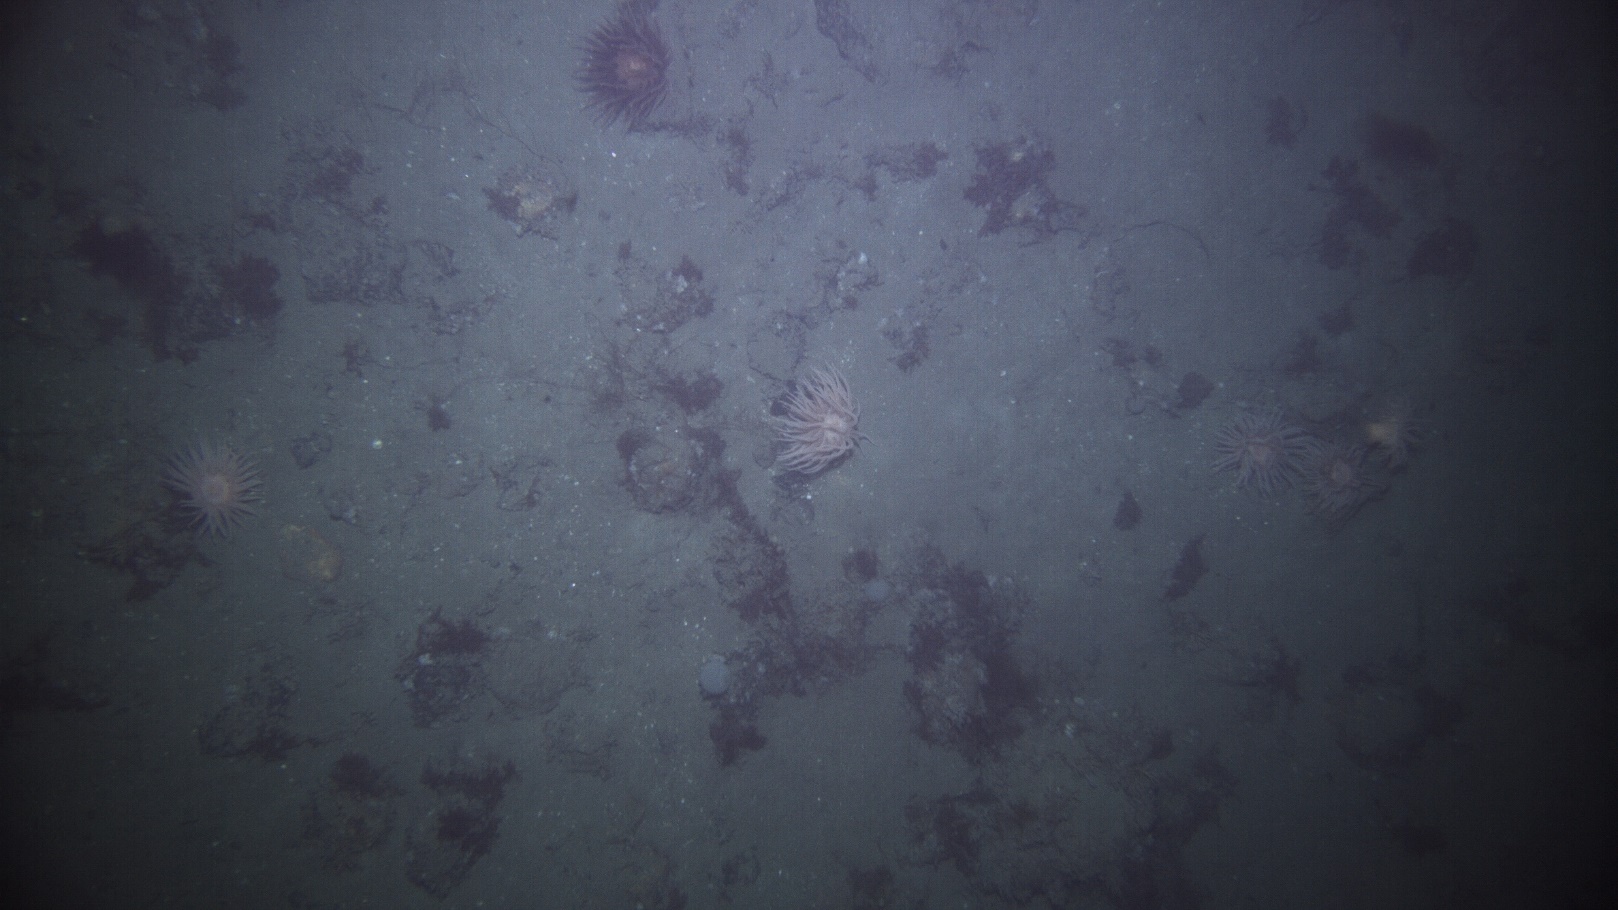
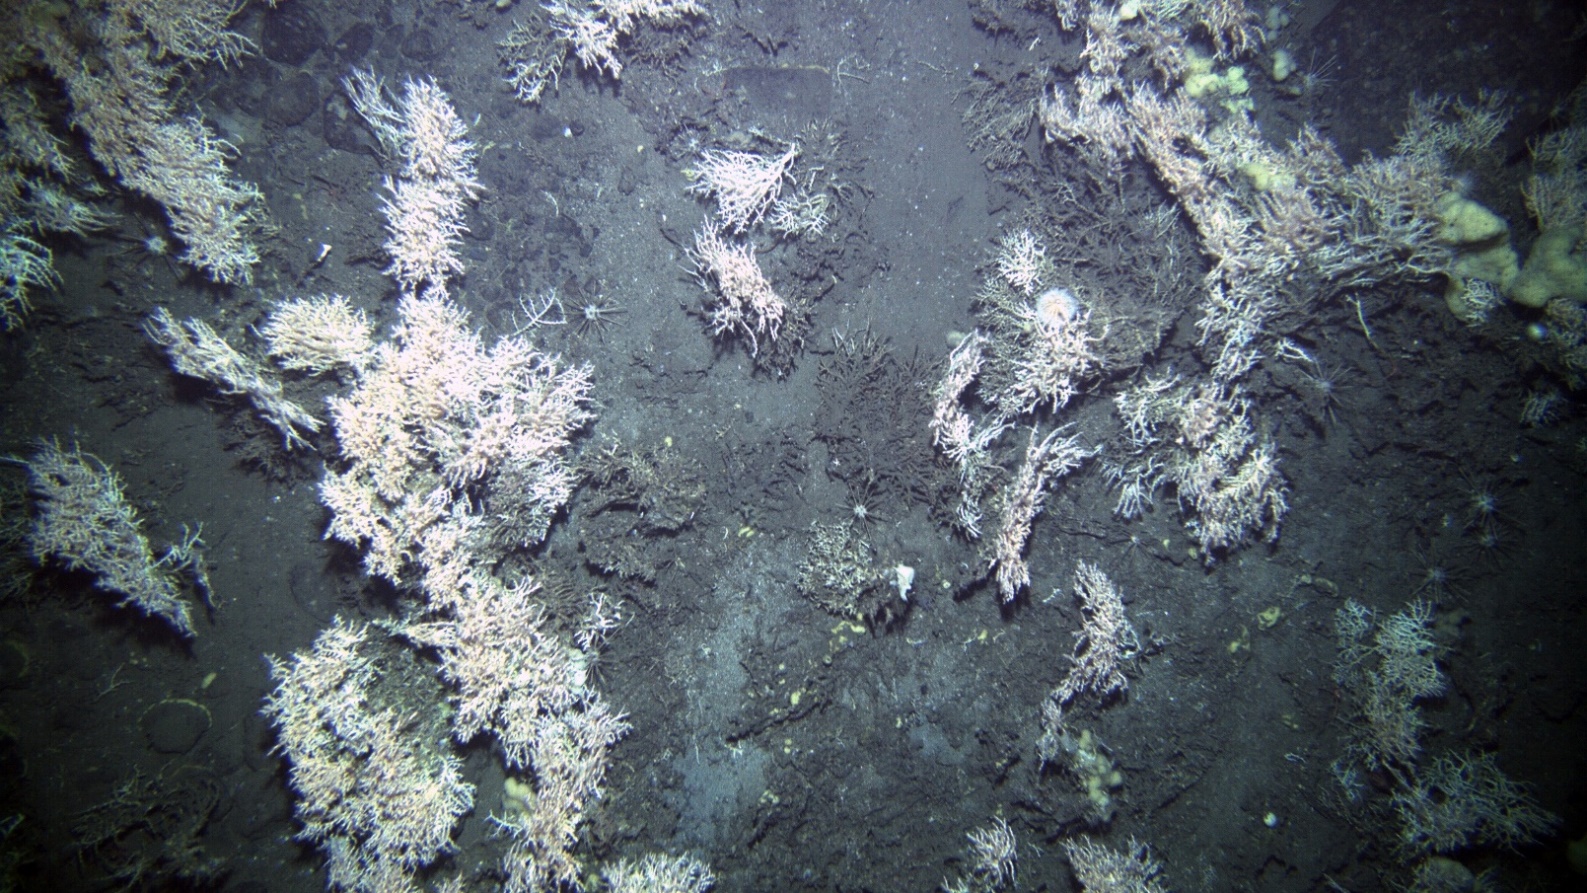
8.1.3 - Photo
Images have been of very good quality and seem highly useable for both biological and geological purposes (within the confines of having to be downward facing at present).
They are found in mission folder, pp, CathxC folder. Do not unzip batches of photos and leave them here as this may affect whether reflection can photomosaic them (this failed for the testfelt due to a copying issue that left them unzipped).
Photo lines have been tested successfully at 6m, 5m and 4m altitude, although note that despite having 4m altitude set at AUVMøre the rough terrain of the coral reef on a slope meant that the AUV did get to within 2.6m of the bottom at one point before recovering and re-gaining the programmed 4m altitude. Lower altitudes are therefore not recommended on rough terrain, but could be possible on flat sediment bottoms.
The successful AUV møre reef photos were taken at 4m altitude on the downslope. The same VL was attempted first in an upslope direction (again with 4m altitude programmed) but the terrain avoidance measures, coupled with an over cautious "safe height" resulted in most images being taken at 8-10m off bottom which is confirmed too high to be of use.
View of photomosaics in the Reflection software is possible had some success (see screenshot below). Reflection plots the images one by one in sequence and shows how they overlap (you must wait for this process to finish to see the photomosaic of the desired line/area). Exporting photomosaics must be done at low resolution, in black and white and with a limit to what number of images can be included in each saved file (seemed like ~100m of straight line could be saved in one go with 1cm resolution. Investigations are ongoing as to whether a 3rd party software can improve outputs with colour photomosaics preferable if possible.
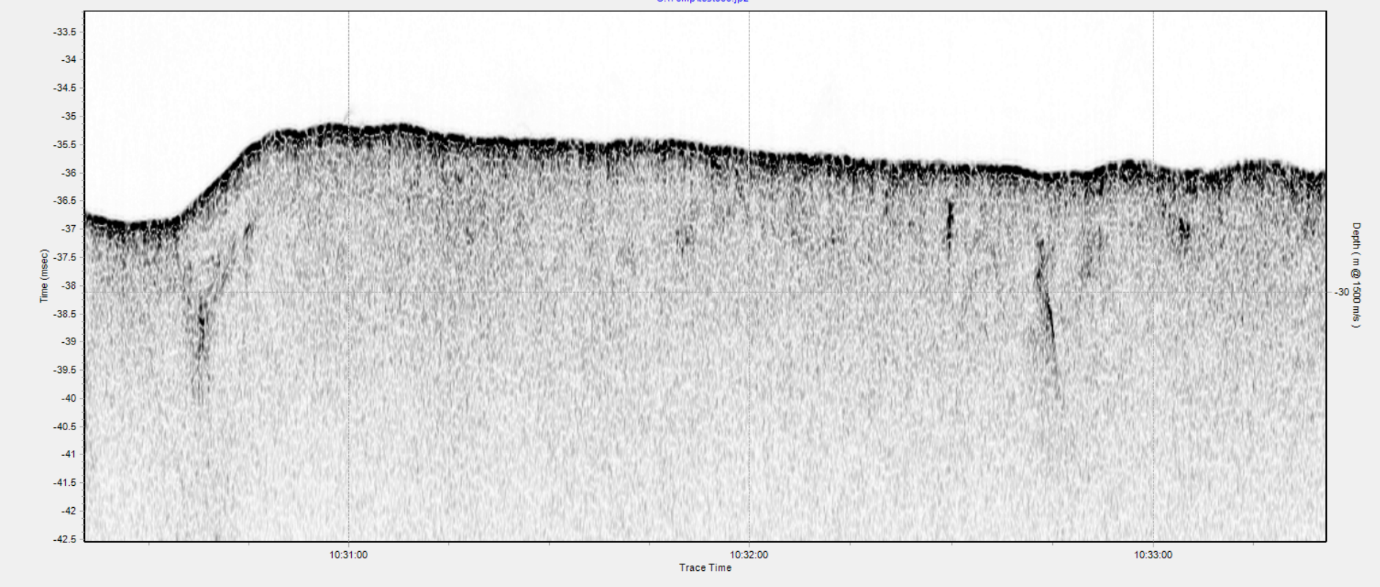
8.1.4 - SBP
Feedback from Margaret Dolan & Shyam Chand, NGU
SBP data looks fine, but the areas investigated do not have much stratigraphy to check the penetration capabilities. Further testing is necessary.
Additional scripts/programs required to convert formats.
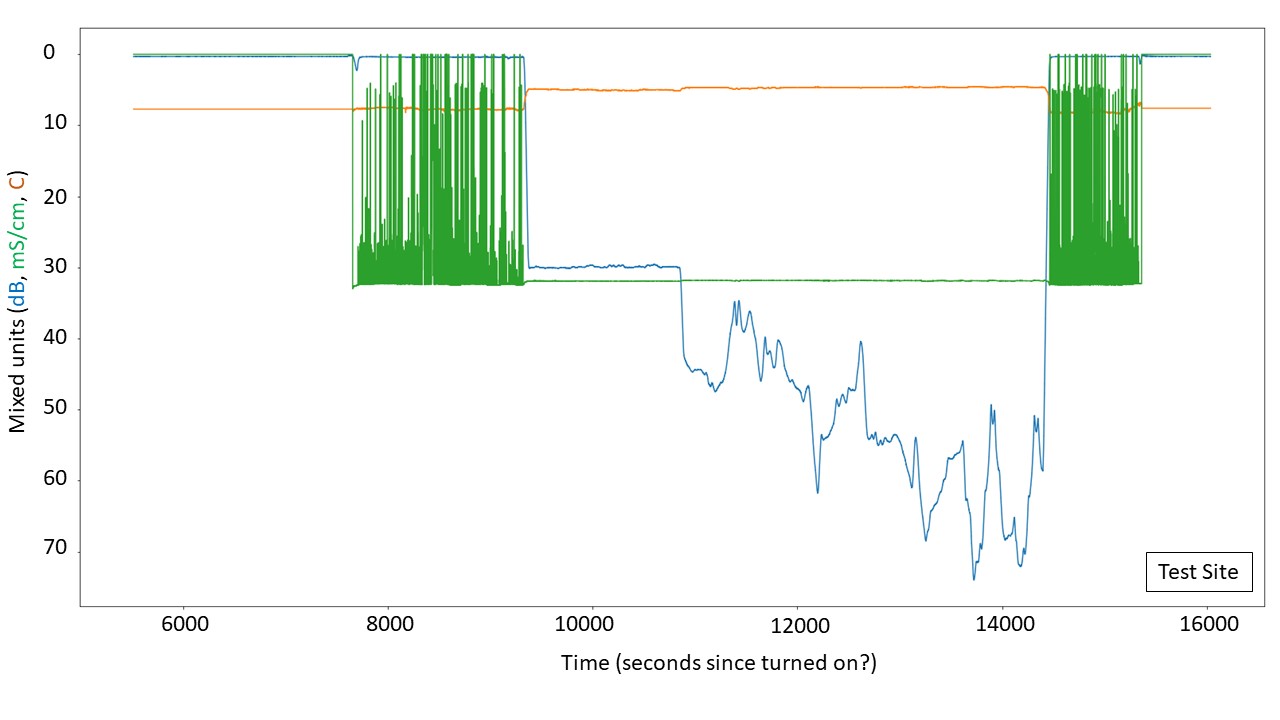
8.1.5 - Oceanographic sensors
Feedback from Karsten Arne Kvalsund, HI
The Munin+ AUV used on this cruise have a limited selection of sensors for physical oceanography. The only payload sensor is a CT-sensor, from SensorNeil Brown Ocean Sensors.
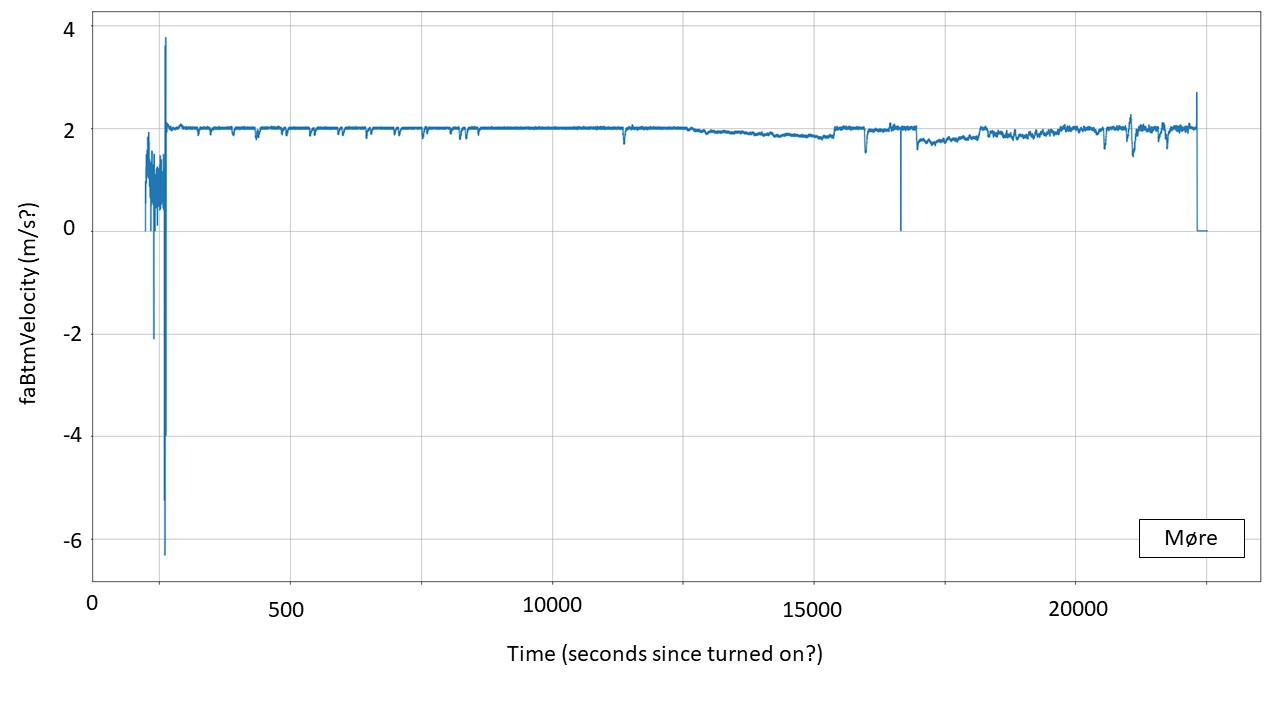
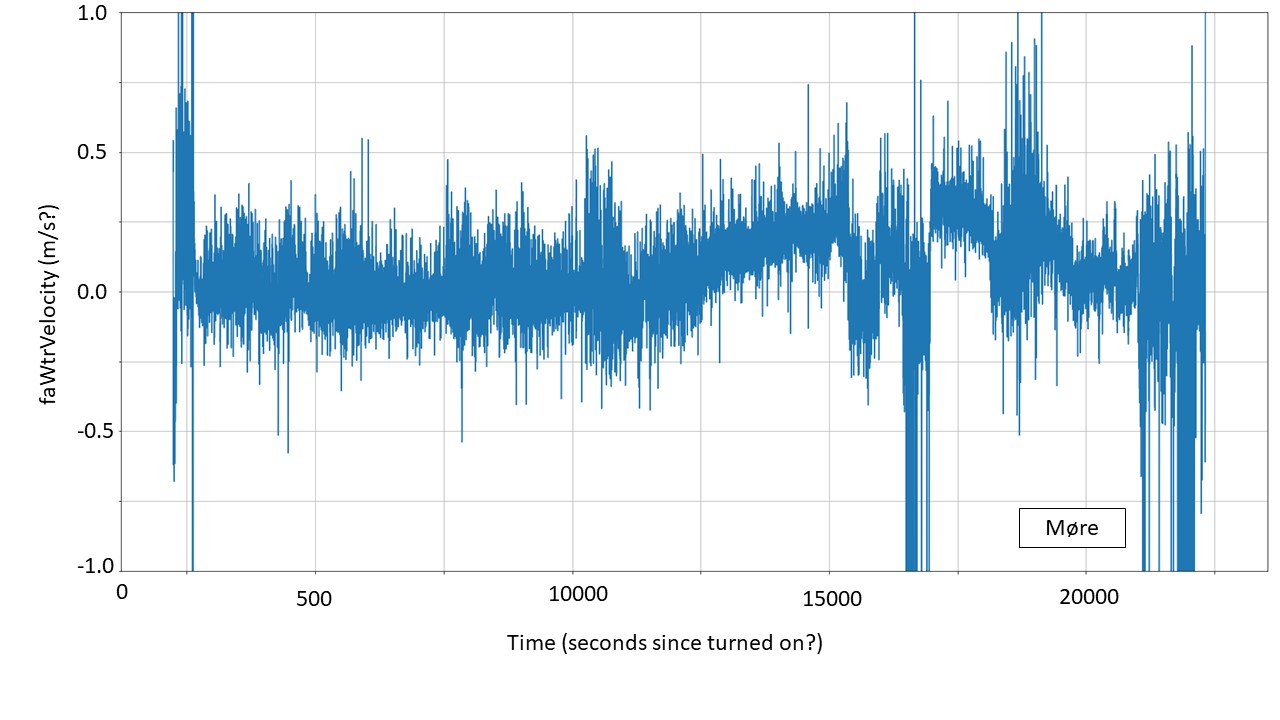
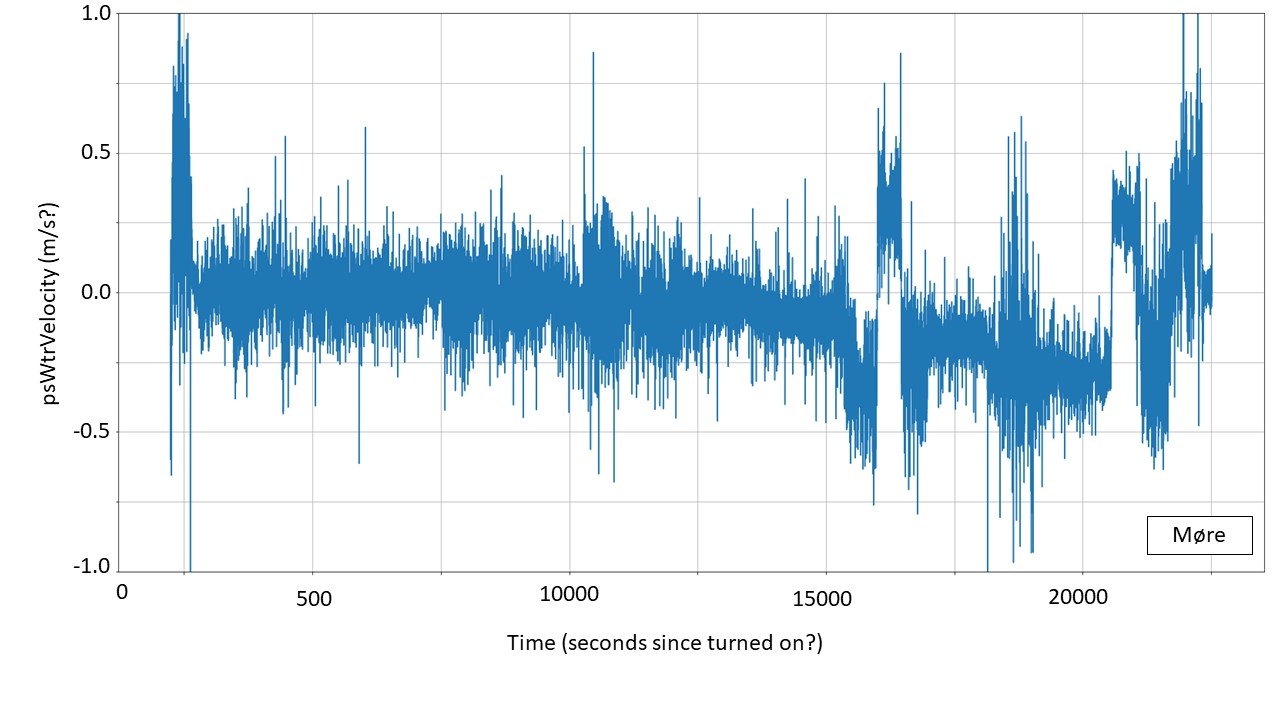
Also on board is a Nortek DVL 500, which is an ADCP. However, this is not part of the scientific payload, but rather an essential part of the vehicle navigation system. It is used as an altimeter to measure distance to bottom, and as a speed log, primarily using the bottom track. The DVL also reports 3 water velocities, “af” (presumed to mean aft-forward or similar), “ps” (port-starboard), and “vert” (vertical) as well as altitude and time (in mystery units, so far).
According to the sensor description on the Nortek website, it should also be possible to use the DVL as a classic ADCP, with multiple cells forming a profile. It is not known at this time if it is possible to combine both modes of operation while used as a speed log and altimeter on an AUV.
Results so far:
At time of writing, the AUV have completed two data collecting dives. The first at the test site north of Tromsø, and then one ~5 hour long successful mission at the Mørebank slope. In both cases, a profile with shipborne CTD was taken shortly before deployment in the vicinity of the AUV mission area. The shipborne CTD is processed into 1 dB bins, while the AUV data is raw.
8.1.5.1 - CTD comparison test site (Tromsø)
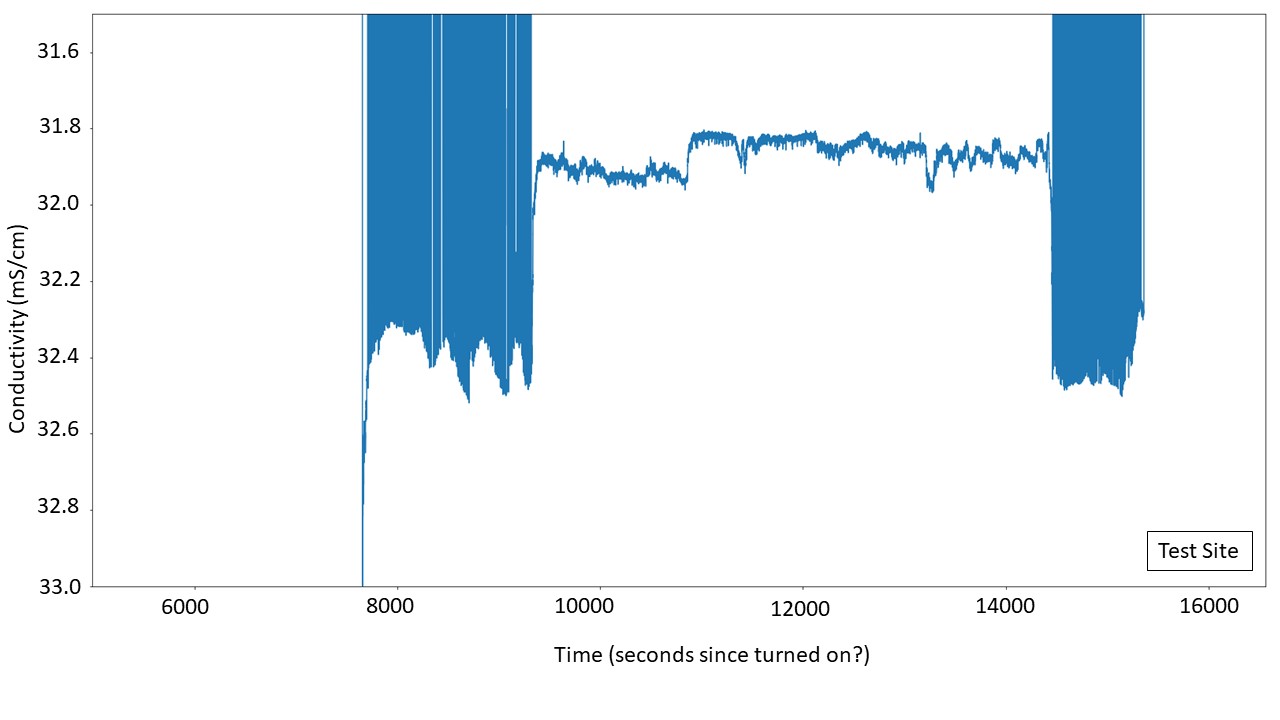
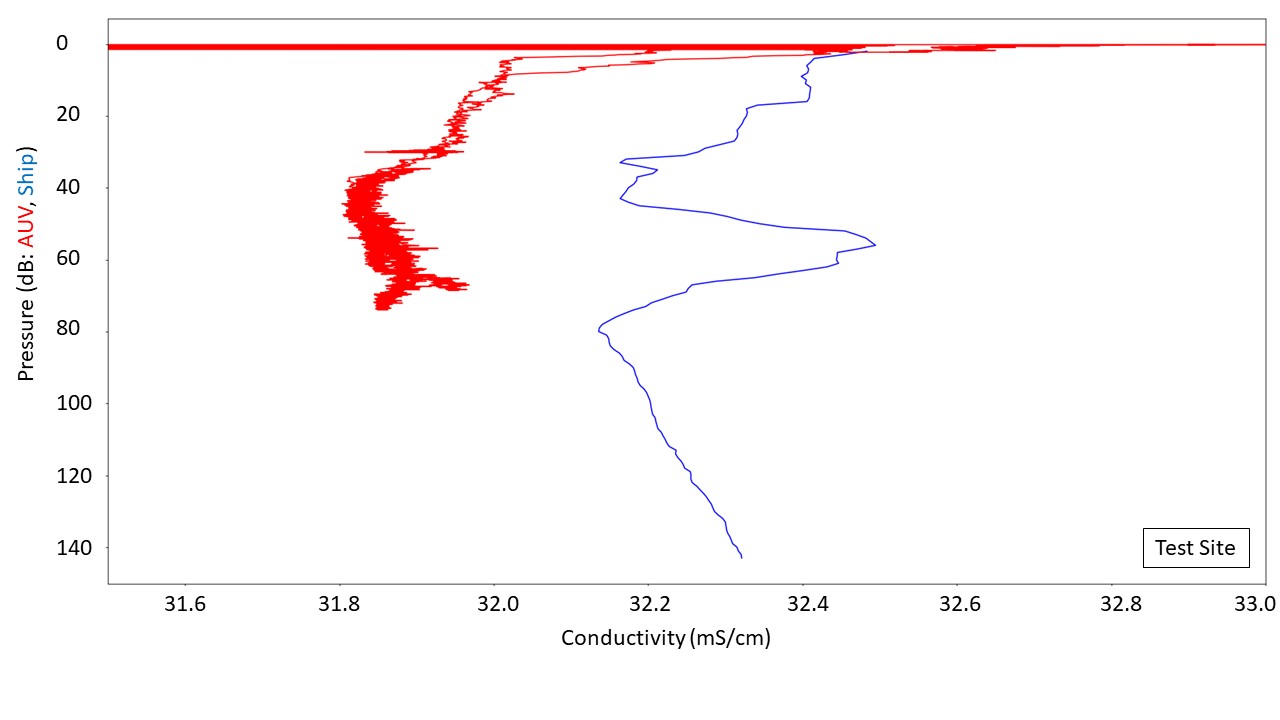
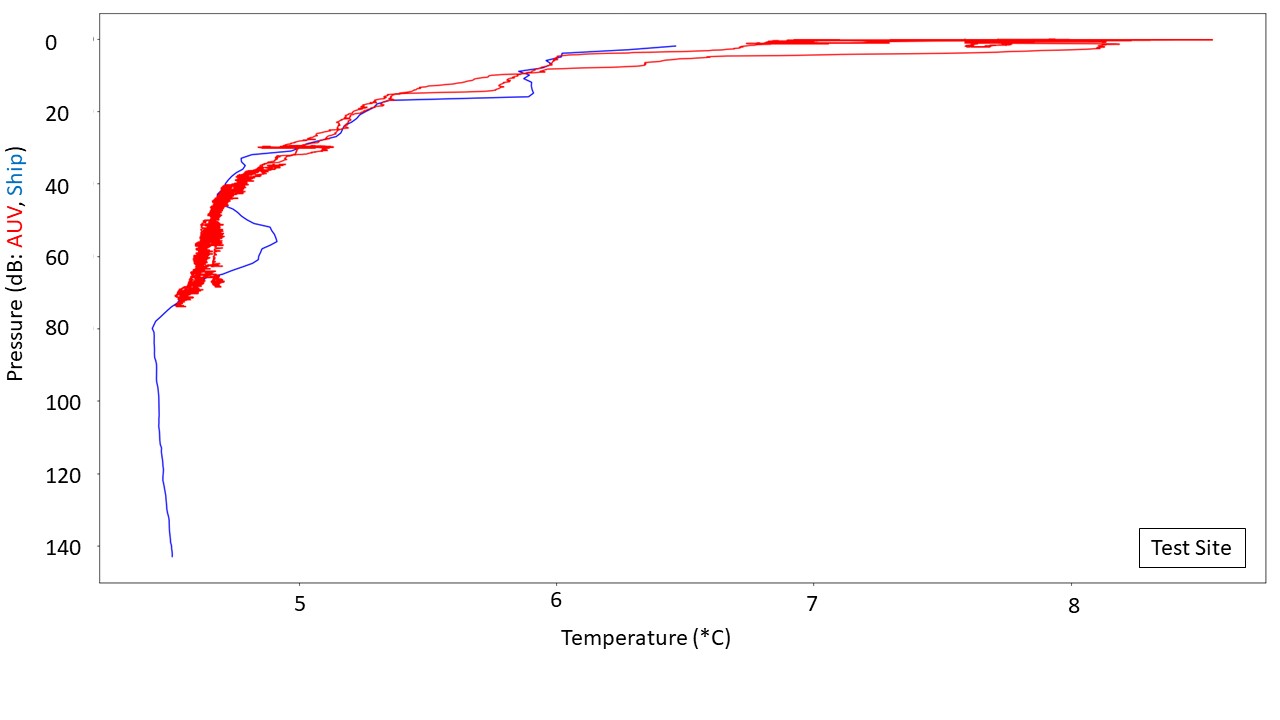
8.1.5.2 - CTD comparison Møre shelf site
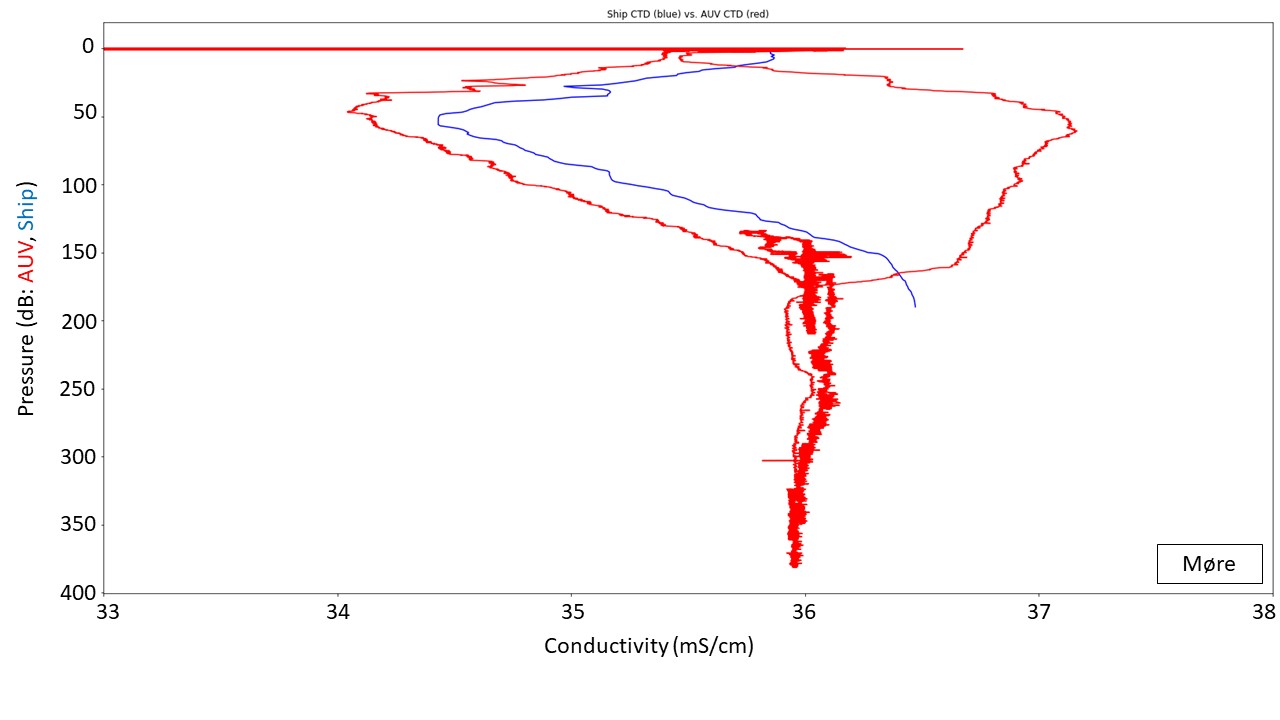
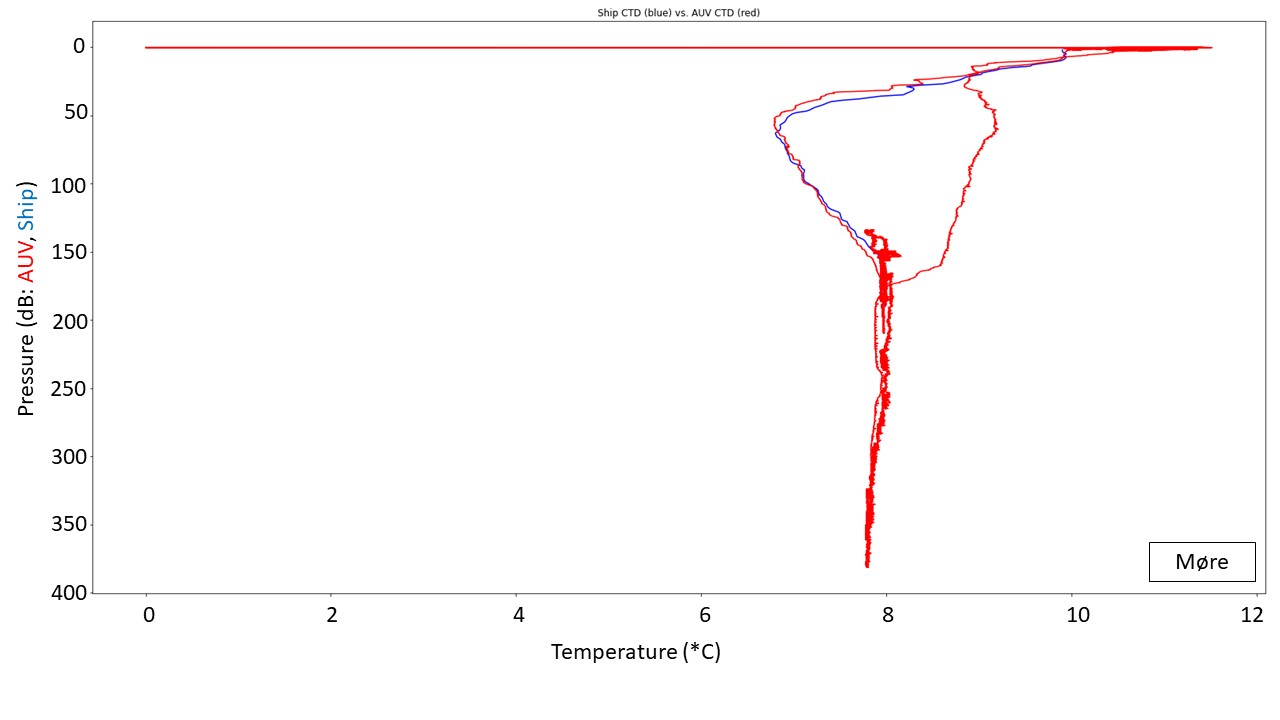
A possible reason for the conductivity offset could be that the AUV conductivity tube is contaminated with a coating of something, e.g. grease. After the Møre mission, the technicians cleaned the CT sensor with Triton X. Unfortunately, we did not manage to complete any further dives. {if the “and a bit” dive have any CT data, we can compare}
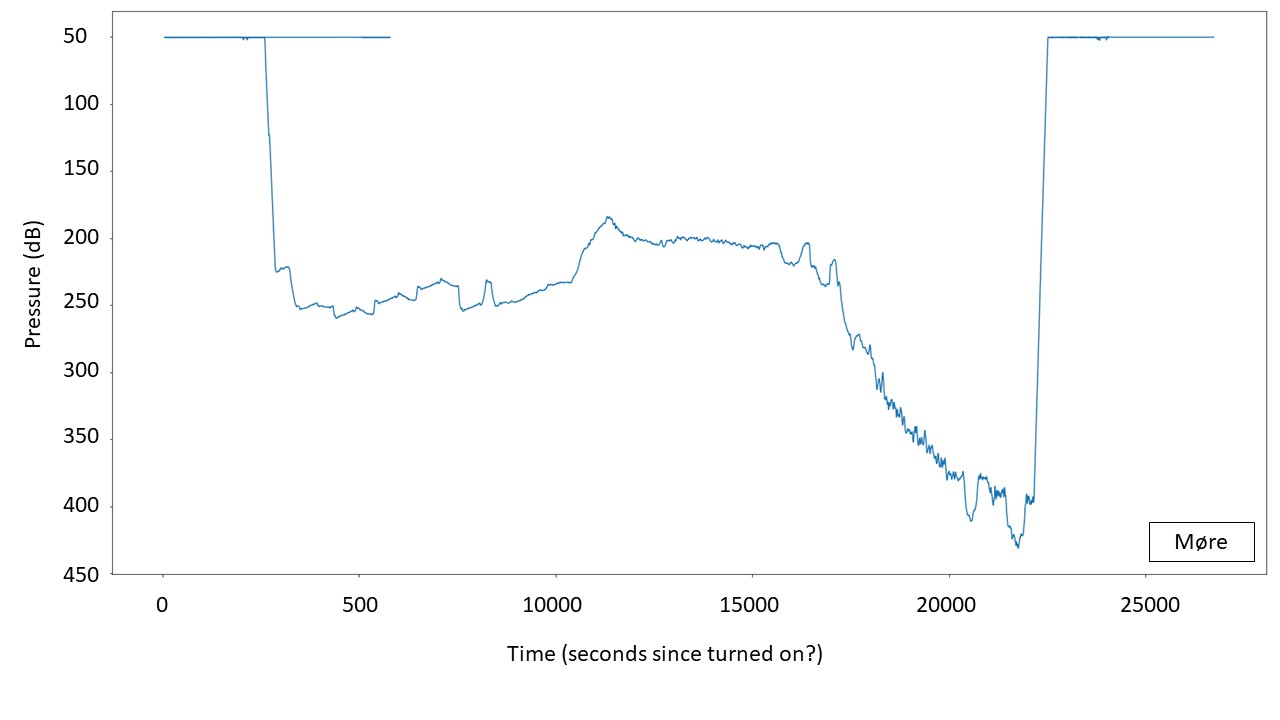
8.1.5.3 - DVL 500 speedlog
8.2 - AUV operations and data management
8.2.1 - General operations
Feedback from Kyrre Heldal Kartveit, HI
For categorization of benthic habitats and seabed mapping using acoustic methods the Munin+ shows great potential. A workflow that combines multibeam bathymetry and backscatter, HiSAS imagery and seabed photos has proven to successfully recognize and map out corals off the Møre shelf.
The mission planning software has difficulties with accepting common file types, but we have somewhat gotten around this issue on this cruise through extensive trial and error. A standard workflow for generating map layers will be proposed by this team in consulation with Kongsberg (led by Kyrre Heldal Kartveit).
One of the major drawbacks of the existing data processing workflow is related to extensive data transfer time. For a 5-hour dive, a total of ~8 hours of data transfer and an additional 9 hours of HiSAS processing is needed before a proper data assessment and QC can be done. An improved and more efficient workflow will be proposed in consultation between users and operators (led by Kyrre Heldal Kartveit).
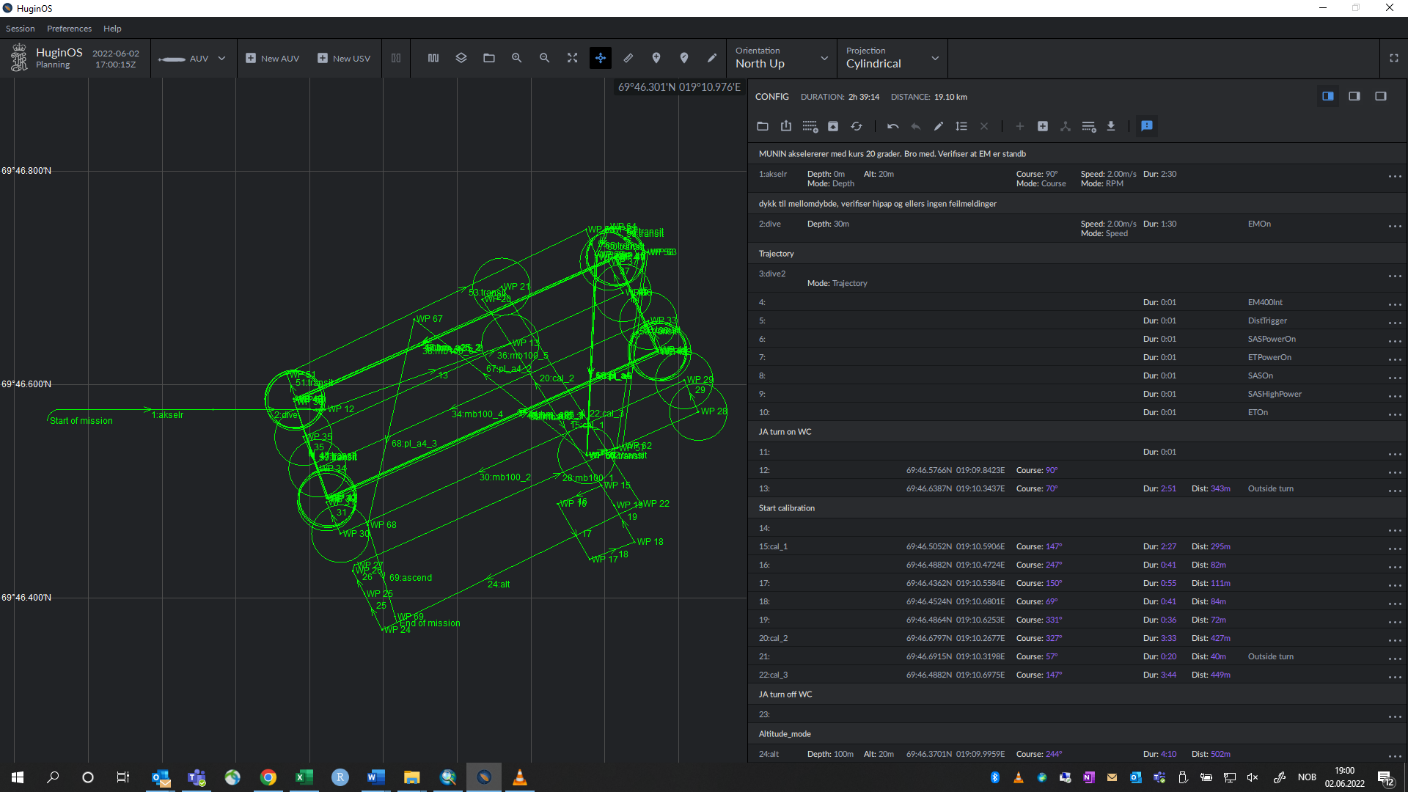
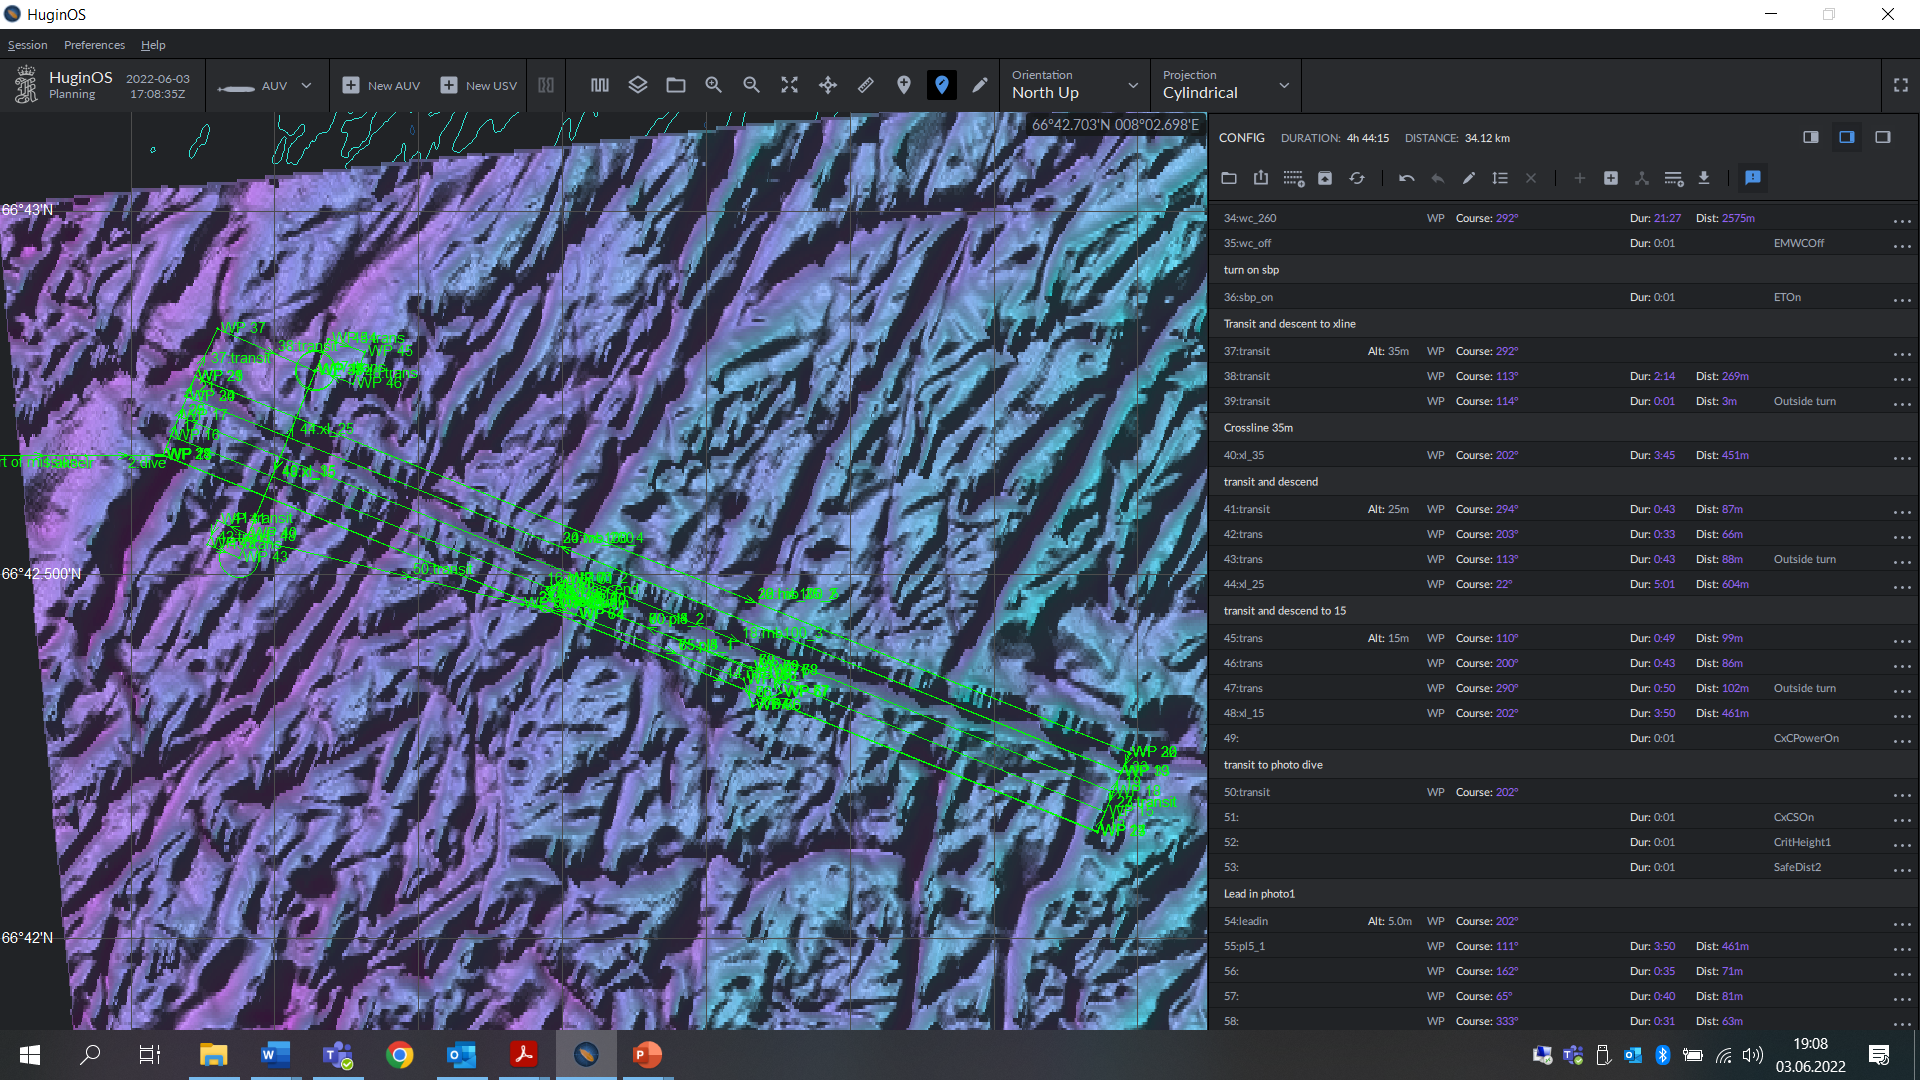
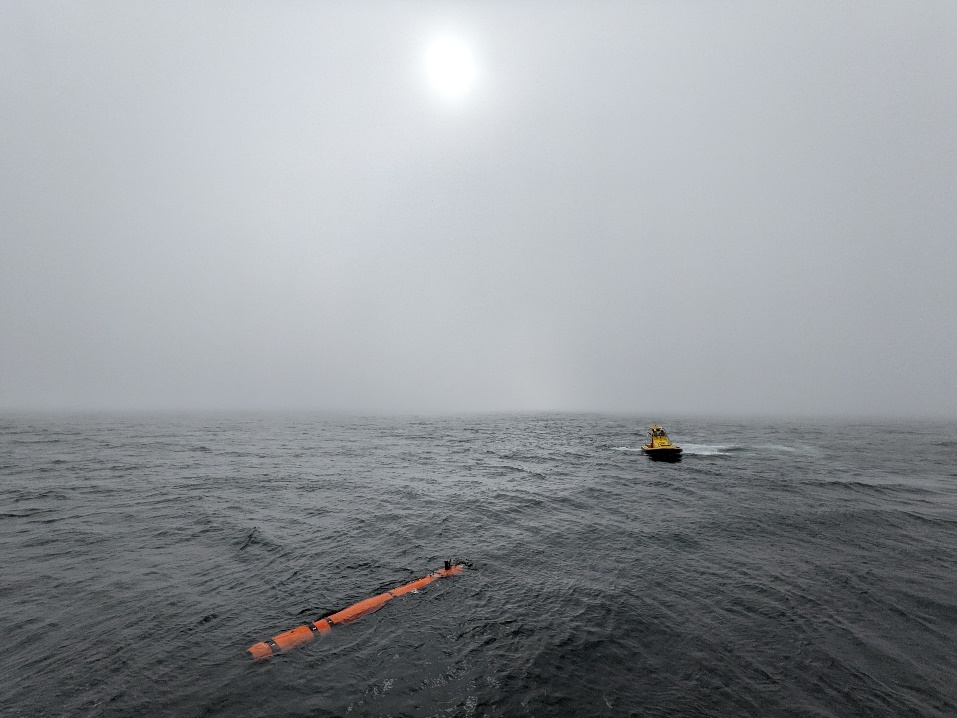
8.2.2 - Hugin OS Software
Feedback from Rebecca Ross, HI
This is the dive planning software (in “planning” mode, but it is also the software used to run the dive/power the AUVs) when used in “mission” mode). Much of the dive planning within this software was done by Kyrre Heldal Kartveit on this cruise.
Dive plans need to have some form of bathymetry of the region visualised to help decide when to amend altitudes and inform how to plan turning manoeuvres. Generally a multibeam bathymetry of ~5m resolution is sufficient to plan dives, therefore allowing you to plan combined acoustic/photo missions in shallower water where there is multibeam bathymetry of acceptable resolution gathered from surface vessels.
Hugin OS however did not accept standard bathymetry raster data – it defaults to showing contour data, but again is very restrictive and atypical in the formats of files it accepts (likely because it is defaulting to using the bathymetry data it collects in a prior dive).
Below are some tips on how we achieved visualisations of multibeam bathymetry collected by Kartverket from surface vessels.
8.2.2.1 - Loading planning data into HuginOS:
ENSURE PROJECTION IS GEOGRAPHIC i.e. WGS84 (FOR RASTER DATA ONLY!)
Hugin OS does not seem to cope with normal rasters.
CONTOURS
This is the preferred way of viewing the terrain in Hugin OS, and can only work with geographic (i.e. WGS 84 and NOT UTM) projected data.
-
Contours exported directly from Caris as S57 files (i.e. in navigational chart format) will load directly into Hugin OS.
-
Alternatively XYZ data can be used to generate contours using the reflection software:
- Start in reflection: switch to windows>mission view
- File>load> choose xyz data i.e. text file with 3 columns with .xyz extension, but note, this needs to be in yxz format. Once loaded this will show up in “user loaded data” in the layers panel on the left and you can right click to zoom to the layer.
- Right click on layer and grid the data… Save gridded data somewhere – this takes a little while to show up.
- Right click on layer again, now you can create contours
- Right click again and save contours as .map file
IMAGE (RASTER)
Raster images can be loaded i.e. only as a georeferenced RGB image that can be turned on and off. You will still need contours for depth information or will have to refer to another screen with depth information. Note that Hugin OS will place this image above/over any contours and video line files, so you will be frequently turning the layer on and off, but this is a good backup if you do now have xyz formatted data.
However, the raster image data that we have managed to load this has only worked as an export from the Fledermaus software so far (no formats exported by Caris, ArcGIS seem to be compatible). For export from Fledermaus load the bathymetry (or backscatter) data and adjust the colour ramp to something that will contrast well with other displays in Hugin OS and from the DTM tools export the surface as an image. This exports an RGB tif file that can be loaded directly into Hugin OS (note this is an image only – depth values are not available).
Loading shapefiles (e.g. preplanned tracks, pipelines, features, mooring locations, etc):
ENSURE PROJECTION IS IN UTM PROJECTION (i.e. NOT GEOGRAPHIC WHICH WAS MANDATORY FOR BATHYMETRY DATA)
Shapefiles themselves will not load into HuginOS but exports from GIS software in CAD formats may work – the following has worked for us for example:
VIDEO LINES/ POINT DATA
-
In ArcMap go to shapefile and ensure projected UTM format
-
Export as CAD in DXF R14 format
-
Take DXF into Reflection (set correct UTM and choose an appropriate interpretation for your file type from the list e.g. if importing 2D video lines then you can set “Import Surface Polylines” to “Tracklines”– you can ignore any others).
-
Save user added dxf layer as .map file
-
The .map file can be imported into HuginOS
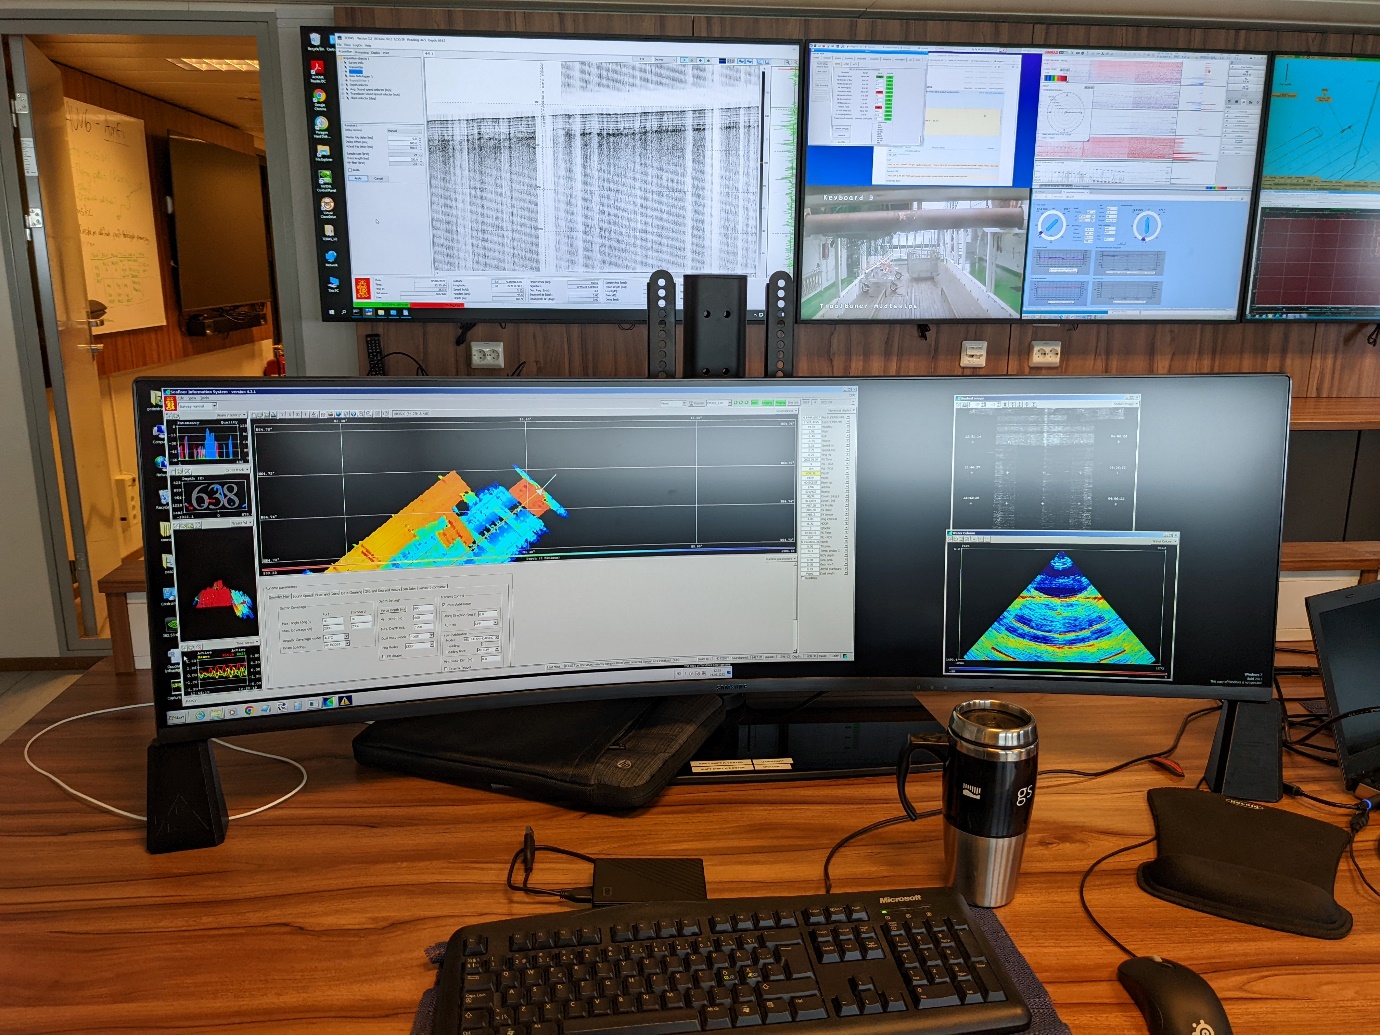
8.2.3 - Reflection Software
The reflection software must be used with a licese key (expensive and supplied as USB keys in our case). Our licenses at HI were time limited so testing has also been limited. Generally Reflection is relatively easy to use, especially with data collected by the AUV. It is important that the folder structure is maintained when data is obtained by the AUV and that e.g. photo folders are not unzipped.
A typcal mission folder looks like this:
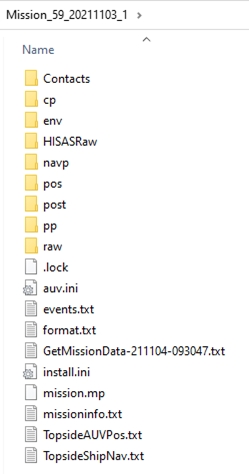
NB The format file is useful for finding headers for any of the sensor data.
Generally Reflection will offer you the right folders for different sensors when you select a mission folder set:
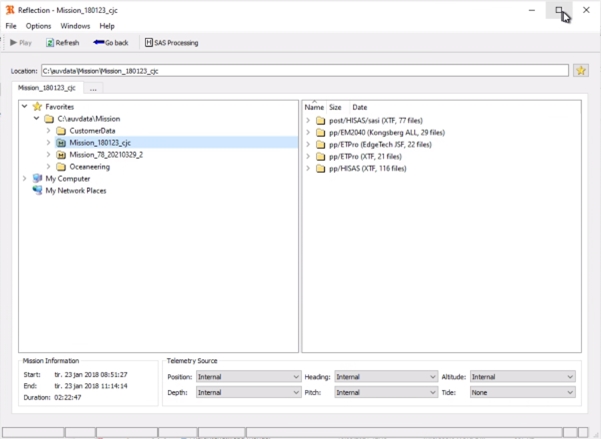
Within subfolders you can select file to visualise and you can use the dropdown menus at the bottom to modify various options e.g. whether you used processed or unprocessed navigation data. You will then press play to view the data and are automatically shown the right type of viewer for that data.
This software needs much more considerable exploration, but generally will allow for fast viewing of data, minor modifications within limits, and has limited export options. It is a good place to start, but likely third party softwares will be advisable to use to e.g. clean multibeam data, make and export high resolution colour photomosaics, etc.
Note also that Reflection can be used to change file types of some data to enable compatibility with Hugin OS. See section 8.2.2.1.
8.2.4 - Data management
Feedback from Arnfinn Morvik, HI/NMD
Challenges with handling of data from AUV MUNIN:
After the cruise, all data from each mission with the Munin AUV will be stored on the server under /OBSERVATION_PLATFORMS/AUV/MUNIN. Each mission is stored in a separate folder. Files here include both raw and processed data.
Proposed workflow:
-
Copy data from NAS bottle to TopSide machine
-
Copy data from TopSide machine to ship server
-
Process data on TopSide machine (Navigation)
-
Process data on TopSide machine (HiSAS)
-
Copy results of processing to ship server
-
Delete data from the TopSide machine to make space for the next mission because disk space was only 2TB
Time spent on step 1 is 50-80% of the length of the dive. This leaves a very short timeframe for step 2-5 if the plan is to run 24/7 with 2 long dives each day. Step 2 can probably run in parallel with 3 and 4, but this requires that processing time in step 3 and 4 is not too much influenced by the file transfer in step 2. Step 5 must be performed after the processing and must be finished before data from a new dive is ready to be copied. This step can be avoided by adding more disk space to the machine.
Example from 5-hour dive:
-
Copy data from NAS bottle to TopSide: 2.5 hours
-
Process data:
-
NavLab 30-45 minutes
-
HiSAS 9 hours
-
-
Copy data to ship server 4-5 hours
Based on the time it takes to process the HiSAS data, this is not possible to perform during a cruise if the AUV will be used frequently.
It is not clear why the copying of data from the TopSide machine to the ship server is so slow. The amount of data from the 5-hour dive is aprox 1 TB and on a 10 Gbit line, it should not take 4-5 hours to copy the data. Theoretically, it should not take more than 15-20 minutes. This speed might not be possible to reach, but the files should have been on the ship server within an hour.
Based on the numbers above, it should be possible to use the AUV with 2 long dives a day if the problem with copying data from the TopSide machine to the ship server is solved. The diskspace on the TopSide machine should also be increased to be able to handle long dives and preferably more than one long dive.
Note that Kyrre Heldal Kartveit is now leading a team of users, operators and NMD representatives to find the best workflow solutions going forward. A standard operating procedure manual is in production though will likely remain a living document for the next year or so until we have found stabilised solutions for all issues.
8.3 - Ship based sensors
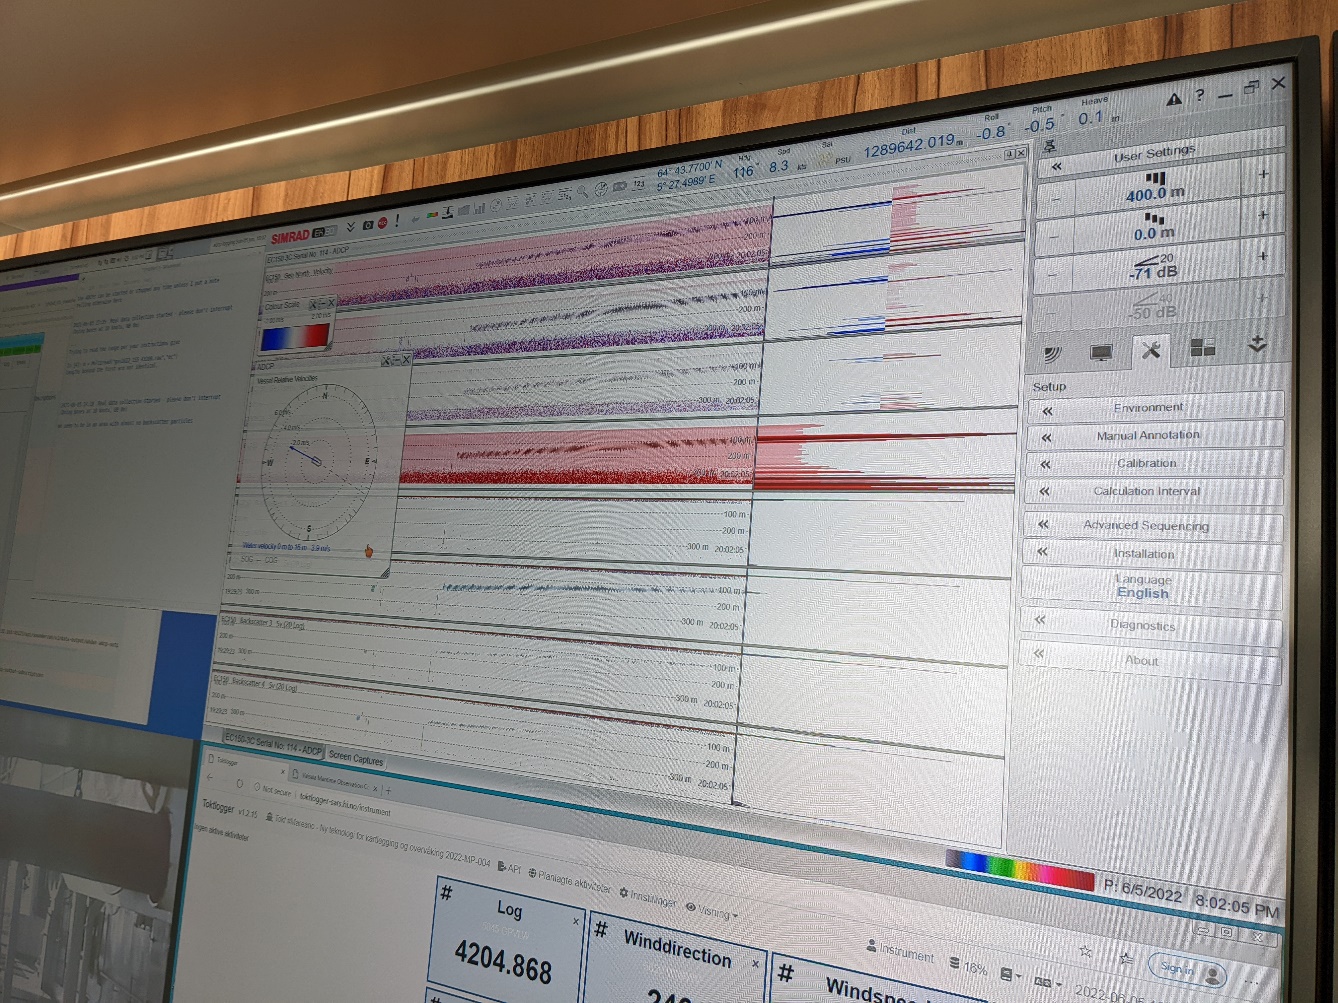
8.3.1 - EC150-3C ADCP
Feedback from Ivar Wangen, Kongsberg
The EC150-3C is a relatively new ADCP from KONGSBERG and it’s important to collect data to compare it with more well-established ADCPs. Using idle and transit-time on the MAREANO cruise has been a great opportunity to collect large amounts of data from both EC150-3C (EK80) and Ocean Surveyor 150 kHz from RDI. The data will be copied and analysed once we get ashore.
The cruise has also been a chance to experiment with calibration techniques for the ADCP. Under the midnight sun on the first night of the cruise we ran long lines and small circles while pinging as quickly as possible with the ADCP. The data will be used to calculate the correct installation parameters for the EC150-3C transducer.
The third thing we’ve been able to do (almost like a Kinder egg) on the cruise is to get UHDAS communicate with EK80. UHDAS is a software (University of Hawaii Data Acquisition System) widely used on research vessels around the world to collect ADCP data. At the end of the MAREANO cruise, GO Sars will be the first vessel in the world where UHDAS collects data both from EC150-3C (EK80) as well as ADCPs from Teledyne/RDI.
8.3.2 - Topas and MBES EM302
These systems were used for opportunistic data collection during bad weather only. No performance evaluation required.
9 - Summary AUV Recommendations
Main points:
-
The Munin+ does not currently operate as is reasonably expected – in our opinion Kongsberg should be responsible for solving these issues.
-
this includes at a minimum:
-
the ability to dive beneath the surface without a MOB boat in calm waters and
-
the ability to dive to the seafloor when the water is 200-1500m deep
-
-
-
The Munin+ is not suitable for scientific use until these problems are rectified and further internal testing confirms reasonable functionality
-
Kongsberg should be fully involved in further testing (present on board) until reasonable functionality is demonstrated
-
AUV data (when collected) seems to be generally of a high quality and will be suitable for use in MAREANO and similar mapping projects.
-
Further work must be put into minimising data copying times on board (e.g. with a RAID disk that can feed both the topside machine and the data processing team)
-
Further work must be put into NMD long term big data storage and sharing options – it is inefficient to expect partners to all take copies of the data which is likely to be ~1TB/ 5hrs of AUV operation.
-
In deep water surveys, where MBE collected by surface vessel is at <5m resolution and possible photo targets are unknown, we recommend separate acoustic and photo cruises. In this situation an acoustic dive is needed to collect the high resolution bathymetry to plan a photo dive and it takes too long to do this for more than 1 or 2 sites. You must assume at least 3x the length of the AUV acoustic dive is needed before you can see the data it has collected (due to data copying and topside machine processing time), and the view in Reflection software is not adequate to satisfactorily identify photo targets, requiring further time to evaluate using other methods. This may improve in the future with reduced copying times and more settled analysis methods.
-
In shallower waters, where 5m resolution MBE data may already be available (collected by surface vessel mounted systems) Acoustic and Photo missions can be combined into a single dive. The 5m resolution bathymetry is adequate for dive planning.
-
This survey does not complete our testing needs – the operational issues several impacted the ability to fully test the Munin+ for use in Mareano and other mapping programs, so further testing cruises (or parts of cruises) should be anticipated.
Practical AUV operation:
-
Currently the Munin+ will attempt to dive then dump its weights and make an emergency ascent if the water depth at the start location is >200m. This will hopefully be rectified before future work, as the Munin+ is rated to 1500m and should reasonably be expected to be able to dive to a seabed at e.g. 300-600m depth.
-
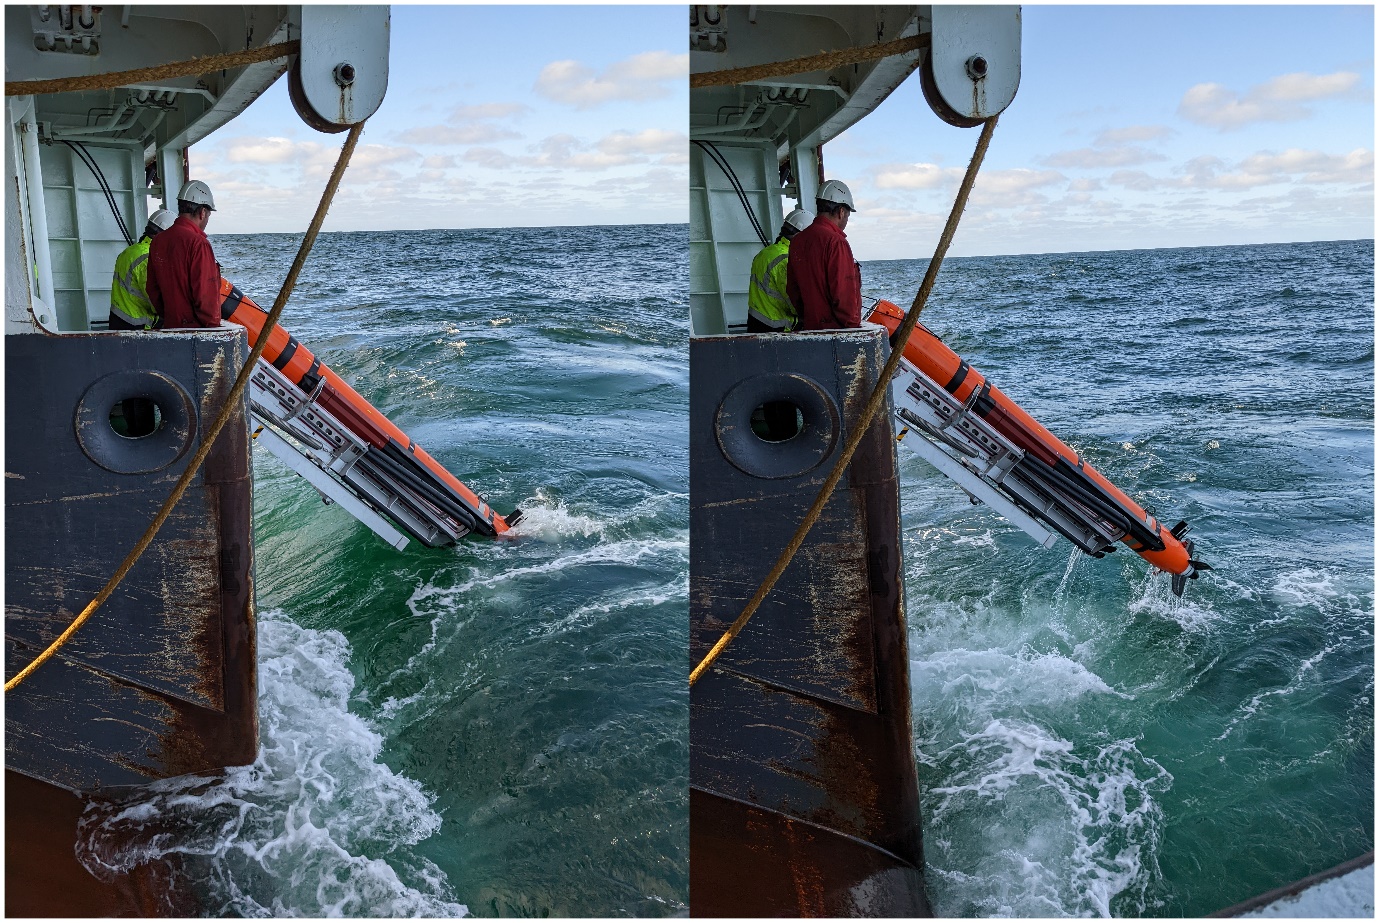
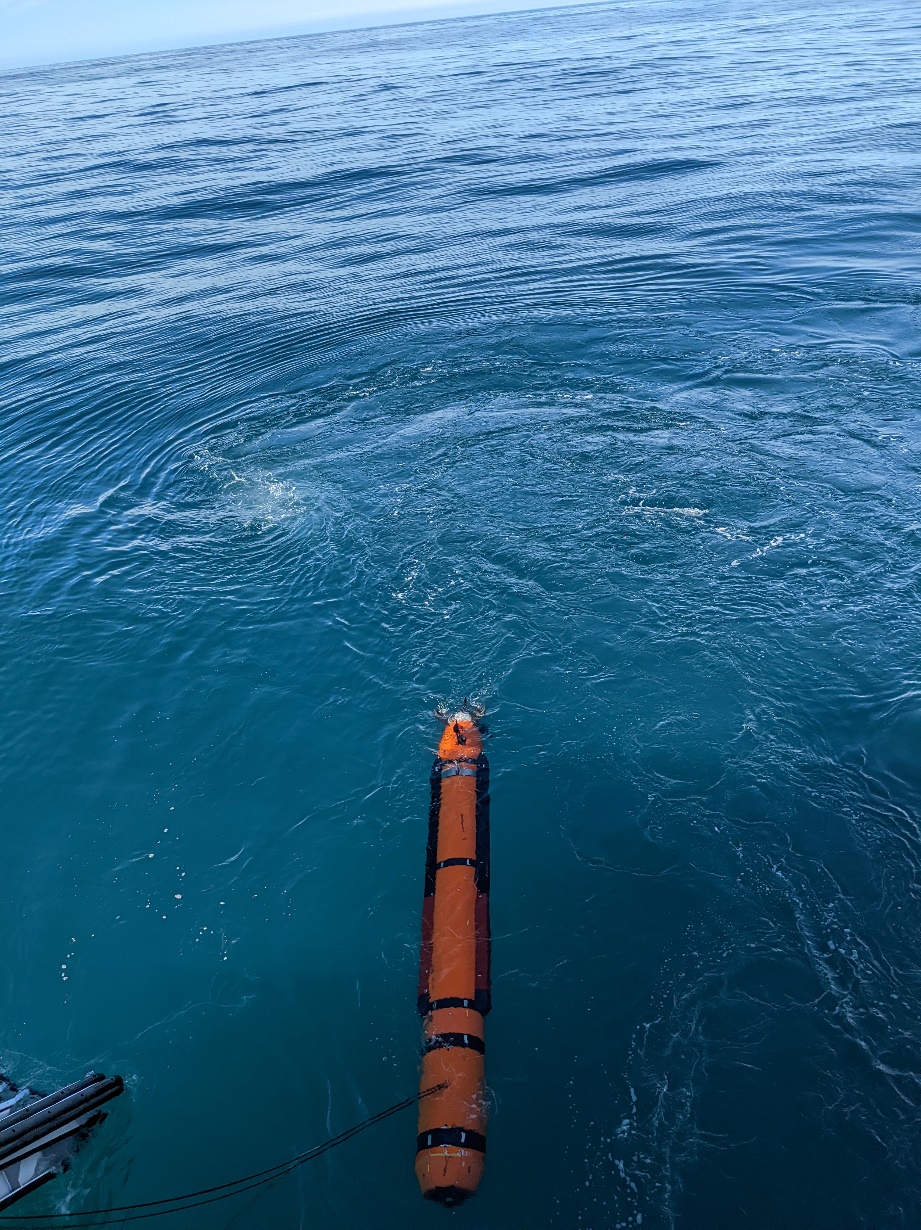
Currently the Munin+ will not be able to dive if the conditions are too calm. We used the MOB boat to run circles around the Munin+ in order to make enough waves to allow it to tip beneath the surface. This will hopefully be rectified before future work, Kongsberg have already suggested a new propeller to address this.
-
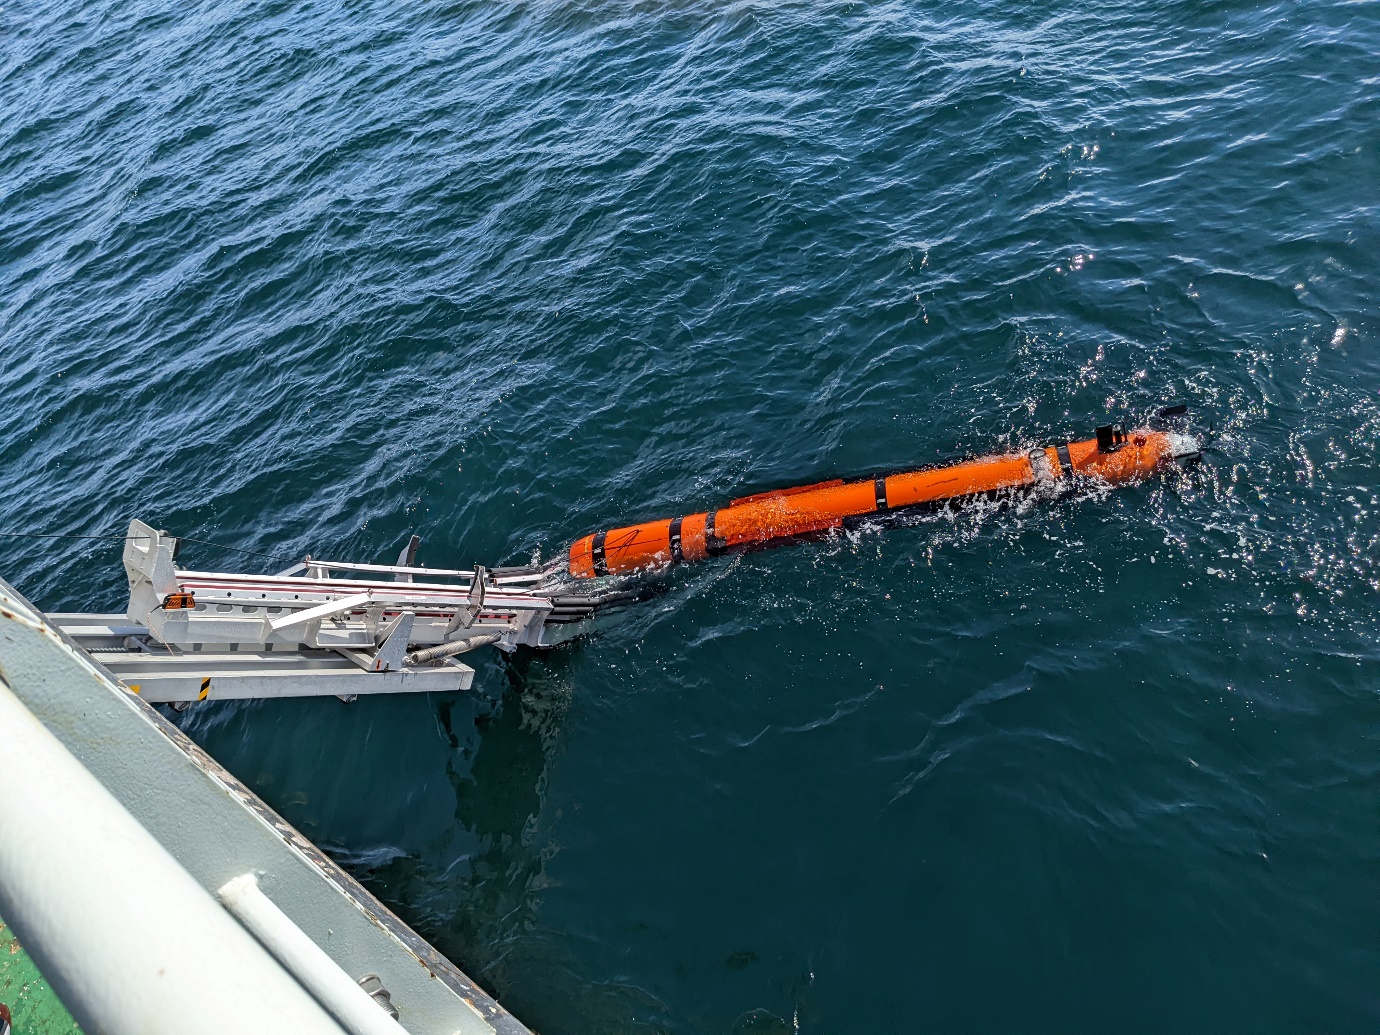
Suitable weather/wave conditions are more restricted than using Chimaera/ an ROV. The AUV stinger that launches and collects it is the main issue, especially during collection when it may crush the AUV if the wave conditions are not calm enough.
-
At least 2 AUV pilots (preferably 3) are needed for every 12 hour shift.
-
3 people, preferably pilots, are needed to launch/recover the AUV.
-
There is a mismatch between the data capacity of the NAS bottle (3TB) and the topside hard drives (2x 2TB) – topside hard drive size should be upgraded to match the capacity of the NAS bottle (2x3TB) to allow copying of the full dive. Without this dive length will be limited to 10hours by the topside machine harddrive size. Our tests collected 1TB in 5hours of operation.
-
We did not record AUV dives in toktlogger – a solution should be found for this in the future for more consistent reporting.
Software:
-
Kongsberg HuginOS (used for dive planning, AUV operation) was not as user friendly as we hoped e.g. there is a multi step, multi software procedure for importing existing multibeam data into the planning programme which will only input certain (non-standard) filetypes as either contour line files or RGB image files. RGB image files are overlayed over planning routes and cannot be moved underneath. This needs to be fed back to Kongsberg for improvement.
-
Kongsberg Reflection software allowed preview of most collected data, but again was not as user friendly or comprehensive as we hoped. Overlapping data are not easily harmonised, you have to “play” the whole dataset to get the image (this takes a while), and photomosaics are low resolution, in black and white and take up too much memory to save more than 100m of data at a time. This needs to be fed back to Kongsberg for improvement.
-
SASb (bathymetry interpreted from HiSAS sensor data) must currently be processed by Kongsberg – this is a bottleneck that is not acceptable for mapping programme purposes. Until project members can process the data themselves, SASb data cannot be assumed to be of use.
10 - AUV Testing Completed/Advised For The Future
Tests Completed
| testfelt | AUVMøre | AUVRovdefjorden | |
| Dive name | Mission_55_20220601_4 | Mission_55_20220606_2 | Mission_55_20220608_3 |
| Description | Partial dive 10km NE of Tromsø cut to drop kongsberg back in Tromsø | Complete dive on Møre shelf | Successful acoustics on steep slope in Rovdefjorden but both photo attempts on same slope failed |
| MB heights | 30m/20m | 20m | 20m |
| HiSAS heights | 30m/20m | 15m/25m/35m | 20m |
| Photo heights | 6m/5m | 5m/ 4m | Attempted 4m and 5m, both failed |
| Terrain | flat/gentle slope | flat/ gentle slope/ iceberg ploughmarks/ coral reef on a slope | moderate/steep slope |
| MAREANO VL photo | n/a | VL1072, VL1293 | n/a |
| MAREANO VL with acoustics | n/a | VL1071, VL1072, VL1293 | station 136, cruise 1408, 23.08.2014, søre sunnmøre special survey |
| MBE crossline | yes | yes | n/a |
| Photo terrain | not complex, achieved easily | included 5m run up coral reef slope (it panicked and went much higher due to wrong safe height setting), 4m going down coral reef slope - reached 2.6m off bottom whilst trying to adjust (may have been closer to the corals!) | n/a |
| HiSAS terrain | not complex, achieved easily | transit over iceberg ploughmarks gave very poor SASi and SASb data - too many shadows | steep rough slope (not evaluated fully yet) |
-
20m seems to work well enough for HiSAS imagery for our purposes
-
Photos could be run at 3m height if flat bottom, 4m was successful over slope with coral reef, 5m still gives acceptable imagery but not worth going higher. Clarity of water is a factor here too, so nearest possible for terrain should be the rule.
-
Photo quality very good, especially after colour corrections, have 2 VLs to compare results with video analyses (needs working up).
-
MBE works well at same time as HiSAS but coverage obviously restricted. HiSASb is not easy to obtain so better to rely upon EM2040 at present and should explore optimal depths for using this alone.
-
HiSAS not operating well over rugged bottom – iceberg ploughmark was too rugged – resulted in lots of holes in the data caused by shadows from cobbles/boulders/mounds.
-
MBE crossline confirmed good data from EM2040, more testing worthwhile though (were some concerns at test site, but fine at AUVMøre – why was this?)
-
Slope limitations are in navigation and maintaining safe heights especially during turns – AUVRovdefjorden was too steep for 4/5m photo transects – both resulted in emergency ascent due to safe height limits (the 20m height acoustic runs were fine).
Future testing suggestions
-
Find EM2040 optimal height (assuming no HiSASb will be available soon) i.e. test at 40, 50, 60m + aiming for maximum coverage at acceptable resolution
-
Acquire data that will allow Kongsberg to complete extended backscatter calibration (fee required).
-
Find maximum rugosity level for HiSAS data (iceberg ploughmark bottom is too rough)
-
Do 100% MBE over 100% HiSAS where both are at their optimum height. E.g. 300m x 300m run at 15m for HiSAS and 60m for MBE, for truer comparison.
-
Drift test with long line (Kongsberg estimate deviance of 1m/hr), opportunity to test explorative survey style as opposed to 100% coverage designs.
-
Photo survey designs – advise continued collaboration with Oscar Pizarro (Oscar.Pizarro@ntnu.no) and Jackson Shields (jshi2035@sydney.edu.au) who are designing methods of finding the path that most completely explores environmental space within the constraints necessary (time/wiggliness/turning circles/etc).
-
Check for issues when operating near depth limit (theoretically 1500m)
-
Figure out best way to do EM2040 mapping over steeper slopes – terracing fixed depth patches? Assess use of fixed height off bottom instead?
-
Do photo mosaic with 100% coverage of a patch (so far only single lines over VLs) – what patch size is useful and does not waste too much time? How does photo mosaic look?
-
Find photo technique for steep slope – what height in what direction? (downhill worked best at AUVMøre but had wrong setting for safe height on uphill –need to try uphill at 5m minimum as downhill at 4m and 5m failed at AUVRovdefjorden). Can we get uphill photo missions working? (safe height modification?)
-
SBP not yet tested in areas with suitable stratigraphy – needs testing in appropriate landscapes
-
Check 30m high HiSAS – is it good enough (what is the maximum height we can collect hiSAS data? To counteract shadowing)
-
Repeatability of returning to the same point that was surveyed before – positional accuracy
11 - Appendix: cruise day-by-day narrative
DAY BY DAY NARRATIVE (written by Rebecca Ross)
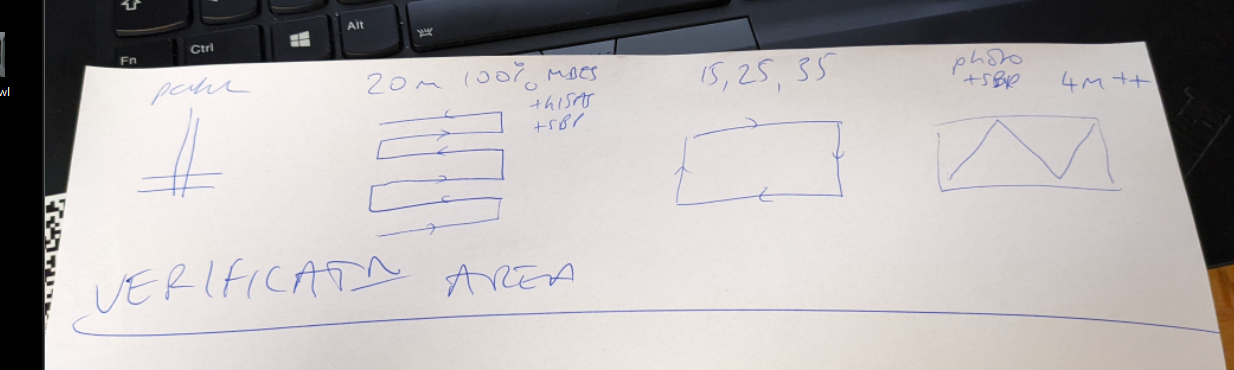
31.05, Tromsø: Instrument & Kongsberg support (Stieg & Kenneth) started early with mobilisation but had problems with mounting the stinger to the deck. Some time was spent waiting for some items to arrive to achieve this, but by 21.00 The stinger was mounted and the kongsberg team left for the night. The AUV is still not on board, but it was agreed that people had already fulfilled their hours and that we would complete the mobilisation in the morning ready to leave the quay at 08:00. The rest of the science team arrived between kl11-13.30, meeting at kl 14.00-15.30 for the sikkerhetsrunde followed by a science meeting (which Frithjof Moy also attended). It then took between ~15.30 – 23:30 to have planned the first test dive, although much of this time was spent familiarising ourselves with quirks of the software (importing external data – we only succeeded with contour lines extracted from xyz in Reflection so far, finding that dive planning didn’t show the expected options because the license wasn’t loaded, etc). The dive planning once in the flow took ~2hrs resulting in a plan for a dive that is 2hrs 45m long, but it involves an intricate pattern to test as much as possible at the testfelt tomorrow (see below: MBE patch test 20m height with water column data collected; 100% MBE crossing patch test at 20m height (with HiSAS on); 3 circuits covering the same area in the same direction trialling 3 more heights – 15m, 25m, 35m; photo survey line ~300m long at 3 different heights – 6, 5, 4m; photo survey zigzag to characterise/groundtruth area and try zig zag turns). In the morning Jan Arne will sit and check/modify/approve the dive plan on our transit to the testfelt.
01.06, Testfelt AUV0: Kongsberg re-joined at kl 08:00, lifting the AUV onto the stinger then leaving Tromsø kl 08:30 to arrive at the test site (AUV0) ~kl 09:30. Further preparations of the AUV systems were needed before being able to put the AUV in the water, including a CTD cast kl. 11:30. By kl13:20 the AUV was in the water for buoyancy testing/adjustments. While the AUV did float adequately, attempts to progress from the buoyancy test to diving failed multiple times (i.e. the AUV cold no get below the surface as it was too buoyant), requiring several recoveries and relaunches, software updates, re trimming, and the assistance of the MOB boat which was deployed to drive in circles around the AUV as it attempted to dive to provide some waves that may encourage it to sink. This finally succeeded ~kl 18:00 and the AUV began to run the planned test dive. However, it was agreed that the planned test dive should be shortened to ensure that Kongsberg could assist with data transfer before returning them to Tromsø. As a result the test dive covered: Full patch test with water column data, ~70% of planned 20m height 100% MBE mow the lawn pattern (with HISAS, SSS, SBP etc switched on too, but water column off as we were advised that this has similar volumes to the HISAS and the two should not be collected at the same time for extended periods), then omitted additional heights of HISAS and drove directly to 1.5 circuits of images at 6m and 5m height (the ideal 4m height line having to be omitted). This was all achieved by modifying a waypoint and commanding that the AUV go directly to it then aborting the dive one photo circuit early. Each of these commands must be sent individually to the AUV and it took 5-15m of retrying to send the commands before each was obeyed (most likely to be successful when the AUV is driving towards the ship and is very close to the ship). The AUV surfaced ~kl.19:50, departing for Tromsø kl. 20:00. During the ~40min transit the copying issue that had occurred on the previous test dive reoccurred (unable to get the data off the AUV’s NAS). However, this was solved by Kongsberg within ~20mins. Kongsberg stayed aboard for a further 2hrs to aid with ensuring all was copied and the data briefly reviewed to check all worked. Kongsberg were then delivered back to Tromsø by small boat and the ship departed kl.22:45. We are now aiming to reach open water near the coast ~1hr away where the ADCP calibration will take place (~2hrs, requiring linear and circular driving patterns with controlled pings). Ivar (the ADCP Kongsberg representative) was informed at dinner that this would be the case and given time to rest before being needed to undertake the calibration around kl.00:00. Once the calibration is complete we shall begin the transit to Perlekjederev with modifications according to the ADCP testing needs (drive perpendicular to the coast out to the shelf edge, then follow the slope edge at around 200-400m contour until we reach the Perlekjederev). We therefore expect to reach Perlekjederev sometime mid-late morning on 03.06.
02.06, Transit: In transit all day. The ADCP calibration went well ~02:30 – 04:30 and allowed continued data collection during all transits of this cruise. As the test dive was a success some time was spent today looking at the data which seems to be of reasonable quality (See “Preliminary test data evaluation” section). We also planned the dive at Perlekjederev to cover the current video lines with 100% multibeam at 15m high (with HiSAS turned on) and two circuits at 25m and 35m to further evaluate the effect of height of bottom upon the HiSAS. Additionally a crossline is planned followed by two/three circuits of photos (Jan Arne will have the last say) at 5m (repeated from test dive), 4m, and 3m high along previously run video lines where we have some idea of what terrain should be expected (none with the biggest reef thickets).
News from instrument includes that Kongsberg seem to have forgotten to replace one of the topside machines harddrives so it has half the data capacity that we thought it would have, but this will hopefully be ok – it is mainly there to provide backup processing power so that we can process some things at the same time as each other. The copying problems yesterday, although solved also means that there are a few issues with the test dataset e.g. reflection cannot see the photos so we cannot see the photomosaic that we should see, but we think that this will be ok on the next dive (fingers crossed).Furthermore, Jan Arne and Leif confirmed that they will be on 12hour shift together and ideally would prefer a minimum of 3 pilots, which could allow longer coverage in the future, but ideally 4 for 24 hrs. This means that dives will be a maximum of 10hrs long to accommodate launch and recovery within a 12hour shift + beginning copying (which ideally would be monitored too).
Dives may need to be even shorter due to additional copying capacity issues. While the AUVs can go for a long time due to battery power (e.g. 24hrs), the NAS on board is only 3TB so you cannot collect HISAS (4GB/Min) and watercolumn multibeam (1GB/Min) for 24hrs. Then all of the data has to be copied to the “topside machine” for processing which has 2X 2TB drives but the folder must be copied in a set structure to interact with Reflection so in reality can only copy to 1 x 2TB and will fail if the copying runs out of space. Thus in practice we are likely to be limited by the space on the topside machine as much as by the 12 hour operation necessary from having only 2 pilots. We’ll try and work out what length of dive is the optimum with the current set up and stick to that.
Arrival at Perlekjederev expected at ~kl. 9/10.
03.06, Perlekjederev: We arrived at Perlekjederev kl 09:30 in mist, taking a CTD for calibration at 09:45 and starting the AUV mission at 10:30. However, despite the AUV succeeding in descending on its own this time, when it reached 20m depth it there a critical error, dropped its weight and conducted an emergency ascent to the surface where it had to be collected. The AUV team spent most of the day struggling to find out what went wrong, with Kongsberg support also finding not obvious issue that could be solved. At 16:00 a second attempt was made, spending longer at the surface but again managing to descend on its own, then once again it reached 40m and gave a critical error (5m critical altitude reached, despite being >250m from the bottom), dropped its weight and returned to the surface. As a result it was decided that we should give up on Perlekjederev and start heading to AUV6. This allowed the AUV team some more time to work on the issue (although no further advance was made) while we begin the 15hr transit to AUV6 so that we would be ready to start the next dive at the beginning of the next shift. The plan will be to try a short test dive which uses a new and simple mission file to test whether the more complex missions, which often started as a copy of a previous dive to shortcut the typing of all the sensor switch ons, could have become corrupted in some way. This dive need not be long or go all the way to the bottom but must prove that it can dive below the thermocline to a user defined depth, and follow the mission plan. This will be designed quickly in the morning and hopefully will leave enough time to do the AUV6 dive as well.
In the meantime, we have planned dives at AUV6 and AUVT1. AUV6 now includes 4 heights of HiSAS around a circuit that is ~700m x 300m and mapped over the video line for groundtruthing to provide the heights test that we have not managed to do at the previous 2 sites. Then the rest of the site is in mow-the-lawn pattern for 100% HiSAS coverage with 20m height, followed by a crossline where SBP is switched off and water column MBE is turned on (assuming that it was SBP that interfered with the watercolumn at the test site). This will allow a test of WC over soft bottom. One VL is covered in this area, together with the two 5km template photo dive patterns proposed by Jackson Shields and Oscar Pizarro. An expert-led 5km rout will also be added to the photodive after evaluating the features seen in the acoustics. The acoustic dive should be 6.5hrs long. AUVT1 is planned to follow the turning route that captures multiple video lines and bisects multiple planned boxes/features and climbs several slopes of varying degree to test how the AUV handles this (including in the edge of AUV6 which was reduced in size to accommodate time constraints). The height of acquisition will be decided after the AUV6 results.
AUVT1 plan
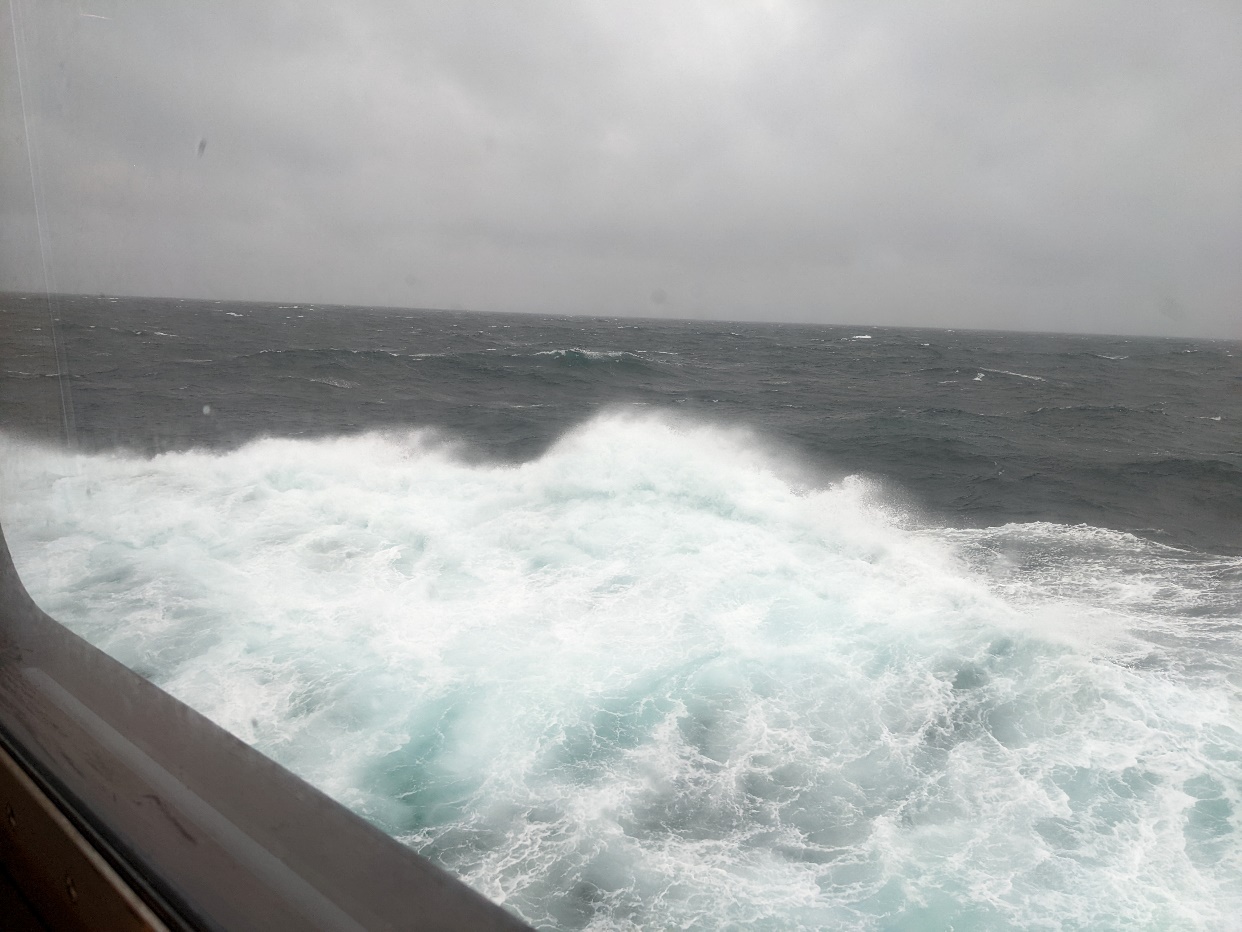
04.06, BO1: We arrived at AUV6 kl. 08:00 but found that the wind was increasing and was already boarderline for safety. As the most weather sensitive time is when recovering the AUV (where the AUV meeting the stinger could result in the waves and ship crashing the two together) it was decided that we would be unable to dive today. Margaret and Shyam had recently designed a survey pattern for use at night to acquire sub-bottom profiler and water column MBE data more densely around pockmark fields within BO1, so we began at kl. 09:35 with this surface vessel based acoustic survey instead of doing the AUV dives. Once this had begun it became clear that water column data was likely to be too bad, so that was only collected on the first line, and then tested again later on. Sub-bottom data looked acceptable, particularly when driving SW to NE with the wind behind the vessel, although as the wind increased the quality decrease on the NE to SW legs such that we instructed mid-way down the 4th line (a NE to SW leg, ~15:40) that the vessel speed back on NE to SW legs and focus on collecting data in the SW to NE direction. This has resulted in every other leg being collected with adequate quality, and the vessel was instructed to return to collect the poor-quality NE to SW legs in a SW to NE direction. After this the vessel will move on to a secondary similar pattern. By 18:50 the wind was beginning to lessen (peaked around 15 m/s, then 10 m/s) so we planned to return to AUV6 in the morning with the hope that we can begin with the first test dive at the start of the shift (kl. 08:00). Most of the team relaxed throughout the day, especially as more challenging conditions left some feeling unwell. Luckily no serious cases of seasickness were reported.
05.06 AUV6, AUV34: Overnight the SBP data collection continued, completing the first area by kl.08:00. The weather had improved by this point, but the waves and swell were still too high to safely recover the AUV, so the AUV team and captain were not happy to launch it. Therefore the SBP collection continued into the 2nd survey pattern to the west, with a pause at lunch time to review the waves/swell conditions (still unfavourable). At 13:40 after completing the second line of the 2nd survey pattern, we shifted from SBP collection to ADCP testing (which required the SBP be switched off, the ship to drive at 10knots in a straight lines with frequent turns). The ADCP testing returned to the first SBP survey pattern, albeit at half the length (closest to AUV6) with the hope that conditions might improve enough to resume diving. However the AUV6 dive was planned to be 6hrs long and would not easily be shortened so this was abandoned for the day and a shorter dive planned for AUV34 to give more chance of achiving the dive within the 12hr shift constraints (i.e. finish by 8pm). The ADCP testing was then undertaken in a square around the area to ensure that we could dive asap if conditions allowed. At 16:30 the ship was paused to review conditions and it was decided it was improved enough to try with care. Therefore the ADCP testing was ended and a CTD taken at 17:00, followed by a short repositioning of the ship to be on site at 17:45. The AUV dive checks from being on site to being in the water took ~20minutes with the AUV in the water by 18:17. However once again the dive aborted on the descent. This time a different error was encountered- the AUV reached 335m before dropping its weight and conducting an emergency ascent, having repeatedly reported issues and finally reporting a “critical….”. The AUV was back on deck by 19.10 and the ADCP testing pattern (following the shortened SBP pattern) was resumed. However, the AUV team after some consideration theorised that the AUV may need to detect the bottom from the moment it enters the water to ensure that it will not create so many errors. This means that the next dive with a likelihood of succeeding would have to begin at <200m depth. The BO1 area is exclusively >600m depth, and the nearby coral site was also at >300m. Consequently a plan was formed to go to a completely new area on the shelf outside of Møre to make sure that the dive could start at <200m and then potentially descend to deeper depths to extend the bug-testing. Once we knew we had the bathymetry for that area at 21:50 we began the 13hr transit so that the next dive could be undertaken around lunchtime the next day. The ADCP testing continued as we transited at 10knots to the next station at the new “AUVmoere”. It is noted that the ADCP seemed to not be recording any backscatter in the water column at this time in this area which is limiting its effectiveness.
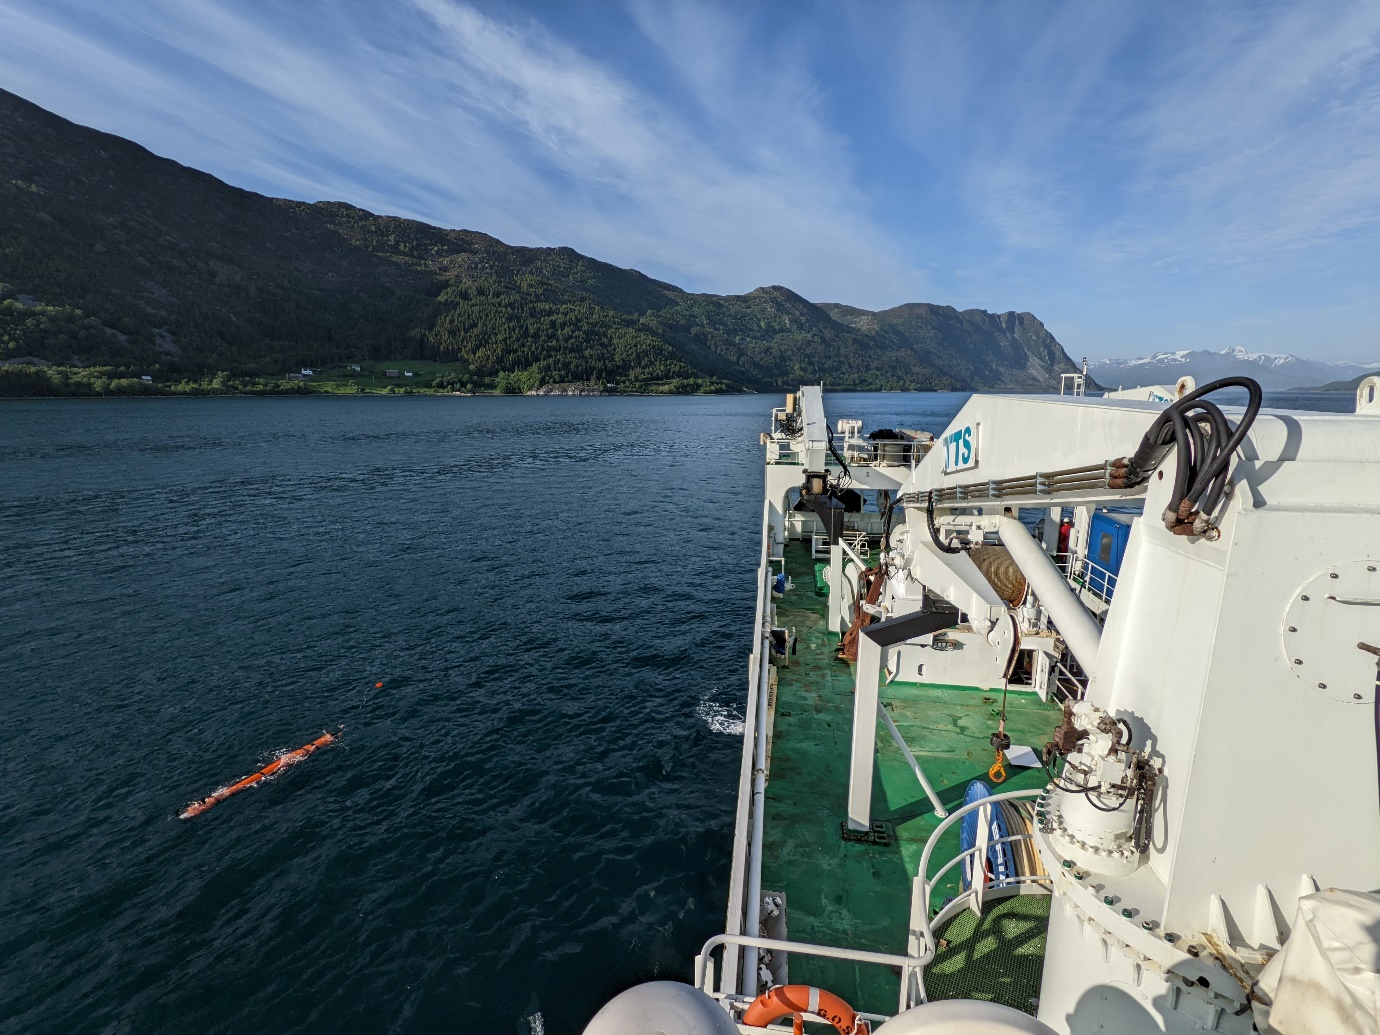
06.06, AUVMoere: We arrived on station at kl 10:45 and immediately took a CTD to provide the sound velocity profile for the dive. Weather and wave conditions were very calm. The AUV was in the water by 11:24 and despite staying longer at the surface than hoped (calm waters making it harder for the AUV to dive down from the surface), it successfully completed the descent and continued along the dive plan (“AUV Mission 55 20220606 2” – NB no first dive was attempted, but a restart of the mission software renumbered the dive to number 2 for this date). This dive was 5hrs long beginning with two lines 50m apart at 20m height for multibeam overlapping over a bedform feature in the centre of a channel (overlapping MAREANO VL 1071). This was followed by three sets of HiSAS circuits (i.e. two parallel lines with overlap) repeated at 15m, 25m and 35m height. A further single line of HiSAS at 20m overlaps the western edge of this circuit and then continues North, then West to another MAREANO VL (1072). Again two lines of overlapping multibeam at 20m height cover the VL before a photo line was run along the VL at 5m height. After this VL a 20m high acoustic path resumes to the north west to meet a third VL (1293, a coral reef site), where again two overlapping lines of multibeam were completed around the VL, followed by a photo dive at 4m proceeding downhill (which due to avoidance measures and a high safe height was completed at 8-10m high), followed by a wide outside turn to re-run the VL upslope at 4m height. This was successful, although did reach 2.6m high at one point before re-gaining the programmed 4m height. The dive ended as planned, although the recovery rope was not deployed from the nose of the vehicle as it should have been, so the MOB boat was deployed to assist, resulting in the AUV being on deck by kl.17:35. This 5hr dive collected 1TB of data and took 2.5hrs to copy onto the topside machine. This then took closer to 5hrs to copy onto the ship’s server in the middle of the night. During the dive today planning was completed for a dive in the slide feature (“AUVmoereamfi”) to the east of AUVmoere to be attempted tomorrow, contingency planning was begun for some expected incoming weather exploring options around søre sunnmøre and south of Florø, and a plan was made for the night to benefit the ADCP testing. The night plan started at 17:35 when the ship transited to the start point of the Svinøy Section (an oceanographic transect that bisects known water mass structure and is repeated by cruises and gliders). This was reached at 18:20 when a CTD was taken before proceeding along the Svinøy section in a NW direction. At 19:50 a second CTD was taken (limited by the shift pattern of the instrument personnel, ideally this would have been repeated several times along the line and with bigger spacing between stations)). At 20:15 the NW path was resumed, with this planned to be followed at 10knots for several hours before returning to the start of the Svinøy Section and transiting towards the AUVmoereamfi site, ready to start the dive at kl.08:00 tomorrow. At 23:00 some of the data was reviewed from todays dive with good photo results at 4m height, and this time the photomosaicing worked (the test site photomosaic did not work due to issues during interrupted copying). We must wait for the copying to the server to complete before the HISAS processing can begin and the HISAS heights test can be reviewed. We are therefore unable to use the result of this to guide the height of our acoustic acquisition in tomorrows dive.
07.06, Søre Sunnmøre: We were on site by kl.07:45 where we found a number of fishing nets set in the area which would have required altering the dive before starting. We took at CTD at kl 08:00 but in the meantime the AUV team assessed the conditions and decided that the waves had already picked up enough to cancel the dive completely.
Plan B was a possibly avgradert area in Søre Sunnmøre and Plan C was Viking Banken. Søre Sunnmøre was prioritised having:
-
emailed Frithjof Moy, Hanne Hodnesdal, Lilja Bjarnadottir and Reidulv Bøe the previous night about Søre Sunnmøre permissions (with the Captain cc’d – Karsten had paperwork showing that Reidulv had made previous FOH permissions in this area),
-
video data from the area in 2014-2020 and
-
realised that the Viking Banken site would be a 15hr transit (i.e. no dive today) and would be gamble with the weather on Wednesday
Therefore we decided to transit inshore near to Søre Sunnmøre (between Godøya and Hareid) with a deadline of 17:00 to decide whether we would leave for Viking Banken (where we have not previously surveyed) ready to try a dive at the start of shift on Wednesday, or stay in søre sunnmøre assuming that we would have permission to possibly dive later in the day and/or Wednesday, as well as being sheltered from the (worse) weather on Wednesday.
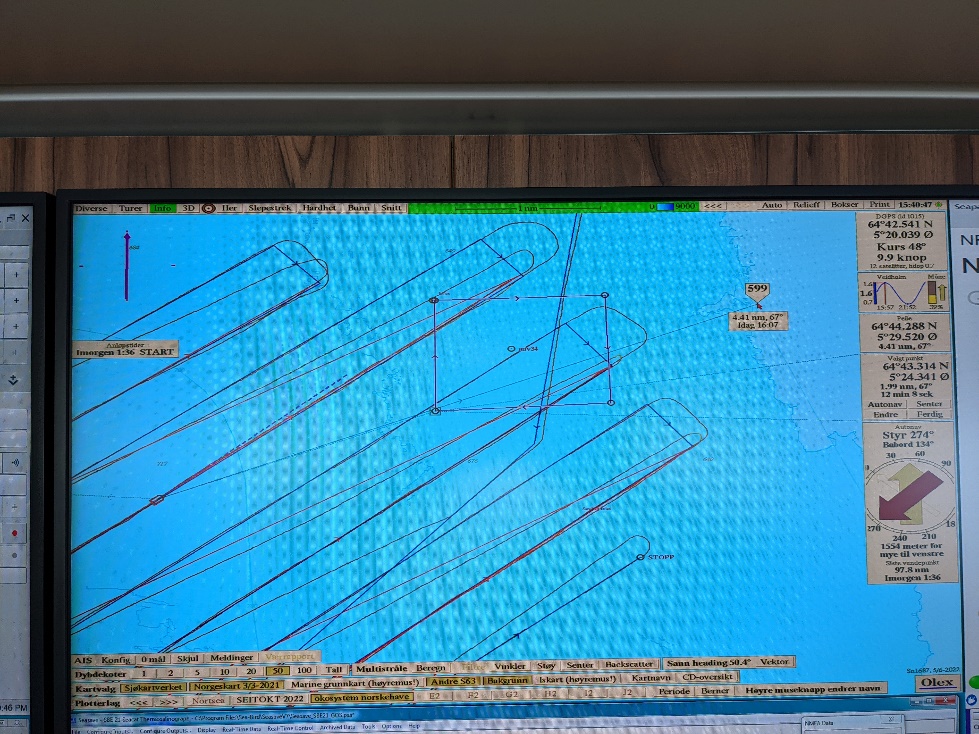
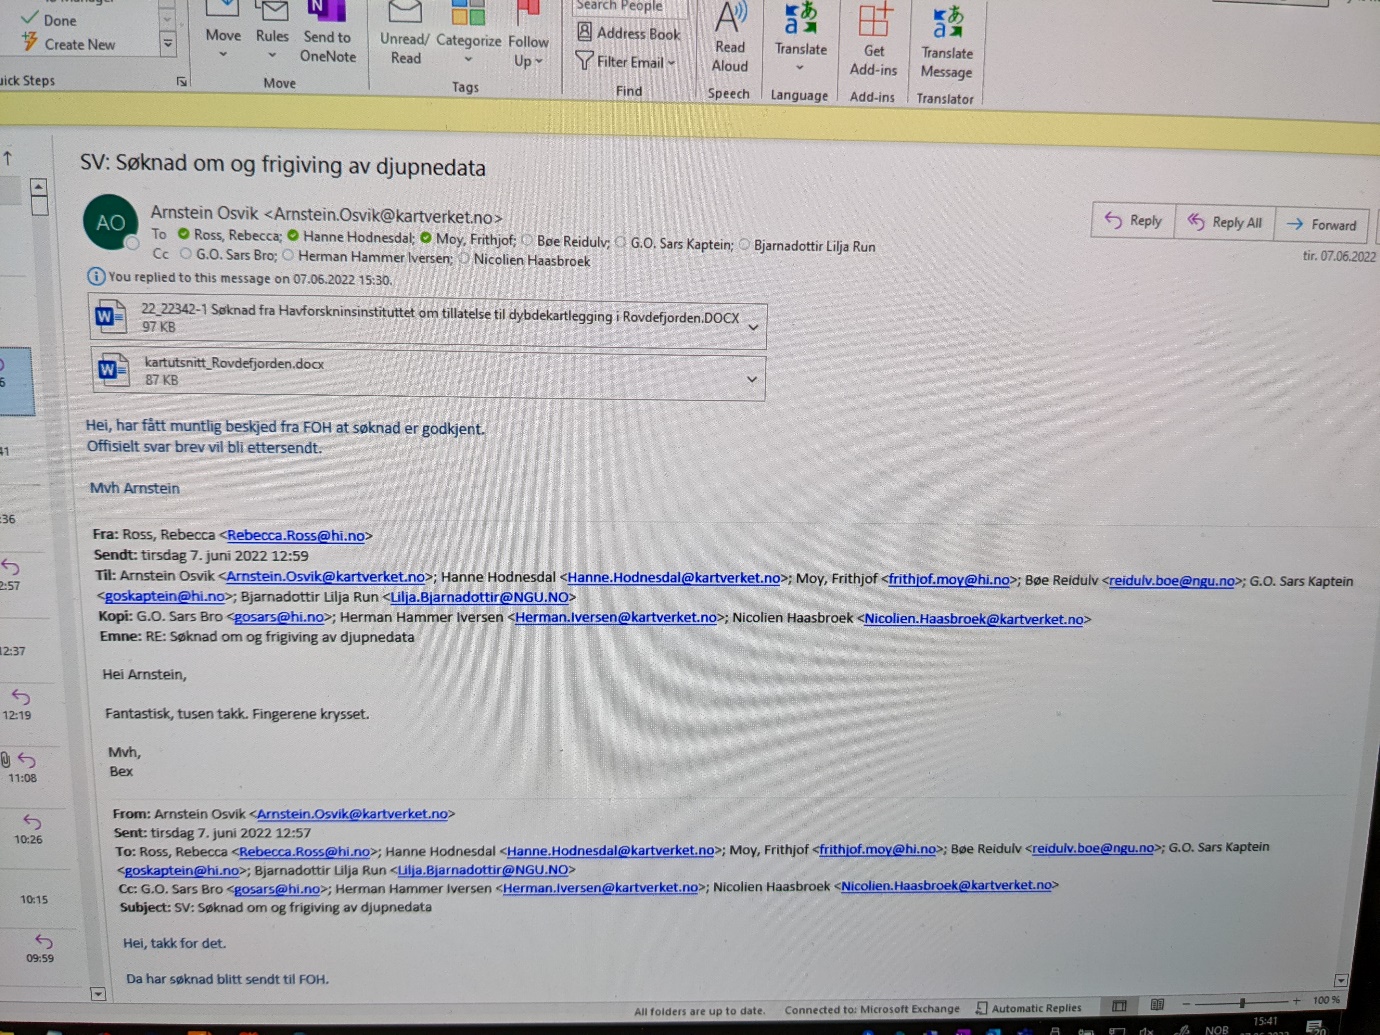
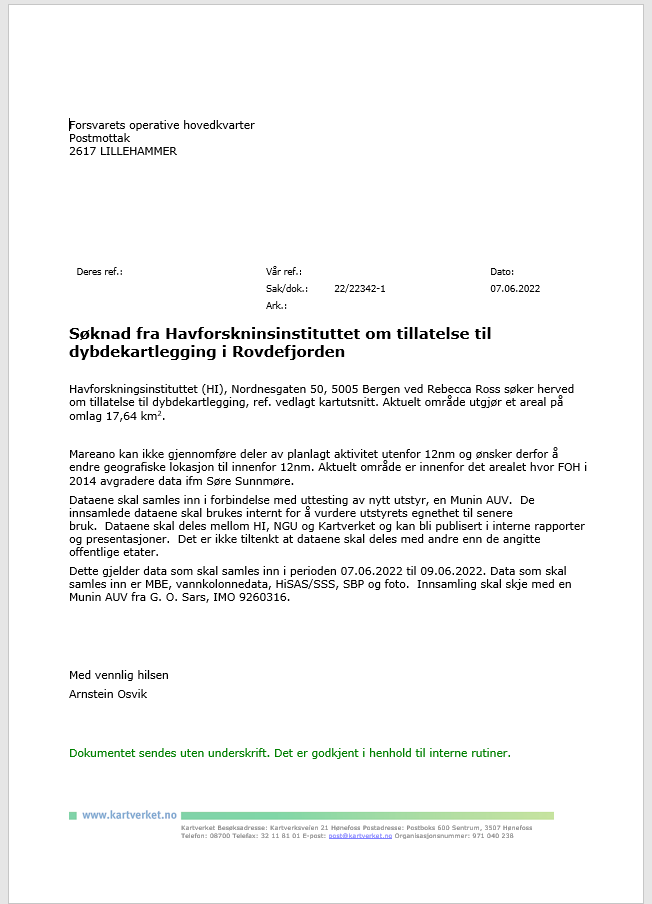
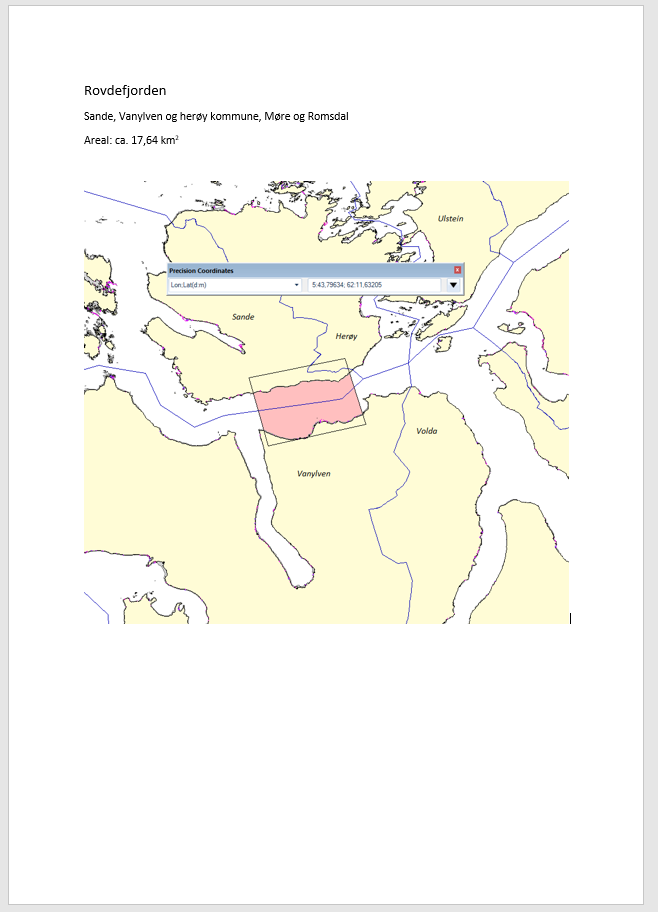
The email chain resulted in needing to apply to FHO via Arnstein Osvik at Kartverket for permission to collect all datatypes in Søre Sunnmøre in a specific area which Tor Jan Meek wrote on our behalf having applied for similar before and Arnstein amended and sent it in for us (email from Arnstein tir. 07.06.2022 15:26 with attached søknad and area map - a screenshot of these is below). In that same email Arnstein reported that he had recieved «muntlig beskjed fra FOH at søknad er godkjent. Offisielt svar brev vil bli ettersendt» so we agreed to bet on Søre Sunnmøre and started transiting into the site where the permission was applied for.
However the brev was not received which the captain was keen to have before starting, so upon arrival at the site at ~kl. 18:30 we did a CTD then turned off all sensors on the AUV to do a technical test dive that would just be testing if the AUV could dive in the centre of the Fjord where it was 370m deep (i.e. again without detecting the bottom at the start of the dive, and collecting/storing no data except the technical log of commands sent and received from the vehicle).
The AUV went in the water at 19:09 but drove along the surface for 5mins, failed to dive, then aborted its dive with a number of new errors. It then shut down its propeller and released its nose-rope (it did not drop its weight as it was already at the surface). The AUV was back on deck by 19:50.
From ~Kl. 20:30 the ship began the night movements for ADCP testing, this time back and forth across the fjord all night (like a ferry) for tidal ADCP monitoring.
08.06, Rovdefjorden: We continued the ADCP transit lines as we awaited the written proof that we could work in this area – the captain and rederi were keen to have written confirmation (more than an email saying that there is oral confirmation). Eventually a telephone conversation with Arnstein Osvik at 09:54 clarified that written confirmation from FOH would not be received within the next week but the oral confirmation given to kartverket is enough to proceed with collection, and is the way that kartverket usually work in response to FOH. Arnstein agreed to send a more official email from Kartverket explaining this, and the captain confirmed with rederi that this would be enough to allow us to start. The email was received by Rebecca Ross and forwarded to GOSars at 10:24, and the ship was in position for the AUV dive from kl 10:30. Due to needing multiple restarts and pre-dive checks the AUV was not in the water until 11:00 to start Mission 55 20220608 3 (AUV Rovdefjorden1). This dive plan was short (1.5hrs) to allow it to be undertaken the previous day if possible, and kept that way for the benefit of faster copying and giving time to plan another dive further along the fjord. The plan comprised 2 acoustic lines with overlapping HISAS going up and down a 20* slope over a previous VL, followed by 3x 4m high photo lines up and down the same slope/HISAS patch, then 300m of photo at the bottom, a water column interference test for 500m, then an ascent to 60m turn and descent to the bottom again to test losing the bottom contact for a short period to check if this triggers some of the errors we’ve been having at the start of dives. Being within a sheltered fjord, the AUV again needed the MOB boat to provide waves to allow it to dive, and the dive started as planned with the two first acoustic lines collected successfully, down and up a 20* slope. However due to human error (the first issue due to this) the critical height limit was set too cautiously for making turns on a steep slope (safe height 10m i.e. the height off bottom at which it takes evasive manoeuvres, critical height 5m i.e. the height off bottom at which an emergency ascent is triggered) resulting in an emergency ascent, with the AUV back on deck at 12:00. The second dive (AUV Rovdefjorden2) removed the completed portion of the first dive (AUV Rovdefjorden1) and extended the plan to include testing of the MBE at 50m height in a mow-the lawn pattern over the edge of the base of the slope, followed by a 20m high comparison and a photo crossline before the ascent/descent test. This extension was done with the realisation that we will be unable to rely upon HISAS for bathy data in the immediate future so more testing is needed with larger MBE footprints. However, AUV Rovdefjorden2/ Mission 55 20220608 4 went in the water at 13:52, again needed encouragement from the MOB boat to descent, then aborted with a new error within a couple of minutes of diving, giving new uninformative errors that had not been encountered before. The AUV was recovered to deck around 14:30. As considerable packing of equipment was needed, it had been agreed that the last dive needed to be on deck by 17:00 today before departing for Bergen. With unknown errors the AUV team were unhappy to dive without resolving them/ reassurances from Kongsberg, and as launching takes minimum ~30mins and recovery takes minimum ~30m it was decided that no additional dives could reasonably be achieved in the time left. The cruise was therefore terminated and the captain given permission to begin transit to Bergen at 14:55. As extra time was available the Captain used the time to pick up a replacement piece of equipment at Måløy on the way south, stopping at 18:15, and departing again at 20:30. At time of writing expected arrival in Bergen is at 06:30 tomorrow (09.06.22).