Stock Name: Barents Sea capelin (ICES subareas 1 and 2 excluding Division 2.a west of 5°W )
Released 16 October 2023
Advice on fishing opportunities
The Joint Russian-Norwegian Working Group on Arctic Fisheries (JRN-AFWG) advises that when the Joint Norwegian–Russian Fisheries Commission management plan is applied, catches in 2024 should be no more than 196 000 tonnes.
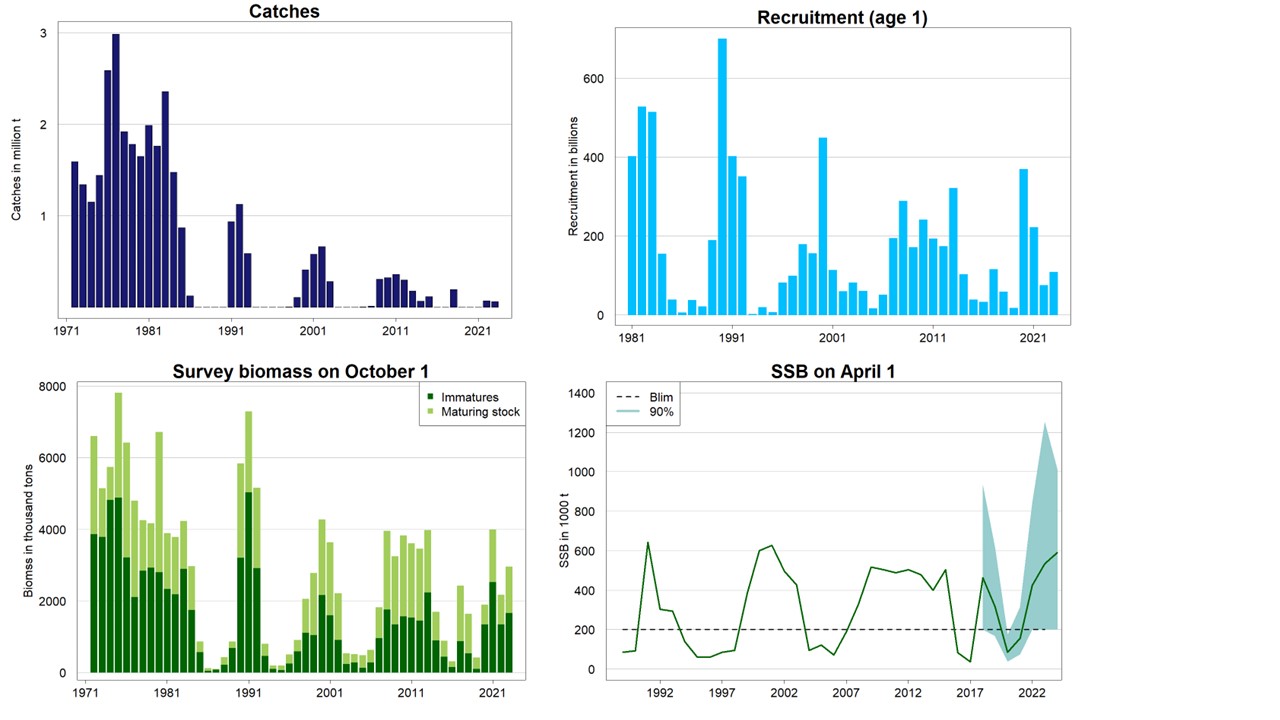
Stock development over time
Spawning‑stock size is above Blim. No reference points for fishing pressure have been defined for this stock.
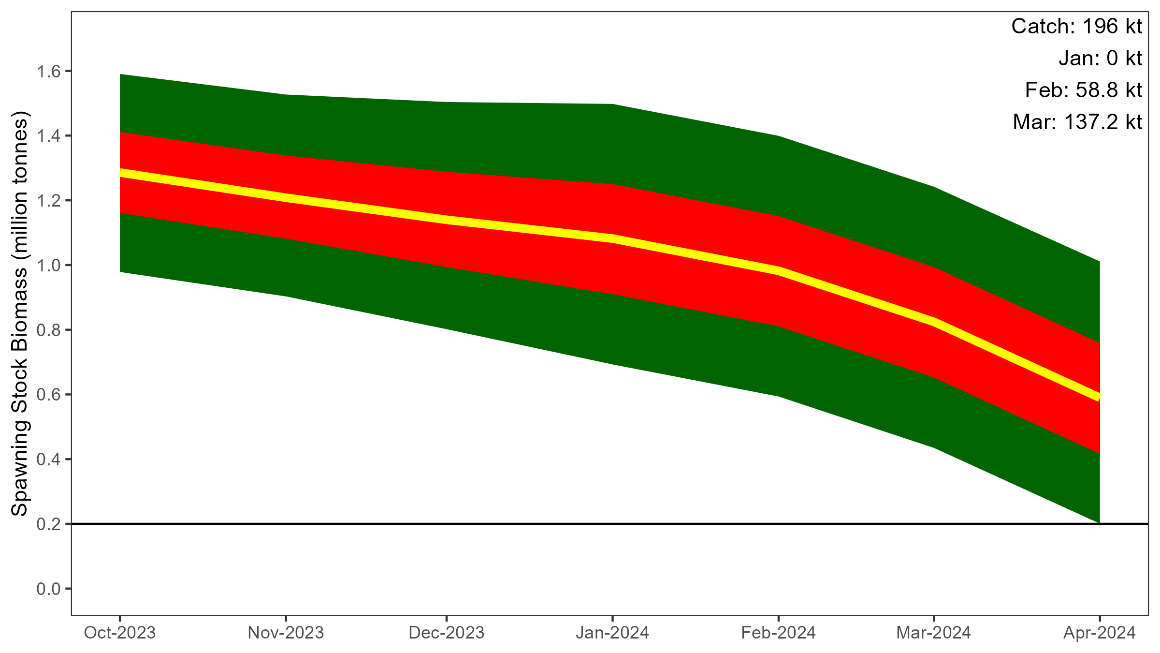
Catch scenarios
Calculations of catch scenarios are based on a forward projection from the autumn acoustic survey. It involves that SSB for April 2024 is calculated by taking into account predation by immature cod and other sources of natural mortality. A catch scenario that results in SSB greater than 200 000 tonnes with 95% probability corresponds to the JNRFC Management Plan.
| Variable | Value | Notes |
|---|---|---|
| Maturing stock biomass 2023 | 1285 890 | Median biomass of fish above the length‑at‑maturity (14 cm), estimated based on the autumn acoustic survey 1 October 2023. These fish will be spawning in April 2024; tonnes. |
| Predation by immature cod January–March 2024; from the predation model | 296 000 | Based on the prediction of cod abundance in 2024 from the 2023 cod stock assessment (Anon, 2023a); tonnes. |
| Basis | Total catch (2024 ) | Median SSB (2024 ) | P (SSB 2024 > 200 000 t) in % | % TAC change* | % advice change** |
|---|---|---|---|---|---|
| ICES advice basis | |||||
| MP harvest control rule, P (SSB > 200 000 t) = 95% | 196 000 | 590 000 | 95 | +216 | +216 |
| Other scenarios | |||||
| No fishing | 0 | 785 000 | 99.8 | -100 | -100 |
* TAC (2024) vs. TAC (2023).
** Advice (2024) vs Advice (2023).
Basis of the advice
| Advice basis | Management plan |
|---|---|
| Management plan | In 2002, the Joint Norwegian–Russian Fisheries Commission (JNRFC) adopted the following harvest control rule (HCR) for Barents Sea capelin: ‘The TAC for the following year should be set so that, with 95% probability, at least 200 000 tonnes of capelin (Blim) will be allowed to spawn ’. ICES evaluated this HCR as well as alternative HCRs suggested by JNRFC in 2016 (ICES, 2016), and only the existing HCR was found to be precautionary. Following ICES evaluation, the JNRFC decided to maintain the existing HCR (JNRFC, 2016). It should be noted that the term Blim in the harvest control rule is replaced by Bescapement in the latest benchmark report (ICES, 2023), and Bescapement is set to 200 000 tonnes (cf Table 4). |
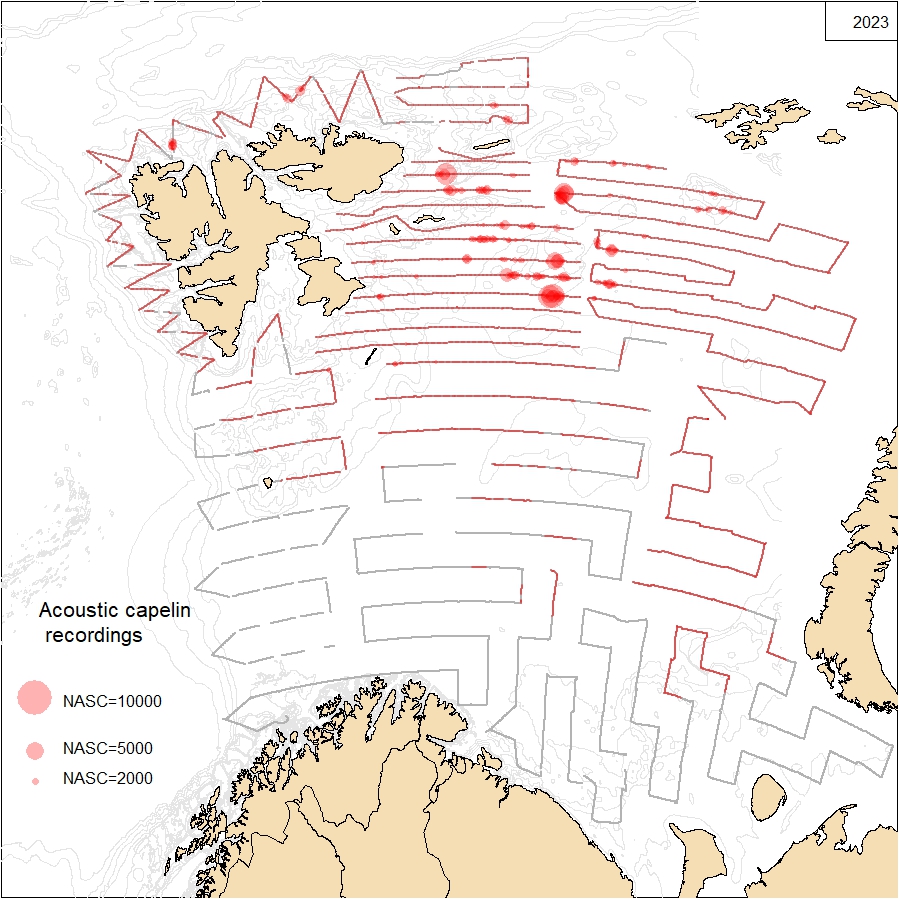
Quality of the assessment
The geographical survey coverage of the Barents Sea capelin stock during the BESS in 2023 was close to complete (Figure 3); the capelin distribution might have continued a little bit further northwards in the north-east.
Issues relevant for the advice
Due to the temporary suspension of Russian scientists from ICES, this assessment was conducted by a Joint Russian-Norwegian working group on Arctic Fisheries (JRN-AFWG) consisting of scientists from VNIRO (Russia) and IMR (Norway) (Anon., 2023b). This advice has been conducted outside ICES and should not be considered as ICES advice.
However, this assessment and advice has been produced following the new methodology agreed and described in detail at the recent ICES benchmark in 2022 (ICES, 2023), which is thus used for the first time.
Reference points
| Framework | Reference point | Value | Technical basis | Source |
|---|---|---|---|---|
| MSY approach | MSY Btrigger | |||
| FMSY | ||||
| Precautionary approach | Blim | 68 000 t | SSB1990, which was the lowest SSB after the herring collapse that has produced a good year class. SSB estimated on April 1. | ICES (20 23 ) |
| Bpa | ||||
| Flim | ||||
| Fpa | ||||
| Management plan | Bescapement | 200 000 t | Reference point defining the SSB-level used in the HCR. The HCR determines that TAC shall not be set higher than that there is at least 95% probability that SSB is above Bescapement. | JNRFC (2016), ICES (2023) |
| Fmgt |
Basis of the assessment
| ICES stock data category | 1 ( ICES, 2021b ). |
|---|---|
| Assessment type | Model based on acoustic survey and prediction six months ahead to calculate spawning biomass. Target escapement strategy used. |
| Input data | Norwegian–Russian acoustic survey in September. Model estimates of maturation based on survey data. Natural mortalities from multispecies model (predation by immature cod on prespawning capelin based on information on cod distribution, abundance and stomach content data) . |
| Discards and bycatch | All catches are assumed to be landed. The amount of bycaught capelin in other fisheries is very low. |
| Indicators | None. |
| Other information | Latest benchmark was in 2022 (ICES, 2023). |
| Working group | Joint Russian-Norwegian working group on Arctic Fisheries (JRN-AFWG). |
History of the advice, catch, and management
| Year | ICES advice | Catch corresponding to advice | Agreed TAC | ICES catch |
|---|---|---|---|---|
| 1987 | Catches at the lowest practical level | 0 | 0 | 0 |
| 1988 | No catch | 0 | 0 | 0 |
| 1989 | No catch | 0 | 0 | 0 |
| 1990 | No catch | 0 | 0 | 0 |
| 1991 | TAC | 1000000 | 900000 | 933000 |
| 1992 | SSB > 400 000–500000 t | 834000 | 1100000 | 1123000 |
| 1993 | A cautious approach, SSB > 400 000–500 000 t | 600000 | 630000 | 586000 |
| 1994 | No fishing | 0 | 0 | 0 |
| 1995 | No fishing | 0 | 0 | 0 |
| 1996 | No fishing | 0 | 0 | 0 |
| 1997 | No fishing | 0 | 0 | 1000 |
| 1998 | No fishing | 0 | 0 | 3000 |
| 1999 | SSB > 500 000 t | 79000 | 80000 | 101000 |
| 2000 | 5% probability of SSB < 200 000 t | 435000 | 435000 | 414000 |
| 2001 | 5% probability of SSB < 200 000 t | 630000 | 630000 | 568000 |
| 2002 | 5% probability of SSB < 200 000 t | 650000 | 650000 | 651000 |
| 2003 | 5% probability of SSB < 200 000 t | 310000 | 310000 | 282000 |
| 2004 | No fishing | 0 | 0 | 0 |
| 2005 | No fishing | 0 | 0 | 1000* |
| 2006 | No fishing | 0 | 0 | 0 |
| 2007 | No fishing | 0 | 0 | 4000* |
| 2008 | No fishing | 0 | 0 | 12000* |
| 2009 | 5% probability of SSB < 200 000 t | 390000 | 390000 | 307000 |
| 2010 | 5% probability of SSB < 200 000 t | 360000 | 360000 | 323000 |
| 2011 | 5% probability of SSB < 200 000 t | 380000 | 380000 | 360000 |
| 2012 | 5% probability of SSB < 200 000 t | 320000 | 320000 | 296000 |
| 2013 | 5% probability of SSB < 200 000 t | 200000 | 200000 | 177000 |
| 2014 | 5% probability of SSB < 200 000 t | 65000 | 65000 | 66000 |
| 2015 | 5% probability of SSB < 200 000 t | 6000 | 120000 | 115000 |
| 2016 | Zero catch | 0 | 0 | 0 |
| 2017 | Zero catch | 0 | 0 | 0 |
| 2018 | 5% probability of SSB < 200 000 t | 205000 | 205000 | 194520 |
| 2019 | Zero catch | 0 | 0 ** | 53* |
| 2020 | Management plan | 0 | 0** | 31* |
| 2021 | Management plan | 0 | 0** | 10* |
| 2022 | Management plan | ≤ 70000 | 70000 | 65246*** |
| 2023 | Management plan *** | ≤ 62000*** | 62000 | 60692*** |
| 2024 | Management plan *** | ≤ 196000*** |
* Research catch and bycatches in other fisheries.
** Up to 500 tonnes was allowed for research survey catches.
*** In 2022 and 2023 assessment and advice was carried out by the Joint Russian-Norwegian working group on Arctic Fisheries (JRN-AFWG) which compiled catches and gave advice.
History of catch and landings
| Year | Winter | Summer–Autumn | Year total | |||||
|---|---|---|---|---|---|---|---|---|
| Norway | Russia | Others | Total | Norway | Russia | Total | ||
| 1965 | 217000 | 7000 | 0 | 224000 | 0 | 0 | 0 | 224000 |
| 1966 | 380000 | 9000 | 0 | 389000 | 0 | 0 | 0 | 389000 |
| 1967 | 403000 | 6000 | 0 | 409000 | 0 | 0 | 0 | 409000 |
| 1968 | 460000 | 15000 | 0 | 475000 | 62000 | 0 | 62000 | 537000 |
| 1969 | 436000 | 1000 | 0 | 437000 | 243000 | 0 | 243000 | 680000 |
| 1970 | 955000 | 8000 | 0 | 963000 | 346000 | 5000 | 351000 | 1314000 |
| 1971 | 1300000 | 14000 | 0 | 1314000 | 71000 | 7000 | 78000 | 1392000 |
| 1972 | 1208000 | 24000 | 0 | 1232000 | 347000 | 13000 | 360000 | 1591000 |
| 1973 | 1078000 | 34000 | 0 | 1112000 | 213000 | 12000 | 225000 | 1337000 |
| 1974 | 749000 | 63000 | 0 | 812000 | 237000 | 99000 | 336000 | 1148000 |
| 1975 | 559000 | 301000 | 43000 | 903000 | 407000 | 131000 | 538000 | 1441000 |
| 1976 | 1252000 | 228000 | 0 | 1480000 | 739000 | 368000 | 1107000 | 2587000 |
| 1977 | 1441000 | 317000 | 2000 | 1760000 | 722000 | 504000 | 1226000 | 2986000 |
| 1978 | 784000 | 429000 | 25000 | 1238000 | 360000 | 318000 | 678000 | 1916000 |
| 1979 | 539000 | 342000 | 5000 | 886000 | 570000 | 326000 | 896000 | 1782000 |
| 1980 | 539000 | 253000 | 9000 | 801000 | 459000 | 388000 | 847000 | 1648000 |
| 1981 | 784000 | 429000 | 28000 | 1241000 | 454000 | 292000 | 746000 | 1986000 |
| 1982 | 568000 | 260000 | 5000 | 833000 | 591000 | 336000 | 927000 | 1760000 |
| 1983 | 751000 | 373000 | 36000 | 1160000 | 758000 | 439000 | 1197000 | 2357000 |
| 1984 | 330000 | 257000 | 42000 | 629000 | 481000 | 368000 | 849000 | 1477000 |
| 1985 | 340000 | 234000 | 17000 | 591000 | 113000 | 164000 | 277000 | 868000 |
| 1986 | 72000 | 51000 | 0 | 123000 | 0 | 0 | 0 | 123000 |
| 1987 | 0 | 0 | 0 | 0 | 0 | 0 | 0 | 0 |
| 1988 | 0 | 0 | 0 | 0 | 0 | 0 | 0 | 0 |
| 1989 | 0 | 0 | 0 | 0 | 0 | 0 | 0 | 0 |
| 1990 | 0 | 0 | 0 | 0 | 0 | 0 | 0 | 0 |
| 1991 | 528000 | 159000 | 20000 | 707000 | 31000 | 195000 | 226000 | 933000 |
| 1992 | 620000 | 247000 | 24000 | 891000 | 73000 | 159000 | 232000 | 1123000 |
| 1993 | 402000 | 170000 | 14000 | 586000 | 0 | 0 | 0 | 586000 |
| 1994 | 0 | 0 | 0 | 0 | 0 | 0 | 0 | 0 |
| 1995 | 0 | 0 | 0 | 0 | 0 | 0 | 0 | 0 |
| 1996 | 0 | 0 | 0 | 0 | 0 | 0 | 0 | 0 |
| 1997 | 0 | 0 | 0 | 0 | 0 | 1000 | 1000 | 1000 |
| 1998 | 0 | 2000 | 0 | 2000 | 0 | 1000 | 1000 | 3000 |
| 1999 | 50000 | 33000 | 0 | 83000 | 0 | 22000 | 22000 | 105000 |
| 2000 | 279000 | 94000 | 8000 | 381000 | 0 | 29000 | 29000 | 410000 |
| 2001 | 376000 | 180000 | 8000 | 564000 | 0 | 14000 | 14000 | 578000 |
| 2002 | 398000 | 228000 | 17000 | 643000 | 0 | 16000 | 16000 | 659000 |
| 2003 | 180000 | 93000 | 9000 | 282000 | 0 | 0 | 0 | 282000 |
| 2004 | 0 | 0 | 0 | 0 | 0 | 0 | 0 | 0 |
| 2005 | 1000 | 0 | 0 | 1000 | 0 | 0 | 0 | 1000 |
| 2006 | 0 | 0 | 0 | 0 | 0 | 0 | 0 | 0 |
| 2007 | 2000 | 2000 | 0 | 4000 | 0 | 0 | 0 | 4000 |
| 2008 | 5000 | 5000 | 0 | 10000 | 0 | 2000 | 2000 | 12000 |
| 2009 | 233000 | 73000 | 0 | 306000 | 0 | 1000 | 1000 | 307000 |
| 2010 | 246000 | 77000 | 0 | 323000 | 0 | 0 | 0 | 323000 |
| 2011 | 273000 | 87000 | 0 | 360000 | 0 | 0 | 0 | 360000 |
| 2012 | 228000 | 68000 | 0 | 296000 | 0 | 0 | 0 | 296000 |
| 2013 | 116000 | 60000 | 0 | 177000 | 0 | 0 | 0 | 177000 |
| 2014 | 40000 | 26000 | 0 | 66000 | 0 | 0 | 0 | 66000 |
| 2015 | 71000 | 44000 | 0 | 115000 | 0 | 0 | 0 | 115000 |
| 2016 | 0 | 0 | 0 | 0 | 0 | 0 | 0 | 0 |
| 2017 | 0 | 0 | 0 | 0 | 0 | 0 | 0 | 0 |
| 2018 | 128520 | 66000 | 0 | 194520 | 0 | 0 | 0 | 194520 |
| 2019 | 5 | 0 | 0 | 0 | 0 | 0 | 0 | 53 |
| 2020 | 9 | 0 | 0 | 9 | 0 | 21 | 0 | 31 |
| 2021 | 2 | 0 | 0 | 2 | 0 | 8 | 0 | 10 |
| 2022 | 42597 | 22646 | 0 | 65243 | 0 | 3* | 3* | 65246* |
| 2023 | 37652 | 23040 | 0 | 60692 | ||||
* Bycatch in other fisheries; values are preliminary.
Summary of the assessment
| Year | Predicted SSB assuming catch = advised catch, 1 April | Recruitment from autumn acoustic survey, 1 October | Stock biomass from autumn acoustic survey, 1 October | Catch | |||
|---|---|---|---|---|---|---|---|
| Median | 5th percentile | 95th percentile | Immature | Maturing biomass | |||
| tonnes | Age 1, thousands | tonnes | |||||
| 1972 | 3873000 | 2727000 | 1591000 | ||||
| 1973 | 3794000 | 1350000 | 1337000 | ||||
| 1974 | 4826000 | 907000 | 1148000 | ||||
| 1975 | 4890000 | 2916000 | 1441000 | ||||
| 1976 | 3217000 | 3200000 | 2587000 | ||||
| 1977 | 2120000 | 2676000 | 2986000 | ||||
| 1978 | 2845000 | 1402000 | 1916000 | ||||
| 1979 | 2935000 | 1227000 | 1782000 | ||||
| 1980 | 2802000 | 3913000 | 1648000 | ||||
| 1981 | 402600000 | 2344000 | 1551000 | 1986000 | |||
| 1982 | 528300000 | 2188000 | 1591000 | 1760000 | |||
| 1983 | 514900000 | 2901000 | 1329000 | 2357000 | |||
| 1984 | 154800000 | 1756000 | 1208000 | 1477000 | |||
| 1985 | 38700000 | 575000 | 285000 | 868000 | |||
| 1986 | 6000000 | 55000 | 65000 | 123000 | |||
| 1987 | 37600000 | 84000 | 17000 | 0 | |||
| 1988 | 21000000 | 228000 | 200000 | 0 | |||
| 1989 | 84000 | 189200000 | 689000 | 175000 | 0 | ||
| 1990 | 92000 | 700400000 | 3214000 | 2617000 | 0 | ||
| 1991 | 643000 | 402100000 | 5039000 | 2248000 | 933000 | ||
| 1992 | 302000 | 351300000 | 2922000 | 2228000 | 1123000 | ||
| 1993 | 293000 | 2200000 | 466000 | 330000 | 586000 | ||
| 1994 | 139000 | 19800000 | 106000 | 94000 | 0 | ||
| 1995 | 60000 | 7100000 | 75000 | 118000 | 0 | ||
| 1996 | 60000 | 81900000 | 255000 | 248000 | 0 | ||
| 1997 | 85000 | 98900000 | 597000 | 312000 | 1000 | ||
| 1998 | 94000 | 179000000 | 1124000 | 932000 | 3000 | ||
| 1999 | 382000 | 156000000 | 1057000 | 1718000 | 105000 | ||
| 2000 | 599000 | 449200000 | 2175000 | 2098000 | 410000 | ||
| 2001 | 626000 | 113600000 | 1611000 | 2019000 | 578000 | ||
| 2002 | 496000 | 59700000 | 919000 | 1291000 | 659000 | ||
| 2003 | 427000 | 82400000 | 253000 | 280000 | 282000 | ||
| 2004 | 94000 | 606 00000 | 289000 | 224000 | 0 | ||
| 2005 | 122000 | 1 6900000 | 139000 | 348000 | 1000 | ||
| 2006 | 72000 | 51400000 | 288000 | 348000 | 0 | ||
| 2007 | 189000 | 194900000 | 970000 | 846000 | 4000 | ||
| 2008 | 330000 | 289200000 | 1765000 | 2185000 | 12000 | ||
| 2009 | 517000 | 171800000 | 1355000 | 1892000 | 307000 | ||
| 2010 | 504000 | 241900000 | 1576000 | 2248000 | 323000 | ||
| 2011 | 487000 | 193900000 | 1545000 | 2059000 | 360000 | ||
| 2012 | 504000 | 174500000 | 1461000 | 1996000 | 296000 | ||
| 2013 | 479000 | 321100000 | 2248000 | 1725000 | 177000 | ||
| 2014 | 399000 | 102700000 | 904000 | 785000 | 66000 | ||
| 2015 | 504000 | 39000000 | 448000 | 434000 | 115000 | ||
| 2016 | 82000 | 32600000 | 164000 | 153000 | 0 | ||
| 2017 | 37000 | 115300000 | 881000 | 1547000 | 0 | ||
| 2018 | 462000 | 200000 | 930000 | 58700000 | 541000 | 1100000 | 194520 |
| 2019 | 317000 | 168282 | 613733 | 17900000 | 111000 | 302000 | 53 |
| 2020 | 85110 | 38830 | 171850 | 369700000 | 1348000 | 542000 | 31 |
| 2021 | 156376 | 75197 | 314559 | 222200000 | 2527000 | 1459000 | 10 |
| 2022 | 423751 | 201897 | 838670 | 75460000* | 1357000 | 817000 | 65246 |
| 2023 | 534000 | 201000 | 1250000 | 108509000 | 1666000 | 1286000 | 60692 |
| 2024 | 590000 | 201000 | 1011000 | ||||
*Not adjusted for incomplete survey coverage.
References
Anon. 2023a . Report of the Joint Russian-Norwegian Working Group on Arctic Fisheries (JRN-AFWG) 2023. IMR-PINRO report series 7 -2023, 189 pp.
Anon. 2023b. Report of capelin assessment by the Joint Russian-Norwegian Working Group on Arctic Fisheries (JRN-AFWG) 2023. IMR-PINRO report series 8-2023.
ICES. 2001. Barents Sea capelin (Subareas I and II, excluding Division IIa west of 5°W). In Report of the Advisory Committee on Fishery Management, 2001, Part 1, Section 3.1.8, pp. 65–70. ICES Cooperative Research Report No. 246. 921 pp. https://doi.org/10.17895/ices.pub.5383.
ICES. 2015. Report of the Benchmark Workshop on Arctic Stocks (WKARCT), 26–30 January 2015, Copenhagen, Denmark. ICES CM 2015/ACOM:31. 126 pp. https://doi.org/10.17895/ices.pub.5295.
ICES. 2016. Report of the second Workshop on Management Plan Evaluation on Northeast Arctic cod and haddock and Barents Sea capelin, 25–28 January 2016, Kirkenes, Norway. ICES CM 2016/ACOM:47. 76 pp. https://doi.org/10.17895/ices.pub.5296.
ICES. 2023. Benchmark workshop on capelin (WKCAPELIN). ICES Scientific Reports. 5:62. 282 pp. https://doi.org/10.17895/ices.pub.23260388
JNRFC. 2016. Protocol of the 46th Session of the Joint Norwegian–Russian Fisheries Commission, Annex 12. Translated from Norwegian to English. For an accurate interpretation, please consult the text in the official languages of the Commission (Norwegian and Russian) at https://www.jointfish.com/content/download/501/6352/file/46-norsk.pdf (Norwegian) and https://www.jointfish.com/rus/content/download/502/6357/file/46-russisk.pdf (Russian).