I perioden 14. - 27. Februar 2022 ble gytefeltene til norsk vårgytende sild fra Møre (62º15ˊN) til Troms (71ºN) dekket akustisk med de kommersielle fartøyene MS Eros og MS Vendla. Den estimerte biomassen var omtrent 18 % lavere, og det estimerte antallet omtrent 29 % lavere sammenlignet med fjorårets tokt. Usikkerheten i årets estimat er på samme nivå som i fjor. Gytebestanden var dominert av 2016-årsklassen med 52 % i antall og 46 % i vekt. Sammenlignet med toktet i fjor var antallet av 2016-årsklassen redusert med 37 %. Mesteparten av gytebestanden befant seg vest av Lofoten og Vesterålen i år. Sammenlignet med tidligere år stod silda lenger nord og var mer konsentrert. Sammenlignet med toktet i fjor var silda kommet noe senere i modningsprosessen i år. I likhet med tidligere år så var det mer eldre sild i den sørlige delen av gyteområdet og silda i nord var yngre. Det anbefales å bruke estimatene av relativ mengde fra toktet i 2022 i ICES sin bestandsvurdering av norsk vårgytende sild.
Distribution and abundance of Norwegian spring-spawning herring during the spawning season in 2022
Report series:
Toktrapport 2022-2
ISSN: 1503-6294
Published: 28.03.2022
Cruise no.: 2022821 og 2022822
Project No.: 15706
Research group(s):
Pelagisk fisk
Subject:
Norsk vårgytende sild
Program:
Norskehavet
Approved by:
Research Director(s):
Geir Huse
Program leader(s):
Bjørn Erik Axelsen
Norsk sammendrag
Summary
During the period 14-27th of February 2022 the spawning grounds of Norwegian spring-spawning herring from Møre (62º15ˊN) to Troms (71ºN) were covered acoustically by the commercial vessels MS Eros and MS Vendla. The estimated biomass was about 18 % lower, and the estimated total number was about 29 % lower this year compared to the last year’s survey. The uncertainty of the estimates in 2022 was approximately equal to last year. The surveyed population of NSS herring was dominated by the 2016 year class; 52 % in numbers and 46 % in biomass. The 2016 year class was reduced by 37 % in numbers from last year’s survey. Most of the spawning stock was found outside Lofoten and Vesterålen this year, further north and more concentrated than usual. The observed maturity indicates a bit later spawning compared to last year and like last year a more northern spawning than normal. As usual, the herring in the southern part of the spawning area were older than those found in the northern part. The estimates of relative abundance from the survey in 2022 are recommended to be used in this year’s ICES stock assessment of Norwegian spring-spawning herring.
1 - Introduction
Acoustic surveys on Norwegian spring-spawning herring during the spawning season has been carried out regularly since 1988, with some breaks (in 1992-1993, 1997, 2001-2004 and 2009-2014). In 2015 the survey was initiated again partly based on the feedback from fishermen and fishermen’s organizations that IMR should conduct more surveys on this commercially important stock. Since then this survey, hereafter termed the NSSH spawning survey, has continued using hired commercial fishing vessels. In the ICES benchmark assessment of NSS herring in 2016 it was decided to use the data from this time series as input to the stock assessment, together with the ecosystem survey in the Norwegian Sea in May and catch data. Thus, the results from the NSSH spawning survey, have significant influence on the ICES catch advice.
The objective of the NSSH spawning survey 2022 was to continue the time series of abundance estimates, both mean estimates and uncertainty, for use in the ICES WGWIDE stock assessment. Moreover, other biological information about the surveyed spawning stock of Norwegian spring-spawning herring is also presented: spatial distribution of biomass and acoustic densities, total biomass and stock numbers with sample uncertainty, spatial patterns in age and maturity and variations in temperature.
2 - Material and methods
2.1 - Survey design
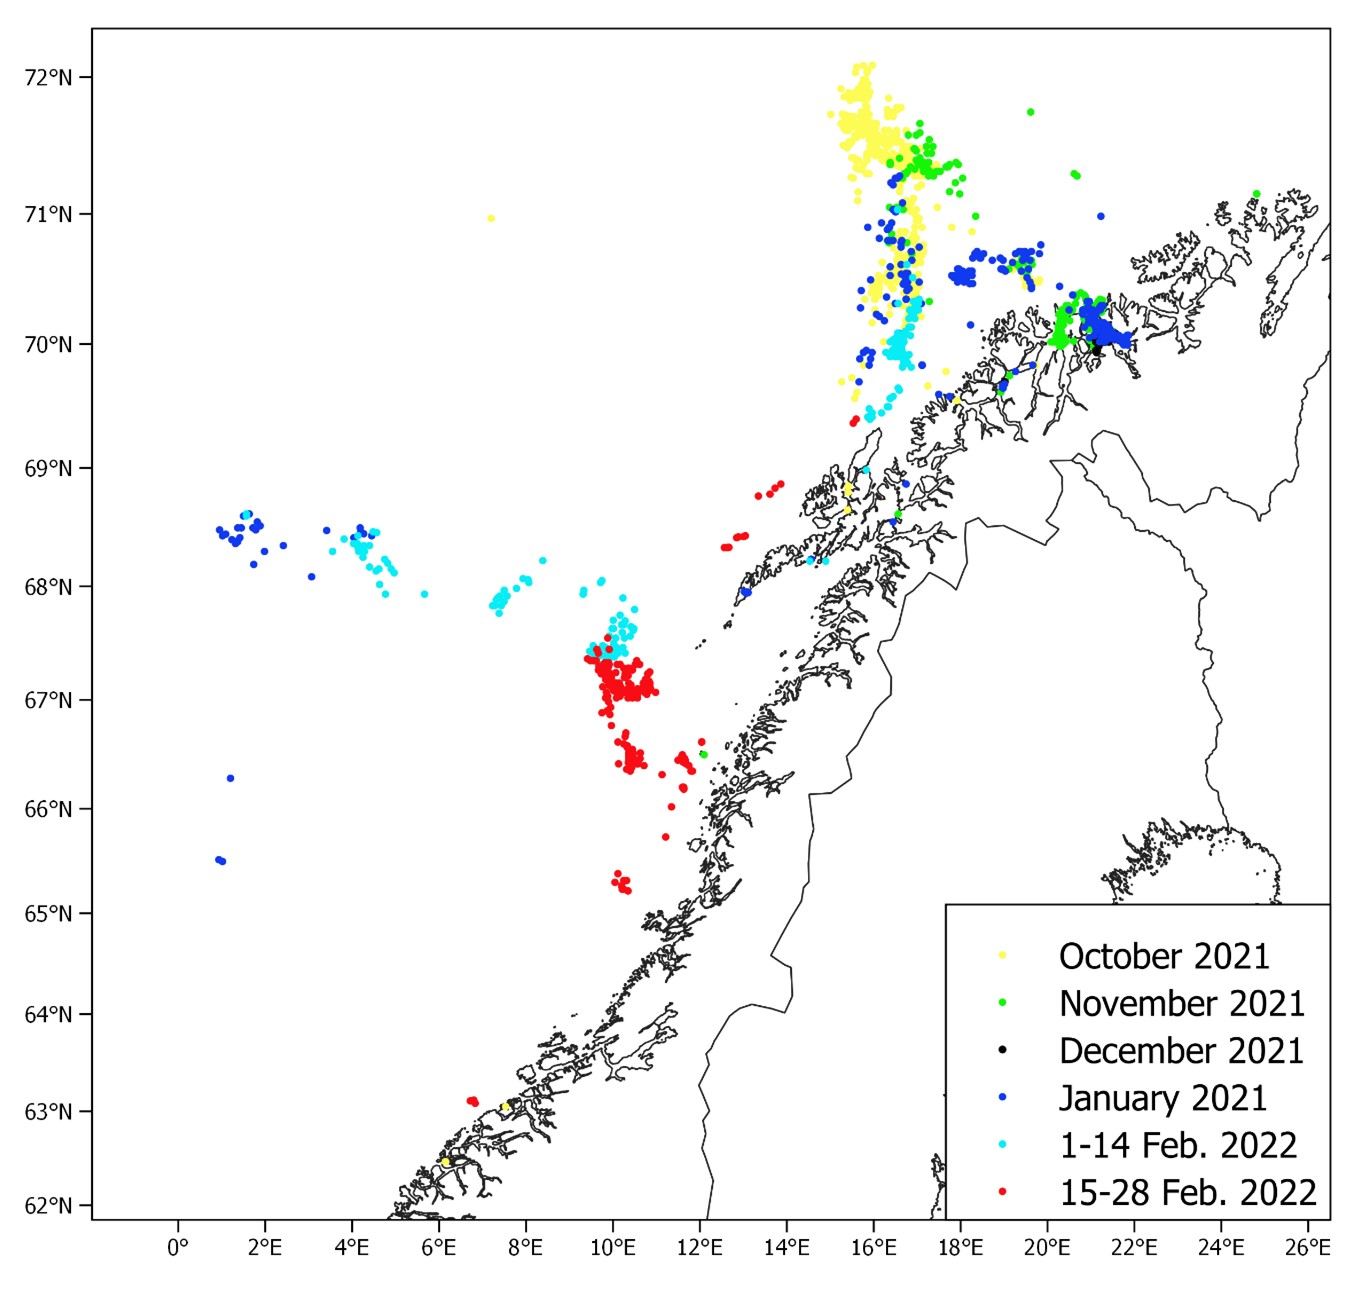
During the period 14-27th of February 2022 (same period as in 2017-2021) the spawning grounds from Møre (62º15ˊN) to Troms (71ºN) were covered acoustically by the commercial fishing vessels MS Eros and MS Vendla. The survey was planned based on information from the previous spawning cruises and the distribution of the herring fishery during the autumn 2021 up to the survey start February 14th 2022 (Figure 1). The fishery prior to the survey in 2022 indicated that the herring wintering in the Norwegian Sea were entering the coast in the Træna deep south of Røst as observed in previous years. However, unlike previous years the fishery did not move south of Røst before the survey started. Like in the last winter season an extensive fishery in October-February 2021/2022 occurred along the continental slope north of Andenes in addition to the fishery in the Kvænangen fjord area that also have been taking place the five previous years. Biological samples from catches from the northern fishery indicate that the 2016 year class dominated in this area. The survey coverage was therefore planned to also take account of a potentially large flux of herring entering the spawning area from the north. As seen from Figure 1, the fishery during the survey in 2022 mainly took place between Røst and Træna (66.3-67.4°N) which is farther north than usual at this time.
The survey design followed a standard stratified design (Jolly and Hampton 1990), where the survey area was stratified before the survey start according to the assumed density structures of herring during the spawning migration (based on previous surveys and fisheries). All strata except the northernmost one were covered with a zigzag design since this is the most efficient use of survey effort (Harbitz 2019). The survey planner function in the Rstox_1.11 package in r was used to generate the transects, and this function generates survey tracks with uniform coverage of strata and a random starting position in the start of each stratum. Each straight line in the zigzag track within a stratum was considered as a transect and a primary sampling unit (Simmonds and MacLennan 2005). Transit tracks between strata, i.e. from the end of the zigzag in one stratum to the start of the zigzag in the next stratum, were not used as primary sampling units. At the start of the survey in 2022 the fishing fleet was located west of Røst and it was estimated that the fleet had moved south to the Træna area around 66.5°N when the survey entered this area. Hence, the survey coverage (see Aglen 1989) was planned to be relatively low south of 65°N since it was assumed that the fishing fleet followed the front of the herring migrating south and that the abundance of herring south of the fleet therefore was insignificant.
2.2 - Biological sampling
Trawl sampling was planned to be carried out on a regular basis during the survey to confirm the acoustic observations and to be able to give estimates of abundance for different size and age groups. Both vessels used a Multpelt 832 scientific sampling trawl with small meshed (20 mm) inner net in the codend and a slit (so called “splitt”) close to the codend to avoid too large catches. The following variables of individual herring were analysed from each station with herring catch: total weight in grams and total length in cm (rounded down to the nearest 0.5 cm) of up to 100 individuals per sample. In addition, age from scales, sex, maturity stage, stomach fullness and gonad weight in grams were measured in up to 50 individuals per sample. Some genetic samples and otoliths were also collected to be used in later research projects.
2.3 - Additional data collection
CTD casts (using Seabird 911 systems) were taken by both vessels, spread out haphazardly in the survey area. ADCP data was recorded on Eros as described in Annex 2 in Salthaug et al. (2020). These data will later be used to analyse swimming speed and direction of herring below the vessel.
2.4 - Acoustic data processing
Echosounder data from the 38 kHz transducers was, as usual, the basis for measurement of fish density. The software LSSS version 2.12.0 was use for post-processing. Echogram scrutinization was carried out by the cruise leader and the chief instrument officer. Data was partitioned into the following categories: “herring”, “other” and “air bubbles” (upper 20 meters from the transducer near field).
2.5 - Abundance estimation methods
The acoustic density values were stored by species category in nautical area scattering coefficient (NASC) [m2 n.mi.-2 ] units (MacLennan et al. 2002) in a database with a horizontal resolution of 0.1 nmi and a vertical resolution of 10 m, referenced to the sea surface. To estimate the mean and variance of NASC, we use the methods established by Jolly and Hampton (1990) and implemented in the software Stox version 3.3 (Johnsen et al. 2019). The primary sampling unit is the sum of all elementary NASC samples of herring along the transect multiplied with the resolution distance. The transect ( t ) has NASC value ( s) and distance length L . The average NASC (S) in a stratum ( i ) is then:
 (1)
(1)
where  (t= 1,2,.. ni) are the lengths of the ni sample transects, and
 (2)
(2)
The final mean NASC is given by weighting by stratum area, A;
 (3)
(3)
Variance by stratum is estimated as:
 with
with  (4)
(4)
Where (t= 1,2,.. ni) are the lengths of the ni sample transects.
The global variance is estimated as
 (5)
(5)
The global relative standard error of NASC
 (6)
(6)
where N is number of strata.
In order to verify acoustic observations and to analyse year class structure over the surveyed area, trawling was carried out regularly along the transects. All trawl stations with herring were used to derive a common length distribution for all transect within the respective strata. All stations had equal weight.
Relative standard error by number of individuals by age group was estimated by combining Monto Carlo selection from estimated NASC distributions by stratum with bootstrapping techniques of the assigned trawl stations.
The acoustic estimates presented in this report use the 38 kHz NASC, and the mean was calculated for data scrutinized as herring and collected along the transects (acoustic recordings taken during trawling, and for experimental activity are excluded). The number of herring ( N ) in each length group ( l ) within each stratum ( i ) is then computed as:

Where

is the ”acoustic contribution” from the length group Ll to the total energy and <si>is the mean nautical area scattering coefficient [m2/nmi2] (NASC) of the stratum. A is the area of the stratum [nmi2] and σ is the mean backscattering cross section at length Ll . The conversion from number of fish by length group ( l) to number by age is done by estimating an age ratio from the individuals of length group (l) with age measurements. Similar, the mean weight by length and age grouped is estimated.
The mean target strength (TS) is used for the conversion where σ = 4π 10(TS/10) is used for estimating the mean backscattering cross section. Traditionally, TS = 20logL – 71.9 (Foote 1987) has been used for mean target strength of herring during the spawning surveys, however, several papers question this mean target strength. Ona (2003) describes how the target strength of herring may change with changes with depth, due to swimbladder compression. He measured the mean target strength of herring to be TS = 20logL – 2.3 log(1 + z/10) – 65.4 where z is depth in meters. Given that previous surveys were estimated using Foote (1987), the estimation this year was also done with this TS, for direct comparison and possible inclusion in the stock assessment by ICES WGWIDE 2021 as another year in the time series.
3 - Results and discussion
3.1 - Survey coverage
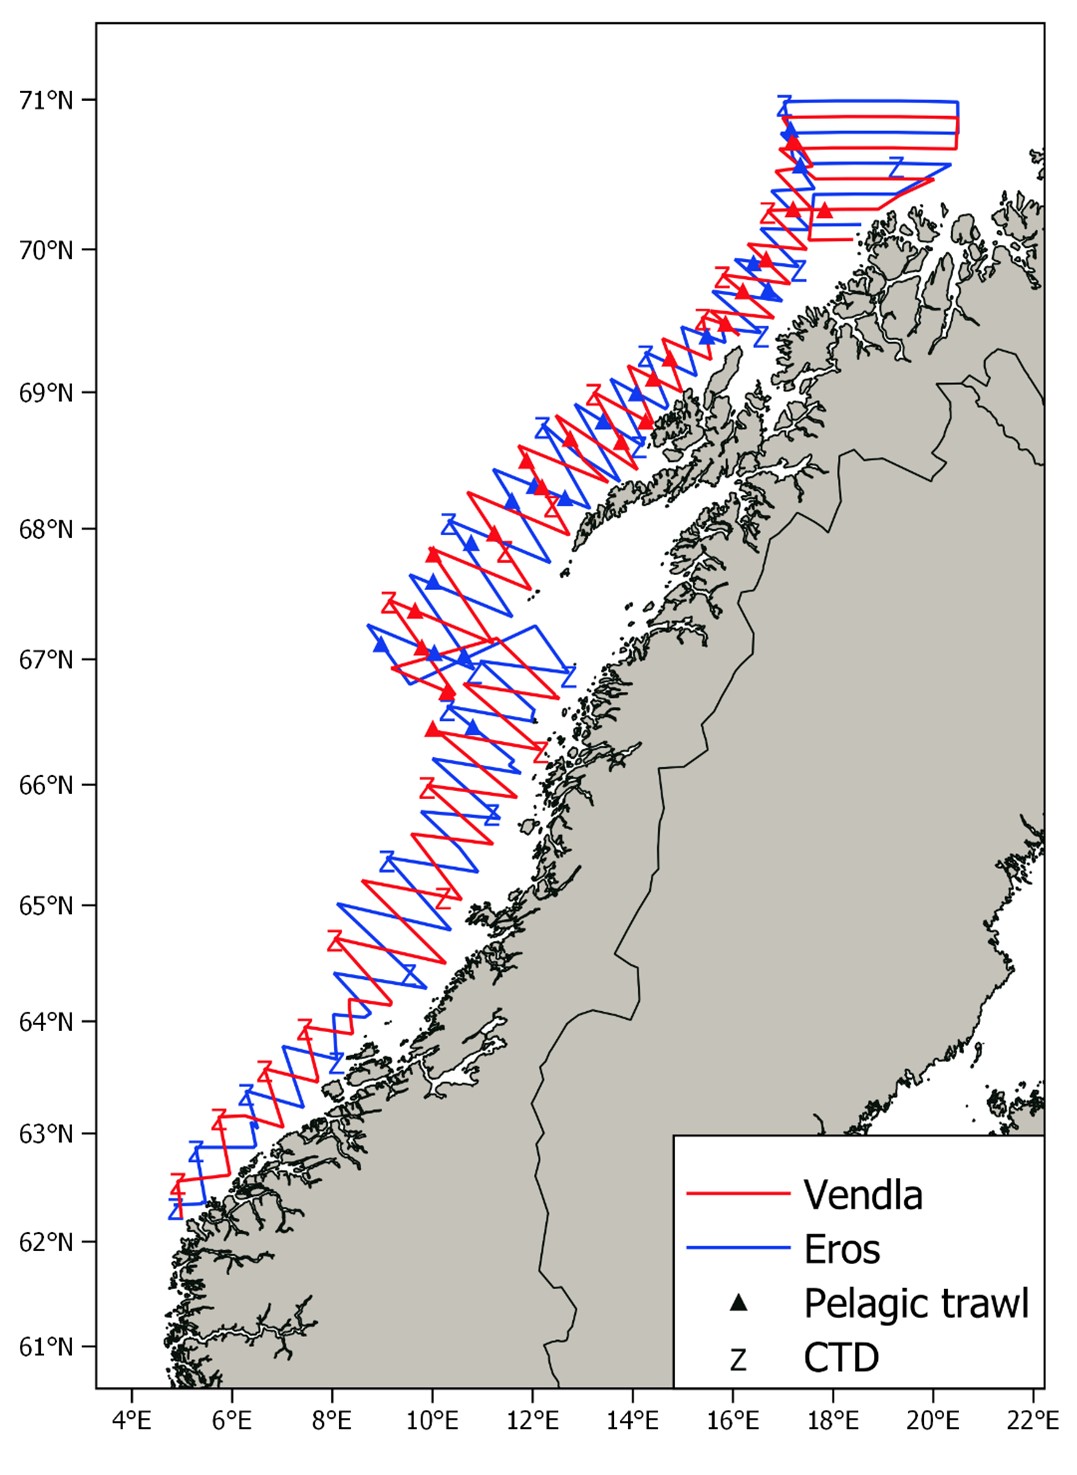
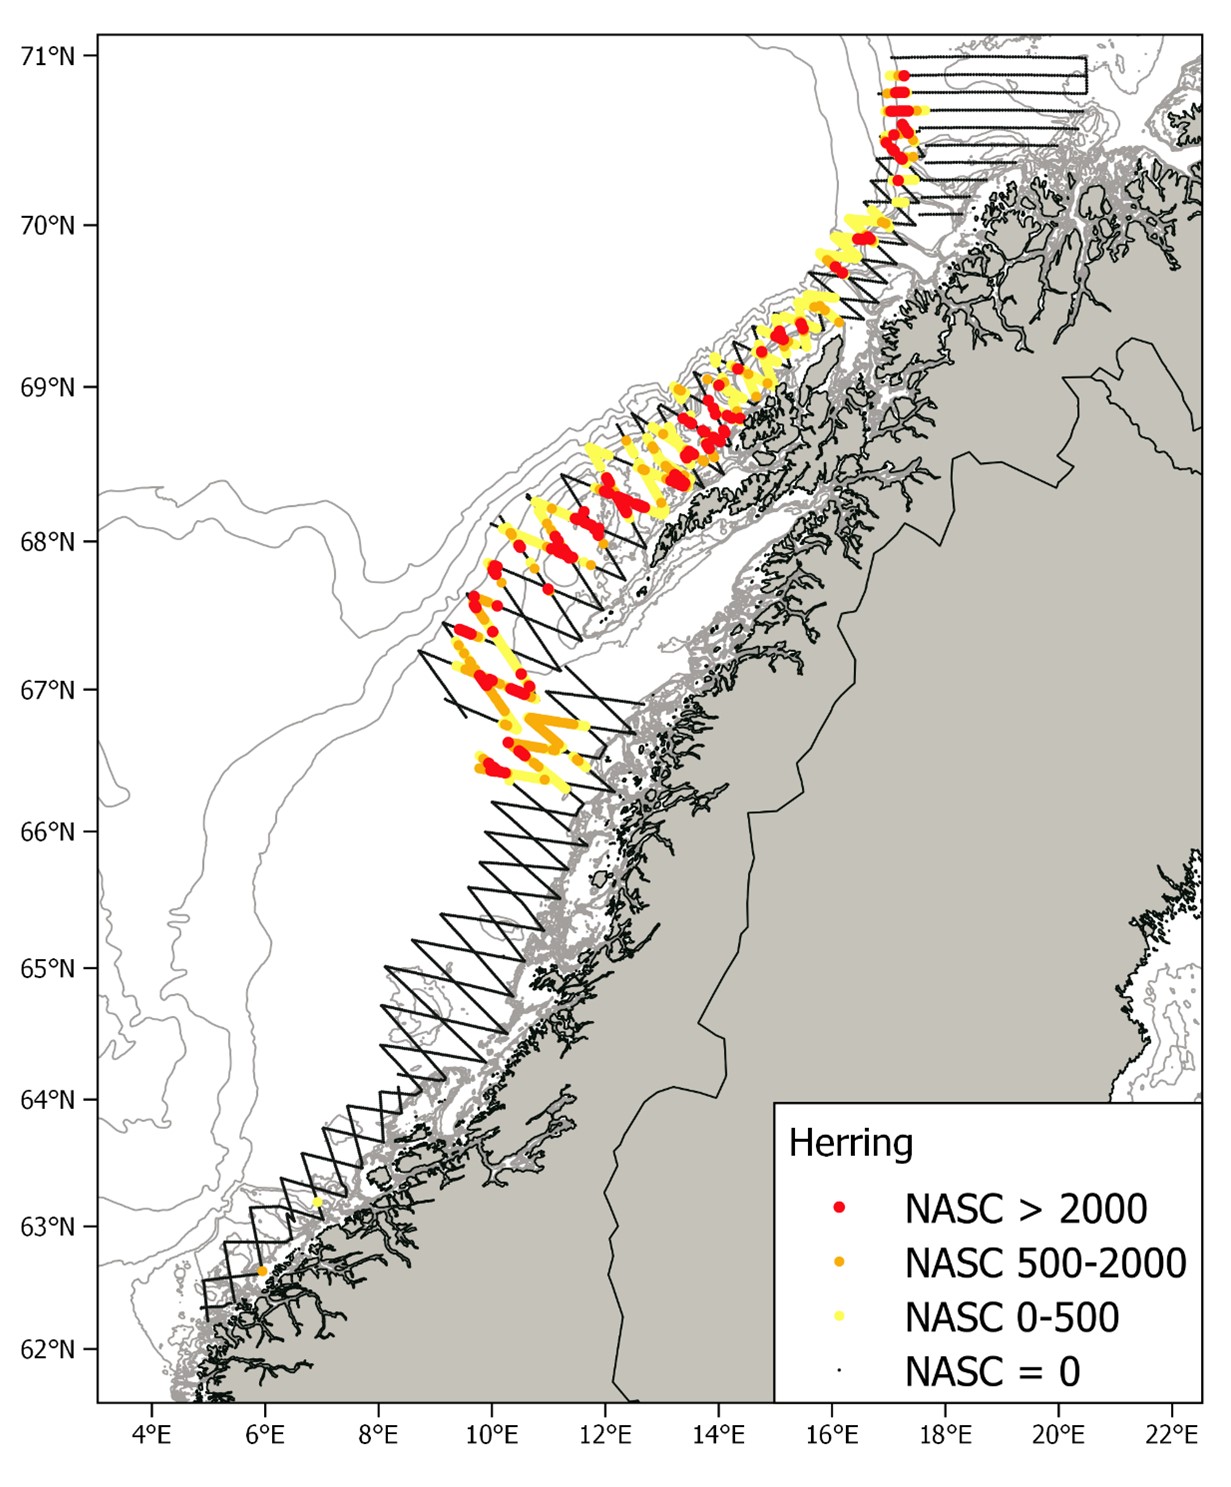
The cruise tracks of the NSSH spawning survey in 2022, together with pelagic trawl stations and CTD stations are shown in Figure 2. As mentioned above, the coverage south of 65°N was fairly low since we expected low abundance in this area, which turned out to be the case (see below). Thus, most of the available survey effort was used to carry out dense coverage of the strata north of 65°N. The survey coverage (see Aglen 1989) of the first three strata was 5, 7 and 9 respectively (starting from south) and 11 in the four next strata with zigzag transects. The northernmost stratum with parallel transects had a survey coverage of 9. Pelagic trawl hauls were carried out regularly (Fig. 2) in the areas where herring like marks were observed on the echo sounder, to confirm the acoustic observations based on species composition in the catch and to obtain biological samples like size, maturity stage and age of herring. A total of 34 CTD casts were carried out in the surveyed area (Fig. 2). Nautical area scattering coefficients (NASC) allocated to herring from acoustic transects by each nautical mile are shown in Figure 3. Significant herring marks on the echosounders started to occur slightly north of 66°N, which is unusually far north in mid-February, and herring was observed in the entire area north of this. South of Lofoten the herring was mainly distributed around the shelf edge of the Røst bank, but outside Lofoten and Vesterålen herring was also observed on the banks nearer land. North of Vesterålen the herring was distributed along the shelf edge as usual, and the zero-line was established in the north around 70.9°N. Capelin marks started to appear around 69.7°N (confirmed by trawl samples) and was observed regularly north of this, in particular around the shelf edge area in the northernmost part. The herring schools appeared to be deeper and clearly separated from the more shallow capelin schools, an observation that the trawl sampling also supported. No more capelin results are presented in this report as the focus is on herring.
3.2 - Estimates of abundance
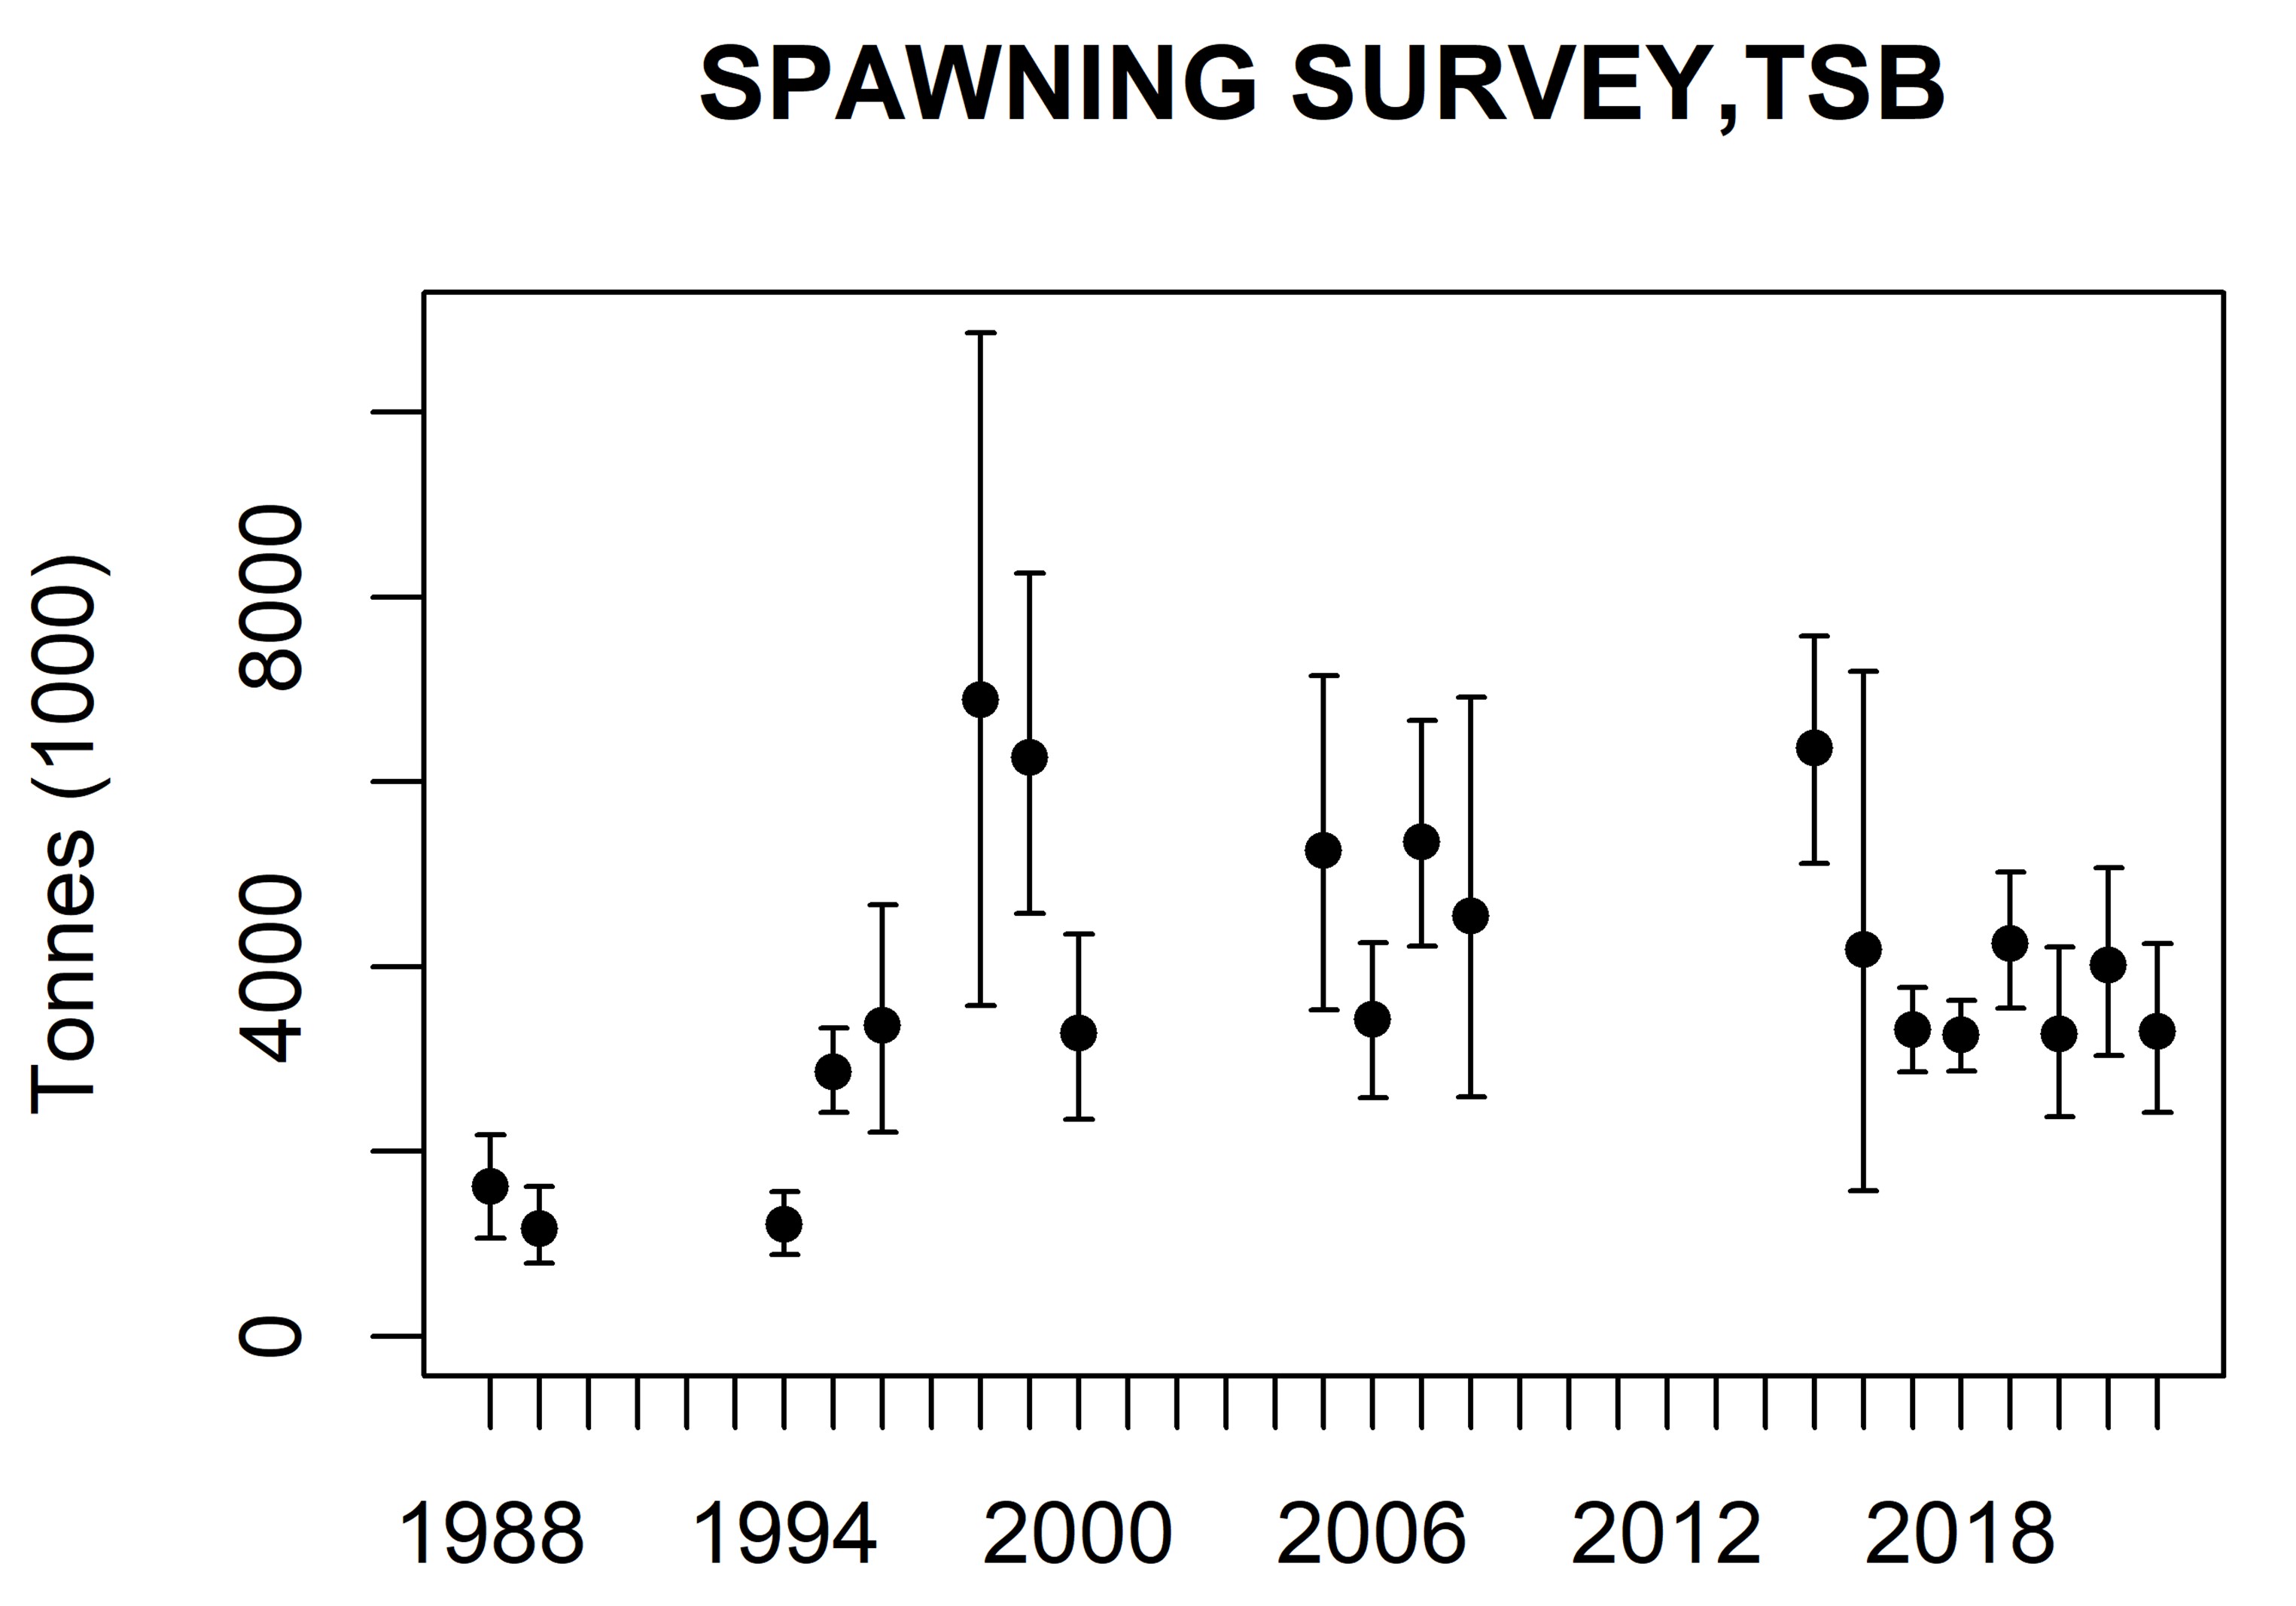
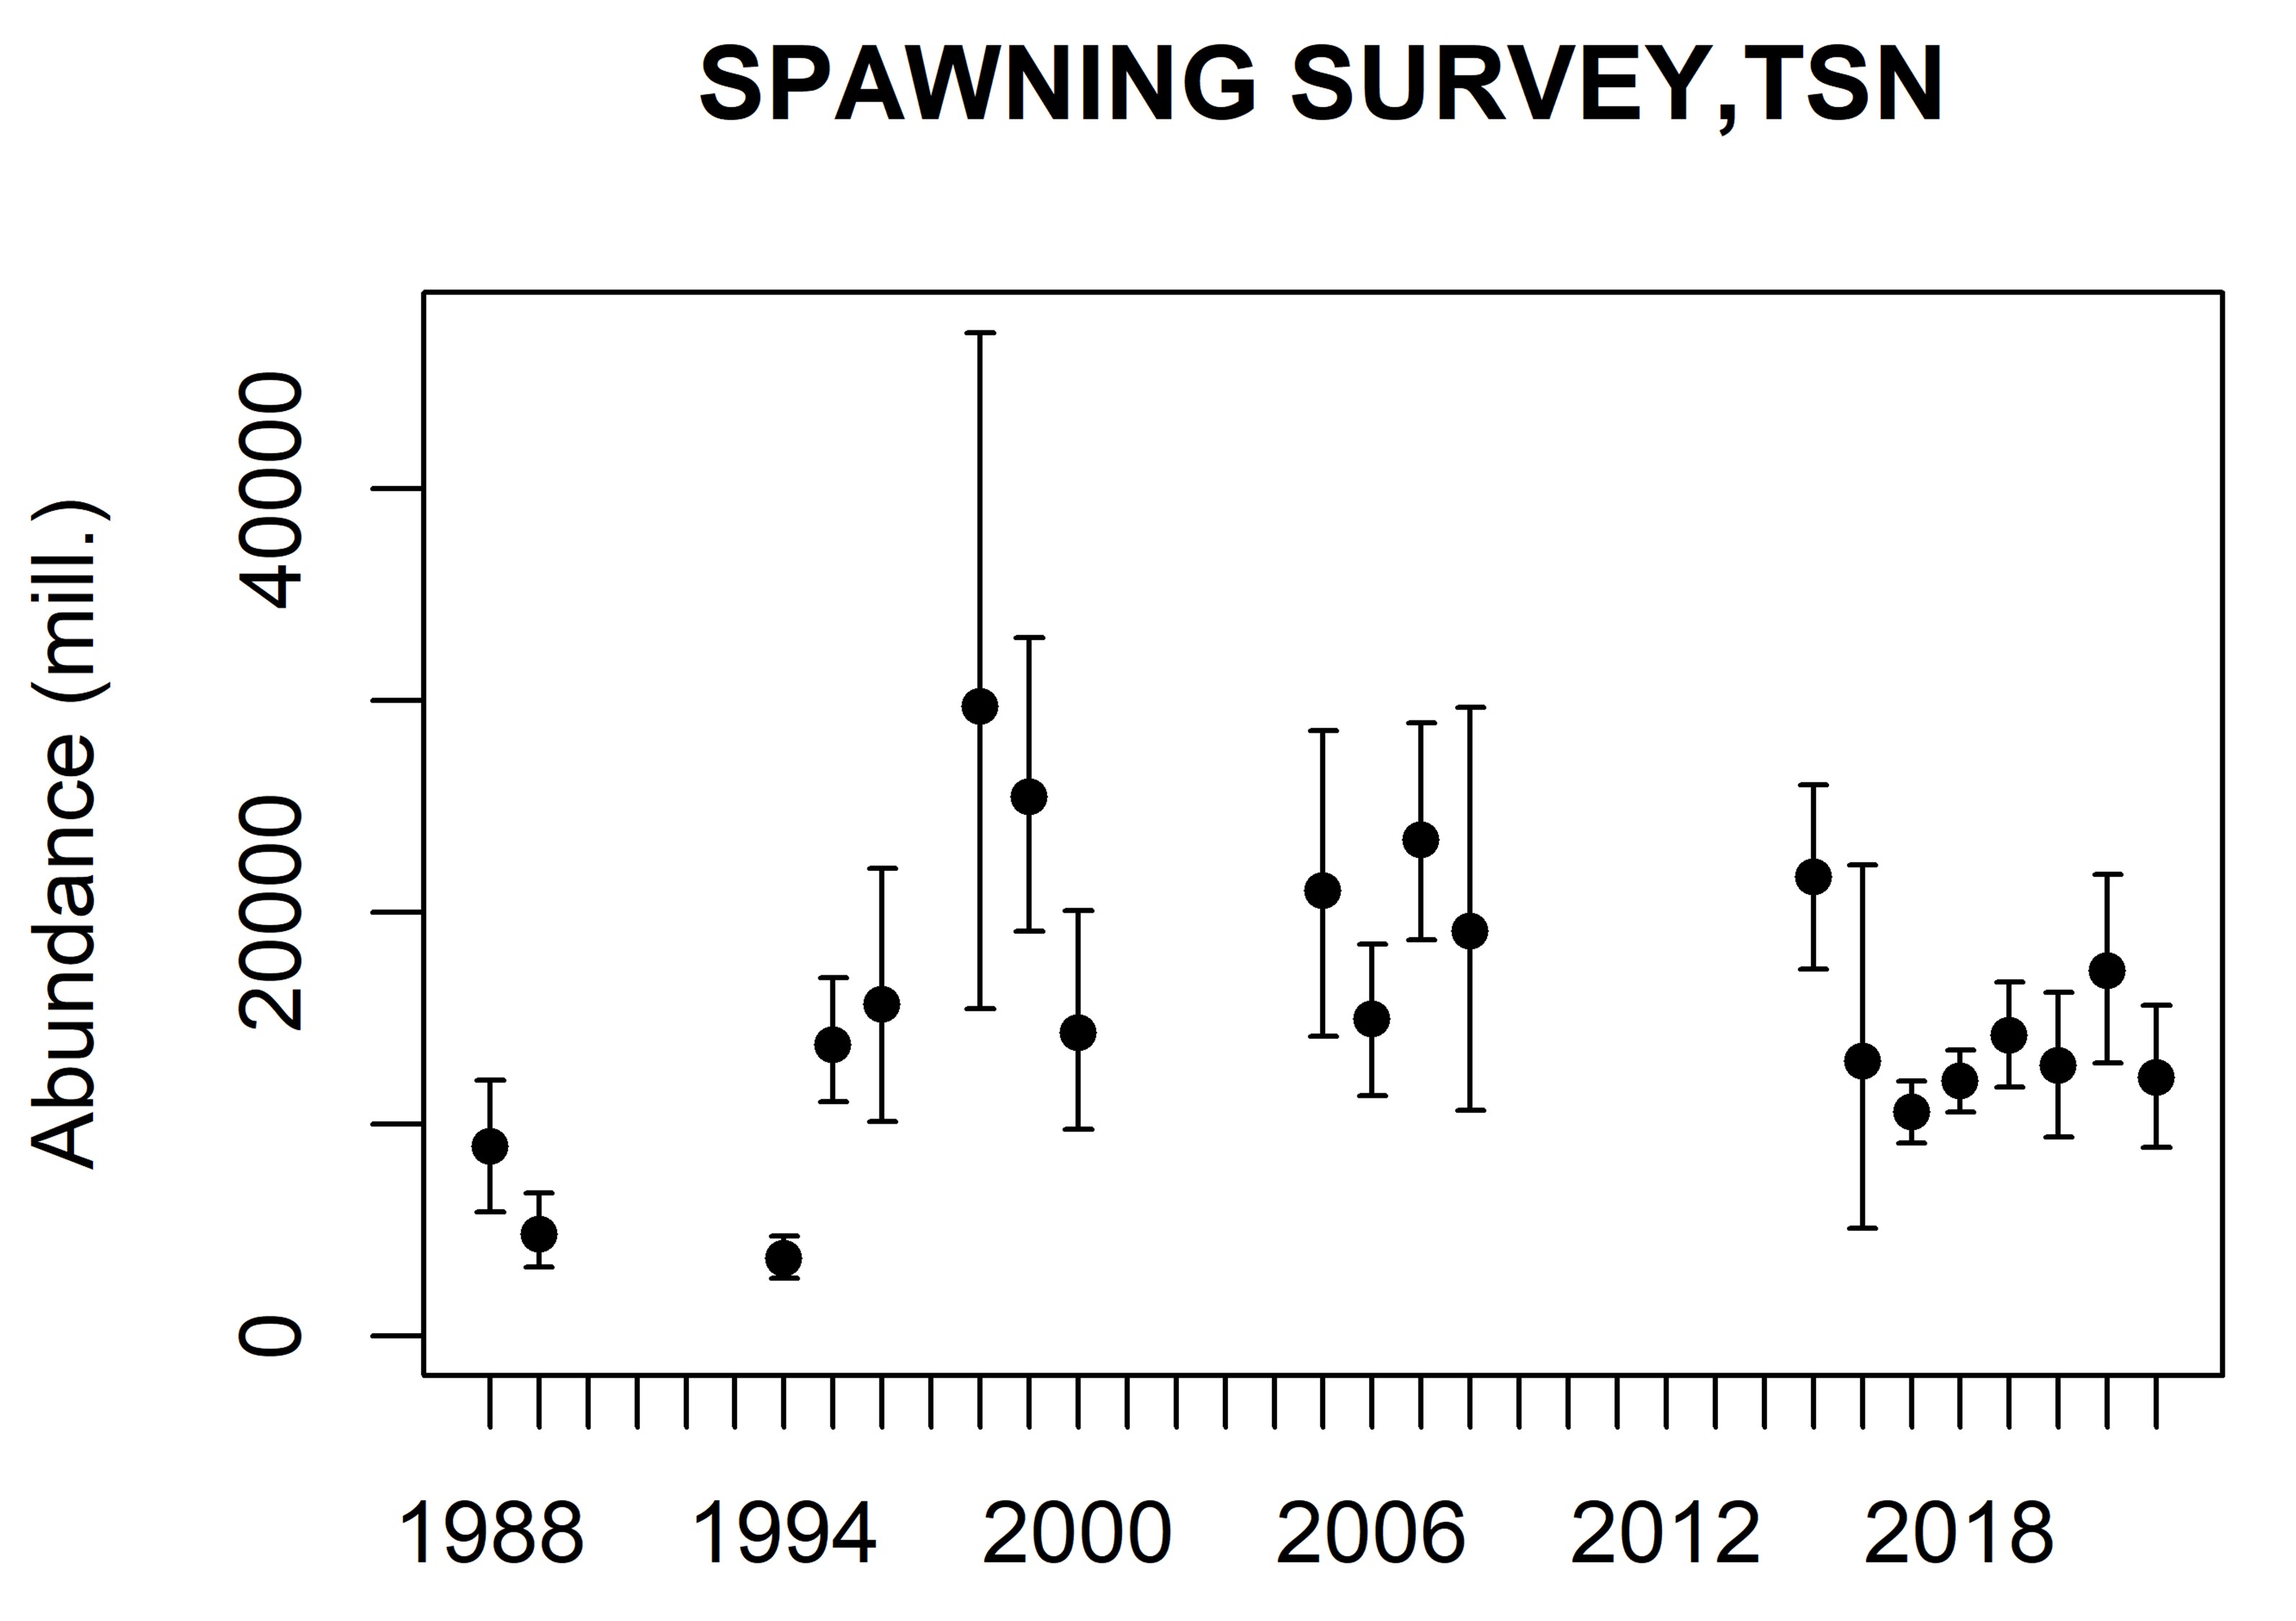
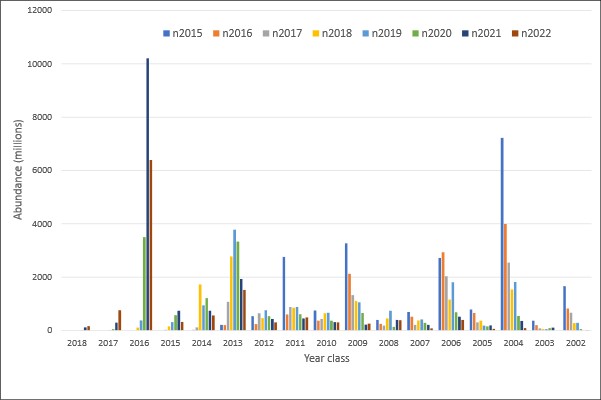
The abundance estimates from this survey are viewed as relative, i.e. as indices of abundance, since there are highly uncertain scaling parameters like acoustic target strength and compensation for herring migrating in the opposite direction of the survey. The abundance estimates are shown in Table 1 and 2. The 2016 year class (age 6) dominated both in numbers (52 %) and biomass (46 %), followed by the 2013 year class (age 9) which contributed 12 % in numbers and 15 % in biomass. Compared with the point estimates from last year (see Salthaug et al. 2021) the 2016 year class was reduced by 37 % in numbers and the 2013 year class by 22 %. The point estimate of total stock biomass (TSB) in the survey area was 3.302 million tons which is 18 % lower than last year’s estimate (mean of 1000 bootstrap replicates). The time series of total stock biomass from the survey is shown in Figure 4. The point estimate of total stock number (TSN) in the survey area was 12.2 billion which is 29 % lower than last year’s estimate. The time series of total stock number from the survey is shown in Figure 5. This year’s estimates of TSB and TSN are slightly below the respective means of the time series. The relative standard error (CV) of the TSB and TSN estimates in 2021 are both 17 % (Tab. 1 and 2). These estimates of sample uncertainty are quite similar to those from the two previous surveys. The CV per age (Tab.1 and 2) shows the normal pattern with high uncertainty for the very young and old year classes and moderate (20-30 %) for the most abundant ages in the survey. Figure 6 shows estimates of number per year class in the eight most recent surveys. The estimated numbers from the survey in 2022 seems to decline as excepted for the year classes that are fully recruited to the survey. In addition, like in the most recent surveys the 2016 and 2013 year classes are estimated to be the most abundant which shows that this survey is internally consistent. Mean weight and length from the 2021 spawning survey are shown in Table 3. The Stox project used to calculate abundance and related parameters is openly available and can be found here:
http://metadata.nmdc.no/metadata-api/landingpage/2870f9f21da64f3a01641dfe12512b33
3.3 - Spatial distribution of the stock
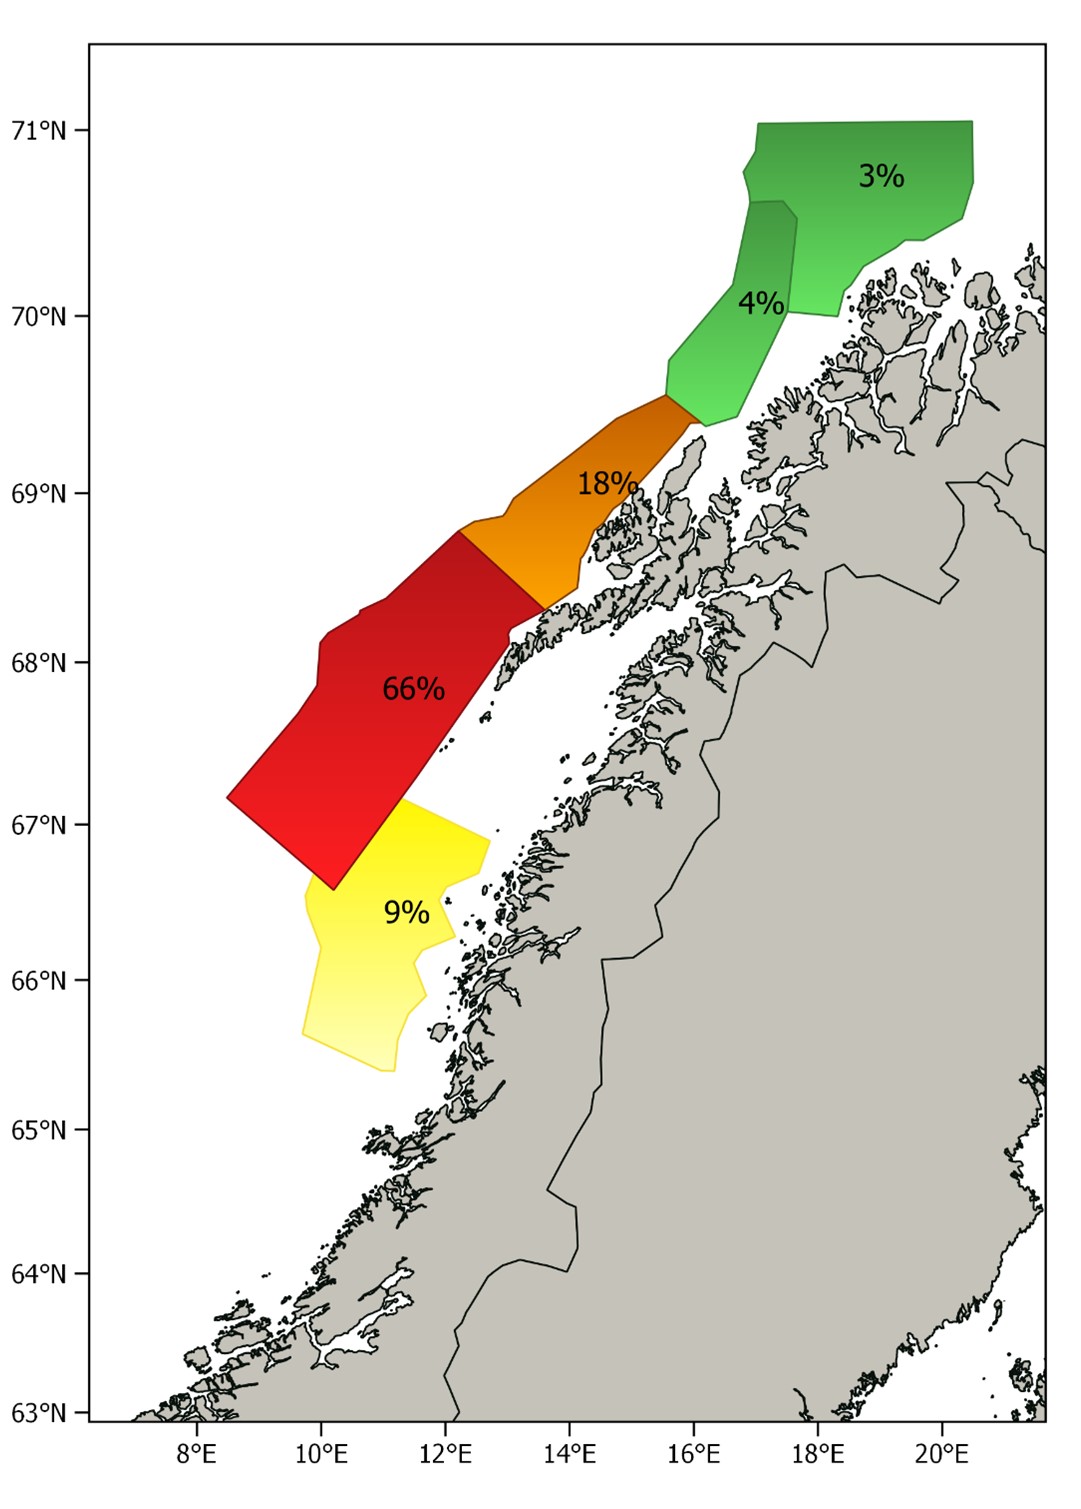
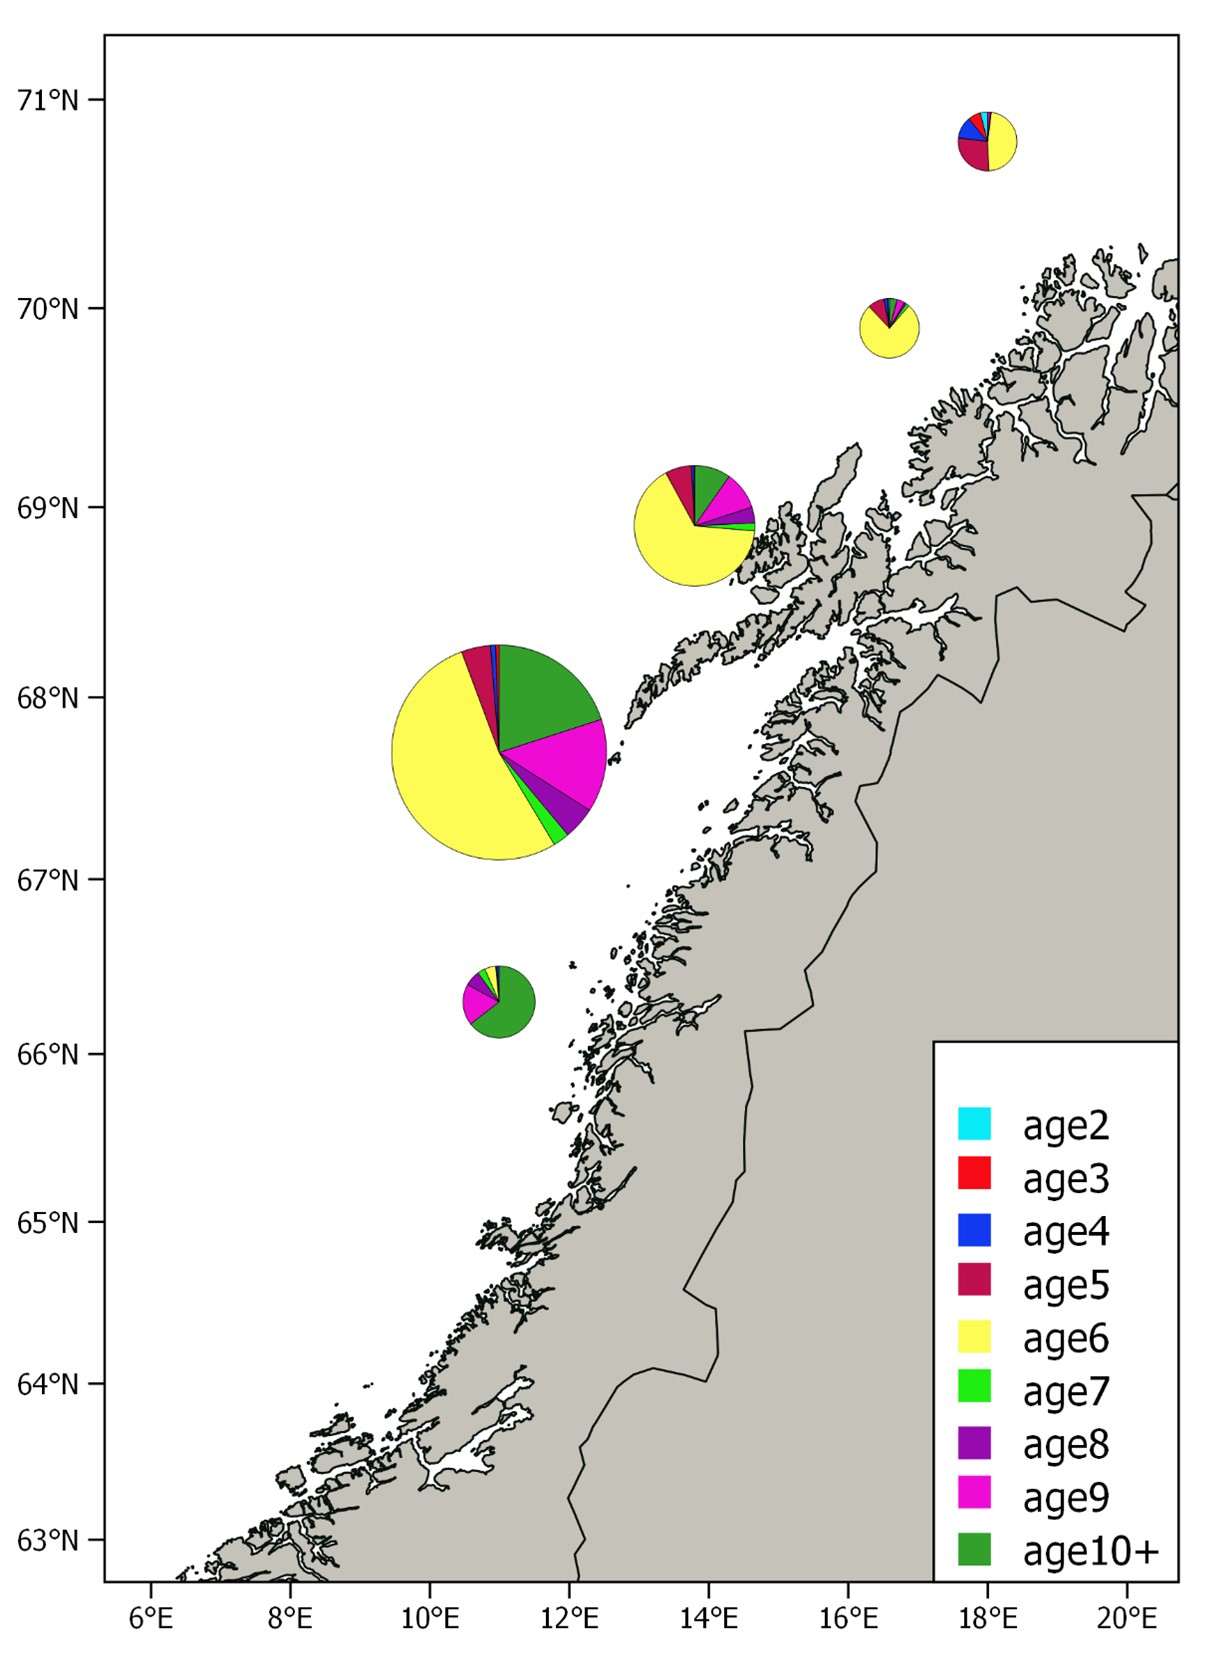
The relative distribution of the estimated biomass per stratum is shown in Figure 7. This year most of the biomass (84%) was found in the two strata west of Lofoten and Vesterålen, while only a small fraction was found in the strata to the north and south of these. The spawning stock was much more concentrated and further north than usual this year. Age compositions per stratum are shown in Figure 8. The southernmost stratum where herring was recorded was dominated by herring older than eight years, which is consistent with earlier observations; the largest and oldest fish are in the front of the spawning migration. The 2016 year class dominated in the rest of the strata, and the proportion of younger herring was as usual highest in the north.
The pattern with large and old fish in the southern part of the spawning area and younger and older herring in the north has been thoroughly discussed in Slotte and Dommasnes, 1997, 1998, 1999, 2000; Slotte, 1998b; Slotte, 1999a, Slotte 2001, Slotte et al. 2000, Slotte & Tangen 2005, 2006). The main hypothesis is that this could be due to the high energetic costs of migration, which is relatively higher in small compared to larger fish (Slotte, 1999b). Large fish and fish in better condition will have a higher migration potential and more energy to invest in gonad production and thus the optimal spawning grounds will be found farther south (Slotte and Fiksen, 2000), due to the higher temperatures of the hatched larvae drifting northwards and potentially better timing to the spring bloom (Vikebø et al. 2012).
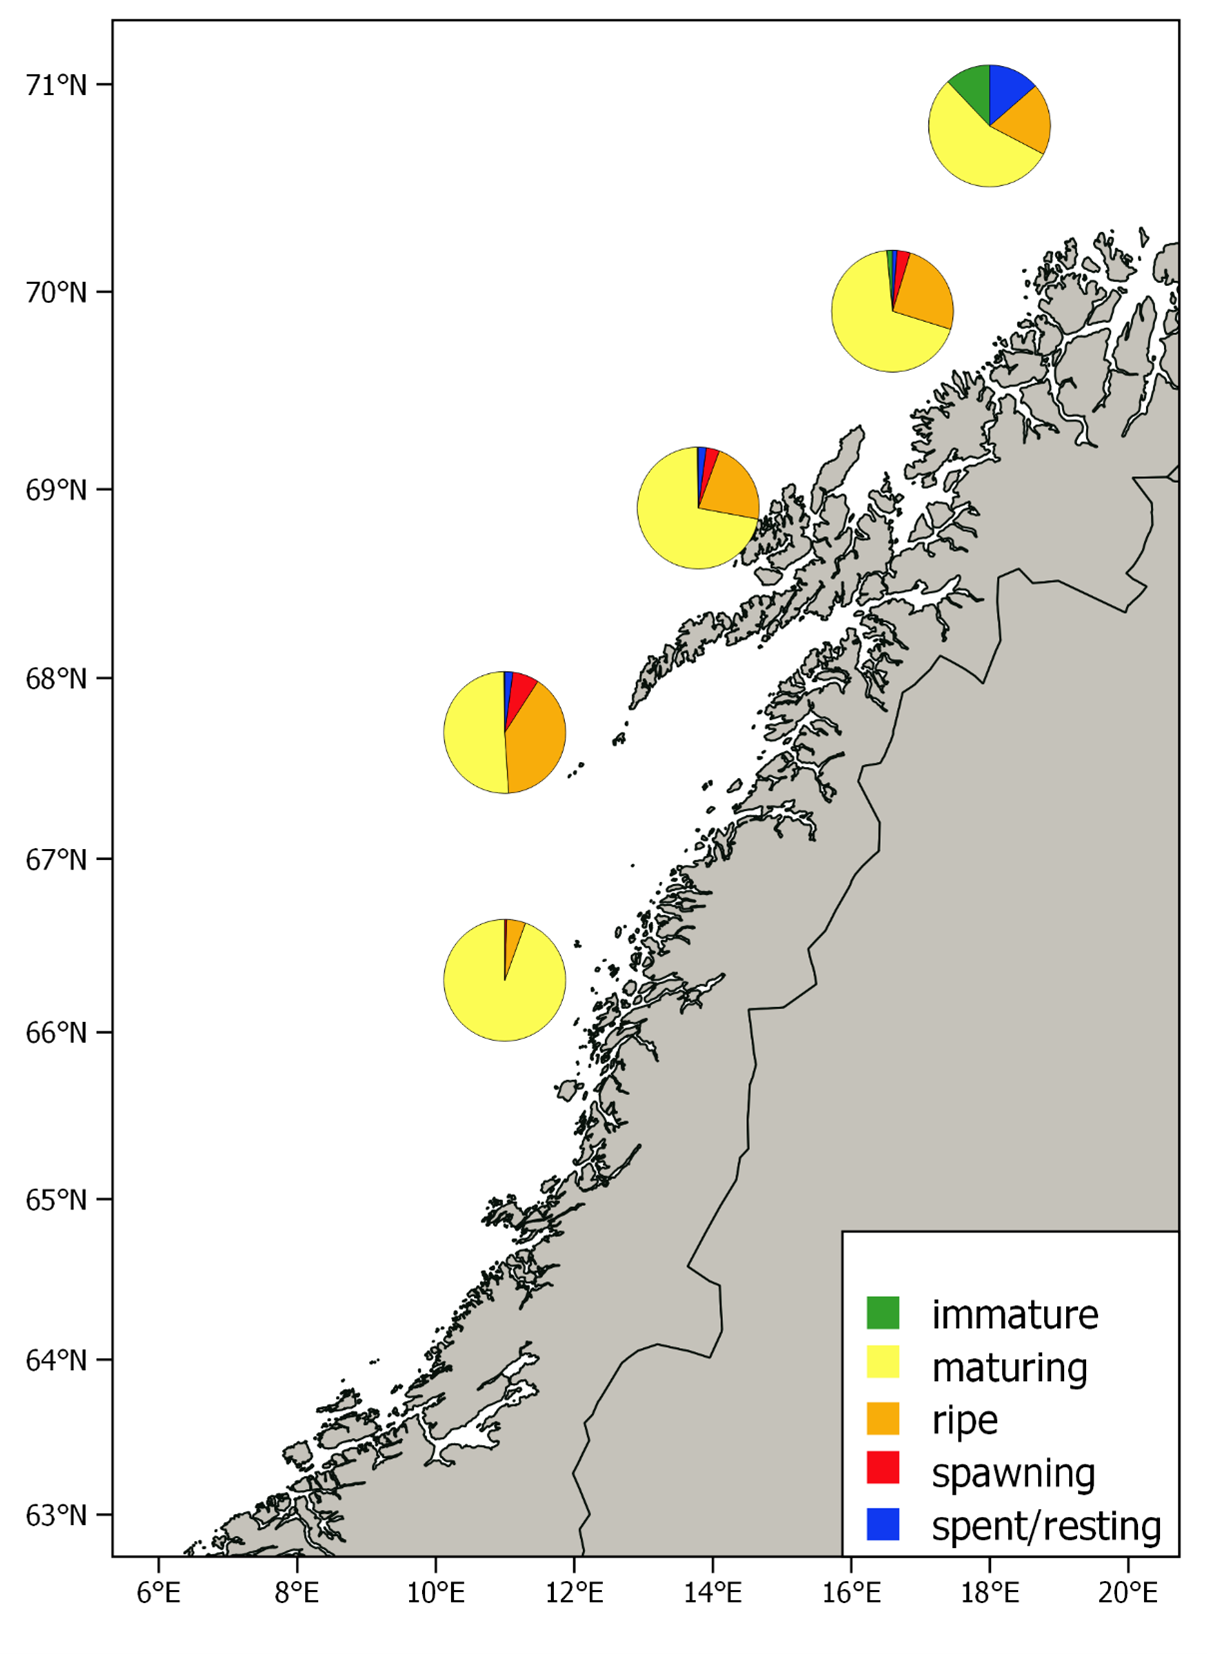
Figure 9 shows the proportion of different maturation stages in each stratum. Most of the herring was classified as maturing or ripe, and the proportions of maturing herring were larger than last year which indicates later spawning this year. The old herring in the southernmost stratum was dominated by maturing individuals indicating that these fish would swim further south before spawning. The fishery also indicated that this was the case since catches moved further south after the survey covered the area (see Fig. 1). A small fraction of the herring outside Lofoten and Vesterålen were spawning and this, together with the large proportion of ripe individuals, indicate that much of the 2016 year class spawned in this area. Like last year this shows a very northern spawning this year, which also was confirmed through the fishery that was very low at the historically important spawning grounds off Møre.
3.4 - Geographical variation in temperatures experienced by the herring
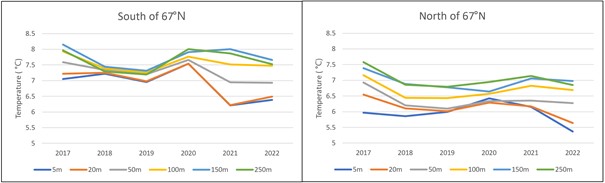
Temperatures experienced by herring from close to the surface and down to 250 m are shown in Figure 10 for the areas south and north of 67ºN, for the years after 2016 when the survey has been carried out in the same period (latter half of February). The temperatures in 2022 varied from 7.7°C at 250 m depth south of 67 ∞ N to 5.4°C at 5 m depth north of 67ºN. The temperatures near the surface were quite low this year, and also varied more with depth compared to earlier years. At typical spawning depths of herring at 100-200 m depth, the temperature conditions were quite similar to those observed during the most recent NSSH spawning surveys.
3.5 - Quality of the survey
In 2022 both vessels were equipped with multifrequency equipment on a drop keel. The weather conditions were exceptionally good this year so that acoustic data with good quality was recorded and trawling on registrations could be carried out all of the time. No correction for air bubble attenuation (as described in Annex 3 in Slotte et al. 2019) had to be carried out this year due to the nice weather. As opposed to last year the zero line was clearly established in the north, and we are not aware of any observations that indicates presence of mature NSS herring outside the survey area during the survey this year. To conclude, the acoustic and biological data recorded in 2022 on the NSSH spawning survey were of satisfactory quality and the estimates from the survey are recommended to be used in the stock assessment of Norwegian spring-spawning herring in 2022.
4 - References
Aglen, A. 1989. Empirical results on precision effort relationships for acoustic surveys. Int. Coun. Explor. Sea CM 1989 B:30, 28pp.
Demer, D.A., Berger, L., Bernasconi, M., Bethke, E., Boswell, K., Chu, D., Domokos, R., et al . 2015. Calibration of acoustic instruments. ICES Cooperative Research Report No. 326. 133 pp.
Foote, K. 1987. Fish target strengths for use in echo integrator surveys. J. Acoust. Soc. Am. 82 : 981-987.
Harbitz, A. 2019.A zigzag survey design for continuous transect sampling with guaranteed equal coverage probability. Fisheries Research 213, 151-159.
Johnsen, E., Totland, A., Skålevik, Å., Holmin, A.J., Dingsør, G.E., Fuglebakk, E., Handegard, N.O. 2019. StoX: An open source software for marine survey analyses. Methods in Ecology and Evolution 10:1523–1528.
Jolly, G.M., and Hampton, I. 1990. A stratified random transect design for acoustic surveys of fish stocks. Canadian Journal of Fisheries and Aquatic Sciences 47: 1282-1291.
Korneliussen, R. J., and Ona, E. 2002. An operational system for processing and visualizing multi-frequency acoustic data. ICES Journal of Marine Science, 59: 293–313.
Korneliussen, R. J., Ona, E., Eliassen, I., Heggelund, Y., Patel, R., Godø, O.R., Giertsen, C., Patel, D., Nornes, E., Bekkvik, T., Knudsen, H.P., Lien, G. The Large Scale Survey System - LSSS. Proceedings of the 29th Scandinavian Symposium on Physical Acoustics, Ustaoset 29 January– 1 February 2006.
MacLennan, D.N., Fernandes, P., and Dalen, J. 2002. A consistent approach to definitions and symbols in fisheries acoustics. ICES J. Mar. Sci., 59: 365-369.
Ona, Egil. 1999.An expanded target-strength relationship for herring." ICES Journal of Marine Science: Journal du Conseil 60: 493-499.
Ona, E. (Ed). 1999. Methodology for target strength measurements (with special reference to in situ techniques for fish and mikro-nekton. ICES Cooperative Research Report No. 235. 59 pp.
Simmonds, J, and David N. MacLennan. 2005. Fisheries acoustics: theory and practice . John Wiley & Sons, 2008.
Slotte, A. 1998 a . Patterns of aggregation in Norwegian spring spawning herring ( Clupea harengus L.) during the spawning season. ICES C. M. 1998/J:32.
Slotte, A. 1998 b . Spawning migration of Norwegian spring spawning herring ( Clupea harengus L.) in relation to population structure. Ph. D. Thesis, University of Bergen, Bergen, Norway. ISBN : 82-7744-050-2.
Slotte, A. 1999 a . Effects of fish length and condition on spawning migration in Norwegian spring spawning herring ( Clupea harengus L). Sarsia 84 , 111-127.
Slotte, A. 1999 b . Differential utilisation of energy during wintering and spawning migration in Norwegian spring spawning herring. Journal of Fish Biology 54 , 338-355.
Slotte, A. 2001. Factors Influencing Location and Time of Spawning in Norwegian Spring Spawning Herring: An Evaluation of Different Hypotheses. In: F. Funk, J. Blackburn, D. Hay, A.J. Paul, R. Stephenson, R. Toresen, and D. Witherell (eds.), Herring: Expectations for a New Millennium. University of Alaska Sea Grant, AK-SG-01-04, Fairbanks, pp. 255-278.
Slotte, A. and Dommasnes, A. 1997. Abundance estimation of Norwegian spring spawning at spawning grounds 20 February-18 March 1997. Internal cruise reports no. 4. Institute of Marine Research, P.O. Box. 1870. N-5024 Bergen, Norway.
Slotte, A. and Dommasnes, A. 1998. Distribution and abundance of Norwegian spring spawning herring during the spawning season in 1998. Fisken og Havet 5, 10 pp.
Slotte, A. and Dommasnes, A. 1999. Distribution and abundance of Norwegian spring spawning herring during the spawning season in 1999. Fisken og Havet 12 , 27 pp.
Slotte, A and Dommasnes, A. 2000. Distribution and abundance of Norwegian spring spawning herring during the spawning season in 2000. Fisken og Havet 10 , 18 pp.
Slotte, A. and Fiksen, Ø. 2000. State-dependent spawning migration in Norwegian spring spawning herring ( Clupea harengus L.). Journal of Fish Biology 56 , 138-162.
Slotte, A. & Tangen, Ø. 2005. Distribution and abundance of Norwegian spring spawning herring in 2005. Institute of Marine Research, P. O. Box 1870 Nordnes, N-5817 Bergen (www.imr.no). ISSN 1503-6294/ Cruise report no. 4 2005.
Slotte, A. and Tangen, Ø. 2006. Distribution and abundance of Norwegian spring spawning herring in 2006. Institute of Marine Research, P. O. Box 1870 Nordnes, N-5817 Bergen (www.imr.no). ISSN 1503-6294/ Cruise report no. 1. 2006.
Slotte, A, Johannessen, A and Kjesbu, O. S. 2000. Effects of fish size on spawning time in Norwegian spring spawning herring ( Clupea harengus L.). Journal of Fish Biology 56 : 295-310.
Slotte A., Johnsen, E., Pena, H., Salthaug, A., Utne, K. R., Anthonypillai, A., Tangen , Ø and Ona, E. 2015. Distribution and abundance of Norwegian spring spawning herring during the spawning season in 2015. Survey report / Institute of Marine Research/ISSN 1503 6294/Nr. 5 – 2015
Slotte, A., Salthaug, A., Utne, KR, Ona, E., Vatnehol, S and Pena, H. 2016. Distribution and abundance of Norwegian spring spawning herring during the spawning season in 2016. Survey report / Institute of Marine Research/ /ISSN 1503 6294/Nr. 17–2016
Slotte, A., Salthaug, A., Utne, KR, Ona, E . 2017. Distribution and abundance of Norwegian spring spawning herring during the spawning season in 2017. Survey report / Institute of Marine Research/ ISSN 15036294/Nr. 8 – 2017
Slotte A., Salthaug, A., Høines, Å., Stenevik E. K., Vatnehol, S and Ona, E. 2018. Distribution and abundance of Norwegian spring spawning herring during the spawning season in 2018. Survey report / Institute of Marine Research/ISSN 15036294/Nr. 5– 2018.
Slotte, A., Salthaug, A., Stenevik, E.K., Vatnehol, S. and Ona, E. 2019 Distribution and abundance of Norwegian spring spawning herring during the spawning season in 2019. Survey report / Institute of Marine Research/ISSN 15036294/Nr. 2– 2019.
Salthaug, A., Stenevik, E.K., Vatnehol, S., Anthonypillai, V., Ona, E. and Slotte, A. Distribution and abundance of Norwegian spring spawning herring during the spawning season in 2020. Survey report / Institute of Marine Research/ISSN 15036294/Nr. 3– 2020.
Salthaug, A., Stenevik, E.K., Vatnehol, S., Anthonypillai, V., and Slotte, A. Distribution and abundance of Norwegian spring spawning herring during the spawning season in 2021. Survey report / Institute of Marine Research/ISSN 15036294/Nr. 1– 2021.
Vikebø, F., Korosov, A., Stenevik, E.K., Husebø, Å. Slotte, A. 2012. Spatio-temporal overlap of hatching in Norwegian spring spawning herring and spring phytoplankton bloom at available spawning substrates – observational records from herring larval surveys and SeaWIFS . ICES Journal of Marine Science, 69: 1298-13
5 - Tables
| Age | 5th percentile | Median | 95th percentile | Mean | SD | CV |
| 2 | 1 | 23 | 62 | 27 | 19 | 0.72 |
| 3 | 13 | 71 | 134 | 72 | 36 | 0.50 |
| 4 | 51 | 154 | 310 | 162 | 78 | 0.48 |
| 5 | 406 | 738 | 1148 | 760 | 234 | 0.31 |
| 6 | 4473 | 6314 | 8475 | 6393 | 1256 | 0.20 |
| 7 | 205 | 308 | 458 | 317 | 76 | 0.24 |
| 8 | 377 | 557 | 788 | 563 | 126 | 0.22 |
| 9 | 1066 | 1500 | 2063 | 1515 | 298 | 0.20 |
| 10 | 174 | 294 | 458 | 301 | 89 | 0.30 |
| 11 | 303 | 477 | 707 | 486 | 122 | 0.25 |
| 12 | 175 | 297 | 439 | 301 | 79 | 0.26 |
| 13 | 137 | 247 | 393 | 255 | 80 | 0.31 |
| 14 | 206 | 380 | 584 | 385 | 119 | 0.31 |
| 15 | 37 | 71 | 122 | 73 | 26 | 0.36 |
| 16 | 227 | 384 | 602 | 395 | 117 | 0.30 |
| 17 | 18 | 52 | 109 | 57 | 29 | 0.50 |
| 18 | 36 | 86 | 157 | 89 | 37 | 0.41 |
| 20 | 0 | 13 | 42 | 15 | 15 | 1.04 |
| TSN | 8910 | 12126 | 15591 | 12183 | 2051 | 0.17 |
| Age | 5th percentile | Median | 95th percentile | Mean | SD | CV |
|---|---|---|---|---|---|---|
| 2 | 0 | 1 | 4 | 2 | 1 | 0.77 |
| 3 | 1 | 8 | 18 | 9 | 5 | 0.59 |
| 4 | 7 | 23 | 44 | 24 | 11 | 0.48 |
| 5 | 76 | 131 | 204 | 136 | 41 | 0.30 |
| 6 | 1083 | 1511 | 2035 | 1533 | 303 | 0.20 |
| 7 | 57 | 87 | 128 | 89 | 22 | 0.24 |
| 8 | 115 | 169 | 239 | 171 | 38 | 0.22 |
| 9 | 336 | 478 | 660 | 481 | 96 | 0.20 |
| 10 | 58 | 102 | 160 | 104 | 31 | 0.30 |
| 11 | 104 | 165 | 245 | 168 | 42 | 0.25 |
| 12 | 64 | 108 | 158 | 109 | 29 | 0.26 |
| 13 | 51 | 92 | 147 | 95 | 30 | 0.32 |
| 14 | 75 | 138 | 213 | 140 | 43 | 0.31 |
| 15 | 14 | 27 | 46 | 28 | 10 | 0.36 |
| 16 | 87 | 148 | 232 | 151 | 45 | 0.30 |
| 17 | 6 | 19 | 41 | 21 | 11 | 0.51 |
| 18 | 13 | 33 | 60 | 34 | 14 | 0.41 |
| 20 | 0 | 5 | 16 | 6 | 6 | 1.03 |
| TSB | 2424 | 3291 | 4246 | 3302 | 557 | 0.17 |
| Age | mean weight (g) | CV weight | mean length (cm) | CV length |
| 2 | 56.7 | 0.063 | 21.2 | 0.017 |
| 3 | 105.7 | 0.230 | 24.9 | 0.053 |
| 4 | 137.6 | 0.066 | 27.4 | 0.017 |
| 5 | 171.3 | 0.026 | 29.1 | 0.006 |
| 6 | 230.0 | 0.012 | 31.3 | 0.003 |
| 7 | 277.0 | 0.021 | 33.0 | 0.005 |
| 8 | 301.1 | 0.018 | 34.1 | 0.005 |
| 9 | 315.2 | 0.010 | 34.3 | 0.003 |
| 10 | 343.4 | 0.018 | 35.6 | 0.007 |
| 11 | 342.3 | 0.019 | 35.6 | 0.006 |
| 12 | 362.1 | 0.017 | 36.6 | 0.003 |
| 13 | 371.7 | 0.021 | 36.9 | 0.004 |
| 14 | 362.5 | 0.017 | 36.5 | 0.005 |
| 15 | 373.7 | 0.023 | 37.1 | 0.006 |
| 16 | 380.9 | 0.014 | 37.2 | 0.003 |
| 17 | 362.5 | 0.037 | 37.3 | 0.008 |
| 18 | 379.1 | 0.024 | 37.1 | 0.011 |
| 20 | 387.6 | 0.032 | 37.0 | 0.000 |
6 - Figures