The One Ocean Expedition: Forskning og seiling for havet vi ønsker
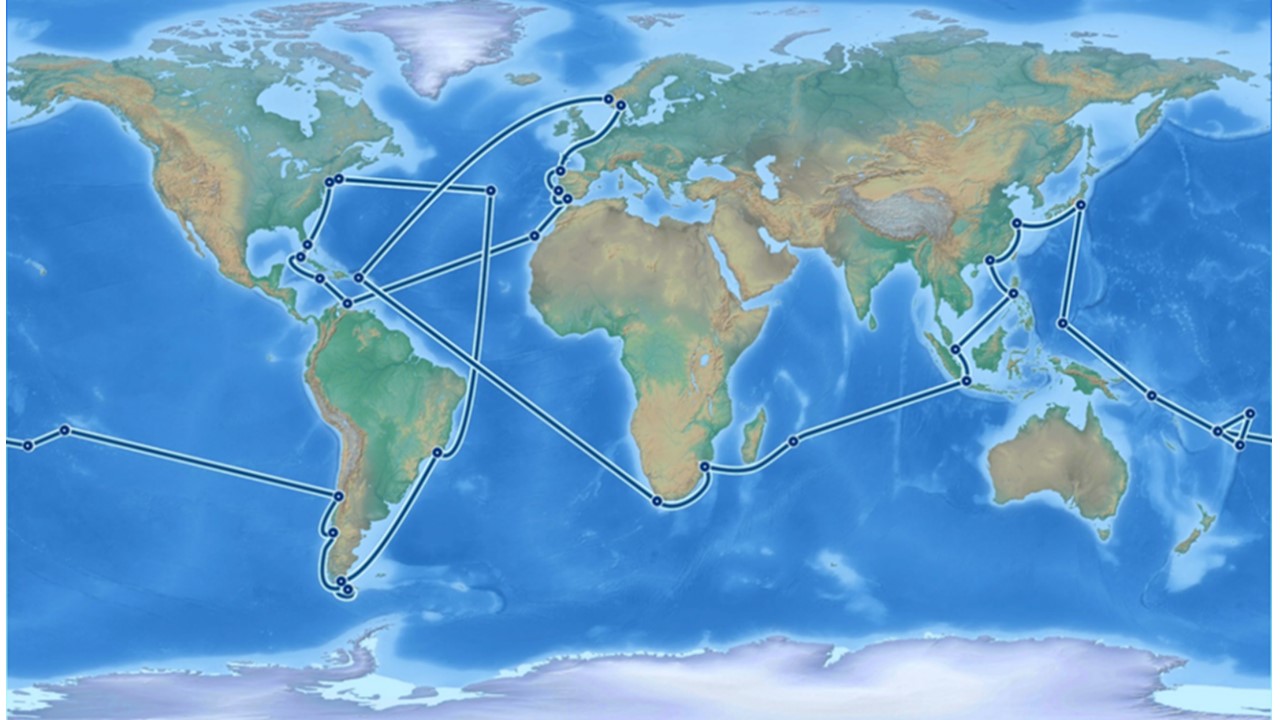
The One Ocean Expedition (OOE) har vært en 20 måneder lang jordomseiling av det norske seiltreningsfartøyet Statsraad Lehmkuhl, og en anerkjent del av FNs tiår for havvitenskap for bærekraftig utvikling (Figur 1).
Skipet er utstyrt med moderne instrumentering for å samle høykvalitetsdata om havfysikk, kjemi og biologi. Mange av dataseriene var under seilasen tilgjengelige i nesten sanntid fra en åpen database (www.nmdc.no). Prosjektet bidro til mangfoldiggjøringen av disse dataene.
Det vitenskapelige programmet ble gjennomført langs seilingsruten til Statsraad Lehmkuhl, med sporadiske stopp for stasjonsarbeid.
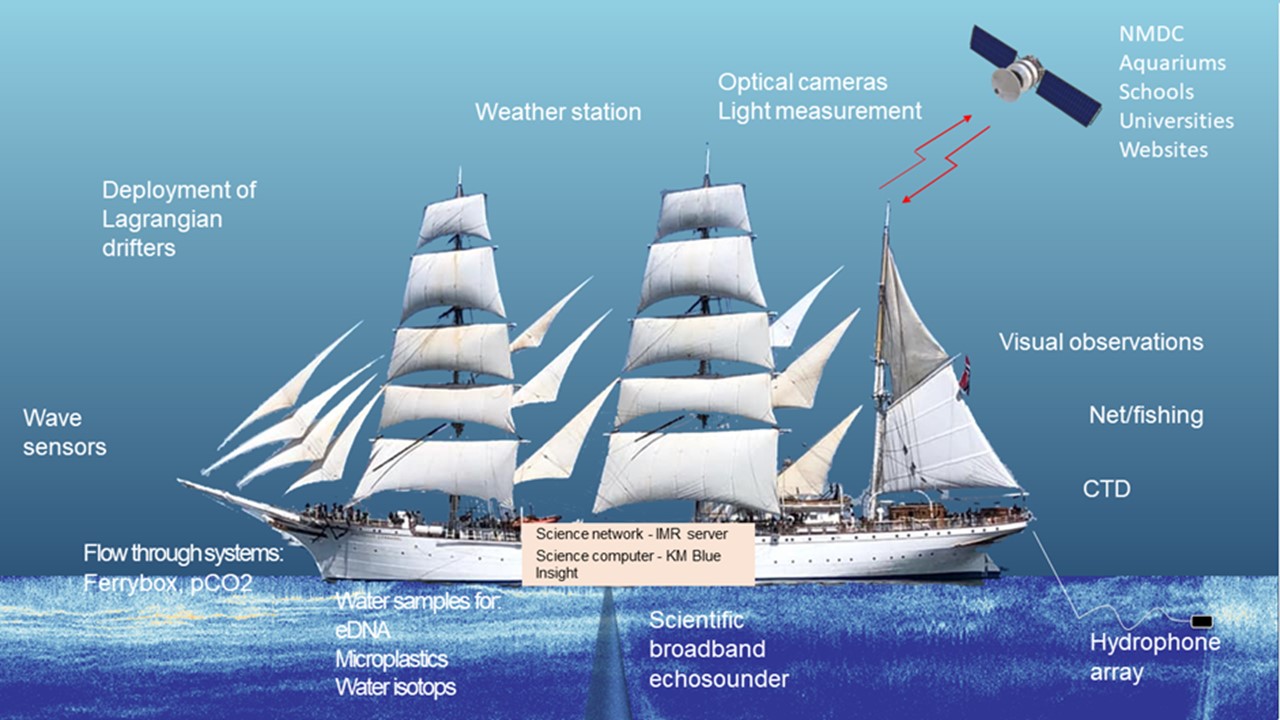
Målet med datainnsamlingen om bord på fartøyet var å forbedre kunnskapen om tilstanden til verdenshavet med hensyn til utbredelse og mangfold av organismer, miljøstatus, klima og menneskelig påvirkning på det marine økosystemet. Et sekundært mål var å utdanne havforskere og styrke havkunnskapen. Hovedtypene instrumentering er sensorer som måler kontinuerlig underveis, inkludert ekkolodd, hydrofon, temperatur- og saltholdighetssensor, og ulike instrumenter som samler og analyserer vannprøver fra et innløp i skipets skrog, inkludert for miljø-DNA og mikroplast (Figur 2).
Dataene generert under OOE er åpne og tilgjengelige på NMDC (www.nmdc.no). Prøvene tatt under ekspedisjonen vil bli analysert fortløpende og også publisert ved NMDC. Dette er også et bidrag til å etablere FAIR (Wilkinson et al., 2016) havdata, som er fokus i FNs havvitenskapelige tiårsprogram FAIROD som ledes av Havforskningsinstituttet.
Summary
The One Ocean Expedition (OOE) was a 20-month long circumnavigation of the globe by the Norwegian sail training vessel Statsraad Lehmkuhl, and a recognised part of the UN decade of Ocean Science for Sustainable Development. The ship was equipped with modern instrumentation to collect high-quality data on ocean physics, chemistry, and biology. Many of the data series were available in near real time from an open repository. The scientific programme was executed along the sailing route of Statsraad Lehmkuhl, with occasional stops for stationary work. The aim of the data collection on board the vessel was to improve knowledge about the state of the world's ocean with regards to the distribution and diversity of organisms, environmental status, climate, and human pressures on the marine ecosystem. Another aim of the expedition was to educate ocean scientists and strengthen ocean literacy. The main types of instrumentation are sensors that measure continuously underway including echosounder, hydrophone, temperature and salinity probes, and various instruments that collect and analyse water sampled from an inlet in the ship's hull, including for environmental DNA and microplastic. Here, we describe the scientific instrumentation onboard Statsraad Lehmkuhl and present preliminary results from the Atlantic part of the expedition. While there are many challenges to using a sail ship for scientific purposes, there are also some key benefits as the vessel is quiet and has a low footprint. Furthermore, the use of a common set of instruments and procedures across the ocean also removes an uncertainty factor when comparing data between ocean areas.
1 - Introduction
The ocean faces many challenges including climate change, loss of biodiversity, overfishing, littering, microplastic and acidification (Harley et al., 2006;Fabry et al., 2008;Browne et al., 2015;Lusher et al., 2015;Hoegh-Guldberg et al., 2019). At the same time, the ocean is an integral part of the global eco- and climate system, removing large amounts of CO2 from the atmosphere, and central to provide food for a growing population (SAPEA, 2017). Future developments in blue economy and maritime industries must be managed sustainably and knowledge based (Winther et al., 2020). Despite the considerable marine research that has been conducted globally over the last >100 years, there are still significant knowledge gaps about the ocean.
The United Nations (UN) proclaimed the UN Decade of Ocean Science for Sustainable Development (2021-2030) to encourage science-based efforts to reverse the cycle of decline in ocean health and to include stakeholders worldwide in a common framework to ensure improved conditions for a sustainable development of the Ocean (Ryabinin et al., 2019). The UN Ocean Decade is a key contribution to the UN Sustainable Development Goal (SDG) 14 (Life Below Water) and with the ocean's central role to our planet’s health and climate, also highly relevant to SDG 2 (Zero Hunger) and SDG 13 (Climate Action).
The One Ocean Expedition (OOE) was a 20-month long ocean circumnavigation of the globe by the Norwegian sail training vessel Statsraad Lehmkuhl, launched in 1914, and a recognised part of the UN decade of Ocean Science for Sustainable Development. The expedition started in Norway on 20 August 2021 and was completed on 15 April 2023. Statsraad Lehmkuhl sailed 55,000 nautical miles and visited 36 ports worldwide. To further the UNs Decade ambition to “... make oceanography fit for purpose of effectively supporting sustainable development and energize the ocean sciences for future generations" (Ryabinin et al., 2019), the One Ocean Expedition set out to create awareness and share knowledge about the crucial role of the ocean for sustainable development in a global perspective.
Working towards the slogan “The Science We Need for the Ocean We Want”, it is key to equip the next generation of ocean scientists with the necessary tools. The One Ocean Expedition was also a floating university contributing to UN SDG 4 (Quality Education), by hosting international summer schools, training and university courses. These include a summer school led by the Institute of Marine Research (IMR), an advanced training course focusing on remote sensing (organized by the Nansen Environmental and Remote Sensing Center in collaboration with the European Space Agency), sustainable leadership training led by the Western Norway University of Applied Sciences, a three-month university course from the University of Bergen (UiB) on sustainable development of life below water, as well as multiple outreach events and symposia in ports around the globe.
To support science and capacity building, the ship was equipped with modern instrumentation to continuously collect high-quality data on ocean physics, chemistry, and biology throughout the voyage. The scientific programme was designed by a consortium of Norwegian scientific institutions led by the Institute of Marine Research and was executed along the sailing route of the Statsraad Lehmkuhl, with occasional stops for stationary work and with complementary satellite-based remote sensing data collocated with the ship position.
All data collected onboard the ship were aggregated with standard tools and systems used on research and chartered vessels. Uniquely for OOE, all underway data (except the most voluminous data types, e.g. scientific echosounder) were then sent ashore using a newly developed commercial data management and visualization system for marine data (Blue Insight), where approximately 1 million measurements were sent daily from more than 80 different sources onboard the vessel. Additionally, machine learning algorithms were run onboard to process echosounder data, making information available for transmission to shore. All data have been stored and published in an open data repository at IMR.
Crossing a wide range of oceanic regions on its voyage around the globe, Statsraad Lehmkuhl reached many locations that are rarely visited by research vessels. A circumnavigation with the same ship and sampling protocol over the entire ocean can provide a consistent global dataset that holds the potential to tie observations together that were measured in different ocean basins, from different platforms and possibly also by using different sampling protocols. To respond to the many challenges of the ocean, an appropriately dimensioned scientific programme with standardized sampling and protocols and following FAIR data principles (Wilkinson et al., 2016) is key for all research partners of the OOE, as well as for the UN Decade of Ocean Science for Sustainable Development program.
Statsraad Lehmkuhl was not built as a research vessel, and the scientific instrumentation is therefore constrained by vessel design and energy availiability, but also by the operational knowledge of the diverse groups of people participating in the expedition. Based on these constraints, the main types of instruments fitted on the vessel are sensors that measure or sample continuously throughout the journey, such as an echosounder, hydrophone, autonomous pCO2 instrument and various instruments that collect and analyse water sampled from an inlet in the ship's hull including environmental DNA (Deiner et al., 2017; Pawlowski et al., 2020) and microplastics (Lusher et al., 2015).
The aim of the data collection on board Statsraad Lehmkuhl was to improve knowledge about the state of the world's ocean with regards to the distribution and diversity of organisms, environmental status, climate, and human pressures on the marine ecosystem. The observations will be used to shed light on the state of the different oceanic regions. Particularly, the OOE scientific programme is motivated by these questions:
How do biodiversity and indicators of human pressures vary over the world's ocean?
What is the distribution and vertical displacement of mesopelagic sound scattering layers across the world's ocean?
What are the physical characteristics of the regions and water masses we pass through, and can we detect phenomena which are commonly found during the whole voyage (such as internal waves, mesoscale eddies)?
How much CO2 does the ocean absorb from the atmosphere, what is the spatial and temporal variability of this uptake and how does it impact on ocean acidification?
How good is the correlation between observations and satellite measurements of physical and chemical parameters (in situ verification)?
How good is the correlation between observations, models and satellite measurements, can the measurements be used to improve weather and ocean forecasting?
The objectives of this report are to describe the scientific context of the One Ocean Expedition, the instrumentation installed onboard the vessel, and provide information about the data sets generated during the expedition. The data set information includes description of data flow, sampling protocols and data availability. The report also provides examples of initial results generated from the One Ocean Expedition with specific focus on the Atlantic Ocean, as well as a discussion and starting point for further analyses and use of the data.
2 - Material and methods
2.1 Rationale for the data collection
The route of Statsraad Lehmkuhl during the circumnavigation (Figure 1) was decided based on requirements of the charterers and not on scientific objectives. The route nevertheless covers many areas that are of great scientific interest for the research partners of OOE and beyond. All data from the expedition are stored and published in a data repository at IMR (Norwegian Marine Data Centre, NMDC), following FAIR principles (Wilkinson et al., 2016) and are openly available.
Figure 1. The planned route of the One Ocean Expedition during 2021-2023 with start and end in Norway.
The One Ocean Expedition was made up of ten surveys (Table 1). Pairs of students were responsible for the sample collection and measurements on board the vessel for each survey. The students received initial joint training in Bergen. This was followed up by extensive e-learning and at port training with the disembarking students teaching the embarking ones. This ensured that the sampling was done in the same manner throughout the entire expedition.
Table 1. Overview of the different surveys of OOE. The data are structured in accordance with these surveys.
Survey
Depature - arrival
Departure date
Arrival date
1
Arendal – Las Palmas
20/08/2021
30/09/2021
2
Las Palmas - Havanna
04/10/2021
24/11/2021
3
Havanna - New York
28/11/2021
19/12/2021
4
New York - Rio
02/01/2022
23/02/2022
5
Rio - Valparaiso
26/02/2022
29/04/2022
6
Valparaiso - Palau
01/05/2022
25/08/2022
7
Palau - Singapore
27/08/2022
29/10/2022
8
Singapore - Maputo
01/11/2022
17/12/2022
9
Maputo – Puerto Rico
03/01/2023
05/03/2023
10
Puerto Rico - Bergen
16/03/2023
15/04/2023
2.2 Description of instrumentation
2.2.1 Overview
Statsraad Lehmkuhl is equipped with selected modern marine research instrumentation for the One Ocean expedition as illustrated in Figure 2.
Figure 2. Overview of the sampling equipment fitted onboard Statsraad Lehmkuhl.
A wide range of instruments was used during the OOE. These are listed in Table 2. Overview of onboard instruments and their measured parameters. along with the corresponding parameters measured. All scientific events on board and a continuous record of the ship’s position were logged using the IMR navigation and event logger (“Toktlogger”).
Below we briefly describe the individual instruments installed onboard Statsraad Lehmkuhl and sampling procedures.
Table 2. Overview of onboard instruments and their measured parameters.
Instruments and sampling
Measured Parameters
Sampling Frequency
Echosounder
Vertical and horizontal distribution and acoustic density of fish and zooplankton.
Air temperature, pressure, wind speed and direction, humidity, wave height
Hourly samples
Plankton net
Collection of zooplankton
Weekly samples
CTD (Conductivity-Temperature-Depth sensor)
Vertical profiles of temperature, salinity and pressure
Weekly samples
eDNA sampling
Targeted eDNA-based qPCR analysis and NGS to give abundance of selected species and general biodiversity
Four samples per week
Microplastic sampling
Number, size distribution and polymers composition of microplastic
Filtration in triplicated every third day
Hydrophone
Anthropogenic and marine mammal sounds
Continuous (when deployed)
Fishing rods
Number of fish caught per species and length
Two hours per day
Light measurement
Surface light and light at depth
Continuous
Water isotope measurement
For water cycling studies
Daily
Visual surface observations
Surface distribution and type of marine mammals and floating litter
Daily
Data availability
Norwegian Marine Data Centre, run by the Institute of Marine Research:
www.nmdc.no
Open access
2.2.1 Weather station
The vessel captures information about the weather and automatically sends this to the Norwegian Meteorological Institute (MET). Barometric pressure, air temperature and humidity are measured from the aft mesan mast. In addition, the position, wind speed and wind direction are communicated. Weather observations are continuously published on the popular weather service at yr.no.
2.2.3 Wave measurements
This system is self-propelled and mounted on the bow sprit. MET has developed an acoustic wave sensor that measures the distance to the sea surface and corrects for vessel movement (Christensen et al., 2013). This low-cost sensor provides measurements that are comparable to more expensive instruments. The measurements have been used to verify wave models and satellite measurements and is the topic of two master projects (github.com/bohlinger/wavy, Knoblauch (2022)). In addition, several custom-built GPS drifters with motion sensors have been deployed and data have been used to verify satellite observations of waves in the Caribbean Ocean (Rabault et al., 2022).
2.2.4 Echosounder
The echosounders provide remote sensing capabilities throughout the upper water column including observations on distributions of plankton and fish. An echosounder emits a sound pulse directed downwards through the water column, and the backscattered sound from targets in the water column is recorded. More frequencies provide more information for target classification, but careful ground truthing through net sampling, optics, etc. is required for high taxonomic resolution.
Statsraad Lehmkuhl is equipped with a combined 38 kHz (split beam) and 200 kHz (single beam) ES-38/200-18C transducer (Kongsberg Maritime, Horten, Norway), mounted in the hull of the vessel on the starboard side at approximately 5 m depth. Both transducer beams have an 18-degree aperture angle and are connected to a Simrad EK80 transceiver.
The 200 kHz channel is alternating between transmitting continuous wave (CW) and frequency modulated (FM) sound pulses. In FM mode, the frequency ranges from 190 to 230 kHz, whereas in CW mode the system is operating at 200 kHz.
The choice of transducers was dictated by the available space in the hull of Statsraad Lehmkuhl, as no new modifications of the hull were permitted to accommodate for larger transducers. Being mounted shallow and on a sailing vessel, the quality of the acoustic data consequently depends on the magnitude and direction of wind and waves.
2.2.5 Hydrophone
The One Ocean Expedition provided a unique opportunity to measure underwater noise in the marine environment and map the occurrence of vocalizing marine mammals across the world's ocean. Sailing vessels like Statsraad Lehmkuhl are well suited for collecting this type of data, as they are very quiet vessels that do not significantly influence the measurements or the environment.
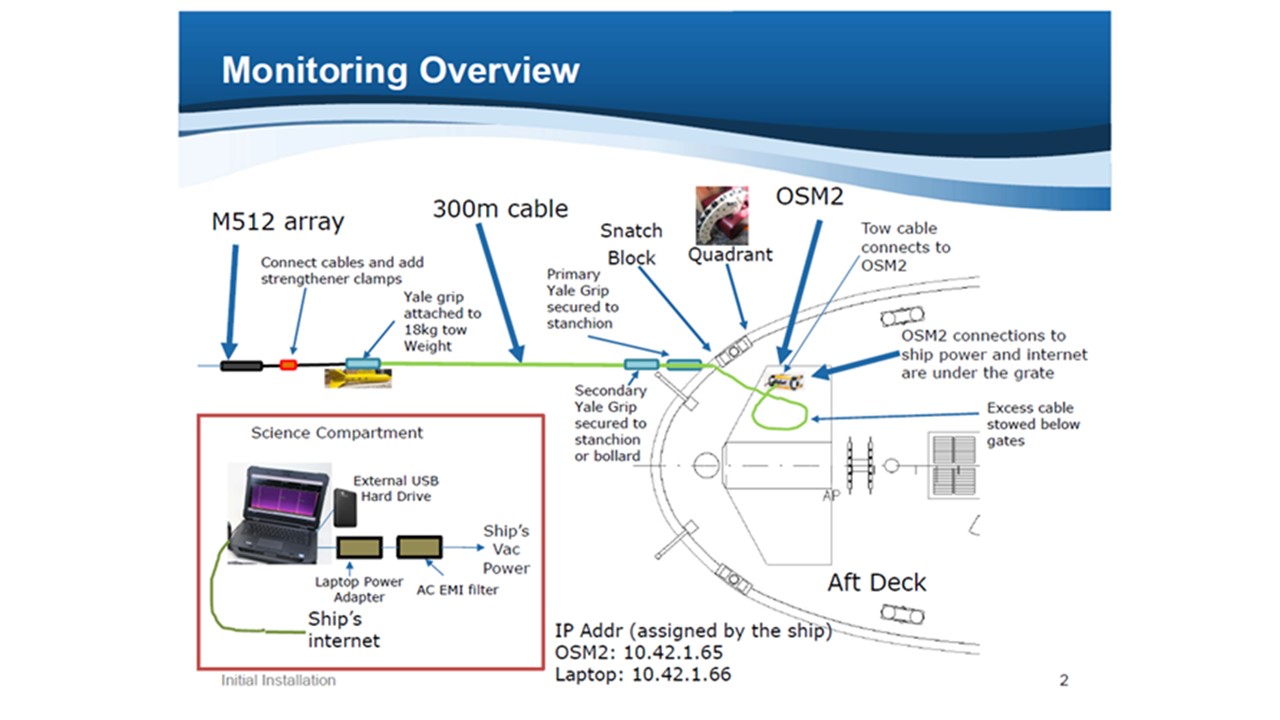
Statsraad Lehmkuhl tows a two-hydrophone line array manufactured by JASCO for detecting vocalizing marine mammals and monitoring of anthropogenic noise (Figure 3). The hydrophone array consists of two Geospectrum M512 hydrophones contained within an oil filled container. The array is connected to the JASCO OSM2 deck unit through a 300 m cable and depressed by an 18 kg weight. Data is stored with 256 kHz sampling frequency and 24 bits per sample. The deck unit is powered by the vessel, and data streaming from the deck unit is stored on the vessels survey system as wave files. Live sounds can also be heard and visualized in real-time on board using the PAMlab software (JASCO Applied Sciences).
The quality of the hydrophone data depends on several factors including whether the ship is sailing or under engine, the speed of the vessel through water, and sea surface agitation.
Figure 3. The JASCO hydrophone array system onboard Statsraad Lehmkuhl.
2.2.6 FerryBox
The FerryBox system (Petersen, 2014) developed by the Norwegian Institute for Water Research (NIVA) for the collection, analysis, and presentation of oceanographic and water quality data combines information from various sensors installed on board Statsraad Lehmkuhl. The FerryBox consists of a water inlet in the hull, aft, at about 5 metres depth, a pump system to transport the water and the automatic sampling equipment installed in a cabinet in the machine room area.
Once every minute, the FerryBox system automatically measures temperature, salinity, dissolved oxygen concentration, chlorophyll a fluorescence and particle content (CDOM fluorescence and turbidity). Data from the FerryBox includes two types of temperature measurements (water inlet temperature, and the temperature of the water during sampling). The temperature is recorded using a SeaBird SBE38 sensor and the salinity (or rather conductivity) using an SBE45. The data is gathered and stored on a server on board. When bandwidth allows, the data is harvested by a remote process at 10 minute intervals and can be retrieved online.
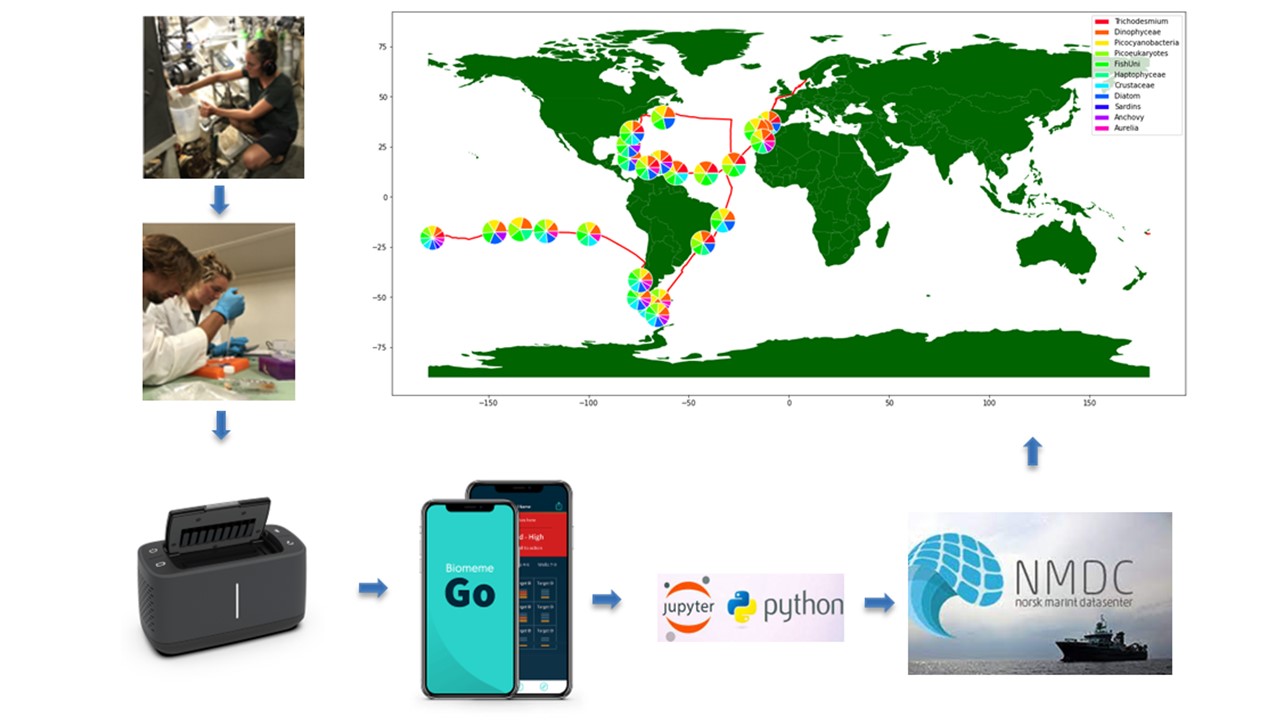
Figure 4. eDNA sampling - Water samples are collected every third day at ~ 5m below surface whilst the ship is in transit. Abundance of a selection of taxa (11 targets) are analyzed using qPCR and the relative composition of species using next-g generation sequencing (NGS). The water is filtered using in-line Sterivex (n=3; max. 2L) and Waterra (n=1; max.10L) filters, then stored at -20C.
2.2.8 Microplastic sampling
Sampling for microplastic analysis was conducted by filtering seawater collected from the water intake in the ship’s hull 5 meters below the ocean surface. Seawater was serial-filtered through a 300 µm and a 10 µm filter placed in a stainless-steel dual-chamber pump-driven filtering device operated from the ship’s engine room. Before sampling, the respective filters were locked in position in the upper and lower chamber and each sealed and secured by a stainless-steel O-ring and four sets of pressure leaf handles. Seawater was filtered at a rate of ≈ 5.8 L per minute, with a total of ≈ 180 L filtered unless pressure build-up > 10 bar was observed prior to this indicating filter clogging. After filtering, each filter was placed in individual pre-burned glass bottles closed with aluminum foil lined caps and stored at -20⸰C until analysis. Three successional filtrations were performed each sampling day.
2.2.9 pCO2 sensor
The University of Bergen (UiB) has installed a system for measuring CO2 partial pressure (pCO2) in surface water and atmosphere while the ship is sailing (General Oceanics 8050). This system provides data for air-sea CO2 flux and ocean acidification. It consists of an equilibrator, through which seawater is pumped with a flow of about 3L/min. A spiral nozzle forms a regular spray, so that the water and the gas phase achieve equilibrium fast. The gas phase is then pumped through a NDIR analyzer (Licor, LI 7000), which measures mole fraction of carbon dioxide. The system is equipped with one zero and three non-zero reference gases. Intake temperature is measured with a Fluke 1521. Equilibrator pressure is measured with an absolute pressure sensor (GE Druck 81). The operation and data reduction follows the principles described in Pierrot et al. (2009). The sea surface temperature is measured with a Fluke 1521 directly at the seawater intake. Data are transmitted regularly from the vessel. The data are reduced using the Quince data reduction software and submitted to the SOCAT database (www.socat.info).
2.2.10 Water isotope measurements
The sampling project combines surface observations with salinity and stable isotope measurements of ocean surface water. Moreover, based on the salinity characteristics of seawater sources and the isotope composition of the evaporative and meteoric water fluxes, the salinity distribution is used to indicate the relative importance of evaporation and meteoric water inputs on regional scales.
2.2.11 Light measurements
An ambient light sensor incorporated into a small datalogger (TDR Mk9, Wildlife Computers, Richmond, WA, USA) is fitted in the mizzenmast that measures continuous light during the voyage. The light level is important for interpreting the vertical positioning of the sound scattering layers on the echosounder.
2.2.12 CTD and plankton net
Both vertical profiles of conductivity, temperature, and pressure (= depth; CTD) and plankton nets were taken at stations during daytime. As the ship must stop sailing to carry out the CTD casts and plankton sampling, the number and frequency of stations were limited and dependent on weather conditions. Using a small portable winch mounted on the side of the ship, an RBR Concerto3 CTD sensor was lowered to approximately 350 to 700 m depending on bottom depth, currents and drift of the ship at each station. The CTD data were downloaded after each station, processed using the RBR Ruskin software and sent to the Norwegian Marine Data Centre (NMDC). A WP2 plankton net with a mesh size of 180 micrometer was hauled from 200 m depth to the surface. It was used to collect large phytoplankton chains as well as zooplankton. Plankton sub-samples were taken and stored in alcohol for later analysis. This analysis gives an overview of the composition of different taxonomic groups. At some stations, sub-samples were also used for education and demonstration with students. In addition, a Secchi Disk was used to measure the light penetration depth at each station.
2.2.13 Fishing rods
Fishing was carried out using two fishing rods at the stern of the vessel for about one hour in the morning and afternoon. The time used was recorded to allow establishing a catch per unit of effort index. Data on species and length was recorded for each catch.
2.2.14 Visual surface observations
Visual observations of marine mammals and floating debris were made daily using binoculars and naked eye. For marine mammals, these observations were carried out following standard line transect distance sampling methodology, as described in Buckland et al. (Buckland et al., 2007). Briefly, observers were asked to record the time and weather conditions at the start of an active watch period (effort period) when they were actively searching for whales and debris. Whenever an animal or object was sighted, the angle (relative to the bow of the vessel) and distance was estimated, using reticulated binoculars (Opticron Marine PS II 7x50/C), along with information about species, group size and swimming direction, or in the case of debris, the object type and general size/extent. Data were recorded either using the Logger software (Gillespie et al., 2010) or using vocal recordings into a mobile app (SensorLogger, https://www.tszheichoi.com/sensorlogger). In the latter case, we also explored the option of estimating angle and distance using SensorLogger’s internal recordings of pitch and magnetic bearing. In addition to these dedicated sighting periods, the lookout in the bow of the vessel also opportunistically recorded any observations of marine mammals or debris encountered.
2.2.15 Satellite observations
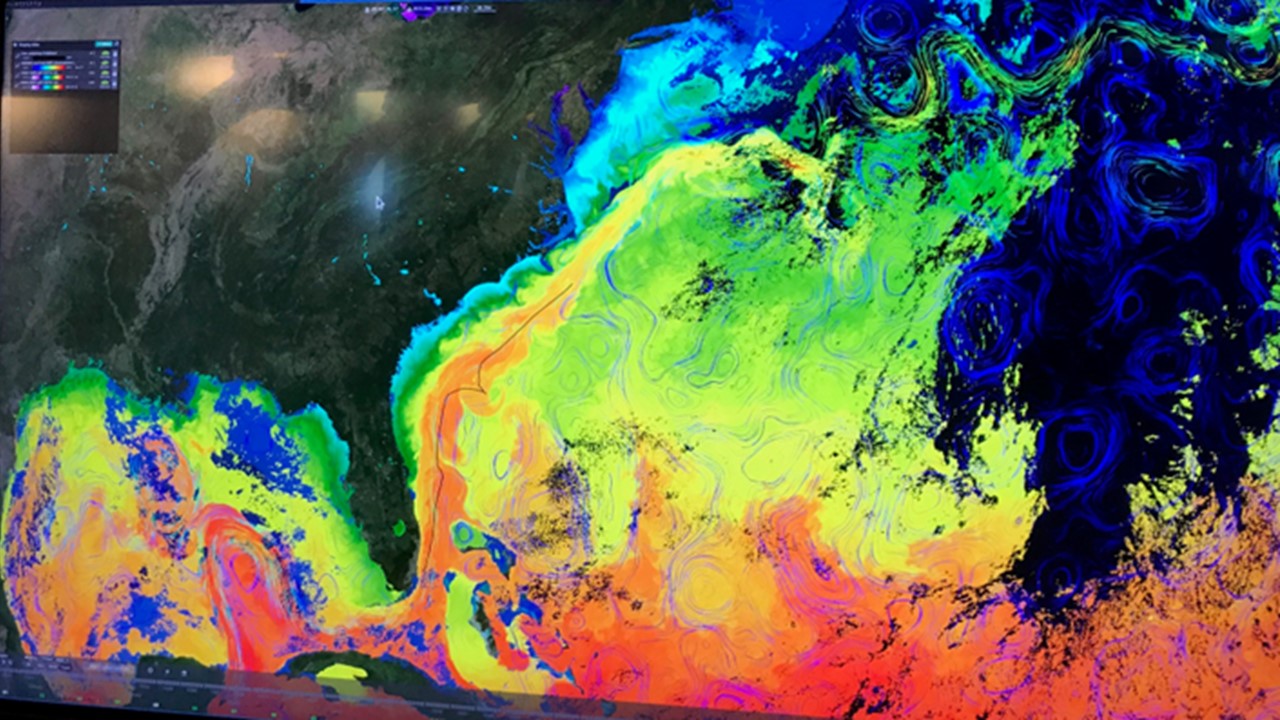
Daily observations of the global ocean surface are open and freely available from a range of satellite-based remote sensing measurements. Table 3 depicts these according to satellite sensor type, resolution and ocean surface variables. The spatial resolution varies over a wide range of scales from sensor-to-sensor type. Moreover, the spectrometers and infrared radiometers are only sensing in cloud free conditions. From a sensor combination point of view, ocean surface frontal boundaries associated with meandering currents, filaments and eddies are captured by all the remote sensing sensors. During the sail voyage from Miami to New York the satellite data were displayed on a special designed visualization portal (Figure 5) allowing near real time inspection and intercomparison of satellite data with ocean model fields and in-situ data collected from Statsraad Lehmkuhl.
Figure 5. Photograph of false colour map of the mean (5-day) sea surface temperature field during the voyage from Miami to New York as derived from satellite-based infrared radiometer observations and displayed publicly onboard Statsraad Lehmkuhl. Red/Light blue colour represents warm (25 degree C)/cold (15 degree C) surface water. The ship track is marked inside the core of the Gulf Stream by a black line.
Table 3. Overview of ocean surface variables regularly observed by satellites. * implies that the data take is only available under cloud free conditions.
Satellite Sensors type (resolution)
Sea surface temperature
Sea surface salinity
Surface current
Surface chlorophyll
Surface waves
Frontal boundaries
Passive Microwave Radiometer (25 km)
X
X
X
Synthetic Aperture Radar (100 m-1 km)
X
(X)
X
X
Altimeter (radar, laser) (5 km)
X
X
X
Spectrometer (~1 km) *
X
(X)
X
Infrared Radiometer (~1 km) *
X
X
2.3 Handling of data from OOE
2.3.1 Data stream
The data collected onboard is sent ashore over two communication channels using dedicated software from Kongsberg Maritime (KM). Over the VSAT antenna, about 1 million measurements are sent daily (from more than 80 different sources) using the Blue Insight application, while a subset of the data are transmitted via HF-antenna in areas where there is limited VSAT coverage. Additionally, the navigation and engine systems including the hybrid propulsion are remotely monitored through the Vessel Insight application device on board.
2.3.2 Data publishing
The data publishing from the OOE at the Norwegian Marine Data Centre (NMDC) was split in two parts: Publishing of underway data and publishing of data after each survey of the cruise. An overview of the starting points and end points of the surveys is given in Table 1.
During each survey, the data from the FerryBox, pCO2 sensors and the meteorological sensors were uploaded to NMDC every 10-minutes using KM’s Blue Insight solution. The data are available through an API, and a description of the API and download link to data from each sensor are published at NMDC as underway data.
After each survey was completed, a disk with all collected data was sent to IMR. The data was then published on NMDC as separate datasets for each datatype.
2.3.3 Data analysis and visualization
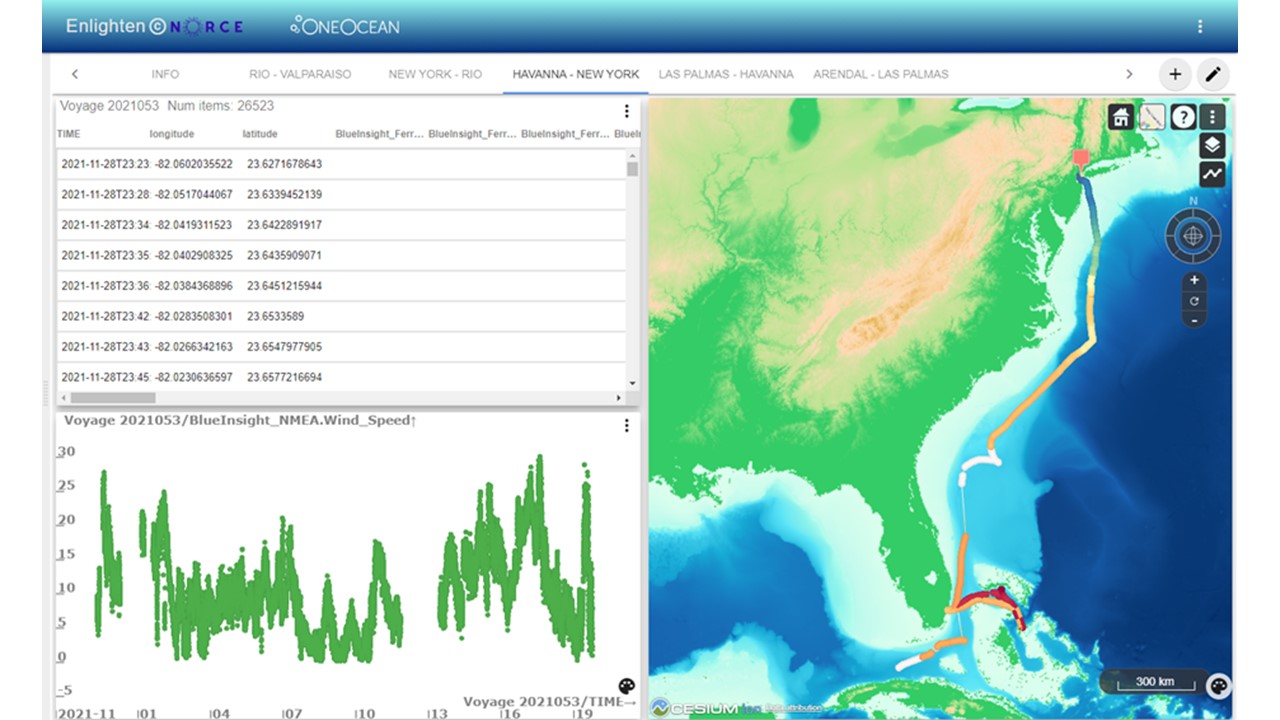
NORCE Norwegian Research Centre has deployed a web application called “One Ocean Data Exploration Portal”. The web application is connected to live streams of the data from each active survey. The portal also provides access to static datasets such as completed surveys or experimental results such as eDNA taxonomies. This provides scientists with a tool for interactive data analysis, co-visualization of One Ocean datasets with external data, and options for filtering and downloading datasets for off-line analysis. A screen shot from the One Ocean data exploration portal is shown in Figure 6. Screenshot of the One Ocean data exploration portal. This illustration shows the route for Survey 3 with sea water temperature and wind co visualized with bathymetry data from GEBCO. The portal is freely available through the web address https://oneocean.web.norce.cloud/
Figure 6. Screenshot of the One Ocean data exploration portal. This illustration shows the route for Survey 3 with sea water temperature and wind co visualized with bathymetry data from GEBCO.
3 - Results
In this section, we present selected initial results from the Atlantic surveys of OOE to demonstrate the potential of the dataset. Further analyses and results are forthcoming (Lien et al., 2022, Husson et al., in preparation).
3.1 Cruise track and samples
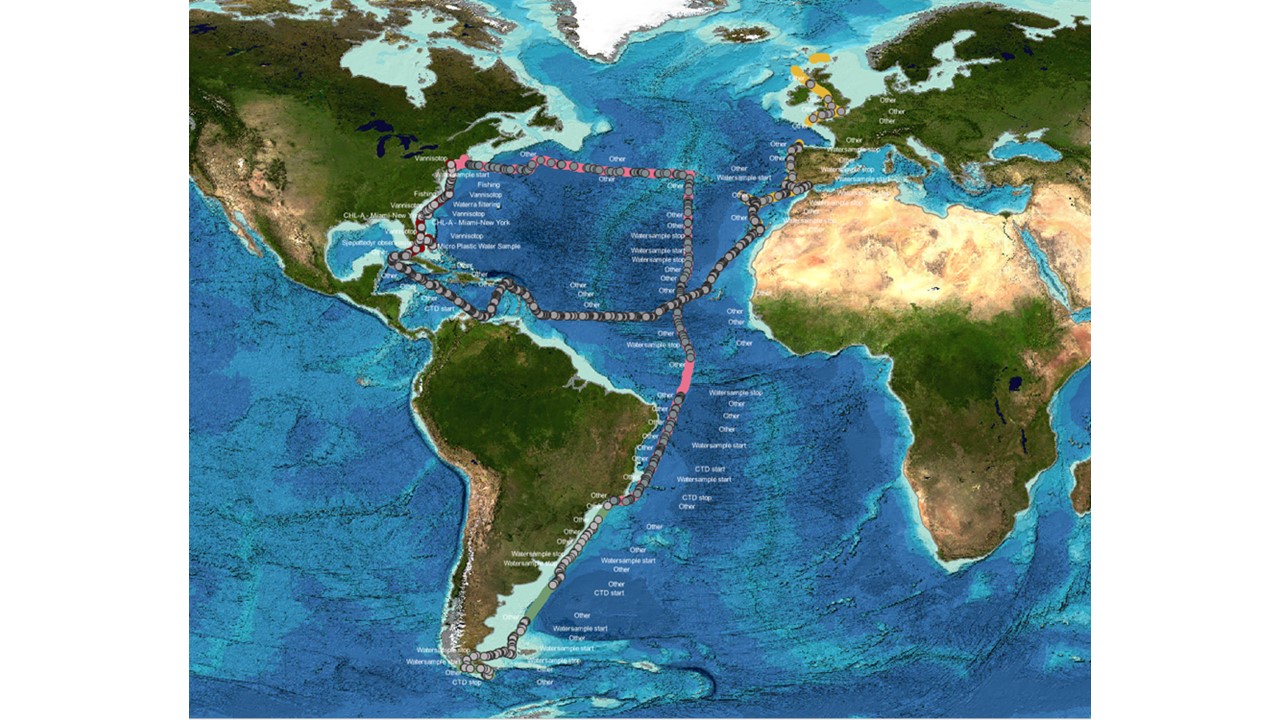
An overview of the different scientific activities and data collection during OOE in the Atlantic is shown in Figure 7. The entire voyage from Norway to Chile is shown, overlaid with research stations performed underway (e.g., fishing, CTD casts, water sampling).
Figure 7. Survey log from the Atlantic campaign of OOE. Colours indicate different surveys of the expedition, dots indicate events stored in the IMR cruise log system (e.g. plankton net cast, CTD cast etc.).
3.2 Echo sounder data
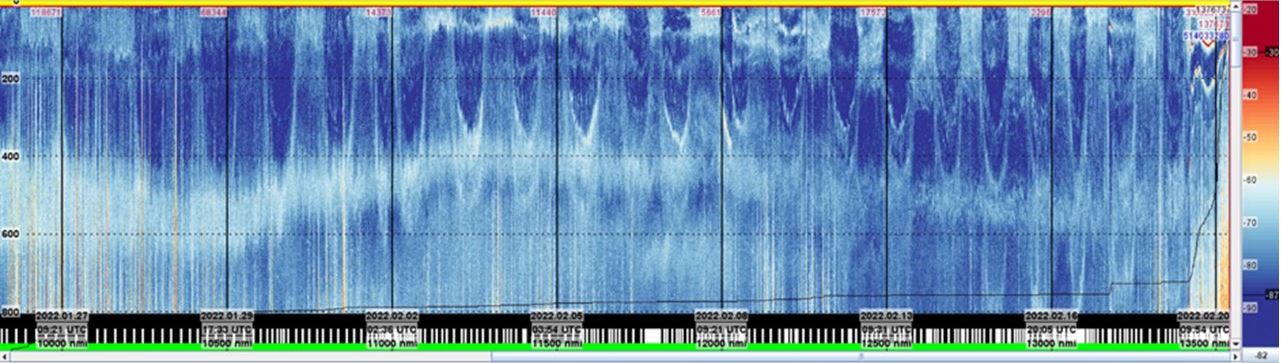
The echo sounder data collected along the ship track from the Azores to Rio de Janeiro are shown in Figure 8. The echogram is dominated by the mesopelagic mid-water scattering layer, the depth of this layer changes throughout the southward transect. There was a shoaling of the mid water scattering layer from about 550 m depth near the Azores to about 400 m at the Equator, followed by a deepening back to around 550 m east of Brazil (Figure 8). In addition, the relative acoustic density of the mesopelagic and epipelagic layer is changing along the transect, possibly a function of the water masses, nutrient availability and species community composition. Diel vertical migration to and from the epipelagic zone of mesopelagic fish from the mesopelagic zone is also clearly visible at dusk and dawn (Figure 8).
Figure 8. Echogram from the surface to 800 m depth along the voyage from the Azores to Rio de Janeiro.
3.3 Sound recordings
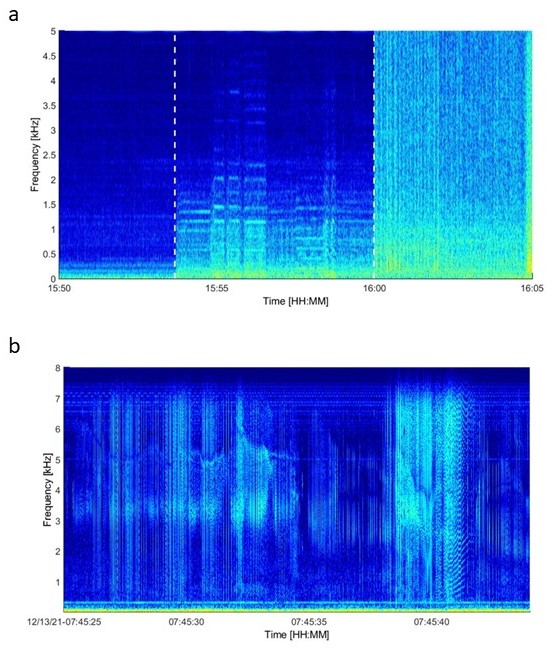
Sound is a fundamental component of the underwater habitat (Duarte et al., 2021). Aquatic animals and ecosystems have evolved to rely on using sound for survival over millions of years. In the last ~100 years, human activities have caused large increases in noise and changes in underwater soundscapes, with shipping identified as the primary source of consistent increase in noise at low frequencies since the 1960s (Frisk, 2012). These changes can lead to reduced ability to detect and interpret environmental cues that animals use to select mates, find food, maintain group structure and relationships, avoid predators, navigate, and perform other critical life functions. Underwater noise is defined as pollution by UN (UICN), EU, and OSPAR, and there is an urgent need to map underwater noise in the world’s ocean and understand its effect on marine life. Being a sailing vessel with a high percentage of time spent at sea under sail the contribution to underwater noise from Statsraad Lehmkuhl is minimal. Hence, it provides a silent platform for monitoring marine mammals and other types of naturally occurring sound as well as human generated noise. This advantage is exemplified in Figure 9a, which shows a spectrogram (time, frequency, sound pressure) visualizing sounds before and after the engine and propeller are engaged. Figure 9b shows the first detection of marine mammal vocalization captured by the hydrophone array, clicks and frequency modulated signals by multiple individuals.
Figure 9. a) Visualisation of sound recordings showing the difference in low frequency sounds (left) recorded when the vessel is under sail and when the vessels engine is started (indicated by the first vertical hatched line) and when the vessels propeller is engaged (indicated by the second vertical hatched line). b) First detections of marine mammal vocalization captured by the hydrophone array.
3.4 Microplastic
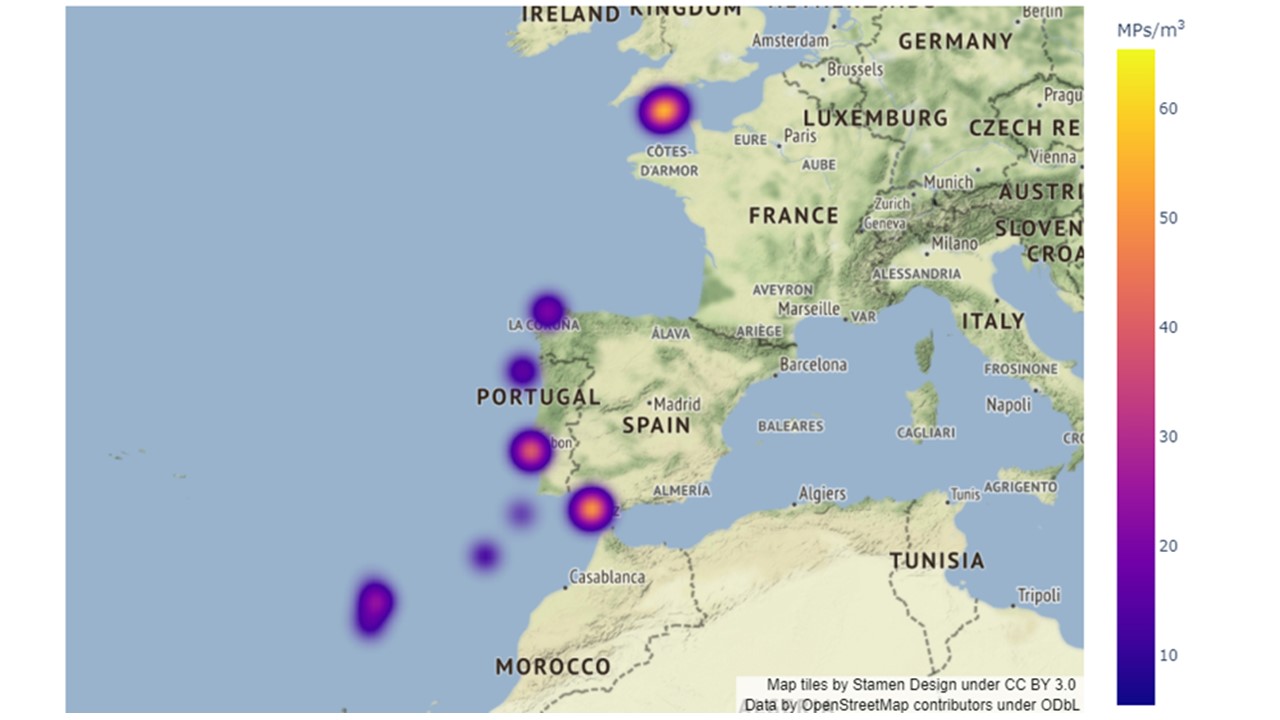
Knowledge about the abundance and distribution of microplastic across the world’s ocean is practically absent. A recent study on the vertical distribution of microplastic within the size class 32-651 µm deriving from most littered plastics polyethylene, polypropylene and polystyrene, suggests that the amount of microplastic in the Atlantic Ocean is much higher than previously estimated, enumerated to between ~200 and ~7000 particles m-3 at 10 meters depth (Pabortsava and Lampitt, 2020). Preliminary results from the current study, on the other hand, show much lower levels of microplastic in the North Atlantic Ocean and associated European coastal waters in the surface water at 5 m depth. The levels of MPs ranged from 5.5 to 65.0 MPs m-3 with the highest counts scored in the English Channel and coastal areas outside Lisbon, Portugal and Cádiz, Spain (Figure 10). Polypropylene, polyethylene, polystyrene, poly vinyl chloride, polyamide ethylene vinyl acetate, polyethylene terephthalate and polyurethane being the most represented polymers in the analyzed samples.
Figure 10. Occurrence of microplastic particles (MPs) in the first part of the survey shown as a density plot. Brighter colour indicates higher density of microplastics, normalized to particles per m3. The highest density measured was 65 particles per m3.
4 - Discussion and concluding remarks
Our data and sample collection onboard the Statsraad Lehmkuhl shows that it is feasible to carry out state of the art scientific investigations onboard a sailing vessel cheaply and without a trained scientific crew. Most of the data collection was carried out by non-scientific crew, students from various fields. At each change of crew and co-sailors, the new personnel were trained by the previous students and crew. The advantage of this approach was a short time lag between training and operation, although vulnerable to the skills of the previous crew and the ability of embarking crew to follow instructions. There was also some class-room training for the students allowing them to get acquainted with the sampling protocol and data handling. For future operations, an approach where the personnel get more thorough training before embarking combined with on-site training from the previous crew is preferred.
This report provides examples of initial results derived from the Atlantic part of the One Ocean Expedition. The data collected are open for all to use and offer a wide range of opportunities for further scientific analyses. The samples gathered will be analyzed in the lab, and the resulting data will be added to the OOE data set. We hope that the data will be used in many subsequent studies and there are clearly a lot of issues to follow up on in the data both in terms of undertaking detailed analyses of single data sets, and broader analyses across the different instruments.
There is an increasing number of autonomous platforms being launched to carry out scientific measurements in the ocean. Much of the scientific data collection on board Statsraad Lehmkuhl during OOE was done autonomically without involvement of the scientic crew. Operating sensors and observation systems remotely is challenging and similar to operating data collection from autonomous platforms. Tools to operate sensors and vehicles remotely have matured, and today it is possible to monitor the data collection from onshore operation facilities. However, there is still room for improvement with regards to monitoring system integrity and data quality, and in particular methods that can identify sensor problems and noise. Statsraad Lehmkuhl will continue to have the scientific instrumentatation, and the vessel thus also serves as a good test platform for autonomy as there are saiors on board that may intervene if required.
Traditionally, the occurrence and identification of marine species requires special gear (plankton gear, fish net) and taxonomy expertise to sort and identify the different taxa. This process gives high quality data, but is time-consuming, costly and cumbersome for extensive sampling. Environmental DNA provides a new way to access taxonomic information based on simple environmental samples and analysis of DNA sequences associated to taxonomic groups. Usually, this requires equipment and practices that are only available in the laboratory. For the OOE, simple and easy-to-operate procedures are used by students onboard the ship and a compact commercial portable device with cloud access is operated from the ship for the quantification of pre-defined taxa. This allows for a rapid near-time analysis of the data and visualization of the results along the sailing route through different oceanic regions. In turn, both comparison of the relative abundance of key marine species can be related to other online measurements, and first interpretation of this unique dataset made before return of the samples to land-based infrastructures.
The data generated during the OOE are open and available at the NMDC (www.nmdc.no). The samples taken during the expedition will be analysed consecutively and also published at NMDC. This is also a contribution towards establishing FAIR (Wilkinson et al., 2016) ocean data, which is the focus in the UN ocean science decade programme FAIROD hosted by the Institute of Marine Research.
Echosounder data yields particularly interesting information, as it is one of the few sensors which potentially senses the entire water column under continuous sailing. Albeit there are uncertainties in the composition of the global mesopelagic layer that limit the ability to directly estimate biomass from echosounder data, we foresee that the OOE will provide new insight into the biogeography of the global ocean mesopelagic zone (Irigoien et al., 2014; Proud et al., 2017).
Plastic is a global pollutant that impacts all regions of the Ocean including the most remote locations counting both poles and the deep (Pabortsava and Lampitt, 2020; van Sebille et al., 2020; Armitage et al., 2022) and the knowledge about the transport routes of microplastic in the global ocean systems are still limited (Pereiro et al., 2018). Our preliminary findings show a pattern toward hotspots of plastic micro litter pollution near coastal areas and harbours. By mapping the actual occurrence of microplastic using robust and reliable sampling and analysis methods across the world's ocean during the circumnavigation, the OOE aims at helping to refine the modelling of transport routes of marine microplastic at global scale.
A particular strength of the scientific programme carried out during the OOE is the collection of hydrophone data. The vessel sailed as much as possible which provides ideal conditions for recording sounds without the disturbance of the vessel noise as illustrated above. The sound recordings will be used to estimate the occurrence of different species of marine mammals and possibly also attribute the sounds to type of activity. In the second World Ocean Assessment of the UN, a baseline of ambient noise is requested to support risk assessment and modelling (Affairs, 2021). As such, the hydrophone data collected during the OOE will contribute to strengthening our understanding of the baseline of soundscape of the global ocean.
While there are many challenges to using a sail ship for scientific purposes, there are also some key benefits as the vessel is quiet and has a low footprint. Furthermore, the use of a common set of instruments and procedures across the ocean also removes an uncertainty factor when comparing data between ocean areas.
5 - Acknowledgements
Agenda Vestlandet, the Research Council of Norway and the Institute of Marine Research are acknowledged for funding of the marine scientific work of the One Ocean Expedition. We are also grateful to NORCE for providing internal resources for the analysis of the samples collected during the cruise. CL received funding from the EU Horizons 2020 project SUMMER (Grant Agreement No. 817806). Additional financial support to students was provided by the FILAMO project, funded by The Research Council of Norway. We also acknowledge Bergen Marine Forskningsklynge for financial support.
We thank Stiftelsen Seilskipet Statsraad Lehmkuhl and the crew for their great work and effort to accommodate the installation of the scientific instruments onboard Statsraad Lehmkuhl and for their assistance and enthousiasm in executing the scientific programme.
6 - Data availability
Datasets from the One Ocean Expedition are freely available from the Norwegian Marine Data Centre (nmdc.no). Datasets can be explored and downloaded by going to the One Ocean Expedition landing page https://doi.org/10.21335/NMDC-1572929066
All datasets are subject to CCBY Creative Commons Attribution 4.0 International License.
The specific datasets presented in this article are listed below:
Affairs, U.N.O.O.L. (2021). The Second World Ocean Assessment. United Nations.
Armitage, S., Awty-Carroll, K., Clewley, D., and Martinez-Vicente, V. (2022). Detection and Classification of Floating Plastic Litter Using a Vessel-Mounted Video Camera and Deep Learning. Remote Sensing 14, 3425.
Browne, M.A., Underwood, A.J., Chapman, M.G., Williams, R., Thompson, R.C., and Van Franeker, J.A. (2015). Linking effects of anthropogenic debris to ecological impacts. Proceedings of the Royal Society B-Biological Sciences 282, 1807.
Buckland, S.T., Anderson, D.R., Burnham, K.P., Laake, J.L., Borchers, D.L., and Thomas, L. (2007). Advanced distance sampling. New York: Oxford University Press. 416 p.
Christensen, K.H., Röhrs, J., Ward, B., Fer, I., Broström, G., Saetra, Ø., and Breivik, Ø. (2013). Surface wave measurements using a ship-mounted ultrasonic altimeter. Methods in Oceanography 6: 1-15.
Deiner, K., Bik, H.M., Mächler, E., Seymour, M., Lacoursière-Roussel, A., Altermatt, F., Creer, S., Bista, I., Lodge, D.M., De Vere, N., Pfrender, M.E., and Bernatchez, L. (2017). Environmental DNA metabarcoding: Transforming how we survey animal and plant communities. Molecular Ecology 26: 5872-5895.
Duarte, C.M., Chapuis, L., Collin, S.P., Costa, D.P., Devassy, R.P., Eguiluz, V.M., Erbe, C., Gordon, T.a.C., Halpern, B.S., Harding, H.R., Havlik, M.N., Meekan, M., Merchant, N.D., Miksis-Olds, J.L., Parsons, M., Predragovic, M., Radford, A.N., Radford, C.A., Simpson, S.D., Slabbekoorn, H., Staaterman, E., Van Opzeeland, I.C., Winderen, J., Zhang, X.L., and Juanes, F. (2021). The soundscape of the Anthropocene ocean. Science 371: 583-593.
Fabry, V.J., Seibel, B.A., Feely, R.A., and Orr, J.C. (2008). Impacts of ocean acidification on marine fauna and ecosystem processes. Ices Journal of Marine Science 65: 414-432.
Frisk, G.V. (2012). Noiseonomics: The relationship between ambient noise levels in the sea and global economic trends. Scientific Reports 2, 437.
Gillespie, D., Leaper, R., Gordon, J., and Macleod, K. (2010). An integrated data collection system for line transect surveys. Journal of Cetacean Research and Management 11: 217-227.
Harley, C.D.G., Hughes, A.R., Hultgren, K.M., Miner, B.G., Sorte, C.J.B., Thornber, C.S., Rodriguez, L.F., Tomanek, L., and Williams, S.L. (2006). The impacts of climate change in coastal marine systems. Ecology Letters 9: 228-241.
Hoegh-Guldberg, O., Northrop, E., and Lubchenco, J. (2019). The ocean is key to achieving climate and societal goals. Science 365, 1372-1374.
Irigoien, X., Klevjer, T.A., Rostad, A., Martinez, U., Boyra, G., Acuna, J.L., Bode, A., Echevarria, F., Gonzalez-Gordillo, J.I., Hernandez-Leon, S., Agusti, S., Aksnes, D.L., Duarte, C.M., and Kaartvedt, S. (2014). Large mesopelagic fishes biomass and trophic efficiency in the open ocean. Nat Commun 5, 3271.
Knoblauch, F.M. (2022). Measurement of Wave Properties with a Custom Built Sensor System as Part of the One Ocean Expedition (2021-2023). Master thesis, UiO, 2022. https://www.duo.uio.no/handle/10852/95728.
Lien, V., Renner, A.H.H., Myksvoll, M.S., Johannessen, J.A., Cook, J., Spurkeland, H., and Toppe, R. (2022). The One Ocean Expedition - Promoting ocean literacy around the globe. Copernicus Marine Service Ocean State Report, 7th edition, submitted.
Lusher, A.L., Tirelli, V., O’connor, I., and Officer, R. (2015). Microplastics in Arctic polar waters: the first reported values of particles in surface and sub-surface samples. Scientific Reports 5, 14947.
Pabortsava, K., and Lampitt, R.S. (2020). High concentrations of plastic hidden beneath the surface of the Atlantic Ocean. Nature Communications 11, 4073.
Pawlowski, J., Apothéloz-Perret-Gentil, L., and Altermatt, F. (2020). Environmental DNA: What's behind the term? Clarifying the terminology and recommendations for its future use in biomonitoring. Molecular Ecology 29: 4258-4264.
Pereiro, D., Souto, C., and Gago, J. (2018). Calibration of a marine floating litter transport model. Journal of Operational Oceanography 11: 125-133.
Petersen, W. (2014). FerryBox systems: State-of-the-art in Europe and future development. Journal of Marine Systems 140:4-12.
Pierrot, D., Neill, C., Sullivan, K., Castle, R., Wanninkhof, R., Lüger, H., Johannessen, T., Olsen, A., Feely, R.A., and Cosca, C.E. (2009). Recommendations for autonomous underway pCO2 measuring systems and data-reduction routines. Deep Sea Research Part II: Topical Studies in Oceanography 56: 512-522.
Proud, R., Cox, M.J., and Brierley, A.S. (2017). Biogeography of the Global Ocean's Mesopelagic Zone. Current Biology 27: 113-119.
Rabault, Jean, Takehiko Nose, Gaute Hope, Malte Müller, Øyvind Breivik, Joey Voermans, Lars Robert Hole et al. "OpenMetBuoy-v2021: An Easy-to-Build, Affordable, Customizable, Open-Source Instrument for Oceanographic Measurements of Drift and Waves in Sea Ice and the Open Ocean." Geosciences 12, no. 3 (2022): 110.
Ryabinin, V., Barbiere, J., Haugan, P., Kullenberg, G., Smith, N., Mclean, C., Troisi, A., Fischer, A., Arico, S., Aarup, T., Pissierssens, P., Visbeck, M., Enevoldsen, H.O., and Rigaud, J. (2019). The UN Decade of Ocean Science for Sustainable Development. Frontiers in Marine Science 6, 460.
Sapea (2017). "Food from the oceans: how can more food and biomass be obtained from the oceans in a way that does not deprive future generations of their benefits?", in: SAPEA Evidence Review Report No. 1. Science Advice for Policy by European Academies (SAPEA)).
Van Sebille, E., Aliani, S., Law, K.L., Maximenko, N., Alsina, J.M., Bagaev, A., Bergmann, M., Chapron, B., Chubarenko, I., Cozar, A., Delandmeter, P., Egger, M., Fox-Kemper, B., Garaba, S.P., Goddijn-Murphy, L., Hardesty, B.D., Hoffman, M.J., Isobe, A., Jongedijk, C.E., Kaandorp, M.L.A., Khatmullina, L., Koelmans, A.A., Kukulka, T., Laufkotter, C., Lebreton, L., Lobelle, D., Maes, C., Martinez-Vicente, V., Maqueda, M.a.M., Poulain-Zarcos, M., Rodriguez, E., Ryan, P.G., Shanks, A.L., Shim, W.J., Suaria, G., Thiel, M., Van Den Bremer, T.S., and Wichmann, D. (2020). The physical oceanography of the transport of floating marine debris. Environmental Research Letters 15, 023003.
Wilkinson, M.D., Dumontier, M., Aalbersberg, I.J., Appleton, G., Axton, M., Baak, A., Blomberg, N., Boiten, J.-W., Da Silva Santos, L.B., Bourne, P.E., Bouwman, J., Brookes, A.J., Clark, T., Crosas, M., Dillo, I., Dumon, O., Edmunds, S., Evelo, C.T., Finkers, R., Gonzalez-Beltran, A., Gray, A.J.G., Groth, P., Goble, C., Grethe, J.S., Heringa, J., ’T Hoen, P.a.C., Hooft, R., Kuhn, T., Kok, R., Kok, J., Lusher, S.J., Martone, M.E., Mons, A., Packer, A.L., Persson, B., Rocca-Serra, P., Roos, M., Van Schaik, R., Sansone, S.-A., Schultes, E., Sengstag, T., Slater, T., Strawn, G., Swertz, M.A., Thompson, M., Van Der Lei, J., Van Mulligen, E., Velterop, J., Waagmeester, A., Wittenburg, P., Wolstencroft, K., Zhao, J., and Mons, B. (2016). The FAIR Guiding Principles for scientific data management and stewardship. Scientific Data 3, 160018.
Winther, J.-G., Dai, M., Rist, T., Hoel, A.H., Li, Y., Trice, A., Morrissey, K., Juinio-Meñez, M.A., Fernandes, L., Unger, S., Scarano, F.R., Halpin, P., and Whitehouse, S. (2020). Integrated ocean management for a sustainable ocean economy. Nature Ecology & Evolution 4: 1451-1458.