1 - Introduction
Official monitoring and control of foods to ensure the health of consumers is regulated through European Union (EU) and Norwegian law and is also important to ensure market access. The EU Regulation (EU) 2017/625, implemented in Norwegian law as FOR-2020-03-03-704, provides an obligation for member states to ensure that official controls are performed by competent authorities based on a multi-annual national control plan (MANCP). The obligation to include contaminants in wild caught seafood in a MANCP has recently been implemented in EU law through regulations (EU) 2022/931 and 2022/932. There, it is stated for unprocessed wild-caught fishery products as well as crustaceans and bivalve molluscs: “…the number of samples is to be determined by each Member State according to the level of production and the problems identified”.
Thus, control plans to be implemented by the NFSA for wild caught seafood must be risk-based, and an overview of present knowledge and an identification of risks is needed for the preparation of these control plans. Therefore, in 2022, the NFSA asked the Institute of Marine Research (IMR) to prepare an overview of current knowledge on undesirable substances in wild caught seafood species, identifying substances and species that may constitute a potential health risk, along with professional justification for each identified species.
The overview should contain aggregated information about:
- Problematic contaminants in seafood
- Which contaminants and seafood species that are well documented and which are data deficient
- Geographical variation of contaminants in seafood
The knowledge gathered should be evaluated with regard to risk so that NFSA may use this information to prioritize which species and contaminant groups to analyse in the control plan.
The monitoring system for live bivalve molluscs (LBM) is not affected by the new regulations, since control of LBM are regulated by other EU regulations ((EU) 2019/627 and (EU) 2019/624 supplementing (EU) 2017/625), which are dealing with acute risks from microbiology and biotoxins and hence are more comprehensive than regulations for other types of seafood. Therefore, data from the LBM monitoring on behalf of the NFSA are not included in this evaluation.
1.1 - Monitoring of contaminants in wild fish
The production of wild caught Norwegian seafood is both larger and more diverse than that of farmed seafood, with a multitude of species captured over large geographical areas. The total volumes captured by commercial Norwegian fishing vessels were in recent years in the range of 2.3 – 2.4 million tons, excluding macroalgae. However, relatively few species account for most of the catch volume. Pelagic fish (Atlantic herring (Clupea harengus), Atlantic mackerel (Scomber scombrus), blue whiting (Micromesistius poutassou) and more), constitute about half of this volume, and the three cod fishes Atlantic cod (Gadus morhua), saithe (Pollachius virens) and haddock (Melanogrammus aeglefinus) approximately one third. The rest is a mixture of demersal fish, flatfishes, shellfish and an increasing volume of Antarctic krill (Euphausia superba), also included in the landing statistics of the Norwegian Directorate of Fisheries (Fangst fordelt på art (offisiell statistikk) | Fiskeridirektoratet).
A significant part of the total volume of wild capture production, including krill and several pelagic fish species (e.g. blue whiting, sandeel (Ammodytes spp.)), is primarily used for industrial production of fish meal and -oil, mainly as ingredients for feed for farmed fish. This is not evaluated in this report.
The control mechanisms for ensuring that levels of contaminants in seafood are within regulatory limits according to the European Commission Regulations (EC) No 1881/2006 and (EU) 2023/915, have until 2023 been regulated differently for wild caught seafood and farmed seafood. Farmed fish has, since the Council Directive (EU) 96/23/EC was implemented in 1996, been under a strict monitoring regime requiring a specific number of samples according to production volume for the analyses of veterinary products and contaminants. Before 2023, these regulations did not include wild-caught seafood. However, independent of regulations, surveillance and monitoring of contaminants in Norwegian wild-caught seafood have been carried out with the aim of obtaining an overview and documentation of the contents of different contaminants, to fulfil export requirements for the fishing industry and to ensure the protection of consumers.
The focus on contaminants and food safety increased greatly in the 1990s and a programme for systematic spot-check based monitoring of metals and PCBs in seafood was initiated by the Institute of Nutrition, Directorate of Fisheries. This institute became the National Institute of Nutrition and Seafood Research (NIFES) in 2003 and merged with the Institute of Marine Research (IMR) in 2018. As a consequence of several findings of contaminants in Norwegian fish above maximum levels (e.g., Hg in Greenland halibut in 2006 (Julshamn et al., 2006)), large systematic surveys, referred to as baseline studies, were initiated for selected species (see Table 1). The first species selected for baseline studies were chosen because of their large catch volumes, except Greenland halibut, which was chosen because of its risk of exceeding the ML for Hg. The baseline studies were designed, as far as possible, to cover the geographical areas where Norwegian fishery statistics showed that the respective species were captured, while also investigating seasonal variation. The number of samples in a baseline study ranged from about 800 to more than 2000 individual fish. After the initial comprehensive baseline studies with high numbers of samples of individual fish (Greenland halibut, herring, mackerel, cod, saithe, tusk and haddock), later baseline studies were mostly scaled down to fewer fish and/or a combination of individual fish and pooled samples (Table 1).
An important aim of the baseline studies was to establish a basis for continued knowledge-based monitoring of contaminants in our most important fish stocks. The baseline studies provided thorough documentation on a variety of factors influencing contaminant levels in the different species, including geographical catch area, season, age, size, and fat content of the fish. Based on this knowledge, more directed risk-based monitoring programs (“follow-up monitoring”) could be designed for each species. Such a follow-up monitoring program (“Oppfølging av basisundersøkelser”) was started in 2011. In the beginning, follow-up monitoring was performed for all the species where baseline studies had been completed (Table 1), i.e., Norwegian spring spawning herring (NSS-herring) and Greenland halibut from 2011, Atlantic mackerel from 2013 and North Sea herring, Atlantic cod and saithe from 2014. From 2019, tusk was also included in the follow-up monitoring, and haddock was included from 2024. The extent and frequency of follow-up monitoring for each species was determined based on both commercial importance of the species and risk of exceeding MLs. The remaining species for which baseline studies have been completed, have so far not been included in this program.
In parallel with the baseline studies and the follow-up monitoring program, spot-check monitoring was continued for species or areas with little data. Data from spot-check monitoring have also been used as basis for selection of new baseline studies. In the latest years, new resources (species expected to be of increasing interest as food and feed in coming decades or new species in Norwegian waters), and samples from fjords have been included in spot-check monitoring. Some wild bivalves with little data are included in the spot-check monitoring of new resources, and are used in this evaluation, even though the NFSA monitoring program for live bivalve molluscs (LBM) is not included here.
From the beginning in the 1990s and until now, sampling has been carried out via IMR’s research cruises, their reference fleet (fishing vessels on contract with the IMR), and other directly engaged fishermen. The samples were analysed for contaminants for which maximum levels were set, such as heavy metals, PCBs and dioxins, but also other substances of emerging concern such as brominated flame retardants for which MLs were not in place. In recent surveys, PFAS and chlorinated pesticides have also been included. The chemical analyses were mostly performed at IMR/NIFES laboratories accredited according to NS-EN ISO/IEC 17025:2017.
The baseline studies were initially funded through a combination of means from the Norwegian Seafood Research Fund, the Herring Fishermen’s Sales Organisation (Sildesalgslaget; for herring), the Ministry of Fisheries and Coastal Affairs (now Ministry of Trade, Industry and Fisheries), and the NFSA. Later baseline studies were mostly performed as a part of the NFSA’s monitoring portfolio, through 3–4-year programmes. An exception in later years is the haddock baseline study, which was funded directly from the Ministry of Trade, Industry and Fisheries, as is also the follow-up monitoring program. Table 1 gives an overview of the different baseline studies, resulting reports and peer-review publications, and follow-up monitoring.
| Species Norwegian/English (Latin) |
Sampling years |
Number of fish (approx.) |
Report |
Publ. in international peer reviewed journals |
Follow-up monitoring |
| NVG-sild/ NSS herring (Clupea harengus) |
2006-2007 |
800 |
Frantzen et al., 2009 |
Frantzen et al., 2011, Frantzen et al., 2015; Nøstbakken et al., 2018, Azad et al., 2019, Ho et al., 2021, Nøstbakken et al., 2021; Ho et al., 2021; Ho et al., 2023; Ho et al., 2024 |
Every third year |
| Blåkveite/ Greenland halibut (Reinhardtius hippoglossoides) |
2006-2008 |
1300 |
Nilsen et al., 2010 |
Nøstbakken et al., 2018; Azad et al., 2019; Bank et al., 2021; Ho, Bank et al., 2021; Ho et al., 2024 |
Annual |
| Makrell/ Atlantic mackerel (Scomber scombrus) |
2007-2009 |
1200 |
Frantzen et al., 2010 |
Nøstbakken et al., 2018; Azad et al., 2019; Nøstbakken et al., 2021; Ho, Bank et al., 2021; Ho, Frantzen et al., 2023; Frantzen et al., 2024a; Ho et al., 2024 |
Annual/every third year (depending on area) |
| Torsk/ Atlantic cod (Gadus morhua) |
2009-2011 |
2100 |
Julshamn et al., 2012a |
Julshamn et al., 2013a; Julshamn et al., 2013b; Julshamn et al., 2013c; Nøstbakken et al., 2018; Azad et al., 2019; Ho, Bank et al., 2021; Ho, Frantzen et al., 2023; Bank et al., 2023a |
Annual |
| Nordsjøsild/ North Sea herring (Clupea harengus) |
2009-2010 |
1000 |
Duinker et al., 2012 |
Nøstbakken et al., 2018; Azad et al., 2019; Nøstbakken et al., 2021; Ho, Bank et al., 2021; Ho, Frantzen et al., 2023; Ho et al., 2024 |
Every third year |
| Sei/ Saithe (Pollachius virens) |
2010-2013 |
1600 |
Nilsen et al., 2012, Nilsen et al., 2013 |
Nøstbakken et al., 2018; Azad et al., 2019; Ho, Bank et al., 2021; Ho, Frantzen et al., 2023 |
Annual (every second year from 2023) |
| Taskekrabbe/ Brown crab (Cancer pagurus) |
2011 |
400 |
Julshamn et al., 2012c |
|
Irregular |
| Kongekrabbe/ Red king crab (Paralithodes camtschaticus) |
2012 |
200 |
Julshamn et al., 2013d |
Julshamn et al., 2015 |
None |
| Brosme/ Tusk (Brosme brosme) |
2013-2016 |
1400 |
Frantzen and Maage, 2016 |
Ho, Bank et al., 2021; Ho, Frantzen et al., 2023 |
Annual |
| Lange/ Ling (Molva molva) |
2013-2016 |
800 |
Frantzen and Maage, 2016 |
Ho, Bank et al., 2021; Ho, Frantzen et al., 2023 |
None |
| Kveite/ Atlantic halibut (Hippoglossus hippoglossoides) |
2013-2016 |
400 |
Nilsen et al., 2016 |
Nøstbakken et al., 2018; Ho, Bank et al., 2021; Ho, Frantzen et al., 2023 |
Irregular |
| Hyse/ Haddock (Melanogrammus aeglefinus) |
2015-2019 |
1250 |
Kögel et al., 2021 |
Ho, Bank et al., 2021 |
Every second year from 2024 |
| Rødspette/ Plaice (Pleuronectes platessoides) |
2016-2018 |
450 |
Frantzen et al., 2020 |
Ho, Bank et al., 2021; Ho, Frantzen et al., 2023 |
None |
| Breiflabb/ Anglerfish (Lophius piscatorius) |
2016-2019 |
300 |
Frantzen et al., 2020 |
Ho, Frantzen et al., 2023 |
None |
| Lyr/ Pollack (Pollachius pollachius) |
2016-2019 |
300 |
Frantzen et al., 2020 |
Ho, Frantzen et al., 2023 |
None |
| Uer/ Golden redfish (Sebastes norvegicus) |
2016-2018 |
200 |
Nilsen et al., 2020b |
Ho, Frantzen et al., 2023 |
None |
| Snabeluer/ Beaked redfish (Sebastes mentella) |
2016-2018 |
500 |
Nilsen et al., 2020b |
Ho, Frantzen et al., 2023 |
None |
| Lysing/ European hake (Merluccius merluccius) |
2019-2022 |
800 |
Bank et al., 2023b |
Zhu et al., 2025 |
None |
| Vassild/ Argentines (Argentinus spp.) |
2019-2022 |
300 |
Wiech et al., 2023 |
|
None |
| Gråsteinbit/ Atlantic wolffish (Anarhichas lupus) |
2019-2022 |
200 |
Wiech et al., 2023 |
|
None |
| Flekksteinbit/ Spotted wolffish (A. minor) |
2019-2022 |
250 |
Wiech et al., 2023 |
|
None |
Table 1. Overview of the species/fish stock for which baseline studies were performed. Sampling years, number of fish, references for reports and published scientific articles, and frequency of follow-up monitoring is given for each species.
Abbreviations: NVG-sild (norsk vårgytende sild), NSS herring (Norwegian spring spawning herring)
1.2 - Surveys of contaminants in seafood from polluted areas
Several marine areas in Norway are polluted with different contaminants potentially compromising seafood safety locally. Especially fjords, harbours, urban areas and generally areas close to known point sources of pollution have been identified as problematic. Often the contaminants were deposited in the bottom sediments years ago. In such areas, especially recreational fishermen and their families have a higher risk of critical exposure to contaminants from seafood. Some of these areas also have commercial fisheries. IMR has performed surveys of contaminants in fish from areas with known pollution, resulting in a series of reports addressing these challenges which threaten fish and/or population health as presented in Appendix Table A1. Data from these and other studies were used by the NFSA to issue necessary consumption advice to the public which are currently published at mattilsynet.no (Unngå fisk og skalldyr fra forurensede havner, fjorder og innsjøer | Mattilsynet).
1.3 - Data sharing
The data from the monitoring programs and surveys are freely available to users upon request, and much can be found in reports published at hi.no. Contaminant data are summarised online in Sjømatdata (Seafood data | hi.no), where annual mean, minimum and maximum values for each species and contaminant are presented and updated regularly. Data for the species defined as indicators in the Norwegian management plans (Meld. St. 20 (2019–2020) (regjeringen.no)) are reported regularly at miljostatus.no (Havindikatorer - indikatorer for tilstanden i havet (miljodirektoratet.no)), separately for each of the sea areas North Sea and Skagerrak, Norwegian Sea and Barents Sea. Data are submitted to scientific bodies that conduct comprehensive risk assessments and give advice on food safety, such as The Norwegian Scientific Committee for Food and Environment (VKM), The European Food Safety Authority (EFSA) and The Food and Agriculture Organization of the United Nations (FAO). The collected data on seafood is essential when new regulatory maximum levels in food and feed are being developed within the EU and is shared through the EFSA Call for data system.
1.4 - Contaminants found in fish and other seafood
A short description of important contaminants found in fish and other seafood is given in fact box 1.
For fish and other seafood, MLs have been set in EU and Norway (Commission regulation (EU) 2023/915; Forskrift om visse forurensende stoffer i næringsmidler, 2015) for Hg, Cd, lead (Pb), PFAS (perfluorooctanoic acid (PFOA), perfluorooctanesulfonic acid (PFOS), perfluorononanoic acid (PFNA), perfluorohexanesulfonic acid (PFHxS) and the sum of these), sum dioxins (PCDD/F), sum dioxins and dl-PCBs (PCDD/F+dl-PCB), and sum non-dioxin-like PCBs (PCB6). MLs have also been set for benzo(a)pyrene (BaP) and sum 4 PAH (polyaromatic hydrocarbons), but for fish and crustaceans these MLs only apply to smoked products (Table 2).
TWI-values have been established for many contaminants based on their toxicity. TWI gives the amount of a substance that a person can consume weekly per kilogram of bodyweight over a lifetime without risk of adverse health effects. An overview of TWI for substances considered here is given in Table 3.

Fact box 1. Description of important contaminants found in fish and other seafood
| Contaminant |
Fish muscle |
Fish liver |
Bivalves |
Crustaceans* |
| Mercury (mg/kg ww) |
0.3/0.5/1.0** |
|
0.5 |
0.5 |
| Cadmium (mg/kg ww) |
0.05/0.1** |
|
1.0 |
0.5 |
| Lead (mg/kg ww) |
0.30 |
|
1.5 |
0.5 |
| Sum dioxins and furans (ng 2005-TEQ/kg ww) |
3.5 |
|
3.5 |
3.5 |
| Sum dioxins, furans and dl-PCBs (ng 2005-TEQ/kg ww) |
6.5/ 10** |
20 |
6.5 |
6.5 |
| Sum non-dl- PCBs, PCB6 (µg/kg ww) |
75/ 125/200/ 300** |
200 |
75 |
75 |
| PAH: Benzo(a)pyrene (µg/kg ww) |
2.0/ 5.0** (smoked) |
|
5.0 (6.0 smoked) |
2.0 (smoked) |
| Sum 4 PAH (µg/kg ww) |
12.0/ 30.0** (smoked) |
|
30 (35 smoked) |
12.0 (smoked) |
| Sum 4 PFAS (µg/kg ww) |
2.0/8.0/45** |
|
5.0 |
5.0 |
| PFHxS (µg/kg ww) |
0.20/1.5** |
|
1.5 |
1.5 |
| PFOS (µg/kg ww) |
2.0/7.0/35** |
|
3.0 |
3.0 |
| PFOA (µg/kg ww) |
0.20/1.0/8.0** |
|
0.70 |
0.70 |
| PFNA (µg/kg ww) |
0.5/2.5/8.0** |
|
1.0 |
1.0 |
Table 2. Maximum levels (MLs) for different contaminants in EU and Norway (Commission regulation (EU) 2023/915; Forskrift om visse forurensende stoffer i næringsmidler, 2015). Only MLs applying to species occurring in Norwegian waters are shown. MLs applicable in other countries, may be found in De Witte et al., 2022.
Abbreviations: ww (wet weight), TEQ (toxic equivalent)
*ML applies to muscle of legs and claws
**Depending on species
Abbreviations: TEQ (toxic equivalent), bw (body weight)
1.5 - Aim of the work
The aim of this work was to prepare an overview of current knowledge about contaminants in wild-caught fish and other seafood and perform a risk-based prioritization of seafood species as a basis for preparation of risk-based control plans to be implemented by the NFSA for wild-caught Norwegian seafood.
Chemical contaminants in seafood may constitute a potential health risk. Therefore, we aimed to compile existing data for contaminants in various seafood species, including well-documented contaminants and seafood species as well as contaminants and species for which data are lacking. In addition, where available, information about geographical variation of contaminants in seafood was included in the compiled data.
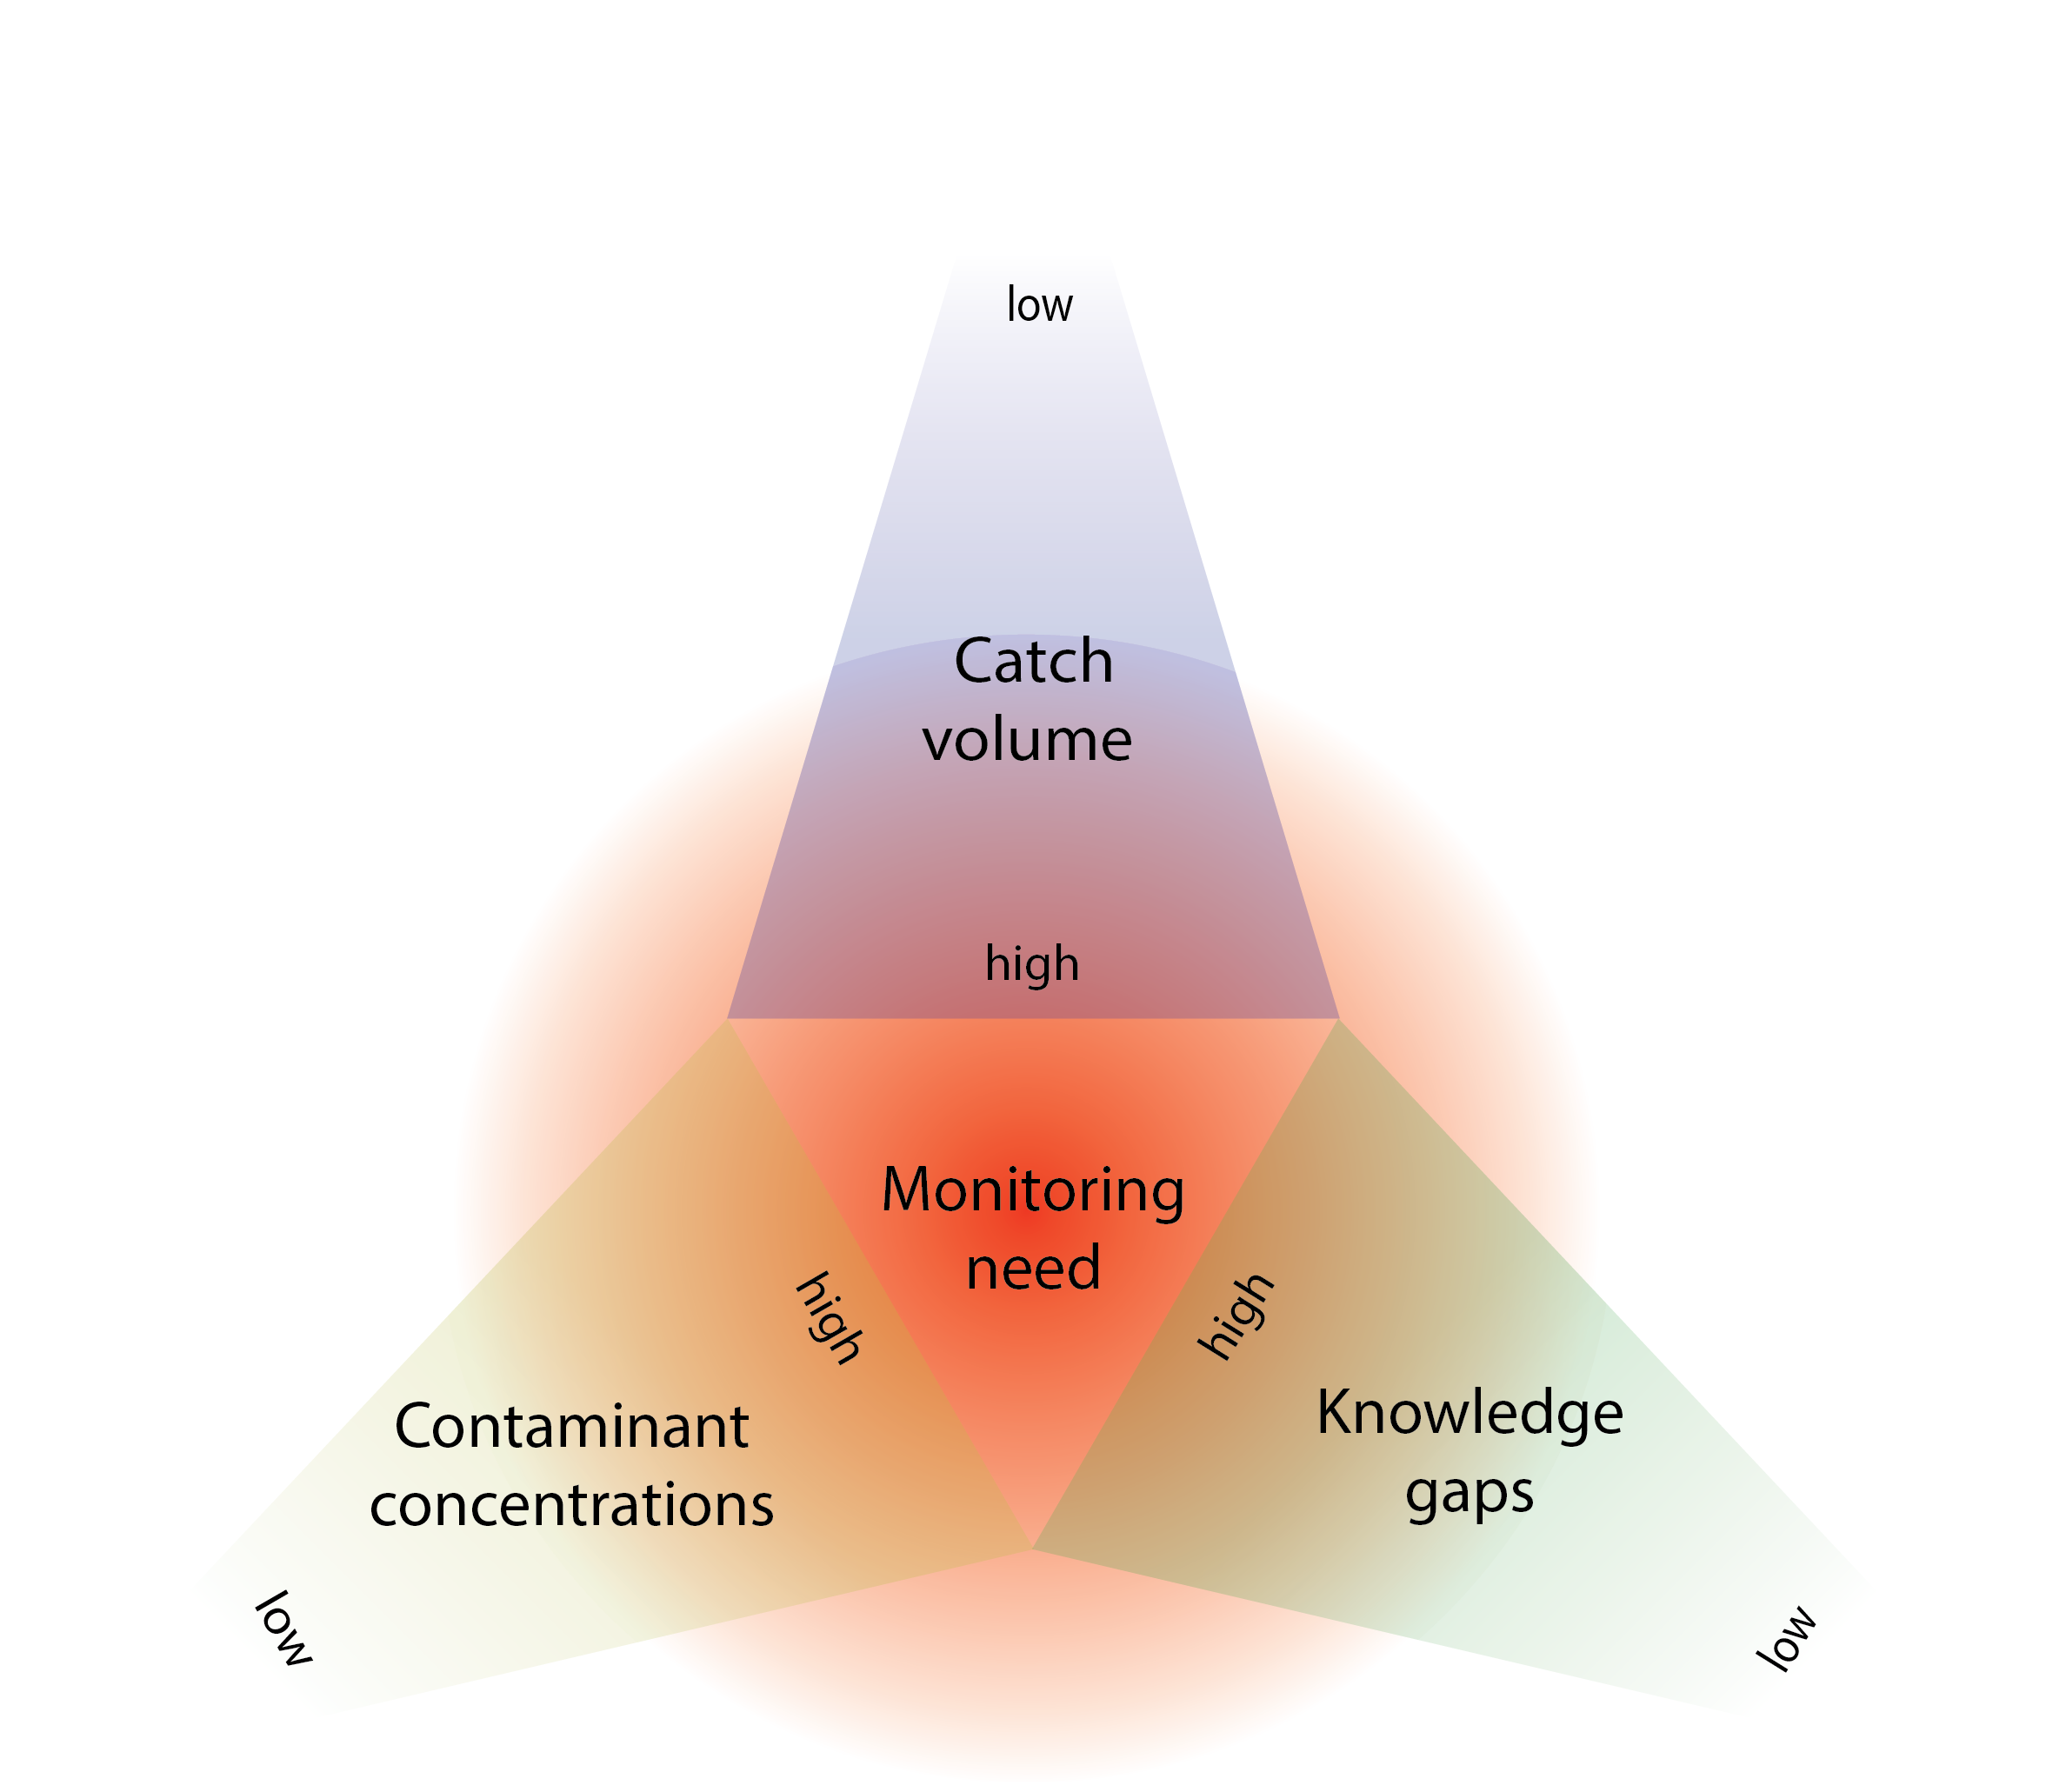
Based on the aggregated existing knowledge, we aimed to identify and prioritize seafood species to be considered for risk-based monitoring. Risk factors included were the potential for high exposure (high catch volumes), potential for exceeding maximum levels (high contaminant levels), potential for exceeding tolerably weekly intake (high contaminant levels), and potential risks due to knowledge gaps (insufficient data).
3 - Results and discussion
3.1 - Potential for high exposure due to high catch volumes
Data on catch volumes were obtained from the Norwegian Directorate of Fisheries (Appendix Table A9). Fish species with catch volumes >100 000 tons are Atlantic herring (Clupea harengus), Atlantic mackerel (Scomber scombrus), Atlantic cod (Gadus morhua), saithe (Pollachius virens), and haddock (Melanogrammus aeglefinus). These species generally have concentrations of contaminants below EU’s current MLs in fish fillet, but because of their large catch volumes and frequent consumption, these species may contribute more than most other fish species to the total intake of some contaminants. Therefore, it is crucial to monitor and document the levels of contaminants in these species regularly.
3.1.1 - Atlantic herring
Norwegian spring spawning (NSS) herring: The NSS herring has relatively low levels of contaminants compared to other herring stocks, and all individual fish had concentrations below MLs (Frantzen et al., 2009, Frantzen et al., 2011, Frantzen et al., 2015). However, because it is a fatty fish species, concentrations of lipid-soluble contaminants such as PCBs, dioxins and polybrominated diphenyl ether (PBDE)s are higher than for the lean fish species. The NSS herring stock migrates seasonally between feeding areas in the Norwegian Sea, wintering areas off Northern Norway and spawning areas off the Norwegian coast (primarily north of 62°N). Levels of organic contaminants varied seasonally (and hence geographically) and were highest in February-March when the herring were in the spawning areas. Follow-up monitoring every third year since 2011 has focused on this season as worst-case scenario.
North Sea herring: North Sea herring has generally low levels of contaminants compared to other fish species with some exceptions. The baseline study revealed higher levels of dioxins and dl-PCBs in local spring spawning herring from the coast of Telemark with several fish exceeding the MLs, possibly originating from a local source of pollution. For North Sea herring from the open sea the baseline study found organic contaminants close to the MLs in autumn samples from the southern areas of the North Sea but outside the Norwegian fishery area, and one single fish exceeding the ML for dioxins and furans (PCDD/F) (Duinker et al., 2012). A few concentrations close to the ML for Cd were found in autumn samples from the northern North Sea in fish after spawning. Based on this, sampling every third year is recommended targeting worst-case scenarios, with samples of both mature fish during autumn in the southern areas of the Norwegian fishery and autumn samples of fish after spawning in the northern North Sea. No concentrations above the MLs have been found in follow-up monitoring performed every third year since 2014.
3.1.2 - Atlantic mackerel
Atlantic mackerel of the Northeast Atlantic mackerel stock generally has concentrations of contaminants below MLs but has shown a marked geographical variation (Frantzen et al., 2010; Frantzen et al., 2024a). Fillet from the Skagerrak has higher concentrations of Hg, dioxins and dl-PCB and non-dl-PCBs than mackerel from all other areas. Mackerel is a fatty fish species, and the concentrations of lipid-soluble contaminants are considerably higher than for the lean fish species. Because of higher levels in the Skagerrak than in other areas, follow-up monitoring was given a higher frequency in the Skagerrak than in the North Sea, with annual sampling in the Skagerrak and sampling every third year since 2013 in the North Sea. In addition, mackerel from the Norwegian Sea was included in the follow-up monitoring with annual sampling from 2016. Because sampling in baseline studies and follow-up monitoring focused on areas where the highest volumes are caught in fisheries, there is a lack of information on levels of contaminants in mackerel captured in coastal areas.
3.1.3 - Atlantic cod
Fillet of cod has low levels of contaminants, where Hg is the contaminant which is closest to the ML (Julshamn et al., 2012a, Julshamn et al., 2013b, c). The largest cod stock in Norwegian fisheries is the Northeast Arctic cod in the Barents Sea where the lowest levels are found. Fjord areas in southern Norway and the North Sea have smaller stocks but three times higher levels of Hg, around 0.1-0.2 mg/kg ww. For the North Sea, 6.4% of individual fishes sampled during the period 2017-2021 have exceeded the ML for Hg of 0.3 mg/kg. Cod is a lean fish species, and the concentrations of lipid-soluble organic contaminants in cod fillet is therefore very low, well below the MLs. For liver, the concentrations of organic contaminants are much higher, and monitoring in 2017-2021 showed that both the North Sea and the Norwegian Sea have relatively high proportions of individual fish liver samples above the ML for dioxins and dl-PCBs, whereas fish liver from the Barents Sea have lower levels with only a small proportion (<1%) above the ML for dioxins and dl-PCBs.
Based on the results from the baseline study and due to the size of the fishery, follow-up monitoring for cod have been performed annually with samples collected from all three ocean areas. In the first years of annual monitoring, samples were collected from four positions in the Barents Sea, two in the Norwegian Sea and four in the North Sea which has the smallest fishery but the highest concentrations of contaminants. In 2018, the monitoring program for cod was evaluated, and based on results obtained so far, a reduced number of positions was considered sufficient for continued monitoring. From 2018 onwards, samples were collected from two positions in the Barents Sea, one position in the Norwegian Sea and two positions in the North Sea.
3.1.4 - Saithe
The levels of contaminants in fillet of saithe are generally low and well below the MLs (Nilsen et al., 2012, Nilsen et al., 2013). For Hg in fillet, there is a marked geographical variation with highest levels in Skagerrak, medium levels in the North Sea and Norwegian Sea and lowest levels in the Barents Sea, but in all areas the mean concentrations are well below the ML. Since saithe is a lean fish, the levels of organic contaminants in fillet are very low, far below the MLs. However, in liver, the levels of organic contaminants are high, with 18% of the individual fish above the ML for sum dioxins and dl-PCB in the period 2017-2021. The levels in liver follow the same geographical pattern as the levels in fillet with highest levels in Skagerrak, medium levels in the North Sea and the Norwegian Sea, and lowest levels the Barents Sea. Annual monitoring for saithe has been performed in all the four marine areas, with one position in Skagerrak (low fisheries, but highest level of contaminants, worst case scenario), one position in the North Sea, and two positions in both the Norwegian Sea and the Barents Sea where most of the commercial fisheries take place.
3.1.5 - Haddock
The levels of contaminants in fillet of haddock are generally low. No individual had concentrations above the MLs for fish for human consumption in EU and Norway (Kögel et al., 2021). The levels of Hg in fillet from the North Sea was somewhat higher than from the Norwegian Sea and Barents Sea, with a pattern resembling the one observed earlier for cod. The concentrations of total As were, with an average of 10.6 mg/kg, somewhat higher than the levels reported in cod, saithe and Greenland halibut. There were no prominent geographical variations in the levels of total As. Concentrations of dioxins, furans, dl-PCB and PCB6 in haddock liver were relatively high compared to MLs, with the average sum of dioxins/furans and dl-PCB in total just above the ML, while average concentrations of PCB6 concentrations were above the MLs only at several geographically distinct stations. On average, these levels were still lower than reported earlier for cod.
3.2 - Potential for exceeding maximum levels
Based on results from earlier monitoring (Appendix Tables A2-A8), a potential for exceeding MLs have been identified for some species, as described below. Regarding metals in fillet, a few fish species have a potential for exceeding the ML for Hg, either in general or in specific areas. Regarding lipid-soluble organic contaminants in fish fillet, only a few large fatty fish species show a potential for exceeding the MLs for the sum of dioxins and dl-PCBs, the sum of dioxins or the sum of PCB6. Fish liver, on the other hand, particularly of lean fish species, often exceed MLs for the organic contaminants. In brown crab, Cd may leak from brown meat to claw meat during cooking in water, and cause exceedance of the ML which only applies to muscle meat from appendages. Reliable results for PFAS have been limited due to low sensitivity of earlier analytical methods, but recent results using a more sensitive analytical method show that a few species have a potential for exceeding one or more MLs for PFAS.
3.2.1 - Tusk
Fillet of tusk (Brosme brosme) has relatively high levels of Hg, and 19% of individual fish in the baseline study (2013-2016) had concentrations above ML (Frantzen and Maage, 2016). In some areas, mean levels were above ML, e.g., western Norwegian fjords including Hardangerfjord, Sognefjord and Boknafjord. In all areas except the Barents Sea, a significant portion of the tusk exceeded the ML for Hg. Also tusk from Vestfjorden and Skagerrak had mean fillet concentrations of Hg above ML. Fillets had very low levels of all other analysed contaminants.
More than 10% of tusk samples exceeded ML for Hg in fillet. Score: 2
Liver has high levels of lipid-soluble organic contaminants, and dioxins and dl-PCBs and PCB6 were above the MLs in 61% and 54%, respectively, of 56 pooled liver samples included in the baseline study. Mean levels of dioxins and dl-PCB were above ML in liver from both fjords, coastal areas and open sea of the North Sea, Skagerrak and the Norwegian Sea.
3.2.2 - Atlantic halibut
Large individuals of Atlantic halibut (Hippoglossus hippoglossus) may have very high concentrations of organic contaminants and Hg in fillet, often far exceeding the MLs in the largest individuals. The Norwegian Directorate of Fisheries has therefore prohibited fishing of Atlantic halibut over 100 kg (2 m length), in all Norwegian marine areas, due to the high risk of exceeding MLs for organic contaminants. In general, the levels of Hg and organic contaminants in Atlantic halibut are higher than in many other fish species, and of more than 500 fish investigated in the period 2013-2019, 4.1% exceeded the ML for Hg and 2.2% exceeded the ML for dioxins and dl-PCBs in fillet (B-cut) (Nilsen et al., 2016, Nilsen et al., 2019, Nilsen et al., 2020a). There is a clear geographical variation, and the highest concentrations of both Hg and organic contaminants were found in an area in Ytre Sklinnadjupet in the Norwegian Sea, where 25% of the halibut exceeded the ML for Hg (1.0 mg/kg ww for this species) and 5.6% exceeded the ML for dioxins and dl-PCB. Due to the high levels of contaminants, the Norwegian Directorate of Fisheries closed this area for halibut fishing starting in 2017, to reduce the risk of fish entering the market with concentrations exceeding the MLs.
Halibut from Skagerrak and the North Sea may also contain high levels of both Hg and organic contaminants, but the data from this sea area is extremely limited (only nine individuals analysed), and more data is needed to properly evaluate the potential for exceeding maximum levels for halibut in this geographical area.
Recent analyses of PFAS showed that 1 of 18 analysed samples of halibut muscle (5.5%) had concentrations exceeding the ML for the sum of 4 PFAS (Frantzen et al., 2024b). The halibut sample exceeding this ML were originally sampled in Ytre Sklinnadjupet.
Between 1% and 10% of fish exceeded the MLs for Hg, dioxins and dl-PCBs and/or PFAS. Score: 2.
3.2.3 - Greenland halibut
In the baseline study of Greenland halibut (Reinhardtius hippoglossoides) during 2006-2008 (Nilsen et al., 2010), high levels of both Hg and organic contaminants in fillet were observed, with 8% of the fish exceeding the ML for Hg and 24% of the fish exceeding the ML for dioxins and dl-PCB. There was large geographical variation, and the highest levels of Hg were found in fish caught between Bjørnøya and the area west of Svalbard, while the highest values of organic contaminants were found along the continental shelf edge (Eggakanten) between 66.9°N and 68.5°N. Due to the high levels of dioxins and dl-PCBs, two areas along Eggakanten in the Norwegian Sea were closed for fishing of Greenland halibut from 2011/2012.
Follow-up monitoring along Eggakanten in the Norwegian Sea in 2011-2015 showed significantly lower levels of dioxins and dl-PCB (and Hg) in this area (Nilsen and Måge, 2016), and as a result, the two areas closed for fishing were reopened in 2016.
Annual monitoring of fillet in both the Norwegian Sea and the Barents Sea in 2017-2021 have shown significantly lower levels of Hg and dioxins and dl-PCBs than in the baseline study, but the levels are still high compared to most other species (for Hg, see Bank et al., 2021). About 2.4% of individual fish exceed the ML for sum dioxins and dl-PCB and 2.1% exceeded the ML for Hg. There is still a marked geographical variation with the highest mean levels of sum dioxins and dl-PCB in the area between 67°N and 68°N in the Norwegian Sea, and the highest mean levels of Hg in the area between 67°N and 68°N in the Norwegian Sea and in the area west of Svalbard in the Barents Sea.
Between 1% and 10% exceed MLs for Hg and/or dioxins and dl-PCBs. Score: 2.
3.2.4 - Atlantic bluefin tuna
Irregular and limited monitoring of Atlantic bluefin tuna (Thunnus thynnus, ABFT) was performed since 2016 after reopening the ABFT fishery inside the Norwegian Exclusive Economic Zone (EEZ) in 2014. Only large individuals are caught in Norwegian waters and only fish weighing more than 100 kg were analysed. Large variation of contaminant levels was identified between the different parts of the fillet (Øyan, 2021) and the risk evaluation was performed accordingly. Regarding the lean and fatty white muscle, about 4% of the individual fish exceeded the ML of 1 mg/kg wet weight for Hg, while 33% of the red muscle samples exceeded this ML. Data for dioxins and PCBs is limited. However, the fatty muscle samples of all individuals analysed exceeded the ML for sum dioxins and dl-PCB and PCB6, and one of 15 lean muscle samples exceeded the ML for sum dioxins and dl-PCB.
More than 10% of samples exceeded the ML for Hg and/or dioxins and dl-PCBs. Score: 3.
3.2.5 - Blue ling
A limited number of blue ling (Molva dypterygia) were collected as bycatch in the baseline study for tusk and ling in 2013-2016, and the results showed high levels of Hg in fillet with 73% of 66 individual fish exceeding the ML for Hg. Blue ling is a lean fish species, and the levels of organic contaminants in fillet were low, far below the MLs for dioxin, dioxins and dl-PCBs and PCB6.
More than 10% of samples exceeded the ML for Hg. Score: 2.
Liver of blue ling had high levels of organic contaminants, with dioxins and dl-PCBs and PCB6 exceeding the MLs in 100% and 89% of the 10 pooled liver samples, respectively.
3.2.6 - European plaice
In the baseline study, fillet samples of 0.89% of individual plaice (Pleuronectes platessa) exceeded the current ML for Hg of 0.3 mg/kg. At the time of the baseline study, no fish exceeded the ML which then was 0.5 mg/kg for plaice, so the risk of exceeding ML has increased with the recent changes in the EU regulation.
Recent analyses showed that 1 of 30 analysed samples of plaice muscle (3.3%) had concentrations of PFNA and the sum of 4 PFAS exceeding the maximum levels of 2.5 and 8.0 µg/kg, respectively (Frantzen et al., 2024b).
Between 1% and 10% of fillet samples exceeded MLs for Hg and/or PFAS. Score: 1.
3.2.7 - Brown crab
For crabs, the MLs only apply to muscle meat of the appendages, which have much lower Cd concentrations than the brown meat (hepatopancreas). In freshly cooked brown crabs (Cancer pagurus), claw meat of about 5% of the individual crabs exceeded the ML for cadmium. This is, however, due to leakage from hepatopancreas to claw meat during cooking (Wiech et al., 2017). In crabs which were sampled without cooking in 2015, no samples of claw meat had Cd levels above ML. A significant difference in Cd levels was found between crabs from Northern and Southern Norway (Wiech et al., 2020).
Between 1% and 10% of claw meat from cooked crab were above ML for Cd. Score: 1.
3.2.8 - Atlantic cod
In the follow-up monitoring in 2017-2021, fillet samples of 2.6% of individual cod (from all areas combined) exceeded the ML for Hg of 0.3 mg/kg. In the North Sea, 6.4% of individual cod exceeded the ML, whereas no individual fish from the Barents Sea or the Norwegian Sea had concentrations above the ML.
Between 1% and 10% of fish exceeded the MLs for Hg. Score: 1.
Liver of cod has relatively high levels of organic contaminants, especially in the North Sea and Norwegian Sea. Monitoring in 2017-2021 showed that 39% of the individual fish from the North Sea and 61% of the fish from the Norwegian Sea had liver concentrations of dioxins and dl-PCBs above the ML, whereas less than 1% of the fish from the Barents Sea exceeded this ML. For PCB6, 13%, 15% and 0% of the individual fish from the North Sea, Norwegian Sea and Barents Sea, respectively, exceeded the ML for PCB6 in liver.
3.2.9 - Common ling
In the baseline study (2013-2015), where ling (Molva molva) was sampled along with tusk, ling had much lower Hg levels than tusk (Frantzen and Maage, 2016). Still, 4.8% of the fillet samples from all 748 individual fish had concentrations of Hg above ML. Most of the ling exceeding ML were exceptionally large fish sampled in the Skagerrak, where 42% of 50 fish were above the ML. In fjords in Western Norway, 15% of fillet samples were above the ML. In coastal and open sea areas of the North and Norwegian Seas, respectively, 1.0% and 1.7% exceeded ML.
Between 1% and 10% of fillet samples exceeded ML for Hg. Score: 1.
Liver of ling (composite samples only) had levels of dioxins and dl-PCB above ML in 80% of samples, and in Skagerrak and fjords in western Norway, concentrations were above ML in all liver samples.
3.2.10 - Atlantic wolffish
In recent monitoring of Atlantic wolffish (Anarhichas lupus), about 3% of individual fish, originating from different areas, exceeded the ML for Hg.
Between 1% and 10% of samples exceeded the ML for Hg. Score: 1.
3.2.11 - Anglerfish
In the baseline study, fillet samples of 10.5% of individual anglerfish (Lophius piscatorius) exceeded the current ML for Hg of 0.5 mg/kg. In the North Sea area, 17% of the fish exceeded the ML, and the highest levels were found along the coast. No single station had a mean Hg level above 0.5 mg/kg. At the time of the baseline study, not one fish exceeded the ML which then was 1.0 mg/kg for anglerfish, so the risk of exceeding ML has increased with the recent changes in the EU regulation.
More than 10% of individual fish exceeded ML for Hg. Score: 2.
Liver of anglerfish exceed ML for sum dioxins and dl-PCBs and sum PCB6 in 76% and 42% of samples, respectively.
3.2.12 - Pollack
In the baseline study, fillet samples of 1.7% of individual pollack (Pollachius pollachius) exceeded the current ML for Hg of 0.3 mg/kg. In the North Sea area, 4% of the fish exceeded the ML. At the time of the baseline study, no fish exceeded the ML which then was 0.5 mg/kg for pollack, so the risk of exceeding ML has increased with the recent changes in the EU regulation.
Between 1% and 10% of individual fish exceeded ML for Hg. Score: 1.
Liver of pollack exceed ML for sum dioxins and dl-PCBs and sum PCB6 in 44% and 22% of samples, respectively.
3.2.13 - Norway lobster
About 2% of the sampled individuals of Norway lobster (Nephrops norvegicus) exceeded the ML for Hg in muscle meat. The monitoring was mainly based on North Sea and coastal areas.
Between 1% and 10% of muscle samples exceeded MLs for Hg. Score: 1.
3.2.14 - European lobster
The limited data on lobster (Homarus gammarus) collected from four coastal stations indicated that about 2-3% of the sampled individuals exceeded the ML for Hg in muscle meat.
Between 1% and 10% of muscle samples exceeded MLs for Hg. Score: 1.
3.3 - Potential for exceeding the tolerable weekly intake (TWI) levels
Tolerable weekly intake (TWI) levels have been estimated by EFSA as a recommendation of how much of a substance a person can consume each week, without negative health effects. In this study, the potential for exceeding TWIs was evaluated regarding TWIs for dioxins and dl-PCBs, MeHg, Cd and PFAS, and the evaluation was based on results from earlier monitoring (Appendix Tables A2, A3, A6 and A8).
For some substances and seafood types, or seafood caught in particular areas, TWIs can be exceeded for individuals consuming the amounts recommended by the authorities. This particularly applies to individuals who often consume fish caught recreationally or for sustenance in their local area, or those who frequently consume the same seafood species. The Norwegian Directorate of Health recommends two to three portions of fish each week, corresponding to 300-450 g fish. At least 200 g should be fatty fish.
For dioxins and dl-PCB, a relatively new TWI of 2 pg TEQ/kg body weight (Knutsen et al., 2018b) greatly reduced the amount of fatty seafood that can be eaten without risk of exceeding the TWI. For many fatty or semi-fatty fish species, a consumption of less than 200 g fillet per week can lead to exceedance of TWI for dioxins and dl-PCBs (Table 4a).
To calculate the potential for exceeding TWI with regard to Hg, the TWI for MeHg of 1.3 µg/kg bw has been used, with concentrations of total Hg as a proxy for MeHg. For a person of 70 kg bodyweight to exceed TWI for Hg with consumption of 200 g per week, a mean concentration of about 0.5 mg/kg is required (Table 4b). Thus, the lists of species with high risk for exceeding the TWI and the ML for Hg only partly overlap. Only the species with the highest risks of exceeding the ML, will lead to exceedance of the TWI.
Regarding Cd, crustaceans and molluscs tend to accumulate this heavy metal in their hepatopancreas, and TWI for Cd of 2.5 µg/kg bw may be exceeded for people consuming these particular organs. Fish fillet in general has very low concentrations of Cd.
With regard to PFAS, a TWI of 4.4 ng/kg body weight per week has been set by EFSA for the sum of four PFAS (PFOS, PFOA, PFNA and PFHxS; EFSA, 2020). These compounds have been determined in a wide range of species collected between 2007-2021, but unfortunately, the analytical methods used have been less than optimal, with varying and often quite high LOQ-values for each of the compounds. In 2023, PFAS were determined in 206 samples from 18 different species of fish and shrimp, using a more sensitive analytical method (Frantzen et al., 2024b). These data have been used to calculate the amount that can be consumed before exceeding the TWI.
3.3.1 - Tusk
Hg: For tusk fillet from the Skagerrak and in fjords bordering the North Sea, 142 and 149 g can be consumed before exceeding the TWI (Table 4b).
For tusk fillet from Skagerrak or North Sea fjords, the TWi for Hg may be exceeded by consumption of less than 200 g. Score: 1.
3.3.2 - Atlantic halibut
Dioxins and dl-PCBs: Levels vary between different parts of the fillet, with the highest levels in the fattier part, the I-cut, and significantly lower levels in a leaner part of the fillet, the B-cut. For both parts of the fillet, consumption of less than 200 g per week can result in exceeding the TWI. Depending on sea area, only 58-100 g B-cut or 25-47 g I-cut may be consumed before exceeding the TWI (Table 4a). The levels of organic contaminants in halibut increase with fish size, and for fish between 40-100 kg, only about 60 g B-cut may be consumed, whereas up to 150 g B-cut may be consumed from fish below 40 kg before exceeding the TWI.
For halibut fillet, the TWI for dioxins and dl-PCBs may be exceeded by consumption of less than 200 g. Score: 1.
3.3.3 - Greenland halibut
Dioxins and dl-PCBs: Levels vary between sea areas, but even for the Barents Sea, where the levels are the lowest, only about 80 g fillet may be consumed before exceeding the TWI (Table 4a).
For Greenland halibut fillet, the TWI for dioxins and dl-PCBs may be exceeded by consumption of less than 200 g. Score: 1.
3.3.4 - Atlantic bluefin tuna
Dioxins and dl-PCBs: Levels vary considerably between different parts of the fillet with higher levels in the fatty parts. However, even for the leanest parts, a consumption of about 40 g will lead to an exceedance of the TWI (Table 4a).
Hg: The levels of Hg vary considerably between different parts of the fillet. Of red muscle meat, containing the highest concentrations, only about 75 g can be consumed before exceeding the TWI, while about 135 g and 150 g of white lean and fatty muscle could be consumed weekly respectively before exceeding the TWI (Table 4b).
For tuna fillet, the TWI for both dioxins and dl-PCBs and Hg may be exceeded by consumption of less than 200 g. Score: 2.
3.3.5 - Blue ling
Hg: Of blue ling fillet from all areas combined, 169 g per week can be consumed before exceeding the TWI. Only 66 samples were analysed (Table 4b).
For blue ling fillet, the TWI for Hg may be exceeded by consumption of less than 200 g. Score: 1.
3.3.6 - European plaice
PFAS: The new data from 2023 (n=30) indicates that 181 g plaice fillet can be consumed before exceeding TWI (Appendix Table A8).
For plaice fillet, the TWI for PFAS may be exceeded by consumption of less than 200 g. Score: 1.
3.3.7 - Brown crab
Dioxins and dl-PCBs: Based on measurements of brown meat from frozen and boiled crabs, only about 40 g can be consumed before exceeding the TWI (Table 4a).
Cd: Because of high levels in hepatopancreas, brown and inner meat contain high levels of Cd. Before and after cooking, only about 15 and 30 g, respectively, can be consumed before exceeding the TWI (Appendix Table A3). A clear trend of higher levels in the north compared to the south of Norway has been identified. As also other large crustaceans tend to efficiently accumulate Cd in their hepatopancreas, it can be assumed that the hepatopancreas of both European lobster and Norway lobster contain high levels. There is at present little data to confirm this.
PFAS: 68 g hepatopancreas from brown crab may be consumed before exceeding the TWI (Appendix Table A8).
For crab brown meat, the TWI for both dioxins and dl-PCBs, Cd and PFAS may be exceeded by consumption of less than 200 g. Score: 2.
3.3.8 - Atlantic mackerel
Dioxins and dl-PCBs: For mackerel from all areas combined, 144 g fillet per week can be consumed without exceeding the TWI. For Skagerrak, only 88 g per week can be consumed, while for the North Sea, Norwegian Sea and Barents Sea, 189, 237 and 241 g fillet per week, respectively, can be consumed without exceeding the TWI (Table 4a).
For fillet of mackerel caught in Skagerrak and the North Sea, the TWI for dioxins and dl-PCBs may be exceeded by consumption of less than 200 g. Score: 1.
3.3.9 - European sprat
Dioxins and dl-PCBs: European sprat (Sprattus sprattus) has been analysed as whole fish, and only 88 g of whole sprat may be consumed before exceeding the TWI (Table 4a).
For sprat fillet, the TWI for dioxins and dl-PCBs may be exceeded by consumption of less than 200 g. Score: 1.
3.3.10 - Atlantic salmon
Dioxins and dl-PCBs: Around 140 g fillet of wild caught Atlantic salmon (Salmo salar) may be consumed before exceeding the TWI (Table 4a).
For salmon fillet, the TWI for dioxins and dl-PCBs may be exceeded by consumption of less than 200 g. Score: 1.
3.3.11 - Greater argentine
Dioxins and dl-PCBs: Levels in greater argentine (Argentina silus) deviated particularly in one sample from Osterfjorden with significantly higher values. Only about 30 g of fillet originating from this fjord can be consumed before exceeding the TWI (Table 4a). For greater argentine from the North Sea and Norwegian Sea, about 145 g can be consumed before exceeding TWI.
For fillet of greater argentine, the TWI for dioxins and dl-PCBs may be exceeded by consumption of less than 200 g. Score: 1.
3.3.12 - Beaked redfish
Dioxins and dl-PCBs: The levels in beaked redfish (Sebastes mentella) are higher in the Norwegian Sea than in the Barents Sea, where most of the commercial fisheries takes place. For fish from the Norwegian Sea, only about 150 g fillet may be consumed, but for fish from the Barents Sea, around 250 g fillet may be consumed before exceeding the TWI (Table 4a).
For fillet of beaked redfish caught in the Norwegian Sea, the TWI for dioxins and dl-PCBs may be exceeded by consumption of less than 200 g. Score: 1.
3.3.13 - Spotted wolffish
Dioxins and dl-PCBs: About 160 g of spotted wolffish (Anarhichas minor) can be consumed before exceeding the TWI (Table 4a).
For spotted wolffish fillet, the TWI for dioxins and dl-PCBs may be exceeded by consumption of less than 200 g. Score: 1.
3.3.14 - Atlantic herring
Dioxins and dl -PCBs: Around 160 g fillet for Norwegian spring spawning (NSS) herring and 198 g for North Sea (NS) herring can be consumed before exceeding the TWI (Table 4a).
For fillet of herring, the TWI for dioxins and dl-PCBs may be exceeded by consumption of less than 200 g. Score: 1.
3.3.15 - Atlantic horse mackerel
Dioxins and dl-PCBs: For horse mackerel (Trachurus trachurus) from the North Sea (N=50 samples), 157 g fillet per week can be consumed without exceeding the TWI (Table 4a).
For horse mackerel fillet, the TWI for dioxins and dl-PCBs may be exceeded by consumption of less than 200 g. Score: 1.
3.3.16 - European hake
Dioxins and dl-PCBs: Levels in hake (Merluccius merluccius) vary between sea areas, with highest levels in the Norwegian Sea. Consumption of more than 170 g fillet from the Norwegian Sea can lead to exceedance of TWI, whereas around 290 g and 320 g fillet may be consumed before exceeding the TWI for hake from Skagerrak and the North Sea, respectively (Table 4a).
For fillet of hake caught in the Norwegian Sea, the TWI for dioxins and dl-PCBs may be exceeded by consumption of less than 200 g. Score: 1.
3.3.17 - Fish liver
Dioxins and dl-PCBs: For various fish species, 2-44 g fish liver per week can lead to exceedance of TWI (Appendix Table A6). The highest levels of dioxins and dl-PCB are found in liver of lean fish species (cod, saithe, haddock, tusk, ling, pollack).
For liver of most fish species, the TWI for dioxins and dl-PCBs may be exceeded by consumption of less than 200 g.
| Species |
Catch volume (ton) |
Organ |
Geographical area |
N |
Sum PCDD/F+dl-PCB (ng TEQ/kg ww) |
Amount consumed (g) at TWI |
| Atlantic bluefin tuna |
101 |
Fatty muscle |
Skagerrak, North Sea, Norwegian Sea |
6 |
13 |
11 |
| |
|
Lean muscle incl. neck |
Skagerrak, North Sea, Norwegian Sea |
15 |
4.1 |
34 |
| |
|
Red muscle |
Skagerrak, North Sea, Norwegian Sea |
5 |
3.3 |
42 |
| Atlantic halibut |
2 845 |
Fillet, B-cut |
Barents Sea |
132 |
1.6 |
88 |
| |
|
Fillet, B-cut |
Norwegian Sea |
365 |
1.4 |
100 |
| |
|
Fillet, B-cut |
Skagerrak, North Sea |
9 |
2.4 |
58 |
| |
|
Fillet, I-cut |
Barents Sea |
125 |
3.0 |
47 |
| |
|
Fillet, I-cut |
Norwegian Sea |
272 |
4.4 |
32 |
| |
|
Fillet, I-cut |
Skagerrak, North Sea |
8 |
5.5 |
25 |
| Greenland halibut |
17 099 |
Fillet |
Barents Sea |
299 |
1.7 |
82 |
| |
|
Fillet |
Norwegian Sea |
199 |
2.1 |
67 |
| European sprat |
11 701 |
Whole fish |
Fjords and + some in the North Sea |
47 |
1.60 |
88 |
| Atlantic salmon (wild) |
16 |
Fillet |
Northern Norway |
137 |
1 |
140 |
| Greater argentine |
10 000 |
Fillet |
North Sea, Norwegian Sea, incl. Osterfjord |
290 |
0.97 |
144 |
| |
|
Fillet |
Osterfjord |
25 |
4.5 |
31 |
| Beaked redfish |
32 678 |
Fillet |
Barents Sea |
447 |
0.56 |
249 |
| |
|
Fillet |
Norwegian Sea |
77 |
0.92 |
153 |
| Spotted wolffish |
4 108 |
Fillet |
Norwegian Sea and Barents Sea |
250 |
0.88 |
159 |
| North Sea herring |
130 000 |
Fillet |
North Sea |
172 |
0.71 |
198 |
| NSS-herring |
415 346 |
Fillet |
Norwegian Sea |
98 |
0.86 |
163 |
| Atlantic mackerel |
207 146 |
Fillet |
Barents Sea |
60 |
0.58 |
241 |
| |
|
Fillet |
Norwegian Sea |
247 |
0.59 |
237 |
| |
|
Fillet |
North Sea |
75 |
0.74 |
189 |
| |
|
Fillet |
Skagerrak |
198 |
1.60 |
88 |
| Atlantic horse mackerel |
10 924 |
Fillet |
North Sea |
50 |
0.89 |
157 |
| European hake |
3 977 |
Fillet |
Norwegian Sea |
183 |
0.81 |
172 |
| |
|
Fillet |
North Sea |
570 |
0.43 |
323 |
| |
|
Fillet |
Skagerrak |
25 |
0.49 |
288 |
| Spiny dogfish |
356 |
Fillet |
Skagerrak |
17 |
0.71 |
197 |
| Brown crab |
5266 |
Brown meat |
Coast, Hvaler to Vesterålen |
435 |
3.6 |
39 |
Table 4a. Species with potential for exceeding the TWI for dioxins and dl-PCBs. Catch volume per species in Norwegian fisheries, tissues, geographical areas, number of samples analysed (N), mean concentrations (Sum PCDD/F+dl-PCB), and amount of seafood a person of 70 kg can consume before exceeding the TWI of 2 pg TEQ/kg body weight for sum PCDD/F+dl-PCB, are shown.
Abbreviations: TEQ (toxic equivalent), ww (wet weight), NSS herring (Norwegian spring spawning herring)
| Species |
Catch volume (ton) |
Organ |
Geographical area |
N |
THg (mg/kg ww) |
Amount consumed (g) at TWI for MeHg |
| Atlantic bluefin tuna |
101 |
Fatty muscle |
Skagerrak, North Sea, Norwegian Sea |
2 1 |
0.61 |
149 |
| |
|
Lean muscle incl. neck |
Skagerrak, North Sea, Norwegian Sea |
4 6 |
0.67 |
136 |
| |
|
Red muscle |
Skagerrak, North Sea, Norwegian Sea |
21 |
1.18 |
77 |
| Tusk |
13 143 |
Fillet |
Barents Sea |
278 |
0.11 |
827 |
| |
|
Fillet |
Norwegian Sea |
684 |
0.27 |
337 |
| |
|
Fillet |
North Sea, open sea and coast |
263 |
0.31 |
294 |
| |
|
Fillet |
North Sea, fjords |
503 |
0.61 |
149 |
| |
|
Fillet |
Skagerrak |
42 |
0.64 |
142 |
| Blue ling |
537 |
Fillet |
Skagerrak, North Sea, Norwegian Sea |
66 |
0.54 |
169 |
Table 4b. Species with potential for exceeding the TWI for MeHg. Catch volume per species in Norwegian fisheries, tissues, geographical areas, number of samples analysed (N), mean concentrations of total Hg (THg)*, and amount of seafood a person of 70 kg can consume before exceeding the TWI of 1.3 µg/kg body weight for MeHg, are shown.
*THg is used as a proxy for MeHg, since MeHg is usually assumed to make up near 100% of the THg content of fish muscle.
3.4 - Knowledge gaps
3.4.1 - Species with insufficient or outdated data (data deficient)
Species with an average annual landing volume of 100 t or more in the period of 2018-2021 (www.fiskeridir.no), were classified as data deficient if the number of measurements of trace elements and organic pollutants (PCDD/Fs +PCBs) was considered too low (< 100 analysed samples) or the data was too old (>10 years). Species identified as data deficient are shown in Table 5. Species used only for industrial processing (feed production), as cleaner fish in aquaculture, or those caught only in sea areas outside Norwegian waters, were not considered.
| Species Norwegian/English (latin) |
Catch volume (t) |
N (metals) |
N (dioxins and PCBs) |
Year of most recent data |
Comment |
| Brisling/ European sprat (Sprattus sprattus) |
11 800 |
47 |
47 |
2017 |
|
| Hestmakrell/ Atlantic horse mackerel (Trachurus trachurus) |
11 000 |
50 |
50 |
2017 |
|
| Kongekrabbe/ Red king crab (Paralithodes camtchaticus) |
2060 |
185 |
50 |
2012 |
Old data |
| Hvitting/ Whiting (Merlangius merlangus) |
1 300 |
77 |
5 |
2014 |
|
| Blålange/ Blue ling (Molva dypterygia) |
540 |
66 |
10 |
2016 |
|
| Sjøkreps/ Norway lobster (Nephrops norwegicus) |
434 |
436 (Hg) 201 (other) |
9 |
2021 |
Data insufficient for certain areas |
| Pigghå/ Spiny dogfish (Squalus acanthias) |
360 |
63 |
17 |
2008 |
Data only from Skagerrak |
| Skjellbrosme/ Greater forkbeard (Phycis blennoides) |
350 |
59 |
11 |
2015 |
|
| Gapeflyndre/ American plaice (Hippoglossoides platessoides ) |
320 |
46 |
5 |
Hg: 2017 Dioxins and PCBs: 2006 |
|
| Havmus/ Rabbit fish (Chimaera monstrosa) |
240 |
23 |
12 |
Hg: 2015 Dioxins and PCBs: 2016 |
|
| Knurr/ Gurnard (Eutrigla gurnardus) |
240 |
0 |
0 |
|
|
| Gråskate/ Spinytail skate (Bathyraja spinicauda) |
230 |
0 |
0 |
|
|
| Isgalt/ Roughhead grenadier (Macrourus berglax) |
210 |
0 |
0 |
|
|
| Kloskate/ Starry ray (Amblyraja radiata) |
200 |
11 |
0 |
2017 |
|
| Smørflyndre/ Witch flounder (Glyptocephalus cynoglossus) |
200 |
11 |
0 |
2017 |
|
| Makrellstørje/ Atlantic bluefin tuna (Thunnus thynnus) |
100 |
21/46/18* |
6/15/5* |
2021 |
|
| Hummer/ European lobster (Homarus gammarus) |
< 100 t** |
80 |
22 |
2022 |
|
| Laks (vill)/ Atlantic salmon (wild) (Salmo salar) |
16** |
137 |
137 |
2012 |
Old data |
Table 5. Species with insufficient number of data or outdated data with an annual catch volume above 100 t. Species named in Norwegian and English and the average annual catch volume is given for 2019-2022. Number of samples (N) analysed for metals and dioxins and dl-PCBs are given, respectively, as well as the latest sampling year.
*Partly different tissues from the same individuals.
**Despite commercial catches under 100 tons, wild caught Atlantic salmon (Salmo salar), and European lobster (Homarus gammarus) are included in the table due to significant catches in recreational fisheries.
3.4.2 - Species with insufficient data from certain geographical areas
For some species, certain geographical areas were identified as data deficient. For anglerfish (Lophius piscatorius) we need more data from Western Norway. For Atlantic halibut more data is needed for the North Sea and Skagerrak, and for plaice, we need more data from Skagerrak. Greater argentine from one specific fjord contained high levels of organic pollutants and further fjords should be investigated to find out if the elevated values are specific for this fjord or apply to this species in fjords in general.
Due to their potential high intake of self-caught seafood from coastal areas, recreational and sustenance fishers and their families are a vulnerable group and contaminant data on their catches is crucial to be able to assess their exposure. Recent surveillance of the finfish catches of anglers identified Atlantic cod, saithe, redfish, Atlantic halibut, tusk and Atlantic wolffish in Troms and Atlantic mackerel, saithe, cod, pollack, ling and hake in Hordaland as commonly caught species (Ferter et al., 2022). For these species, coast and fjord data should be gathered as these are the most common fishing grounds. In particular, species that have previously shown elevated levels of one or more contaminants in some coast- and fjord areas, may also have high levels in other so far unexplored fjords and coastal areas, and should therefore be prioritized for such surveys.
High Hg levels with mean concentrations above ML were found in fillet of tusk caught in several fjords in Western Norway, and dietary advices were issued for Hardangerfjord and Sognefjord. In Sognefjord this is not connected to a particular source, and it may be a problem also in many other fjords. Since tusk is captured by recreational fishers in many different fjords, there is a need to collect data from more local fjord areas. In 2024, a survey was performed of tusk sampled in three different data deficient western Norwegian fjords. But there are still a large number of fjords for which there is no data on Hg in tusk.
3.4.3 - Contaminants with insufficient data
For some contaminants there are insufficient data for all species due to lack of adequate analytical methods:
3.4.3.1 - PFAS
TWIs and maximum levels, were set for four PFAS (see Table 2 and 3), but it is challenging to develop a method with a sufficiently low LOQ to match the TWI range and the new MLs. The development of a new method heeding both low LOQ and the multitude of PFAS (>9000 substances) through suspect/non target screening is in progress and financed by IMR and through a project for the Norwegian Research Council. In 2023, 206 fish samples were analyzed with a more sensitive method (Eurofins), but there is still a need for more data to get a comprehensive overview of the PFAS contamination in wild caught fish. For instance, in the baseline study for haddock, a pooled fillet sample was discovered exceeding the TWI by consumption of 62 g per week, indicating a potential for high PFAS-levels in this species. However, in the study from 2023 including only 30 samples of haddock from all areas, no such high concentrations were found, and according to those results more than 850 g of haddock fillet can be consumed per week before exceeding TWI for PFAS.
3.4.3.2 - Plastics and plastic chemicals
Regarding micro- and nanoplastic and plastic chemicals, fish and people have been shown to be contaminated, and mammalian, fish and invertebrate model systems have shown that micro- and nanoplastic can lead to negative effects including effects on growth, reproduction, metabolism, activity, hormonal regulation, organ toxicity, development, intestinal function, oxidative stress, neurofunction and tissue changes (Kögel et al., 2020, Banerjee and Shelver, 2021, Brito et al., 2022, Kögel et al., 2023). Unfortunately, the exact levels of micro- and nanoplastic in fish are unknown due to methodological difficulties owed to the particle nature of this contaminant. While we have detected microplastic of 10 µm to 250 µm size in fish fillet and liver of different species (Gomero et al., 2020), only semi-quantitative methods are available. Reference material is so far lacking and even large international consortia such as BASEMAN and EuroQcharm have so far failed to produce fully quantitative methods for the critical small microplastic size ranges. Considerable method development is needed before the establishment of TWI will be possible. Additionally, plastic chemicals such as bisphenols and phthalates deserve attention, as they often have hormone or brain function disrupting effects at environmentally relevant concentrations (Hamilton et al., 2023, Horodytska et al., 2020). The multitude of 16 000 substances, with 4200 chemicals of concern, because they are persistent, bioaccumulative, mobile and/or toxic, renders method development challenging. Wagner et al. (2025) state that more than 1300 chemicals of concern are known to be marketed for use in plastics and 29–66% of the chemicals used or found in well-studied plastic types are of concern. This means that chemicals of concern can be present in all plastic types. For this, non-target screening method development has been initiated.
3.4.3.3 - Species of As and Hg
There is no maximum level or TWI for As in seafood. As consists of many different chemical species, where inorganic arsenic (arsenite and arsenate) are the most toxic ones. Inorganic arsenic has previously been found in only very low concentrations in fish, even when total As levels were high (Julshamn et al., 2012b). This was recently confirmed with analyses in 2023 of 459 seafood samples from 10 different species (Frantzen et al., 2024b). For molluscs, occasionally high levels of inorganic arsenic are found (Gomez-Delgado et al., 2023), and some species of seaweed are known to have high levels of inorganic arsenic (Duinker et al,. 2020). It is generally assumed that the major part of the arsenic present in seafood is the non-toxic arsenobetaine, but there is little documentation of this in Norwegian species of seafood. Other organic arsenic species may be more problematic than arsenobetaine, and it is therefore also a need for data on organic arsenic species in seafood. The data on inorganic and organic arsenic species are needed for risk assessment and regulatory development in EU.
Hg also exists in different chemical forms, but here the most toxic one, MeHg, is usually assumed to make up near 100% of the total Hg content (THg) of fish muscle. Because THg is much easier and cheaper to analyse than MeHg, it is most often used as a proxy for MeHg when risk assessments are being made based on the TWI for MeHg. This makes for a worst-case scenario when doing the risk assessments. There is, however, very little documentation of actual MeHg levels in Norwegian fish. Earlier, the method used for MeHg determination at IMR was performed separately from the THg determination, and due to the added measurement uncertainties of the two different methods, this sometimes resulted in a percentage MeHg of considerably more than 100% of THg. In 2023, 459 samples of 10 different seafood species were analysed with a new method where both MeHg and THg were determined simultaneously, resulting in a more correct estimate of the percentage contribution of MeHg to the THg concentration (Frantzen et al., 2024b). Muscle tissue of the different fish species had mean percentages MeHg between 96% and 99% of THg. More data on MeHg in more fish species is needed for more accurate risk assessments and regulatory development in EU.
3.4.4 - New resources
New resources include species that do not yet have significant catch volumes but are expected to be of increasing interest as food and feed in the coming decades, or new species in Norwegian waters that have already reached higher catch volumes. Spot-check monitoring of these species was initiated in 2017 to get data preceding commercial exploitation as food and feed.
For macroalgae a data collection was reported to EFSA in 2020 and data were also published as an IMR report (Duinker et al, 2020). Following this, the focus has been processing of two farmed kelp species with iodine reduction and nutrient retention, in addition to spot-check sampling of species with lowest n or highest risk. As there are no MLs for contaminants in macroalgae yet, this group of seafood is not covered in detail here.
Mesopelagic species might be exploited in future, and basic data on nutrients and contaminants is available for some of the most relevant species. Species from Norwegian fjords were found to be nutrient dense (Alvheim et al., 2020). Identified challenges regarding nutrients are: High levels of fluoride in northern krill (Meganyctiphanes norvegica), of wax esters in glacier lantern fish (Benthosema glaciale) and of long-chain monounsaturated fatty acids in Mueller’s pearlside (Maurolicus muelleri) (Wiech et al., 2020). Further investigations are needed to understand geographical and seasonal variations within species (Zhu et al., 2023). Due to the high biodiversity in open waters further contaminant profiling is needed to understand variation between species.
For sea urchins, sea cucumbers, and jellyfish, spot-check monitoring is ongoing, so far with low numbers of analyses (n). No exceedances of ML have been detected so far.
Pacific oysters (Magallana gigas), as invasive species, have been observed for the last ten years. There is increasing interest in harvesting these oysters and they have hence been included in spot-check monitoring. Levels are close to, but below ML for Cd and lower than for European oysters (Ostrea edulis). Specific attention is necessary since they are harvested in more populated areas around the Oslofjord and at the coast of southern Norway. Mapping of dioxins and PCB would also be meaningful, since Pacific oysters in some areas have elevated levels, probably due to local pollution sources.
Recently, harvest of wild stocks of razor shells (Solenidae spp.), cockles (Cerastoderma edule), sand gapers (Mya arenaria) and rayed artemis (Dosinia exoleta) – which are new species for commercial harvest in Norway - has started and spot-check samples of these species are being collected to attain a basis for evaluating the risk of harmful levels of heavy metals.
The fishery of snow crab has developed significantly in a rather limited geographical area. According to the limited existing data, the levels of contaminants are not likely to exceed existing MLs.
A report has been published on the feasibility of a fishery of shore crab (Carcinus maenas) (van der Meeren et al., 2022). As the legal limit only applies to the appendages of crustaceans, no levels above the MLs for elements and organic pollutants have been found based on the limited data gathered so far. However, high consumption of hepatopancreas might lead to an exceedance of the TWI for Cd and dioxins and dl-PCBs. The main use of these crabs is probably for soup, and results from Cd concentrations in shore crab soup indicate low levels of exposure (Knutsen et al., 2018a).
6 - Appendix Table A1 - Surveys of contaminants in seafood from polluted areas
| Area |
Year(s) |
Report |
Funding |
| Jøssingfjord |
2018 |
Bank et al., 2024 |
Ministry of Trade, Industry and Fisheries |
| U-864, Fedje |
2005-2023 |
Måge et al., 2006, 2007, Frantzen et al., 2008, 2010, 2011, 2012, Haldorsen et al., 2013, Frantzen et al., 2014, Frantzen and Måge, 2015, 2016, Frantzen et al., 2018, 2019a, 2019b, 2020, 2021, 2023, 2024 |
The Norwegian Coastal Administration |
| Bergen |
2007-2009 2019-2021 |
Måge and Frantzen, 2008, 2009, Frantzen and Måge, 2009, Kögel et al., 2023 |
County Governor, NFSA |
| Ålesund |
2019-2021 |
Kögel et al., 2023 |
NFSA |
| Grenlandsfjord/Kragerø |
2019-2021 |
Kögel et al., 2023 |
NFSA |
| Førdefjord |
2017 |
Kögel, 2019 |
NFSA |
| Repparfjord and Revsbotn |
2016-2017 |
Kögel et al., 2021 |
IMR |
| Årdalsfjord |
2016 |
Kögel et al., 2017 |
NFSA |
| Frænfjord |
2016 |
Kögel and Maage, 2017 |
Hustad marmor |
| Oslofjord |
2007, 2013-2015 |
Nesje et al., 2007, Kögel et al., 2016 |
MS Trygg, NFSA |
| Vatsfjord |
2013-2014 |
Frantzen and Måge, 2013, Frantzen and Maage, 2014 |
Jacob Hatteland AS |
| Hardangerfjord |
2011, 2021 |
Måge et al., 2012, Måge and Frantzen, 2022 |
NFSA, County Governor |
| Ølenfjord |
2011 |
Sanden and Ørnsrud, 2012 |
NFSA |
| Salten |
2012 |
Ørnsrud and Måge, 2013, Julshamn et al., 2013a |
NFSA |
| Vesterålen |
2012 |
Julshamn et al., 2013b |
Ministry of Trade, Industry and Fisheries |
| Salten - Vesterålen |
2013-2014 |
Frantzen et al., 2015 |
Ministry of Trade, Industry and Fisheries, County of Nordland |
| Tønsberg/Vrengen |
2009 |
Nilsen et al., 2011, Nilsen and Julshamn, 2011, Valdersnes et al., 2017 |
NFSA |
| Sandefjord |
2009 |
Nilsen et al., 2011, Nilsen and Julshamn, 2011, Valdersnes et al., 2017 |
NFSA |
| Kragerø |
2009 |
Nilsen et al., 2011, Nilsen and Julshamn, 2011, Valdersnes et al., 2017 |
NFSA |
| Tvedestrand |
2009 |
Nilsen et al., 2011, Nilsen and Julshamn, 2011, Valdersnes et al., 2017 |
NFSA |
| Lillesand |
2009 |
Nilsen et al., 2011, Nilsen and Julshamn, 2011, Valdersnes et al., 2017 |
NFSA |
| Farsund |
2009 |
Nilsen et al., 2011, Nilsen and Julshamn, 2011, Valdersnes et al., 2017 |
NFSA |
| Flekkefjord |
2009 |
Nilsen et al., 2011, Nilsen and Julshamn, 2011, Valdersnes et al., 2017 |
NFSA |
| Egersund |
2009 |
Nilsen et al., 2011, Nilsen and Julshamn, 2011, Valdersnes et al., 2017 |
NFSA |
| Sandnes |
2009 |
Nilsen et al., 2011, Nilsen and Julshamn, 2011, Valdersnes et al., 2017 |
NFSA |
| Stavanger |
2009 |
Nilsen et al., 2011, Nilsen and Julshamn, 2011, Valdersnes et al., 2017 |
NFSA |
| Karmsundet |
2009 |
Nilsen et al., 2011, Nilsen and Julshamn, 2011, Valdersnes et al., 2017 |
NFSA |
| Narvik |
2009 |
Nilsen et al., 2011, Nilsen and Julshamn, 2011, Valdersnes et al., 2017 |
NFSA |
| Hammerfest |
2009 |
Nilsen et al., 2011, Nilsen and Julshamn, 2011, Valdersnes et al., 2017 |
NFSA |
| Honningsvåg |
2009 |
Nilsen et al., 2011, Nilsen and Julshamn, 2011, Valdersnes et al., 2017 |
NFSA |
| Svolvær |
2008-2009 |
Nilsen et al., 2011, Nilsen and Julshamn, 2011, Valdersnes et al., 2017 |
NFSA |
Table A1. An overview of surveys of contaminants in seafood from Norwegian fjords and harbours, conducted by IMR, year(s) of sampling, reports and funding sources.
References
Bank, M.S., Ho, Q.T., Kutti, T., Kögel, T., Rodushkin, I., van der Meeren, T., Wiech, M. and Rastrick, S. (2024). Multi-isotopic composition of brown crab (Cancer pagurus) and seafloor sediment from a mine tailing sea disposal impacted fjord ecosystem. Journal of Hazardous Materials 471: 134406. https://doi.org/10.1016/j.jhazmat.2024.134406
Frantzen, S., Duinker, A. & Måge, A. (2015). Kadmiumanalyser i taskekrabbe fra Nordland høsten/vinteren 2013 - 2014. NIFES rapport til Nordland fylkeskommune, 21 p. https://imr.brage.unit.no/imr-xmlui/handle/11250/3056937
Frantzen, S., Furevik, D., Ulvestad, B.H. and Måge, A. (2014). Kvikksølvinnhold i fisk og annen sjømat ved vraket av U-864 vest av Fedje. Nye analyser i 2013. NIFES-rapport: 20 p.
Frantzen, S. and Måge, A. (2009). Utvidet kostholdsrådsundersøkelse, Bergen Byfjord 2009. NIFES-rapport: 44 p. https://imr.brage.unit.no/imr-xmlui/handle/11250/3056267
Frantzen, S. and Måge, A. (2013). Metaller og organiske miljøgifter i sjømat fra Vatsfjorden. NIFES-rapport: 27 p.
Frantzen, S. and Måge, A. (2015). Kvikksølv i fisk og annen sjømat ved vraket av U-864 vest av Fedje. Nye analyser i 2014. NIFES-rapport: 24 p. https://www.kystverket.no/globalassets/oljevern-og-miljoberedskap/skipsvrak/u-864/kvikksolvinnhold-i-fisk-og-annen-sjomat-ved-u864.pdf/download
Frantzen, S. and Måge, A. (2016). Kvikksølvinnhold i fisk og annen sjømat ved vraket av U-864 vest av Fedje. Nye analyser i 2015. NIFES-rapport: 31 p.
Frantzen, S. and Maage, A. (2014). Metaller og organiske miljøgifter i sjømat fra Vatsfjorden. NIFES-rapport: 27 p.
Frantzen, S., Måge, A., Furevik, D. and Julshamn, K. (2008). Kvikksølvinnhold i fisk og sjømat ved vraket av U864 vest av Fedje. Nye analyser i 2008 og sammenligning med data fra perioden 2004 til 2007. NIFES-rapport: 20 p.
Frantzen, S., Måge, A., Furevik, D. and Julshamn, K. (2010). Kvikksølvinnhold i fisk og sjømat ved vraket av U864 vest av Fedje - Nye analyser i 2009 og sammenligning av data fra perioden 2004-2008. NIFES-rapport: 18 p.
Frantzen, S., Måge, A., Furevik, D. and Julshamn, K. (2011). Kvikksølv i fisk og annen sjømat ved vraket av U-864 vest av Fedje - Nye analyser i 2010 og sammenligning med perioden 2004 til 2009. NIFES-rapport: 20 p.
Frantzen, S., Måge, A., Furevik, D., Ulvestad, B.H. and Julshamn, K. (2012). Kvikksølvinnhold i fisk og annen sjømat ved vraket av U-864 vest av Fedje - Nye analyser i 2011 og sammenligning med data fra perioden 2004 til 2010. NIFES-rapport: 20 p.
Frantzen, S., Måge, A. and Sanden, M. (2019a). Kvikksølv i sjømat ved U-864: Resultater fra overvåkning i 2018. Rapport fra havforskningen 2019-38: 26 p. https://www.hi.no/hi/nettrapporter/rapport-fra-havforskningen-2019-38
Frantzen, S., Måge, A. and Sanden, M. (2021). Kvikksølv i sjømat ved U-864 — Resultat fra overvåkning i 2020. Rapport fra havforskningen 2021-37: 29 p. https://www.hi.no/hi/nettrapporter/rapport-fra-havforskningen-2021-37
Frantzen, S., Måge, A. and Sanden, M. (2023). Kvikksølv i sjømat ved U-864 - Resultater fra overvåkning i 2021. Rapport fra havforskningen 2023-23: 37 p. https://www.hi.no/hi/nettrapporter/rapport-fra-havforskningen-2023-23
Frantzen, S., Måge, A. and Sanden, M. (2024). Kvikksølv i sjømat ved U-864 - Resultater fra overvåkning i 2022 og 2023. Rapport fra havforskningen 2024-35: 33 p. https://www.hi.no/hi/nettrapporter/rapport-fra-havforskningen-2024-35
Frantzen, S., Maage, A. and Sanden, M. (2020). Kvikksølv i sjømat ved U-864 - Resultater fra overvåkning i 2019. Rapport fra havforskningen 2020-33: 23 p. https://www.hi.no/hi/nettrapporter/rapport-fra-havforskningen-2020-33
Frantzen, S., Otterå, H.M., Heldal, H.E. and Måge, A. (2018). Kvikksølvinnhold i fisk og annen sjømat ved vraket av U-864 vest av Fedje - Resultater fra fast overvåkning og ekstra prøvetaking i 2016. Rapport fra havforskningen 8-2018: 36 p. https://www.hi.no/hi/nettrapporter/rapport-fra-havforskningen/2018/rapport_fra_havforskningen_fedje_2016_endelig
Frantzen, S., Sanden, M. and Måge, A. (2019b). Kvikksølvinnhold i sjømat ved vraket av U-864 vest av Fedje - Resultater fra fast overvåkning i 2017. Rapport fra havforskningen 2019-9: 34 p. https://www.hi.no/hi/nettrapporter/rapport-fra-havforskningen_fedje-2017-rev2.docx
Haldorsen, A.-K.L., Frantzen, S., Julshamn, K., Furevik, D. and Måge, A. (2013). Kvikksølvinnhold i fisk og annen sjømat ved vraket av U-864 vest av Fedje. - Nye analyser i 2012. NIFES-rapport: 17 p.
Julshamn, K., Duinker, A. og Måge, A. (2013a). Innhold av kadmium og andre tungmetaller i filet og lever av fisk fanget i Saltenområdet, november-desember 2012. NIFES-rapport: 14 p. https://imr.brage.unit.no/imr-xmlui/handle/11250/3057018?locale-attribute=en
Julshamn, K., Duinker, A. og Måge, A. (2013b). Oppfølging av Mattilsynets krabbeprosjekt – november –desember 2012. Oppfølgende analyser fra Vesterålen. Rapport til Mattilsynet. NIFES-rapport: 11 p. https://imr.brage.unit.no/imr-xmlui/handle/11250/3057018?locale-attribute=en
Kögel, T. (2019). Førdefjorden: Basisundersøkelse av fremmedstoff i sjømat - Analyse av tungmetaller, andre grunnstoff og persistente organiske forbindelser i sjømat fra Førdefjorden 2017; Førdefjord – A baseline study of undesirable substances - Analysis of heavy metals, other elements and persistent organic pollutants in seafood from the Førdefjord 2017. Rapport fra havforskningen 2019-48: 30 p. https://www.hi.no/hi/nettrapporter/rapport-fra-havforskningen-2019-48
Kögel, T., Bienfait, A.M., Maage, A. and van der Meeren, T. (2021). Examination of elements in seafood from Repparfjorden and Revsbotn-haddock as an indicator species for monitoring marine landfills. Rapport fra havforskningen 2021-50: 76 p. https://www.hi.no/hi/nettrapporter/rapport-fra-havforskningen-2021-50
Kögel, T., Frantzen, S., Azad, A.M. and Maage, A. (2017). Sjømat fra Årdalsfjorden. Overvåking av forurensede havner og fjorder 2016. NIFES-rapport: 54 p. https://www.hi.no/resources/Rapport-om-sjomat-fra-Ardalsfjorden-2017.pdf
Kögel, T. and Maage, A. (2017). Analyse av uønskede stoffer i sjømat fra Frænfjorden ved Omya Hustadmarmor AS. NIFES-rapport: 7p. https://imr.brage.unit.no/imr-xmlui/bitstream/handle/11250/3056965/2017_K%C3%B6gel_M%C3%A5ge_Rapport_Hustadmarmor%20Fr%C3%A6nfjord_tko_2017_02_06.pdf?sequence=1
Kögel, T., Maage, A. and Ørnsrud, R. (2016). Sjømat i Oslofjorden - Uønskede stoffer i torsk, makrell og taskekrabbe. Overvåking av forurensede havner og fjorder 2013-2015. NIFES-rapport: 62 p. https://www.hi.no/resources/publikasjoner/rapporter-nifes/2017/rapportsjomatioslofjordenuonskedestofferitorskmakrellogtaskekrabbe2016finaldes.pdf
Kögel, T., Wiech, M. and Frantzen, S. (2023). Sjømat fra havner og fjorder med kostadvarsel-En undersøkelse av fremmedstoff i torsk, brosme og krabbe fra områdene Bergen, Kragerø, Grenland og Ålesund fra 2019-2021; A survey of contaminants in cod, tusk and crab from the areas Bergen, Kragerø, Grenland and Ålesund from 2019-2021. Rapport fra havforskningen 2023-48: 49 p. https://imr.brage.unit.no/imr-xmlui/bitstream/handle/11250/3101306/RH+2023-48.pdf?sequence=1
Måge, A., Bjelland, O., Olsvik, P.A., Nilsen, B.M. and Julshamn, K. (2012). Miljøgifter i fisk og fiskevarer 2011: Kvikksølv i djupvassfisk og skaldyr frå Hardangerfjorden samt miljøgifter i marine oljer. NIFES-rapport: 31 p. https://www.researchgate.net/publication/288177218
Måge, A. and Frantzen, S. (2008). Kostholdsrådsundersøkelse, Bergen Byfjord 2007. NIFES-rapport: 37 p. https://imr.brage.unit.no/imr-xmlui/handle/11250/3056107?locale-attribute=en
Måge, A. and Frantzen, S. (2009). Kostholdsråds-undersøking, fritidsfiske Bergen, 2008-2009. Kvikksølv i torskefisk og PCB i lever. NIFES-rapport: 18 p. https://imr.brage.unit.no/imr-xmlui/handle/11250/3056243
Måge, A. and Frantzen, S. (2022). DDT i blåskjel frå fruktområde i Vestnorske fjordar 2021. Prøvar frå Hardangerfjorden og Sognefjorden med vekt på Sørfjorden. Rapport fra havforskningen 2022-29: 29 p. https://www.hi.no/hi/nettrapporter/rapport-fra-havforskningen-2022-29
Måge, A., Julshamn, K., Storaker, A. and Furevik, D.M. (2006). Kvikksølvinnhald i fisk og sjømat ved søkkt ubåt (U-864) vest av Fedje - Nye analysar i 2006 - Samanlikning med data frå 2004 og 2005. NIFES-rapport: 15 p.
Måge, A., Vågenes, L., Frantzen, S., Julshamn, K. and Furevik, D. (2007). Kvikksølvinnhald i fisk og sjømat ved søkkt ubåt (U864) vest av Fedje - Nye analysar 2007 - Samanlikning med data frå perioden 2004 til 2006. NIFES-rapport: 17 p.
Nesje, G., Grøsvik, B.E. and Måge, A., 2007. Nivåer av klororganiske forbindelser (PCB, DDT, HCB og HCH) og kvikksølv i fangst fra MS Trygg i juni og august 2007. Rapport fra havforskningen 8-2007: 19 p. https://imr.brage.unit.no/imr-xmlui/handle/11250/3056978
Nilsen, B.M., Frantzen, S. and Julshamn, K. (2011). Fremmedstoffer i villfisk med vekt på kystnære farvann. En undersøkelse av innholdet av dioksiner og dioksinlignende PCB i torskelever fra 15 fjorder og havner langs norskekysten 2009. NIFES-rapport: 77 p. https://imr.brage.unit.no/imr-xmlui/handle/11250/3056402?locale-attribute=en
Nilsen, B.M. and Julshamn, K. (2011). Overvåking forurensede havner og fjorder 2009/2010. En undersøkelse av kvikksølv i torskefilet fra 15 fjorder og havner langs norskekysten. NIFES-rapport: 74 p. https://imr.brage.unit.no/imr-xmlui/handle/11250/3056395
Sanden, M. and Ørnsrud, R. (2012). Overvåkning forurensede havner og fjorder. Undersøkelse av fremmedstoffer i fisk og sjømat fra Ølenfjorden. NIFES-rapport: 18 p.
Valdersnes, S., Nilsen, B.M., Breivik, J.F., Borge, A. and Maage, A. (2017). Geographical trends of PFAS in cod livers along the Norwegian coast. Plos One 12(5): e0177947. 10.1371/journal.pone.0177947. https://journals.plos.org/plosone/article?id=10.1371/journal.pone.0177947
Ørnsrud, R. og Måge, A. (2013). Overvåkning forurensede havner og fjorder, 2012. Undersøkelse av fremmedstoffer i torsk fra Salten til Nordland. NIFES-rapport: 20 p. https://imr.brage.unit.no/imr-xmlui/handle/11250/3056978