In this study, a comprehensive survey of contaminants in European Hake ( Merluccius merluccius ) from Norwegian waters has been carried out. The concentrations of heavy metals and several different organic pollutants in fillet (n = 788) and liver (n = 31) of European Hake were generally low. The pollution concentrations were largely well below the EU and Norwegian limit values for mercury, cadmium, lead, sum dioxins, sum dioxins and dioxin-like PCBs and the sum non-dioxin-like PCBs (PCB6) that apply to fish muscle for human consumption. The concentrations of contaminants in European Hake varied slightly by geography and body size, roughly in the same way for all contaminants. For European Hake, no clear geographical trend was observed except for a hotspot near the Kollevåg historic waste disposal site near Askøy, Norway. This study showed that although European Hake are long-lived, marine apex predators, the concentrations of contaminants in fillets from this species largely had a pollution exposure regime that was low.
Contaminants in European Hake (Merluccius merluccius) from the Northeast Atlantic Ocean
— Contaminants in European Hake
Rapportserie:
Rapport fra havforskningen 2023-43
ISSN: 1893-4536
Overvåking sjømat
Publisert: 29.09.2023
Prosjektnr: 15464
Oppdragsgiver(e): Mattilsynet
Program:
Trygg og sunn sjømat
Godkjent av:
Forskningsdirektør(er):
Gro-Ingunn Hemre
Programleder(e):
Livar Frøyland
English summary
Sammendrag
1 - Introduction
Mapping of environmental toxins in wild fish stocks and other seafood is carried out annually on behalf of the Norwegian Food Safety Authority to document that fish and shellfish sold for consumption is within the applicable limit values for food safety in the EU and Norway (EU, 2018). The purpose of the survey is to ensure safe food by being able to prevent fish and shellfish with excessively high concentrations of environmental contaminants from being traded and consumed by humans. Through the mapping program "Environmental toxins in fish and fish products", various types of marine fish and shellfish have previously been examined each year, and in recent years several environmental contaminants in all the major, commercially relevant species have been synthesized in a comprehensive, probabilistic risk-benefit assessment by Ho et al. (2021). Together with data from other mapping programs carried out for the Norwegian Food Safety Authority and major surveys funded through other sources, the Institute of Marine Research has developed a comprehensive database for several of the most fished species, including commercially relevant taxa that may have public health implications regarding contaminants due to life history characteristics, habitat use, or proximity to point-sources of pollution.
In the period 2019-2022, the mapping program "Environmental toxins in fish and fish products" has been used for a mapping survey of environmental toxins in European Hake (Merluccius merluccius) from the Northeast Atlantic Ocean. European Hake represent a growing fishery in Norway, and we previously had limited knowledge about concentrations of contaminants in this species.
1.1 - European Hake Life History
European Hake is a demersal (bottom) fish, typically inhabiting depths of 50–500 meters during daytime (Werner et al. 2016). Both juvenile and adult fish feed on a wide array of prey items including Norway pout, mackerel, herring, blue whiting, greater Argentine, shrimps, and are also cannibalistic to a lesser extent (Werner 2015) and often migrating toward the surface at night in search of prey. European Hake in the North Sea and Norwegian waters spawn mainly between July and October (Werner et al. 2016; Sundby et al. 2017). During summer months large mature fish migrate into shallower areas of the northern and central North Sea (Staby et al. 2018). Here they spawn at 80–200 meters depth and bottom temperatures of 6–9°C. The length at which males and females mature (L50 ) is between 37 and 45 cm and between 50 and 59 cm respectively (Werner et al. 2016). Younger and immature fish remain in the North Sea for their first years before leaving the area, probably only to return once mature (Staby et al. 2018). Age estimation of European Hake based on otoliths is rather difficult, partly because of false annual rings and because of unclear otolith cores. Recaptured fish from tagging studies done off the west coast of France revealed that European Hake grow quicker than assumed based on otolith ageing (de Pontual et al. 2006).
A genetic comparison of European Hake from the North Sea, the west coast of Norway, Skagerrak and Bay of Biscay showed small scale variation between the Skagerrak and Norwegian Sea, and a separation of these from fish in the Bay of Biscay, suggesting the existence of subpopulations along the Norwegian coast (Westgaard et al. 2017).
European Hake has firm white meat and is popular especially in southern Europe. Spain is the largest consumer of European Hake, followed by Portugal, France, and Italy. Hake in the North Sea and Skagerrak/Kattegat is managed as part of ICES northern European Hake stock, which covers the Bay of Biscay, Celtic Sea, and the area west of Ireland and Scotland, but excludes the area North of 62. In 2022 ICES recommended that catches in the northern hake management area in 2023 should not exceed 83130 tonnes.
Historically more than 60% of the annual European Hake catches have been taken with bottom trawl gear, and the remainder with set nets, longline and more recently Danish seine. Since 2010 however, bottom trawl catches have increased especially south of 62o and in 2016 contributed 88% of the total catch. North of 62o, off Møre and Romsdal, European Hake is primarily caught with bottom nets and, more commonly, in recent years using bottom trawl gear. Annual catches in this area range between 600 and 1100 tonnes.
2 - Materials and methods
2.1 - Collection of samples
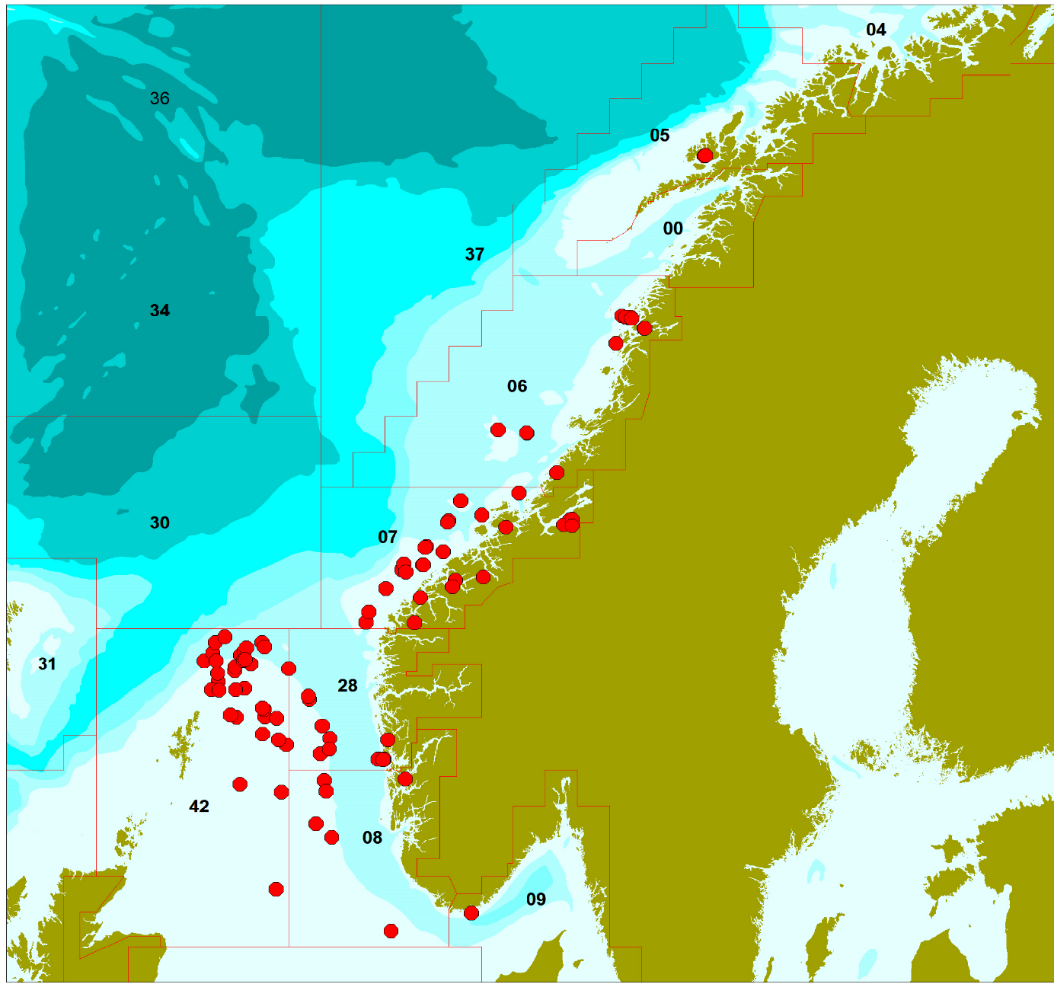
Samples of European Hake (n=788) were collected throughout the Northeast Atlantic Ocean (Figures 1 and 2; Tables 1 and 2). Hake sampling was undertaken during 2019-2022 with the help of the Institute of Marine Research's research vessels, and the ocean and coastal reference fleet, and commercial fishermen. The collection was carried out in accordance with a sampling plan where the number of samples from different areas was distributed based on the Directorate of Fisheries' statistics on commercial catches in the various areas.
| Sampling date | Journal no. | Sampling coordinates | Area no. | n |
| - | 2019-1517 | 61.629°N 0.496°E | 42 | 25 |
| 11/09/2019 | 2019-1702 | 61.500°N 0.833°E | 42 | 25 |
| 11/09/2019 | 2019-1703 | 61.000°N 2.650°E | 28 | 25 |
| 17/09/2019 | 2019-1704 | 61.550°N 0.633°W | 42 | 25 |
| 01/11/2019 | 2019-1927 | 57.976°N 7.699°E | 9 | 25 |
| 28/10/2019 | 2019-1936 | 64.771°N 9.426°E | 6 | 1 |
| 28/10/2019 | 2019-1936 | 66.250°N 13.093°E | 6 | 3 |
| 08/11/2020 | 2019-1936 | 64.771°N 9.426°E | 6 | 2 |
| 08/11/2020 | 2019-1936 | 66.427°N 12.376°E | 6 | 1 |
| 13/03/2021 | 2019-1936 | 64.813°N 8.527°E | 6 | 7 |
| 13/03/2021 | 2019-1936 | 66.037°N 12.196°E | 6 | 1 |
| 15/06/2022 | 2019-1936 | 66.391°N 12.657°E | 6 | 1 |
| 04/07/2022 | 2019-1936 | 66.414°N 12.645°E | 6 | 1 |
| 11/07/2022 | 2019-1936 | 66.389°N 12.653°E | 6 | 1 |
| 26/07/2022 | 2019-1936 | 66.391°N 12.692°E | 6 | 1 |
| 01/08/2022 | 2019-1936 | 66.389°N 12.691°E | 6 | 1 |
| 07/08/2022 | 2019-1936 | 66.412°N 12.506°E | 6 | 1 |
| 18/08/2022 | 2019-1936 | 66.414°N 12.508°E | 6 | 1 |
| 21/08/2022 | 2019-1936 | 66.388°N 12.691°E | 6 | 1 |
| 21/08/2022 | 2019-1936 | 66.414°N 12.508°E | 6 | 2 |
| 05/11/2019 | 2019-1937 | 64.776°N 9.419°E | 7 | 2 |
| 06/11/2019 | 2019-1937 | 63.613°N 8.018°E | 7 | 2 |
| 07/11/2019 | 2019-1937 | 63.530°N 6.992°E | 7 | 3 |
| 09/11/2019 | 2019-1937 | 63.091°N 6.818°E | 7 | 1 |
| 09/11/2019 | 2019-1937 | 63.164°N 6.300°E | 7 | 1 |
| 10/11/2019 | 2019-1937 | 62.806°N 5.650°E | 7 | 3 |
| 10/11/2019 | 2019-1937 | 62.839°N 5.526°E | 7 | 1 |
| 10/11/2019 | 2019-1937 | 62.905°N 6.180°E | 7 | 3 |
| 11/11/2019 | 2019-1937 | 62.576°N 5.019°E | 7 | 1 |
| 12/11/2019 | 2019-1937 | 62.092°N 4.404°E | 7 | 8 |
| 11/01/2019 | 2019-2020 | 60.153°N 4.792°E | 28 | 25 |
| 12/11/2019 | 2019-2023 | 60.153°N 4.958°E | 28 | 25 |
| 02/11/2019 | 2019-2099 | 63.457°N 10.843°E | 7 | 17 |
| 02/11/2019 | 2019-2099 | 63.470°N 10.574°E | 7 | 2 |
| 02/11/2019 | 2019-2099 | 63.553°N 10.833°E | 7 | 3 |
| 05/11/2019 | 2019-2099 | 62.730°N 8.071°E | 7 | 2 |
| 05/11/2019 | 2019-2099 | 63.553°N 10.833°E | 7 | 1 |
| 27/11/2019 | 2019-2107 | 60.146°N 4.940°E | 28 | 24 |
| 05/11/2019 | 2019-2252 | 62.684°N 7.203°E | 7 | 18 |
| 07/11/2019 | 2019-2252 | 62.084°N 5.931°E | 7 | 7 |
| 13/06/2019 | 2019-987 | 59.874°N 5.636°E | 8 | 25 |
| 09/06/2020 | 2020-1162 | 60.360°N 1.920°E | 42 | 25 |
| 26/06/2020 | 2020-1164 | 59.857°N 3.115°E | 8 | 24 |
| 18/06/2020 | 2020-1178 | 52.975°N 3.258°E | 8 | 25 |
| 12/06/2020 | 2020-1188 | 60.236°N 2.993°E | 28 | 25 |
| 18/07/2020 | 2020-1207 | 58.314°N 1.607°E | 42 | 11 |
| 30/07/2020 | 2020-1207 | 61.549°N 0.259°W | 42 | 2 |
| 30/07/2020 | 2020-1207 | 61.555°N 0.588°E | 42 | 7 |
| 30/07/2020 | 2020-1207 | 61.746°N 1.250°E | 42 | 5 |
| 11/07/2020 | 2020-1698 | 60.299°N 3.276°E | 42 | 4 |
| 17/07/2020 | 2020-1698 | 60.434°N 1.678°E | 42 | 3 |
| 17/07/2020 | 2020-1698 | 60.736°N 1.625°E | 42 | 1 |
| 18/07/2020 | 2020-1698 | 59.693°N 1.774°E | 42 | 5 |
| 19/07/2020 | 2020-1698 | 60.512°N 1.191°E | 42 | 1 |
| 19/07/2020 | 2020-1698 | 60.860°N 1.242°E | 42 | 4 |
| 24/07/2020 | 2020-1698 | 57.730°N 5.195°E | 42 | 2 |
| 26/07/2020 | 2020-1698 | 59.238°N 2.855°E | 42 | 5 |
| 05/11/2020 | 2020-2036 | 62.601°N 7.115°E | 7 | 18 |
| 06/11/2020 | 2020-2036 | 62.444°N 6.101°E | 7 | 7 |
| 31/10/2020 | 2020-2037 | 63.924°N 9.172°E | 7 | 2 |
| 01/11/2020 | 2020-2037 | 63.458°N 10.842°E | 7 | 11 |
| 06/11/2020 | 2020-2037 | 62.444°N 6.101°E | 7 | 3 |
| 04/11/2021 | 2020-2037 | 63.443°N 8.769°E | 7 | 6 |
| 04/11/2021 | 2020-2037 | 63.808°N 7.363°E | 7 | 3 |
| 10/02/2020 | 2020-361 | 61.049°N 2.610°E | 42 | 2 |
| 12/02/2020 | 2020-361 | 61.658°N 0.369°W | 42 | 4 |
| 12/02/2020 | 2020-361 | 61.688°N 0.617°E | 42 | 3 |
| 13/02/2020 | 2020-361 | 61.160°N 0.633°E | 42 | 3 |
| 14/02/2020 | 2020-361 | 60.752°N 1.262°E | 42 | 8 |
| 20/02/2020 | 2020-361 | 59.807°N 0.484°E | 42 | 2 |
| 29/02/2020 | 2020-361 | 60.633°N 3.049°E | 42 | 1 |
| 03/03/2020 | 2020-361 | 59.702°N 3.169°E | 42 | 2 |
| 03/02/2020 | 2020-621 | 60.450°N 3.283°E | 28 | 25 |
| 04/02/2020 | 2020-623 | 61.437°N 1.995°E | 42 | 4 |
| 05/02/2020 | 2020-623 | 61.804°N 1.177°E | 42 | 1 |
| 10/02/2020 | 2020-623 | 61.141°N 0.349°E | 42 | 1 |
| 10/02/2020 | 2020-623 | 61.461°N 0.340°E | 42 | 3 |
| 11/02/2020 | 2020-623 | 61.135°N 0.171°W | 42 | 1 |
| 11/02/2020 | 2020-623 | 61.368°N 0.219°W | 42 | 1 |
| 11/02/2020 | 2020-623 | 61.404°N 0.323°E | 42 | 3 |
| 13/02/2020 | 2020-623 | 61.139°N 0.411°W | 42 | 1 |
| 13/02/2020 | 2020-623 | 61.250°N 0.202°W | 42 | 4 |
| 13/02/2020 | 2020-623 | 61.805°N 0.287°W | 42 | 6 |
| - | 2020-624 | - | 8 | 22 |
| 28/01/2020 | 2020-665 | 68.692°N 14.960°E | 5 | 2 |
| 01/02/2020 | 2020-665 | 68.692°N 14.960°E | 5 | 2 |
| 05/02/2020 | 2020-665 | 68.692°N 14.960°E | 5 | 3 |
| 08/02/2020 | 2020-665 | 68.692°N 14.960°E | 5 | 2 |
| 12/02/2020 | 2020-665 | 68.695°N 14.990°E | 5 | 3 |
| 13/02/2020 | 2020-665 | 68.695°N 14.990°E | 5 | 2 |
| 17/02/2020 | 2020-665 | 68.695°N 14.990°E | 5 | 4 |
| 09/01/2020 | 2020-963 | - | 8 | 25 |
| 28/07/2021 | 2021-1628 | 60.433°N 5.092°E | 28 | 25 |
| 16/07/2021 | 2021-1639 | 60.783°N 0.183°E | 42 | 5 |
| 18/07/2021 | 2021-1639 | 61.567°N 0.650°E | 42 | 6 |
| 18/07/2021 | 2021-1639 | 61.733°N 0.700°E | 42 | 8 |
| 19/07/2021 | 2021-1639 | 60.883°N 1.183°E | 42 | 6 |
| 03/07/2021 | 2021-1648 | 59.050°N 3.350°E | 8 | 25 |
| 08/07/2021 | 2021-2467 | 60.750°N 0.385°E | 8 | 18 |
| 06/03/2022 | 2021-2467 | 61.886°N 0.008°E | 8 | 7 |
| 28/10/2021 | 2021-2585 | 66.250°N 13.094°E | 7 | 1 |
| 01/11/2021 | 2021-2585 | 64.207°N 10.364°E | 7 | 3 |
| 03/11/2021 | 2021-2585 | 63.545°N 10.767°E | 7 | 2 |
| 03/11/2021 | 2021-2585 | 63.611°N 8.026°E | 7 | 3 |
| 04/11/2021 | 2021-2585 | 63.507°N 6.960°E | 7 | 2 |
| 05/11/2021 | 2021-2585 | 62.907°N 6.201°E | 7 | 2 |
| 05/11/2021 | 2021-2585 | 63.150°N 6.256°E | 7 | 1 |
| 06/11/2021 | 2021-2585 | 62.803°N 5.652°E | 7 | 4 |
| 06/11/2021 | 2021-2585 | 62.915°N 5.598°E | 7 | 2 |
| 08/11/2021 | 2021-2585 | 62.239°N 4.508°E | 7 | 5 |
2.2 - Processing of samples
Whole European Hake fish samples were frozen and sent to the Institute of Marine Research (HI). Upon arrival fish were thawed, and length, weight and sex were determined, and otoliths were removed for age determination. Liver samples were removed and weighed. At each sampling station pooled samples of liver from all fish collected from the same position were composited using approximate equal weights of samples. Pooled samples of liver were homogenized using a food processor and frozen in clean , sterile , packaging prior to analyses. Fish individuals were then filleted , and skinless fillets were homogenized, freeze dried, and homogenized a second time and then made into powdered samples. Pooled samples of fillets were also made from individuals collected from the same position, and by sampling equal amount s of muscle tissue from individual s . Samples were homogenized and frozen in clean and sterile packaging until analysis. The dry matter content of individual fillet samples was determined by weighing the sample before and after freeze-drying. Dry matter determination is an accredited method (HI method no. 377). After freeze-drying, the samples were stored in clean and sterile, plastic vessels until analysis. Individual wet fillet samples were analyzed for fat content, while freeze-dried fillet samples from individual fish were analyzed for metals, dioxins , and dioxin-like PCBs, PCB6 and PBDE7. Wet pooled samples of fillet were analyzed for HBCD and TBBP-A, chlorinated pesticides and PFAS, while wet pooled samples of liver were analyzed for metals, fat content, dioxins, and dioxin-like PCBs, PCB6, PBDE7, HBCD and TBBP-A, chlorinated pesticides and PFAS.
2.9 - Methods of analysis
2.9.1 - Determination of total fat content by ethyl acetate method (Method No. 091)
Samples to be analyzed for fat-soluble organic pollutants (i.e., samples of fillets from individual fish and collected liver samples) were extracted with 30% isopropanol in ethyl acetate, isopropanol and ethyl acetate were steamed off and the fat was weighed. The method is accredited according to ISO 17025 (Table 4), and the laboratory has participated in ring tests with the method since 1998 with good results. LOQ and measurement uncertainty details are provided in Table 5.
2.9.2 - Determination of metals by ICPMS (Method No. 197)
Freeze-dried samples of fillet from each individual fish or wet collection sample of liver were weighed in for the determination of metals. Metals were determined using a plasma mass spectrometer (ICPMS) after decomposition in a microwave oven as described by Julshamn et al. (2007). The following elements were determined: arsenic, cadmium, mercury, lead, silver, copper, iron, cobalt, zinc, selenium, manganese, vanadium, molybdenum, chromium, and nickel. The method is accredited according to ISO 17025 for arsenic, cadmium, mercury, lead, copper, zinc, and selenium (Table 4). Quantification limits (LOQ) are calculated for dry samples for each of the elements, and LOQ and measurement uncertainty for the accredited substances are given in Table 5. The quality of the analysis is regularly monitored by participation in ring tests and by analysis of certified control samples.
2.9.3 - Determination of dioxins, furans, non-ortho and mono-ortho PCBs, PCB6 and PBDEs with common reprocessing method (Method no. 292)
Freeze-dried sub-samples of fillets from individual fish and wet collected liver samples were extracted, purified and analyzed for dioxins and dioxin-like PCBs (PCDD/F+dl-PCB), non-dioxin-like PCBs (PCB6) and polybrominated diphenyl ethers (PBDE7) using methods as described by Julshamn et al. (2013). PCDD, PCDF and non-ortho PCBs were analyzed on HRGC-HRMS and mono-ortho PCBs, PCB6 and PBDE7 were analyzed on GC-MSMS. All concentrations were calculated using isotope dilution and internal standards.
For the determination of dioxins and dioxin-like PCBs (PCDD/F+dl-PCB), seven congeners of dioxins (PCDD), ten congeners of furans (PCDF), four congeners of non-ortho PCBs (PCB-77, -81, -126 and -169) and eight congeners of mono-ortho PCBs (PCB-105, -114, -118, -123, -156, -157, -167 and -189) were quantified. Toxic equivalent values (TE) were determined by multiplying the concentrations by the congeners' toxic equivalence factors (WHO-TEF 2005). When calculating sum PCDD/F and sum PCDD/F+dl-PCB for assessment against EU and Norwegian limit values, concentrations less than the quantification limit (LOQ) were set equal to LOQ (upperbound LOQ) as required by the regulations for limit values (EU, 2018 ; Regulations of 3 July 2015 No. 870 relating to certain pollutants in foods). For the determination of non-dioxin-like PCBs (PCB6), the following six congeners were quantified: PCB-28, -52 , -101, -138, -153 and -180. Total PCB6 was calculated using upperbound LOQ as required by the regulations when assessing the values against the EU's and Norway's upper limit values. For PBDE, 11 different Congeners were quantified , including seven Congeners summing to a "standard sum PBDE7" (PBDE-28, -47, -99, -100, -153, -154 and -183). Total PBDE7 was calculated using upper bound LOQ.
The method is accredited according to ISO 17025 (Table 4), and LOQ and measurement uncertainty values are given in Table 5. The quality of the analysis is regularly monitored by participation in ring tests and by analysis of certified control samples.
2.9.4 - Determination of HBCD and TBBPA (Eurofins Method Nos. GFB71 and GFB86)
Hexabromcyclodecane (HBCD) and tetrabromobisphenol-A (TBBP-A) were determined in wet pooled samples of fillet and liver at subcontractor Eurofins with LC-MSMS. For HBCD, three different HBCD congeners were determined, α-HCBD, β-HBCD and γ-HBCD, as well as the sum of these (calculated with upperbound LOQ). The method is accredited (Table 4) and quantification limits and measurement uncertainty for the various analytes are given in Table 5.
2.9.5 - Determination of chlorinated pesticides (Eurofins Method No. GFP53)
Chlorinated pesticides were determined in wet collection samples of fillet and liver at subcontractor Eurofins with GC-HRMS. The method quantifies 30 different compounds including endosulfanes, chlordanes, DDT and metabolites, toxamethanes, hexachlorobenzene (HCB), hexachlorocyclohexane (HCH) and more (see Table 4). The method is accredited (Table 4), and LOQ and measurement uncertainty are given in Table 5.
Total DDT was calculated as upperbound sum of o,p'DDT, p,p'DDT, o,p'DDD, p,p'DDD, o,p'DDE and p,p'DDE, expressed as DDT when converted to molecular weight (MW DDT=354.5 g/mol, MW DDD=320.0 g/mol and MW DDE=318.0 g/ml). Total chlordane was calculated as the upperbound sum of cis-chlordane, trans-chlordane and oxychlordane, expressed as chlordane when converted to molecular weight (MW=409.8 g/mol for chlordane and MW=423.7 g/mol for oxychlordane). The total toxaphene was calculated as upperbound sum of toxaphene 26, toxaphene 50 and toxaphene 62.
2.9.6 - Determination of per- and polyfluorinated alkyl substances (PFAS) (Method no. 349)
Wet collection samples of fillet or liver were weighed and added to mass-labelled internal standard and methanol and extracted in ultrasonic baths. After centrifugation, the supernatant was decanted into a syringe and filtered through 0.45 μm nylon filter before water was added followed by purification at ASPEC. The extract from ASPEC was further purified by filtration through the 3K ultrafilter. The samples were eventually analyzed on LC-MSMS and quantified using internal standard. The compounds that can be quantified by method, LOQ and measurement of the different analytes in fish muscle and liver, as well as which analytes the method is accredited for, are given in Table 3. The method has been validated for fish muscle, fish liver and fish roe, and is accredited according to ISO 17025 for oily and lean fish and liver of these (Table 4).
| Fillet Muscle | Liver | ||||
| Analyte | Accreditation a | LOQ (ng/g) b | MU (%) | LOQ (ng/g) b | MU (%) |
| PFBS | No | 1 (3) | 80 | 5 (4.5) | 80 |
| PFHxS | No | 1 (1.8) | 40 | 3 (2.7) | 35 |
| PFOS | Yes | 0.2 (1.8) | 35 | 3 (4.5) | 75 |
| PFDS | No | 0.2 (1.8) | 60 | 0.5 (2.7) | 30 |
| PFOSA | Yes | 0.5 (1.5) | 80 | 0.5 (2.7) | 80 |
| PFBA | No | 1 (2.1) | 35 | 10 (3) | 30 |
| PFHxA | No | 0.5 (1.8) | 60 | 2 (4.5) | 60 |
| PFHpA | Yes | 0.2 (2.4) | 50 | 5 (6) | 30 |
| PFOA | Yes | 0.6/4 (2.4) | 35 | 1.7/7 (7.2) | 30 |
| PFNA | Yes | 0.2 (1.8) | 35 | 0.5 (4.5) | 30 |
| PFDA | Yes | 0.2 (1.2) | 40 | 0.5 (1.8) | 30 |
| PFUdA | Yes | 0.2 (2.7) | 40 | 0.5 (4.5) | 30 |
| PFDoDA | Yes | 0.2 (1.8) | 40 | 2 (7.2) | 35 |
| PFTrDA | Yes | 0.2 (3.6) | 80 | 0.5 (9.6) | 60 |
| PFTeDA | No | 0.2 (2.4) | 80 | 0.5 (9.6) | 70 |
| N-EtFOSA | No | 1.5/1 | 35 | - c | - c |
| N-etFOSE | No | 1 | 90 | - c | - c |
| N-MeFOSA | No | 1/0.5 | 38 | - c | - c |
| N-MeFOSE | No | 0.5/1.5 | 39 | - c | - c |
a The method is accredited for muscle meat and liver from fatty fish and lean fish. b Due to a change in the method, LOQ for many PFAS compounds changed during the project. c N-EtFOSA, N-EtFOSE, N-MeFOSA and N-MeFOSE are not determined in fish liver.
2.9.7 - Overall overview of analyses performed
| HI method no. | Method name | Accredited parameters | Accreditation status |
| 377 | Dry matter determination by freeze drying | Dry matter | Accredited for foodstuffs, feed, tissues and tissue fluids |
| 91 | Total fat-ethyl acetate extraction and gravimetric analysis | Fat | Accredited for foodstuffs, feed, tissues and tissue fluids |
| 197 | Multi-element determination with ICPMS | As, Cd, Cu, Hg, Pb, Se, Zn | Accredited for foodstuffs, feed, tissues and tissue fluids |
| 292 | Joint extraction method and analysis on HRGC-HRMS (dioxins, furans, non-ortho PCB) and GC-MSMS (mono-ortho PCB and PBDE) | PBDE-28, 47, 99, 100, 153, 154, 183;PCB-28, 52, 101, 138, 153, 180; Mono-ortho PCB; Non-ortho PCB; PCDF; PCDD | Accredited for fish, fish products, oil, bivalves and feed. |
| 349 | Determination of PFAS with LC-MSMS | PFOS, PFOSA, PFHpA, PFOA, PFNA, PFDA, PFUdA, PFDoDA, PFTrDA | Accredited for fatty and lean fish and fish liver |
| Eurofins GFP-53 | OCP (27) + Endosulfan - Monitoring (HRMS) | Endosulfan I (alpha-endosulfan), endosulfan II (beta-e ndosulfan), endosulfan sulphate, pentachlorobenzene, h exachlorobenzene (HCB), alpha-HCH, beta-HCH, gamma-HCH (Lindane), delta-HCH, o,p'-DDT, p,p'-DDT, o,p'-DDE, p,p'-DDE, p,p'-DDD, p,p'-DDD, Aldrin, dieldrin, endrin, toxaphene parlar 26, toxaphene parlar 50, toxaphene parlar 62, heptachlor, mirex, cis-chlordane, trans-chlordane, oxychlordane, trans-nonachlor, cis-heptachlor epoxide, trans-heptachlor epoxide, octachlorostyrene | Accredited for food, feed, and various seafood products |
| Eurofins GFB71 | Hexabromocyclodecane (3 HBCD) | Alpha-HBCD, Beta-HBCD, Gamma-HBCD | Accredited for fish oil, fish meal, fish feed and fish fillet |
| Eurofins GBP86 | Tetrabromobisphenol A (TBBPA) | Tetrabromobisphenol-A (TBBPA) | Accredited for fish oil, fish meal, fish feed and fish fillet |
| Analyte | Method | Accreditation | LOQ | MU (%) |
| Arsenic | ICP-MS | Yes | 0.01 mg/kg dw | 20 c) |
| Cadmium | ICP-MS | Yes | 0.005 mg/kg dw | 20 c) |
| Mercury | ICP-MS | Yes | 0.005 mg/kg dw | 25 c) |
| Lead | ICP-MS | Yes | 0. 03 mg/kg dw | 25 c) |
| Copper | ICP-MS | Yes | 0.1 mg/kg dw | 25 c) |
| Zinc | ICP-MS | Yes | 0.5 mg/kg dw | 20 c) |
| Selenium | ICP-MS | Yes | 0.01 mg/kg dw | 25 c) |
| PCDDs and PCDFs | HRGC/HRMS | Yes | 0.008-0.4 pg/g ww a) | 20-35 d) |
| Non-ortho PCBs | HRGC/HRMS | Yes | 0.008-0.4 pg/g ww a) | 25-40 d) |
| Mono-ortho PCBs | GC-MSMS | Yes | 10 pg/g ww b) | 30-50 a) |
| PCB6 | GC-MSMS | Yes | 0.03 ng/g ww b) | 30 |
| PBDE7 | GC-MSMS | Yes | 0.002-0.013 ng/g ww a) | 30-50 a) |
| Fat content | Gravimetry-ethyl acetate | Yes | 0.1 g/100 g ww | 5-12 e) |
| HBCD, α, β, γ- | LC-MSMS | Yes | 0.006 pg/g ww | 40 |
| TBBP-A | LC-MSMS | Yes | 0.1 ng/g ww | 40 |
| Chlorinated pesticides, 30 different analytes | GC-HRMS | Yes | 0.13-1 ng/g ww | 50 |
a) Depending on analyte (congener). b) For fatty fish. c) Measurement uncertainty (MU) at concentrations above 10xLOQ. At lower concentrations, MU is higher (70% for mercury and 40% for the other elements). d) Depending on concentration (for each congener). e) Depending on concentration.
3 - Results and discussion
3.1 - Physical and biological parameters
An overview of the physical and biological parameters of the 788 European hake collected (liver sample n=32) and analyzed in this survey is provided in Table 6. European Hake ranged in length from 29.0 to 113.5 cm, with an average of 64.3 cm + 16.4 cm (SD), and in weight from 167.1 g - 11160.0 g with an average of 2286.8 g. Fitness, given as K-factor (100 x weight/length3 ), and liver weight were determined for each individual fish, and the results showed that there was wide variation in fitness and liver weight between individuals for European Hake (Table 5).
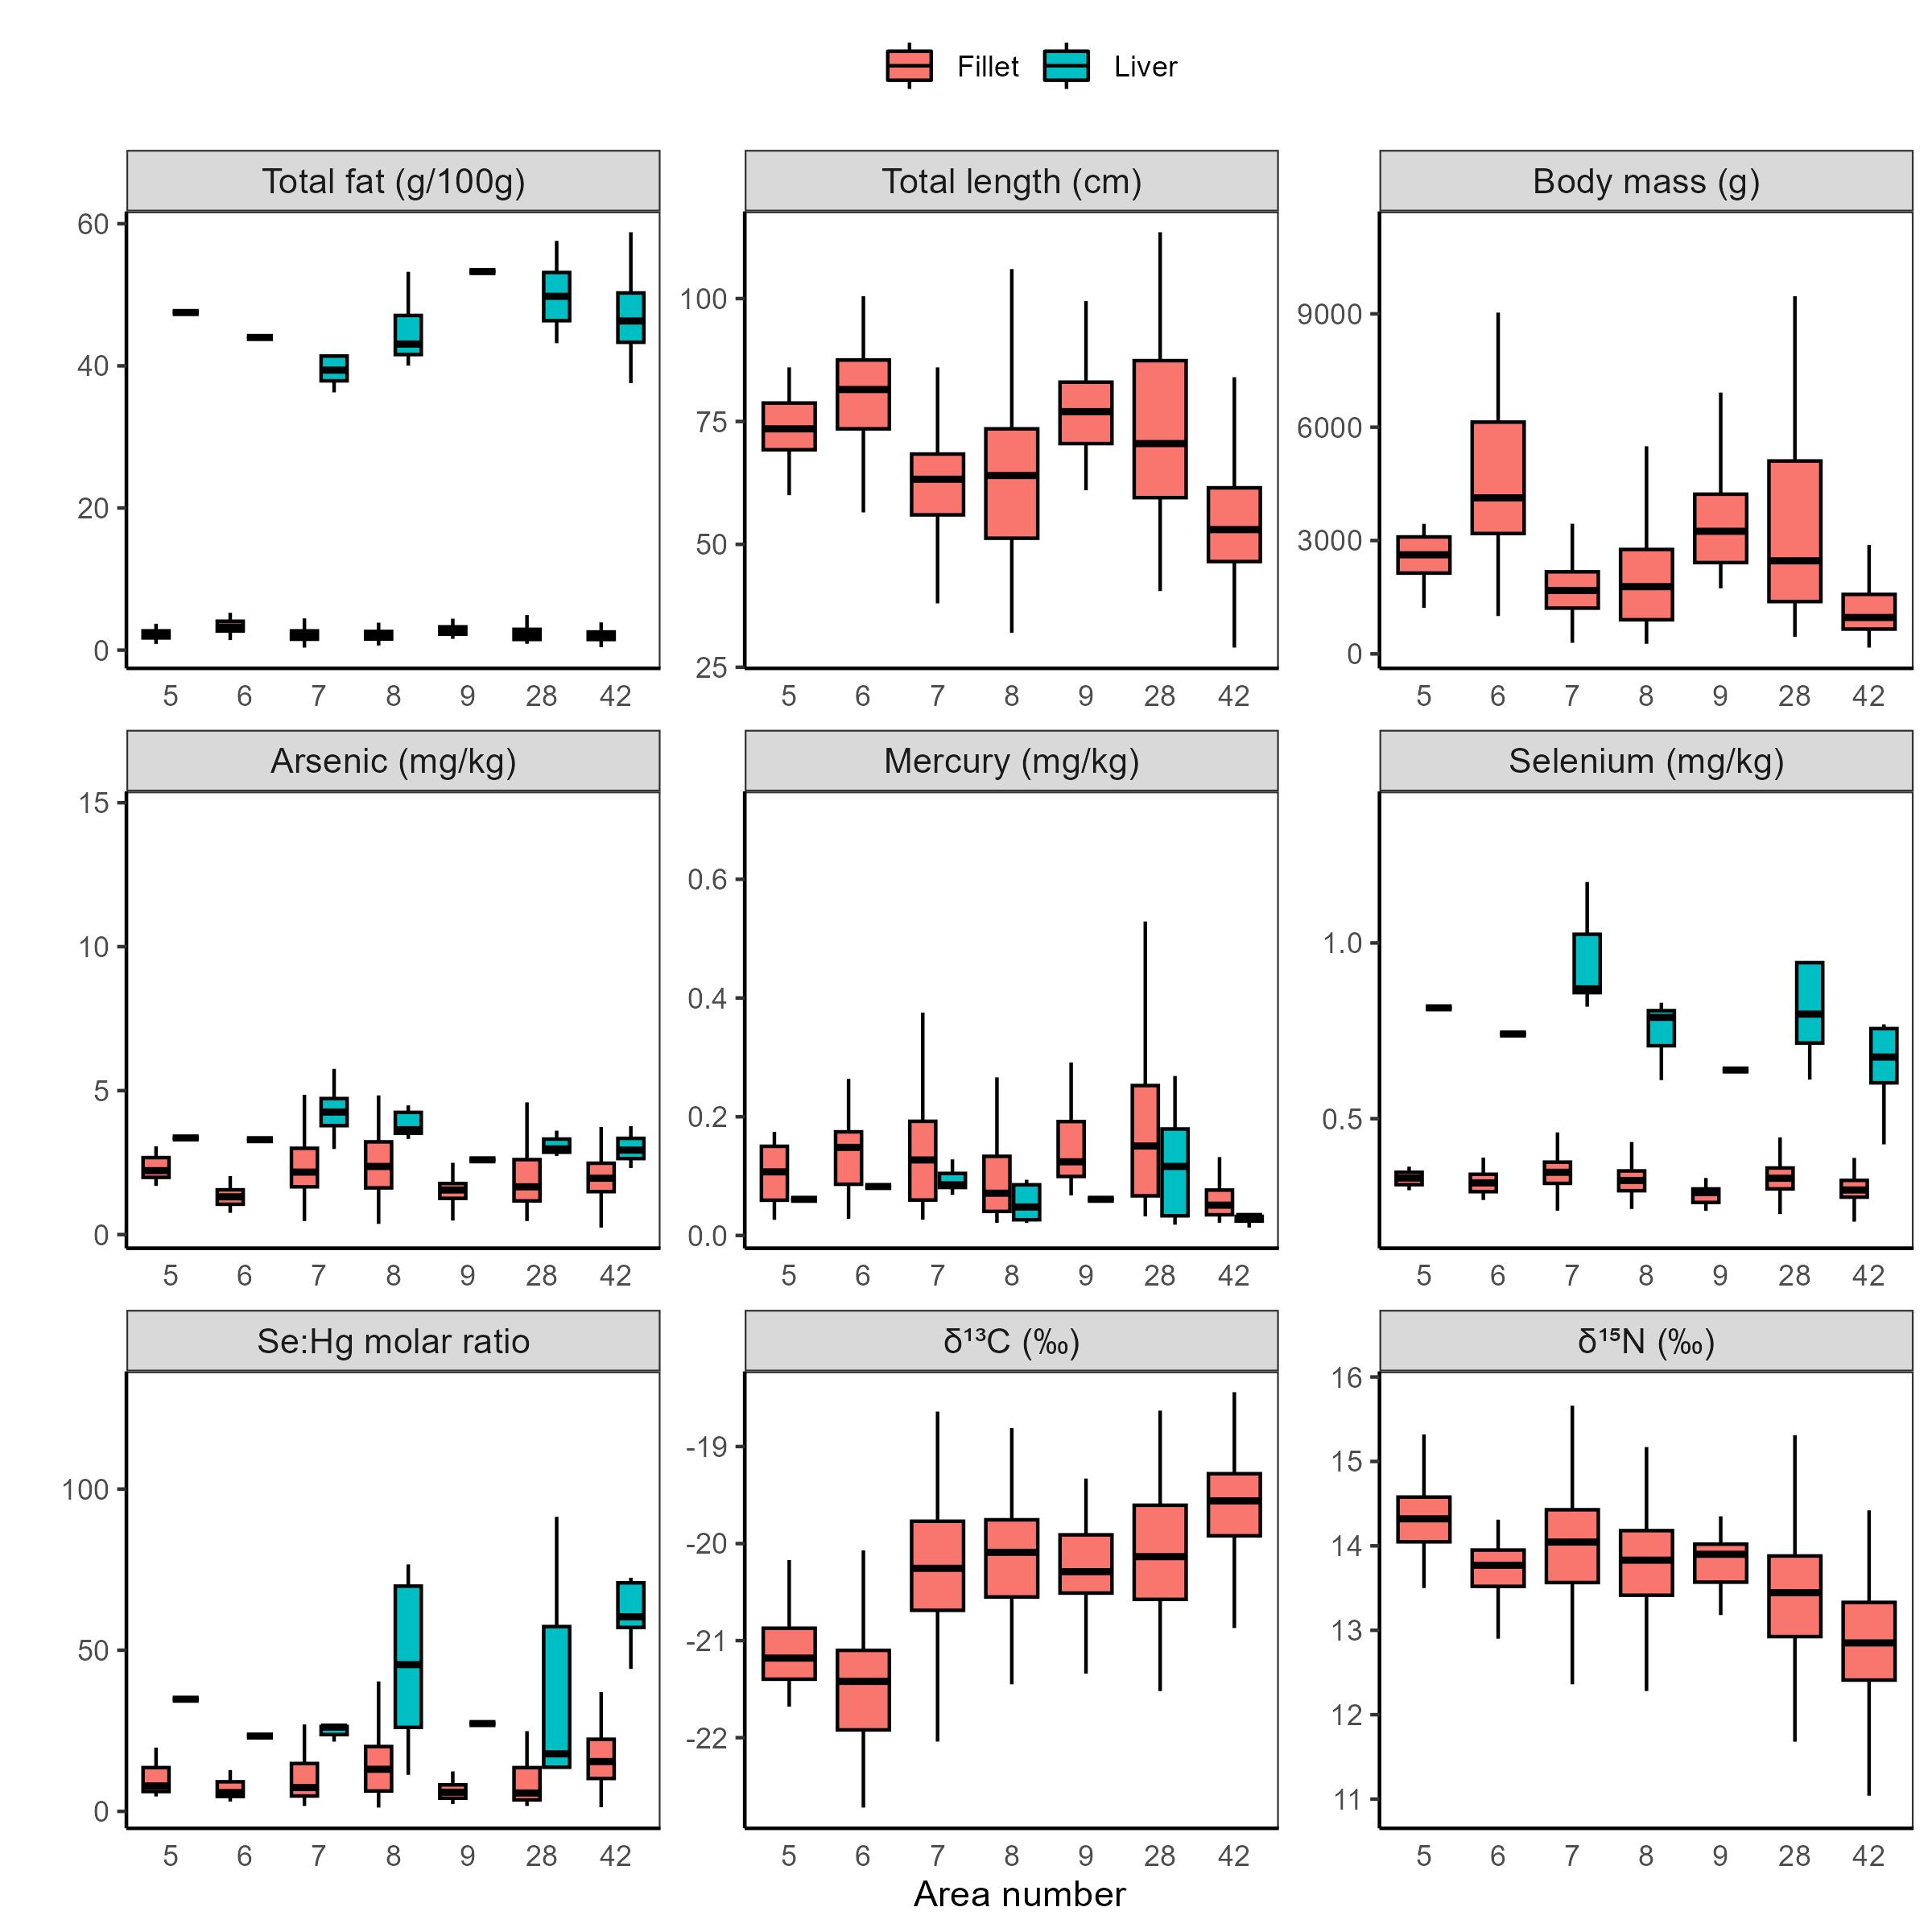
Fat content was determined in fillet from individual fish and in pooled liver samples. There was considerable variation in the fat content of fillet between individuals, from 0.35 to 6.17 (g/100g) (Table 6). Liver fat average was 45.7 (g/100g). European Hake are a semi-lean species and store a larger portion of the fat in the liver. A higher percentage of fish captures were females (67.5%) and males were shorter in length with lower body mass (Table 6). Geographical variation data for physical, biological and fitness parameters, and stable isotopes of carbon and nitrogen are presented in Table 7, and Figure 3.
-
European Hake Parameter n Mean ± SD (Median) Min-max Length (cm) 788 64.3 + 16.4 (62.8) 29.0 - 113.5 Weight (g) 788 2286.8 ± 1907.5 (1685.1) 167.1 - 11160.0 K-factor 788 0.7 ± 0.1 (0.7) 0.4 - 1.0 Liver weight (g) 762 110.4 ± 137.1 (54.8) 2.0 - 951.9 Fat content in liver (g/100g) a 32 45.7 ± 6.9 (44.6) 28.8 - 58.8 Fat content in muscle (g/100g) 761 2.2 ± 1.0 (2.04) 0.4 - 6.2 d13C 788 -20.0 + 0.7 (-20.0) -22.7 - -18.4 d15N 788 13.5 + 0.8 (13.5) 10.9 – 15.8 Sex (% Female) 787 67.5% - Table 5. Overall results for length, weight, K-factor, liver weight, and fat content in muscle and liver from European Hake (Merluccius merluccius) collected in the Northeast Atlantic Ocean 2019-2022.
a) Liver fat content was determined in pooled samples.
| Sex | Length (cm) | Weight (g) |
| Male | 58.8 + 11.4 | 1515.7 + 840.5 |
| Female | 67.2 + 17.5 | 2672.1 + 2144.2 |
| Unknown | 31.5 + 2.7 | 215.6 + 67.0 |
| Area | K-Factor | Fat content in liver (g/100g) | Fat content in fillet (g/100g) |
| 5 | 0.6 + 0.1 | 47.5* | 2.2 + 0.8 |
| 6 | 0.8 + 0.1 | 43.9* | 3.4 + 1.2 |
| 7 | 0.7 + 0.1 | 40.6 + 6.1 | 2.1 + 1.0 |
| 8 | 0.7 + 0.1 | 44.7 + 4.6 | 2.2 + 0.9 |
| 9 | 0.7 + 0.1 | 53.3* | 2.9 + 1.0 |
| 28 | 0.7 + 0.1 | 47.9 + 9.5 | 2.3 + 1.0 |
| 42 | 0.7 + 0.1 | 47.4 + 6.3 | 2.1 + 0.8 |
3.2 - Metals in fillet and liver
The concentrations of 15 different foreign substances determined in fillet and liver of European Hake are provided in Table 8. The essential metals copper, zinc, iron, manganese, and selenium were detected with measurable concentrations in all individual samples of fillet and pooled liver samples for European Hake (Table 8). The concentrations of all these metals, except for mercury and chromium, were higher in liver and lower in fillets. The metals cadmium, silver, chromium, and nickel were present in very low concentrations in all fillet and liver samples. The last three metals, cobalt, molybdenum, and vanadium were also present in very low concentrations in fillet samples, while the concentrations in the liver samples were somewhat higher in European Hake (Table 8). All metal concentration data are presented in Table 8. Mercury was also generally homogeneous across the geographical areas covered in this investigation and were low to intermediate concentrations with only 3 fillet samples (0.38%) above the maximum limit. Coastal European Hake were slightly higher in mercury compared to fish sampled offshore but overall variability was low across the large sampling region, with an identifiable hotspot near the historic waste disposal site at Kollevåg, Askøy, Norway (Figure 2, Figure 3). Mercury in fillets was strongly correlated with fish length ( P <0.05), and only weakly correlated with fat content ( P <0.05, Table 10).
| Element | Tissue Type | N | Mean ± SD* | Median | Min – Max | <LOQ (%) |
| Ag | Fillet | 788 | < 0.002 | <0.002-0.008 | NA | |
| Liver | 30 | 0.05 ± 0.02 | 0.05 | <0.009 – 0.11 | NA | |
| As | Fillet | 788 | 2.2 ± 1.18 | 2.0 | 0.24 – 14.7 | 0 |
| Liver | 30 | 3.61 ± 1.31 | 3.33 | 2.31 – 9.32 | 0 | |
| Cd | Fillet | 788 | - | <0.001 | <0.001 | 100 |
| Liver | 30 | 0.08 ± 0.04 | 0.07 | 0.03 – 0.20 | 0 | |
| Co | Fillet | 788 | <0.004 – <0.006 | <0.004 – <0.006 | NA | |
| Liver | 30 | 0.02 + 0.01 | 0.02 | 0.01– 0.06 | NA | |
| Cr | Fillet | 788 | 0.03+0.07 | 0.01 | <0.004 – 0.89 | NA |
| Liver | 30 | 0.02+0.01 | 0.02 | 0.01 –0.09 | NA | |
| Cu | Fillet | 788 | 0.17 ± 0.04 | 0.16 | 0.10 – 0.86 | 0 |
| Liver | 30 | 7.06 ± 3.97 | 0.05 | 3.19 – 19.27 | 0 | |
| Fe | Fillet | 788 | 1.33 ± 0.48 | 1.2 | 0.66 – 6.34 | 0 |
| Liver | 30 | 36.87 ± 23.92 | 28.60 | 16.63 – 130.85 | 0 | |
| Hg | Fillet | 788 | 0.12 ± 0.10 | 0.08 | 0.02 – 0.71 | 0 |
| Liver | 30 | 0.07 ± 0.06 | 0.05 | 0.01 – 0.27 | 0 | |
| Mn | Fillet | 788 | 0.09 ± 0.03 | 0.09 | 0.04 – 0.28 | NA |
| Liver | 30 | 1.32 ± 0.28 | 1.36 | 0.79 – 2.07 | NA | |
| Mo | Fillet | 788 | - | <0.02 | <0.02 – 0.08 | NA |
| Liver | 30 | <0.05-0.09 | – | NA | ||
| In | Fillet | 788 | - | <0.05 | <0.05 – 0.43 | NA |
| Liver | 30 | <0.1-<0.3 | - | - | NA | |
| Pb | Fillet | 788 | - | <0.04 | 0.004 – 0.13 | NA |
| Liver | 30 | <0.02 | <0.02 | <0.02 – 0.024 | 0 | |
| Se | Fillet | 788 | 0.32 ± 0.05 | 0.32 | 0.19 – 0.49 | 0 |
| Liver | 30 | 0.78 ± 0.18 | 0.77 | 0.43 – 1.37 | 0 | |
| V | Fillet | 788 | - | < 0.001 | <0.001 – 0.001 | NA |
| Liver | 30 | 0.04 ± 0.04 | 0.03 | 0.01– 0.18 | NA | |
| Zn | Fillet | 788 | 3.05 ± 0.32 | 3.00 | 1.82 – 5.66 | 0 |
| Liver | 30 | 44.04 ± 8.51 | 44.09 | 30.52 – 62.08 | 0 |
*Mean and standard deviation (SD) were not determined in cases where more than 50% of the fish had concentrations below the limit of quantification (LOQ).
Arsenic, mercury, selenium, and selenium:mercury molar ratios, fat %, length, and body mass across sampling areas are presented in Figure 3. No upper limit value has been set for arsenic in fish or other seafood in Norway or the EU. Arsenic in fish is mainly in the form of arsenobetaine, a non-toxic compound. The most toxic form of arsenic is inorganic arsenic (EFSA, 2009). In a study conducted in 2009 where the content of total arsenic and inorganic arsenic was measured in a number of Norwegian fish species, very low concentrations of inorganic arsenic were found even when the level of total arsenic was very high (Julshamn et al. 2012).
| Hg in Fillet (Direction of Relationship) | Regression Equation R2 Value | P-Value |
| Total Length (+) | y = -0.1766 + 0.0046x R² = 0.55 | <0.05 |
| Fat Content (g/100g) (+) | y = 0.06 + 0.0251x R² = 0.06 | <0.05 |
3.3 - Organic pollutants in fillet and liver
3.3.1 - Dioxins and PCBs
The persistent organic pollutants dioxins (PCDD), furans (PCDF), dioxin-like PCBs (mono-ortho-PCBs and non-ortho-PCBs B; dl-PCBs) and non-dioxin-like PCBs (PCB6) were determined in fillet samples from individual fish and in pooled samples of liver, and the results for total PCDD/F, sum dl-PCB, sum PCDD/F+dl-PCB and sum PCB6 are summarized in Table 11.
The concentrations of total PCDD/F, sum dl-PCB, sum PCDD/F+dl-PCB and PCB6 in fillet and liver were generally low in European Hake. The mean concentration of total PCDD/F in fillet was 0.30 ng TE/kg wet weight, and no single fish had concentrations above the limit value applicable to total PCDD/F in fish fillet for human consumption of 3.5 ng TE/kg wet weight (EU, 2018; Regulations relating to certain pollutants in foods ). The average concentration of total dl-PCBs was higher compared to PCDD/F in both fillet and liver (Table 11) samples, and it was thus the dioxin-like PCBs that contributed most to the total PCDD/F+dl-PCB in this species. The mean concentration of total PCDD/F+dl-PCBs was 0.53 ng TE/kg wet weight in fillet and 14.36 ng/TE kg wet weight in the liver of European Hake, and the average concentrations were thus far below the limit values for PCDD/F+dl-PCB, which are 6.5 ng TE/kg wet weight for fillet and 20 ng TE/kg wet weight for liver. No fillet samples were above limit values, but 2 samples were higher than maximum limit values in liver. The concentrations of total PCB6 were variable with some higher concentrations detected and with an average concentration of 4.81 μg/kg wet weight in fillet and 153.62 μg/kg wet weight in liver, below the limit values of 75 μg/kg wet weight for fillet and 200 μg/kg wet weight for liver. However, we detected 2 samples in fillet (0.25%) and 6 liver samples (18.8%) above maximum limits for PCB6.
| n | Mean ± SD | Median | Min – Max | #>ML a | ||
| PCDD/F (of TEQ/kg ww) | Fillet | 788 | 0.3 ± 0.7 | 0.2 | 0.02 – 1.0 | 0 |
| Liver | 32 | 3.1 ± 1.6 | 2.7 | 1.58 – 9.4 | 0 | |
| dl-PCB (of TEQ/kg ww) | Fillet | 788 | 0.3 ± 0.5 | 0.2 | 0.02 – 5.7 | - |
| Liver | 32 | 7.3 + 14.2 | 7.3 | 2.90 – 83.9 | - | |
| PCDD/F+dl-PCB (ng TEQ/kg ww) | Fillet | 788 | 0.5 ± 0.6 | 0.4 | 0.05 – 6.3 | 0 |
| Liver | 32 | 14.4 ± 15.5 | 10.1 | 4.47-93.3 | 2 | |
| PCDD/F+dl-PCB (ng TEQ/kg fw) | Fillet | 761 | 25.5 ± 31.9 | 15.5 | 5.17 – 269.7 | - |
| Liver | 32 | 36.1 ± 55 | 21 | 7.60 – 324.1 | - | |
| PCB6 (μg/kg ww) | Fillet | 788 | 4.8 ± 9.1 | 2.1 | 0.17 – 131.3 | 2 |
| Liver | 32 | 153.6 ± 246.7 | 88.9 | 12.04 – 1427.6 | 6 | |
| PCB6 (μg/kg fw) | Fillet | 761 | 23.1 ± 44.6 | 10.1 | 0.84 – 634.1 | - |
| Liver | 32 | 406.5 ± 860.4 | 190.4 | 26.66 – 4958.7 | - |
a Maximum level (ML) for PCDD/F is 3.5 ng TE/kg ww in fish fillet, ML for PCDD/F+dl-PCB is 6.5 ng TE/kg ww in fish fillet and 20 ng TE/kg ww in fish liver, and ML for sum PCB6 is 75 μg/kg ww in fish fillet and 200 μg/kg ww in liver.
The concentrations of dioxins and PCBs in the liver of European Hake were consistently higher than in fillets (Table 11). It is common for many contaminants to accumulate in the liver of fish since liver is the detoxification organ, but the large difference between the concentrations in fillet and liver in European Hake can also to a large extent be explained by differences in organ-specific fat content. The two samples above the maximum limits for PCB6 in fillets were sampled near Kollevåg, a historic (1930-1975) waste disposal site close to Askøy, Norway.
PCDD/F+dl-PCB in fillet – relationship with size and fat content
There was a weak but significant positive correlation between both the size of the fish and fat content, and the concentration of total PCDD/F+dl-PCB in fillets (Figure 11). As with mercury, the concentration of PCDD/F+dl-PCBs increased with increasing size of fish, but this relationship only explained 7% of the variance and fat content only explained 5% of the variance indicating a very weak relationship largely driven by the large sample sizes (Table 12).
-
PCDD/F+dl-PCB in Fillet (Direction of Relationship) Linear Regression Equation R2 Value P-Value Total Length (+) y =-0.0597 + 0.0092x R² = 0.07 <0.05 Fat Content (g/100g) (+) y = 0.2226 + 0.1355x R² = 0.05 <0.05 Table 12. Regression statistics of the relationship between fish length (cm) and fat content (g/100g) and concentration of sum PCDD/F+dl-PCB (ng TEQ/kg wet weight) in European Hake (Merluccius merluccius) fillets.
Variation in the level of dioxins and dioxin-like PCBs, sum PCDD/F+dl-PCB, between areas.
The concentrations of dioxins and PCBs in fillet and liver of European Hake varied between sampling areas as shown for total PCDD/F+dl-PCB calculated on a wet weight basis and calculated on a fat weight basis (Table 13). Area 6 was highest for these contaminants in fillets and area 28 was highest for liver on a wet weight basis. Further details can be explored in Table 13.
| Area | Fillet PCDD/F+dl-PCB (ng TEQ/kg ww) | Liver PCDD/F+dl-PCB (ng TEQ/kg ww) | Fillet PCDD/F+dl-PCB (ng TEQ/kg fw) | Liver PCDD/F+dl-PCB (ng TEQ/kg fw) |
| 5 | 0.7 + 0.4 | 18.3 | 32.5 + 18.1 | 38.5 |
| 6 | 0.9 + 0.9 | 10.4 | 26.7 + 26.8 | 23.6 |
| 7 | 0.8 + 0.6 | 20.4 + 6.6 | 42.9 + 35.8 | 51.6 + 20.4 |
| 8 | 0.4 + 0.2 | 12 + 3 | 16.9 + 9.0 | 27.2 + 8.3 |
| 9 | 0.5 + 0.2 | 9.7 | 17.0 + 7.2 | 18.2 |
| 28 | 0.7 + 0.9 | 21.3 + 31.8 | 36.4 + 53.6 | 61.9 + 115.6 |
| 42 | 0.3 + 0.2 | 7.3 + 2.2 | 13.5 + 44 | 16 + 5.8 |
Variation in PCB6 between areas.
The concentrations of PCB6 in European Hake varied between areas with fish from coastal areas being slightly more contaminated (Figure 2, Table 14). All PCB6 data are calculated on both a wet weight basis and a fat weight basis in both fillet and liver. All data, categorized by geographical sampling area, are presented in Table 14. PCB6 was highest in area 28 for fillets and liver on a wet weight basis. Further details for PCB6 in fillet and liver can be explored in Table 14.
| Area | Fillet PCB6 (μg/kg ww ) | Liver PCB6 (μg/kg ww) | Fillet PCB6 (μg/kg fw) | Liver PCB6 (μg/kg fw) |
| 5 | 3.5 + 2.8 | 136.0 | 32.5 + 18.1 | 286.3 |
| 6 | 6.5 + 6 | 73.4 | 26.7 + 26.8 | 166.9 |
| 7 | 8 + 8.1 | 239.6 + 103.9 | 42.9 + 35.8 | 607.6 + 299.3 |
| 8 | 3 + 2.9 | 104.5 + 49.2 | 16.9 + 9.0 | 239.8 + 126.8 |
| 9 | 3.5 + 2 | 114.2 | 17.0 + 7.2 | 214.4 |
| 28 | 8.2 + 16.3 | 280.4 + 506 | 36.4 + 53.6 | 859 + 1808 |
| 42 | 1.6 + 1.5 | 51.2 + 25.0 | 13.5 + 44 | 111.6 + 59.8 |
3.3.2 - Brominated flame retardants (PBDE, HBCD and TBBPA)
The concentrations of brominated flame retardants in European Hake fillets (Total PBDE7 and PBDE-47) were generally low (Table 15). Total PBDE7 (PBDE-28, 47, 99, 100, 153, 154 and 183) in fillet ranged from 0.02 to 7.51 μg/kg wet weight with an average of 0.44 μg/kg wet weight for European Hake (Table 15). PBDE-47 was the dominant congener in the totals, with an average of 0.26 μg/kg wet weight for European Hake. The average concentrations of PBDE7 and PBDE-47 in the fillet of European hake were similar to concentrations found in fillet of oily fish such as herring, mackerel, Greenland halibut and Atlantic halibut (0.47-2.1 μg/kg wet weight; Frantzen et al., 2009, Duinker et al., 2013, Frantzen et al., 2010, Nilsen et al. 2010, Nilsen et al., 2016), but higher than the average concentrations found in lean fish such as cod, saithe, haddock and tusk (0.0051-0.077 μg/kg wet weight; sjomatdata.hi.no). Concentration data on total PBDE7 and PBDE-47 in liver are also reported in Table 15. The concentrations of total HBCD (sum of α, β and γ-HBCD) were not measured in fillets since European Hake are considered a lean fish. Average concentrations of total HBCD and α-HBCD in liver were 3.42 and 3.40 respectively and ranged from 0.61 to 14.6 μg/kg ww (Table 15). The concentration of TBBP-A in liver was very low and ranged from <0.04-6.14 μg/kg ww with a mean value of 0.51 μg/kg ww (Table 15).
-
n Mean ± SD Median Min – Max #<LOQ Total PBDE7* (μg/kg ww) Fillet 744 0.4 ± 0.7 0.2 0.02 – 7.5 0 Liver 28 12.9 ± 10.8 8.9 3.7 – 51.3 0 PBDE-47 (μg/kg ww) Fillet 788 0.3 ± 0.4 0.1 0.01 – 4.8 - Liver 32 7.3 ± 6.9 4.9 0.5 – 30.6 - Total HBCD* (μg/kg ww) Fillet - NA – – - Liver 32 3.4 ± 2.7 2.8 0.6 –14.6 0 α -HBCD ( μ g/kg ww) Fillet - NA – – - Liver 32 3.4 ± 2.7 2.8 0.6 – 14.6 0 TBBP-A (μg/kg ww) Fillet - NA – – - Liver 32 0.5 + 1.1 0.2 <0.04 – 6.1 5 Table 15. Brominated flame retardants in European Hake (Merluccius merluccius) . Overall concentrations (μg/kg wet weight) of sum 7 PBDEs (PBDE7) and PBDE-47, in fillet and liver and sum HBCD (sum of α-, β-, and γ-HBCD), α-HBCD and TBBP-A in liver only from fish sampled in the Northeast Atlantic Ocean in 2019-2022. For PBDE7 and HBCD results are also given on fat weight basis (μg/kg fw). Results are given as mean ± standard deviation (SD), minimum and maximum values, median, n = samples size, and the number of samples with concentrations below the limit of quantification (LOQ) is shown.
*Calculated as upperbound (UB) sums, i.e., concentrations <LOQ are set as equal to LOQ.
Variation in concentrations of PBDE7 and HBCD between regions.
The concentrations of PBDE7 (fillet and liver) and HBCD (liver only) in European Hake are presented in Table 16. HBCD in liver was greatest in area 7 and lowest in area 42 and generally consistent and similar throughout all other sampling areas (Table 16). PBDE7 concentrations in fillet and liver were also highest in area 7 which included several fjord and coastal samples of European Hake (Figure 2, Table 16). Area 28 was second highest for PBDE7 in both fillet and liver samples and then generally similar across all other areas (Figure 2, Table 16).
Table 16. Concentrations of PDE7 (fillet and liver) and sum HBCD (liver only) on wet weight basis (μg/kg ww). Concentration of sum PBDE-7 on a wet weight basis (μg/kg ww) in fillet and liver of European Hake (Merluccius merluccius) during 2019-2022. Data values represent mean ± SD when n>1.
| Area | Liver HBCD (μg/kg ww) | Liver PBDE7 (μg/kg ww) | Fillet PBDE7 (μg/kg ww) |
| 5 | 5 | 12.8 | 0.3 + 0.3 |
| 6 | 3.4 | 8.4 | 0.7 + 0.7 |
| 7 | 50.9 + 2.2 | 22.9 + 10.2 | 0.8 + 0.9 |
| 8 | 2.4 + 1.1 | 8.3 + 2.5 | 0.3 + 0.3 |
| 9 | 3.1 | 8.8 | 0.3 + 0.2 |
| 28 | 4.7 + 4.5 | 15 + 16.1 | 0.6 + 1 |
| 42 | 2 + 1 | 6.6 + 2.2 | 0.2 + 0.2 |
3.3.3 - Chlorinated pesticides
Pesticides were determined in 31 pooled samples of liver in European Hake and the full results are shown in Table 17 and Table 18. All samples measured for alpha-HCH, beta-HCH, were <LOQ. Pentachlorobenzene, Hexachlorobenzene (HCB), Dieldrin, and Trans-nonachlor had no samples <LOQ, while Mirex had 32.30% <LOQ. Further details on pesticide values can be explored in full detail in Table 17 and Table 18.
| n | Mean ± SD a | Median | Min – Max | <LOQ (%) | ||
| Pentachlorobenzene | Liver | 31 | <1.3 | <1.2 - <1.9 | <1.2 – <1.9 | 0 |
| Hexachlorobenzene (HCB) | Liver | 31 | 11.4 + 2.3 | 11.8 | 7.4 – 16.1 | 0 |
| Alpha-HCH | Liver | 31 | - | <0.46 - <0.6 | <0.5 – <0.6 | 100 |
| Beta-HCH | Liver | 31 | - | <0.46 - <0.9 | <0.5 – <0.9 | 100 |
| Dieldrin | Liver | 31 | 9.4 – 1.8 | 9.5 | 4.8 – 13.5 | 0 |
| Mirex | Liver | 31 | 1.1 + 0.7 | 0.9 | 0.3 – 3.8 | 32.30 |
| Trans-nonachlor | Liver | 31 | 15.6 + 9.3 | 13.8 | 2.8 – 46 | 0 |
| Cis-heptachlor epoxide | Liver | 31 | 1.2 + 0.2 | 1.2 | 0.7 – 1.8 | 16.13 |
a Mean ± SD was not determined when more than 50% of the fish had concentrations below LOQ.
| n | Mean ± SD a | Median | Min – Max | <LOQ (%) | ||
| o,p'-DDD | Liver | 31 | 1.7 + 1.2 | 1.3 | 0.5 – 5.5 | 16.1 |
| o,p'-DDE | Liver | 31 | – | <0.25 – 0.67 | <0.3 – 0.7 | 100 |
| o,p'-DDT | Liver | 31 | 2.1 + 1.2 | 2.1 | 0.5 – 6 | 22.6 |
| p,p'-DDD | Liver | 31 | 14.2 + 11.7 | 10.1 | 2.9 – 61 | 0 |
| p,p'-DDE | Liver | 31 | 59 + 51.2 | 39.3 | 11.9 – 216 | 0 |
| p,p'-DDT | Liver | 31 | 8.6 + 7.1 | 6.9 | 1.5 – 34.4 | 0 |
| Sum DDT b | Liver | 13 | 77.6 + 42 | 62.5 | 51.9 – 203 | 0 |
| Toxaphene 26 | Liver | 31 | 10.2 + 3.9 | 10.5 | 3.7 – 18 | 0 |
| Toxaphene 50 | Liver | 31 | 20.4 + 8.2 | 20.9 | 6.6 – 40.6 | 0 |
| Toxaphene 62 | Liver | 31 | 5.6 + 2.7 | 4.9 | <2.5 – 11.4 | 0 |
| Sum Toxaphene c | Liver | 18 | 37.8 + 12.5 | 39.2 | 14.1 – 56.9 | 0 |
| Cis-Chlordane | Liver | 31 | 7.6 + 3.4 | 6.8 | 1.6 – 15.5 | 0 |
| Trans-chlordane | Liver | 31 | – | 0.6 | <0.3 – 1.4 | 87.1 |
| Oxychlordane | Liver | 31 | 2 + 0.8 | 1.9 | 1 – 4 | 3.2 |
| Sum Chlordane d | Liver | 13 | 10.4 + 3.2 | 10.8 | 5.1 – 15 | 0 |
A Mean ± SD was not determined when more than 50% of the fish had concentrations below LOQ. b Sum DDTis the upperbound sum of o,p'DDT, p,p'DDT, o,p'DDD, p,p'DDD, o,p'DDE, p,p'DDE, expressed as DDT. c Sum Toxaphene is the upperbound sum of toxaphene 26, toxaphene 50 and toxaphene 62. d Sum Chlordane is the upperbound sum of cis-chlordane, trans-chlordane and oxychlordane, expressed as chlordane.
Variation in Total DDT, Total Toxaphene and Total Chlordane concentrations between areas
The concentrations of sum DDT, total toxaphene, and sum chlordane in liver of European Hake varied between sampling areas as shown in Table 19. Area 7 had the highest liver concentrations for sum DDT, total toxaphene, and sum chlordane and area 8 had the lowest concentrations (Table 19).
| Area | Liver (n=13) DDT (μg/kg ww | Liver (n=18) Toxaphene (μg/kg ww) | Liver (n=13) Chloradane (μg/kg ww) |
| 5 | NA | NA | NA |
| 6 | 80.4 | 45.9 | 13.5 |
| 7 | 148.8 + 76.7 | 48.2 + 9.9 | 13.6 + 0.2 |
| 8 | 50.2 + 2.4 | 34.1 + 17.5 | 7.9 + 4.1 |
| 9 | 54.1 | 16.4 | 5.7 |
| 28 | 63.2 + 12.8 | 35.7 + 9.2 | 9.9 + 3.5 |
| 42 | 65 + 12.9 | 38.6 + 6.9 | 11.4 + 1.6 |
3.3.4 - Per- and polyfluorinated alkyl substances (PFAS)
Analyses were performed for 19 different per- and polyfluorinated alkyl substances (PFAS) in fillet (n=31) and 15 different PFAS in pooled liver samples (n=31) of European Hake, and the results are summarized in Table 20. The vast majority of PFAS compounds were present at very low concentrations in all pooled samples of European Hake, and concentrations were below the limit of quantification (LOQ) for all fillet and liver samples except for PFUdA and PFTeDA in fillet and PFOSA and PFUdA in liver samples (Table 20). There are currently no limit values for PFAS in food, but EFSA has established tolerable weekly intake (TWI) limits for PFOS and PFOA of 13 and 6 ng/kg body weight respectively (EFSA, 2018). These results show that concentrations were generally low in all samples.
As a point of reference, new regulations on maximum levels in Perfluoroalkyl substances have now been established and went into effect on 25 April 2023, after the fish sampling period of 2019-2022. The new maximum level applies to the wet weight. PFOS: perfluorooctane sulfonic acid, PFOA: perfluorooctanoic acid, PFNA: perfluorononanoic acid, PFHxS: perfluorohexane sulfonic acid. For PFOS, PFOA, PFNA, PFHxS and their sum, the maximum level refers to the sum of linear and branched stereoisomers, whether they are chromatographically separated or not. For the sum of PFOS, PFOA, PFNA and PFHxS, maximum levels refer to lower bound concentrations, which are calculated on the assumption that all the values below the limit of quantification are zero. Values range from 0.2-35.0 mg/kg wet wt. and depend on fish species and the Perfluoroalkyl substance type (EU Commission 2023).
-
Substance Fillet (n=31) Liver (n=31) Min-Max #>LOQ Mean ± SD a Min – Max #>LOQ PFBS <1.0 0 <5.0 <5.0 0 PFHxS <1.0 0 <3.0 <3.0 0 PFOS <0.2 0 <3.0 <3.0 0 PFDS <0.2 0 <0.5 <0.5 0 PFOSA <0.5 0 1.2+0.6 <0.5-3.1 27 PFBA <1.0 0 <10.0 <10.0 0 PFHxA <0.5 0 <2.0 <2.0 0 PFHpA <0.2 0 <5.0 <5.0 0 PFOA <0.6 0 <1.7 <1.7 0 PFNA <0.2 0 <0.5 <0.5 0 PFDA <0.2 0 <0.5 <0.5 0 PFUdA <0.2-0.22 2 0.52+0.07 <0.50–0.84 4 PFDoDA <0.2 0 <2.0 <2.0 0 PFTrDA <0.2 0 <0.5 <0.5 0 PFTeDA <0.2-0.5 1 <0.5 <0.5 0 N-EtFOSA <1.5 0 Not Measured - 0 N-EtFOSE <1.0 0 Not Measured - 0 N-MeFOSA <1.0 0 Not Measured - 0 N-MeFOSE <0.5 0 Not Measured - 0 Table 20. Perfluorinated alkyl substances (PFAS) in European Hake (Merluccius merluccius) . Concentrations (μg/kg ww) 31 fillet and 31 composite liver samples from fish sampled in the Northeast Atlantic Ocean in 2019-2022. Results for fillets are given as concentration range (min-max), and results for liver are given as mean ± standard deviation (SD) and concentration range (min-max). The number of samples with concentrations above the limit of quantification (LOQ) is shown.
a Mean ± SD was only calculated when more than 50% of the samples contained quantifiable concentrations. Only samples with concentrations above LOQ were used for the calculation of mean ± SD.
4 - Conclusions
In this work, a comprehensive survey has been conducted to assess contaminants in European Hake from an important fishery area throughout Norway.
Contaminant concentrations in European Hake fillets were mostly below the EU and Norway's limit values for contaminants in fish muscle for human consumption where such are present (cadmium, lead, mercury, sum dioxins (PCDD/F), sum dioxins and dioxin-like PCBs (PCDD/F+dl-PCB) and PCB6). Only 3 (0.38%) individual fish had concentrations above these limit values in fillets for mercury largely driven by a hotspot near the historic waste disposal site at Kollevåg, Askøy, Norway (Figure 2, Figure 3). For PCB6, only 2 samples in fillet (0.25%) and 6 liver (18.8%) samples were above the maximum limits. For PCDD/F+dl-PCB, only 2 (6.25%) liver samples were above the maximum limit (Table 11). The hotspot near the historic Kollevåg waste disposal site may warrant further surveillance in conjunction with the contaminated fjord and harbors program.
The concentrations of cadmium and lead in fillets were very low, and similar to several other marine fish species from Norwegian waters. Mercury concentrations were generally comparable or slightly higher than the concentrations previously reported for cod, saithe, herring, and mackerel, and much lower than the concentrations reported for Greenland halibut and Atlantic halibut. The concentrations of the persistent organic pollutants PCDD/F, PCDD/F+dl-PCB, PCB6 and PBDE7 in fillets of European Hake, which are considered a lean fish species, were somewhat lower than the concentrations previously found in the fillet of fatty fish species such as herring and mackerel, significantly lower than the concentrations in fillets from Greenland halibut, and comparable to other lean fish species such as cod and saithe, which also have very low concentrations in fillets. Fillet concentrations of most chlorinated pesticides examined in this work were very low in this species, with concentrations below the LOQ in most samples. However, DDT, toxaphene, chlordane, HCB, dieldrin and trans-nonachloro were found in measurable concentrations in most fillet samples, and the concentrations of these were largely within the same concentration range previously found for several other fish species in Norway. The concentrations of per- and polyfluorinated alkyl substances (PFAS) were very low in European Hake, with concentrations below LOQ in most fillet and liver samples analyzed.
The findings of this study have shown that although European Hake are long lived and large-bodied, and that contaminants in fillets and liver of this species were generally low and homogeneous throughout the large study area, with a few exceptions near the historic Kollevåg waste disposal site near Askøy, Norway. With very few exceptions, in all areas studied, the concentrations in fillets were below the limit values for food safety, including in the largest individuals.
5 - Abbreviations/Abbreviations
Ag – Silver
Ås – Arsenic
CD – Cadmium
cm – centimeter
Co-cobalt
Cr – Chromium
Cu – Copper
DDD - Dichlorodiphenyldichloroethane
DDE – Dichlorodiphenyldichloroethene
DDT – Dichlorodiphenyltrichloroethane
dl-PCB – Dioxin-like PCB
EFSA – European Food Safety Authority
EU – European Union
FAO – Food and Agriculture Organization of the United Nations
Fe – Iron
FW – Fat Weight
g – gram
GC-MSMS – Gas chromatography-tandem mass spectrometry
HBCD – Hexabromocyclododecane
HCB – Hexachlorobenzene
HCH – Hexachlorocyclohexane
Hg – Mercury
HRGC-HRMS – High-resolution gas chromatography mass spectrometry
ICES – International Committee on the Exploration of the Sea
ICPMS – Inductively coupled plasma mass spectrometry
ISO – International Standardisation Body
K-factor – fitness factor: 100 x w/length3
kg – kilogram
LB – Lowerbound: At concentrations below LOQ, the value is set equal to 0
LC-MSMS – Liquid chromatography-tandem mass spectrometry
LOQ – Quantification Limit, Determination Limit
et al. — and others
mg – milligrams
μg – micrograms
ML – maximum level – upper limit
Mn – Manganese
Mo – Molybdenum
MU – measurement uncertainty
N-EtFOSA – N-ethyl perfluorooctanesulfonamide
N-EtFOSE – N-ethyl perfluorooctanesulfonamidoethanol
N-MeFOSA – N-methyl perfluorooctanesulfonamide
N-MeFOSE – N-methylperfluorooctanesulfonamidoethanol
ng – nanogram
Nine – Nickel
Pb – Lead
PBDE – Polybrominated diphenyl ethers
PBDE7 – Sum of seven PBDEs (PBDE-28, -47, -99, -100, -153, -154 and -183)
PCB – Polychlorinated biphenyls
PCB6 – Sum of six non-dioxin-like PCBs (PCB-28, -52, 101, -138, -153 and -180)
PCDD – Polychlorinated dibenzodioxins
PCDF – Polychlorinated dibenzofurans
PCDD/F – Sum of PCDD and PCDF
PCDD/F+dl-PCB – Sum of PCDD/F and dl-PCB
PFAS – Per- and polyfluorinated alkyl substances
PFBA – Perfluorobutanoic acid
PFBS – Perfluorobutanesulfonic acid
PFDA – Perfluorodecanoic acid
PFDoDA – Perfluorodanodecanoic acid
PFDS – Perfluorodecanesulfonic acid
PFHpA – Perfluoroheptanic acid
PFHxA – Perfluorohexanoic acid
PFHxS – Perfluorohexanesulfonic acid
PFOA – Perfluorooctanoic acid
PFOS – Perfluorooctanesulfonic acid
PFOSA – Perfluorooctanesulfonamide
PFNA – Perfluoronone Anoic Acid
PFPeA – Perfluoromenanic acid
PFTeDA – Perfluorotetradecan acid
PFTrDA – Perfluorotridecanoic acid
PFUdA – Perfluoroundecanic acid
POP – Persistent Organic Pollutant
SD – Standard deviation
See – Selenium
TBBP-A – Tetrabromobisphenol A
TE – Toxicological equivalents; English TEQ – Toxic equivalents
TEF – Toxicological equivalent factors
TWI – Tolerable weekly intake
UB – Upperbound: At concentrations below LOQ, the value is set equal to LOQ
V - Vanadium
VV – wet weight
WHO – World Health Organization – OurHealth Organization
WW – Wet Weight
Zn – Zinc
6 - References
de Pontual, H., Bertignac, M., Battaglia, A., Bavouzet, G., Moguedet, P., and Groison, A. L. (2003). A pilot tagging experiment on European hake ( Merluccius merluccius ): methodology and preliminary results. ICES Journal of Marine Science, 60: 1318–1327.
Duinker, A., Frantzen, S., Nilsen, B., Måge, A., Nedreaas, K. and Julshamn, K. (2013). Baseline investigation of contaminants in North Sea herring ( Clupea harengus ). NIFES report. Bergen, NIFES: 26 pp.
EFSA (2009). EFSA panel on contaminants in the food chain (CONTAM); Scientific opinion on arsenic in food. EFSA Journal 2009 7(10): 199 pp.
EFSA (2018). Scientific Opinion on the risk to human health related to the presence of perfluorooctanesulfonic acid and perfluorooctanoic acid in food. EFSA Journal 16 (12):5194: 284.
EU (2018). Commission regulation (EC) No. 1881/2006 of 19 December 2006 setting maximum concentrations for certain contaminants in foodstuffs (Text with EEA relevance). Official Journal of the European Union. Consolidated version 19.03.18. https://eur-lex.europa.eu/legal-content/EN/TXT/PDF/?uri=CELEX:02006R1881-20180319&from=EN
EU Commission. 2023. Commission Regulation (EU) 2023/915 of 25 April 2023 on maximum levels for certain contaminants in food and repealing Regulation (EC) No 1881/2006 (Text with EEA relevance). http://data.europa.eu/eli/reg/2023/915/oj.
FOR-2015-07-03-870: Regulations relating to certain pollutants in foods, § 3 Implementation of Regulation (EC) No 1881/2006. https://lovdata.no/dokument/SF/forskrift/2015-07-03-870
Frantzen, S., Måge, A., and Julshamn, K. (2009). Baseline investigation of contaminants in Norwegian Spring-Spawning Herring. NIFES report. Bergen, NIFES: 24 pp.
Frantzen, S., Måge, A. and Julshamn, K. (2010). Baseline investigation of contaminants in mackerel ( Scomber scombrus ). NIFES report. Bergen, NIFES: 34 pp.
Ho, Q.T., Bank, M.S., Azad, A.M., Nilsen, B.M., Frantzen, S., Maage, A., Kogel, T., Sanden, M., Frøyland, L., Duinker, A., Hove, H., Lundebye, A-K., Nøstbakken, O.J., and Madsen, L. (2021). Co-occurrence of contaminants in marine fish from the Northeast Atlantic Ocean: implications for human risk assessment. Environment International 157: 106858.
Julshamn, K., Maage, A., Norli, H. S., Grobecker, K. H., Jorhem, L., Fecher, P., de la Hinojosa, I. M., Viehweger, L., Mindak, W., & Lindholm, K. (2007). Determination of arsenic, cadmium, mercury, and lead by inductively coupled plasma/mass spectrometry in foods after pressure digestion: NMKL interlaboratory study. Journal of AOAC International, 90(3), 844-856.
Julshamn, K., Nilsen, B.M., Frantzen, S., Valdersnes, S., Maage, A., Nedreaas, K. and Sloth, J.J. (2012). Total and inorganic arsenic in fish samples from Norwegian waters. Food Additives & Contaminants Part B-Surveillance 5(4): 229-235.
Julshamn, K., Duinker, A., Valdersnes, S., Lunestad, B.T. and Måge, A. (2013). The Norwegian Food Safety Authority's programme: Environmental toxins in fish and fish products 2012. - Investigation of contaminants in king crab ( Paralithodes camtschaticus ) and oils. Norwegian Food Safety Authority, annual report 2012, 28 pages.
Nilsen, B.M., Frantzen, S., Nedreaas, K. and Julshamn, K. (2010). Baseline investigation of undesirable substances in Greenland halibut ( Rheinhardtius hippoglossoides ). NIFES report. Bergen, NIFES: 42 pp.
Nilsen, B.M., Kjell Nedreaas and Måge, A. (2016). Mapping of contaminants in Atlantic halibut ( Hippoglossus hippoglossus ). Final report for the programme "Environmental toxins in fish and fish products" 2013-2015. NIFES Report (ISBN: 978-82-91065-43-4), 81 pages.
Staby, A., Skjæraasen, J. E., Geffen, A. J., and Howell, D. (2018). Spatial and temporal dynamics of European hake ( Merluccius merluccius ) in the North Sea. ICES Journal of Marine Science, doi:10.1093/icesjms/fsy103.
Sundby, S., Kristiansen, T., Nash, R., & Johannessen, T. (2017). Dynamic mapping of North Sea spawning – Report of the KINO Project. Fisken og Havet, 2, 195.
Werner, K.-M. (2015). A first examination of its biology, ecology, and fisheries: What is the role of European Hake ( Merluccius merluccius ) in the waters of the northern North Sea and along the Norwegian coast? MSc thesis, Department of Biology, University of Bergen, Bergen. 85 pp.
Werner, K.-M., Staby, A., and Geffen, A. J. (2016). Temporal and spatial patterns of reproductive indices of European hake ( Merluccius merluccius ) in the northern North Sea and Norwegian coastal areas. Fisheries Research, 183: 200–209.
Westgaard , JI , Staby , A , Goodiksen , J , Geffen , AJ , Svensson , A , Charrier , G , Svedäng , H , and Andre , C. (2017). Large and fine scale population structure of European hake ( Merluccius merluccius ) in the Northeast Atlantic. ICES Journal of Marine Science 74: 1300–1310