Historiske landinger av dypvanssreke (Pandalus borealis) i Norge
Tall per fylke for årene 1908-2021
Tidsserier av landete fangster er ofte den eneste tilgjengelige datakilden fra mesteparten eller hele den historiske epoken til et fiskeri. Slike tidsserier bidrar derfor med viktig informasjon for bestandsvurdering og fiskeriforvaltning. Selv om norske landinger per fylke har blitt registrert i mer enn hundre år, ble mesteparten av disse dataene tidligere kun publisert i statistiske årbøker og er derfor ikke lett tilgjengelige. Gjennom arbeidet med denne rapporten har vi digitalisert norske rekelandinger per fylke og kommune, samt verdien av disse landingene, for tidsrommet 1908 til 1976. Tallene ble satt sammen med landingsdata fra 1977 til 2021 til en omfattende oversikt over det norske rekefisket siden dets spede begynnelse for mer enn hundre år siden og frem til i dag. Tidsserien viser hvordan rekefisket etter starten i det østlige Skagerrak og i Oslofjorden på slutten av 1800-tallet, bredte seg vestover og nordover langs norskekysten i de påfølgende tiårene og slik utviklet seg til et viktig kystfiske. På 1920- og 1930-tallet startet man også å tråle på rike rekefelt ute i Skagerrak. Under 2. verdenskrig stoppet veksten i fisket opp, men da krigen var slutt, økte landingene hurtig pga. utviklingen av et industrielt fiske og utviklingen av havfisket i Barentshavet og ved Svalbard. Dette, sammen med perioder med norsk rekefiske ved Jan Mayen og Grønland, samt i internasjonalt farvann ved Canada, førte til en vesentlig økning i rekelandingene fra rundt 1980. Mens de totale årlige rekelandingene hadde holdt seg på et nivå på et par tusen tonn i de foregående tiårene, nådde de over 80.000 tonn på 1980-tallet og tidlig på 2000-tallet. Gjennom tidsserien og spesielt de siste tiårene har det likevel vært store svingninger i de totale norske rekelandingene, og også i den romlige fordelingen av landingene. Da det ikke fastsettes rekekvoter med unntak av for bestanden i Skagerrak og Norskerenna, kan svingningene i landingene for det meste forklares med teknologiske fremskritt og økonomiske faktorer, dvs. pris. Men dataene viser også en nedgang i rekelandinger på Vestlandet og i Midt-Norge, noe som tyder på at rekefisket forsvinner eller allerede har forsvunnet fra disse områdene, og som indikerer at også selve bestanden flere steder er i ferd med å forsvinne. Resultatene våre understreker viktigheten av en god romlig oppløsning av landings- og verdidata for forståelsen av den historiske utviklingen av et fiske og dermed viktigheten av å gjøre slike data tilgjengelige for forskning og fiskeriforvaltning.
Summary
Time series of landed catches are often the only data source available that encompasses most or all of a fishery’s history, providing important information for stock assessment and fisheries management. Although landings data were registered in Norway with a spatial resolution of landing county or lower for over a century, most of the data were only published in statistical yearbooks in the past and are therefore not readily available. Here, we digitalized spatially resolved information on shrimp landings and value of landings from 1908 to 1976, and combined them with landings data from 1977 to 2021 to produce a comprehensive overview of the shrimp fishery in Norway since its infancy more than a century ago until today. The resulting time series shows how the shrimp fishery after its beginning in the eastern Skagerrak and Oslofjord region at the turn of the 20th century, expanded west- and northwards along the Norwegian coast over the following decades, developing into a relevant coastal fishery as well as an offshore fishery in the Skagerrak. After World War II had temporarily halted the development of the fishery, it increased with a higher pace due to subsequent progress in industrial fishing and the emergence of offshore fisheries in the Barents Sea and around Svalbard. The latter development caused together with periods of long-distance fishing activities in the Northwest-Atlantic and around Greenland and Jan Mayen substantial increases in shrimp landings from the 1980s onwards. While total annual shrimp landings remained largely on the level of a few thousand tonnes in previous decades, they peaked above 80 000 tonnes in the 1980s and early 2000s. However, throughout the time series and particularly during the latest decades, substantial fluctuations in landings and their spatial distribution have been observed. In absence of catch limits for shrimp outside of the Norwegian Deep and Skagerrak area, the observed changes in the landings have mostly been driven by technological progress and economic factors, notably prices. However, masked by the large landings from the offshore segments of the fishery, the data also show a decline of shrimp landings in West- and Mid-Norway, indicating a disappearance of the shrimp fishery and possibly also the shrimp stock in these areas. The results underline the relevance of spatially resolved landings and value data for our understanding of the development of a fishery across its history, and thus the importance of making such data readily available to research and fisheries management.
1 - Introduction
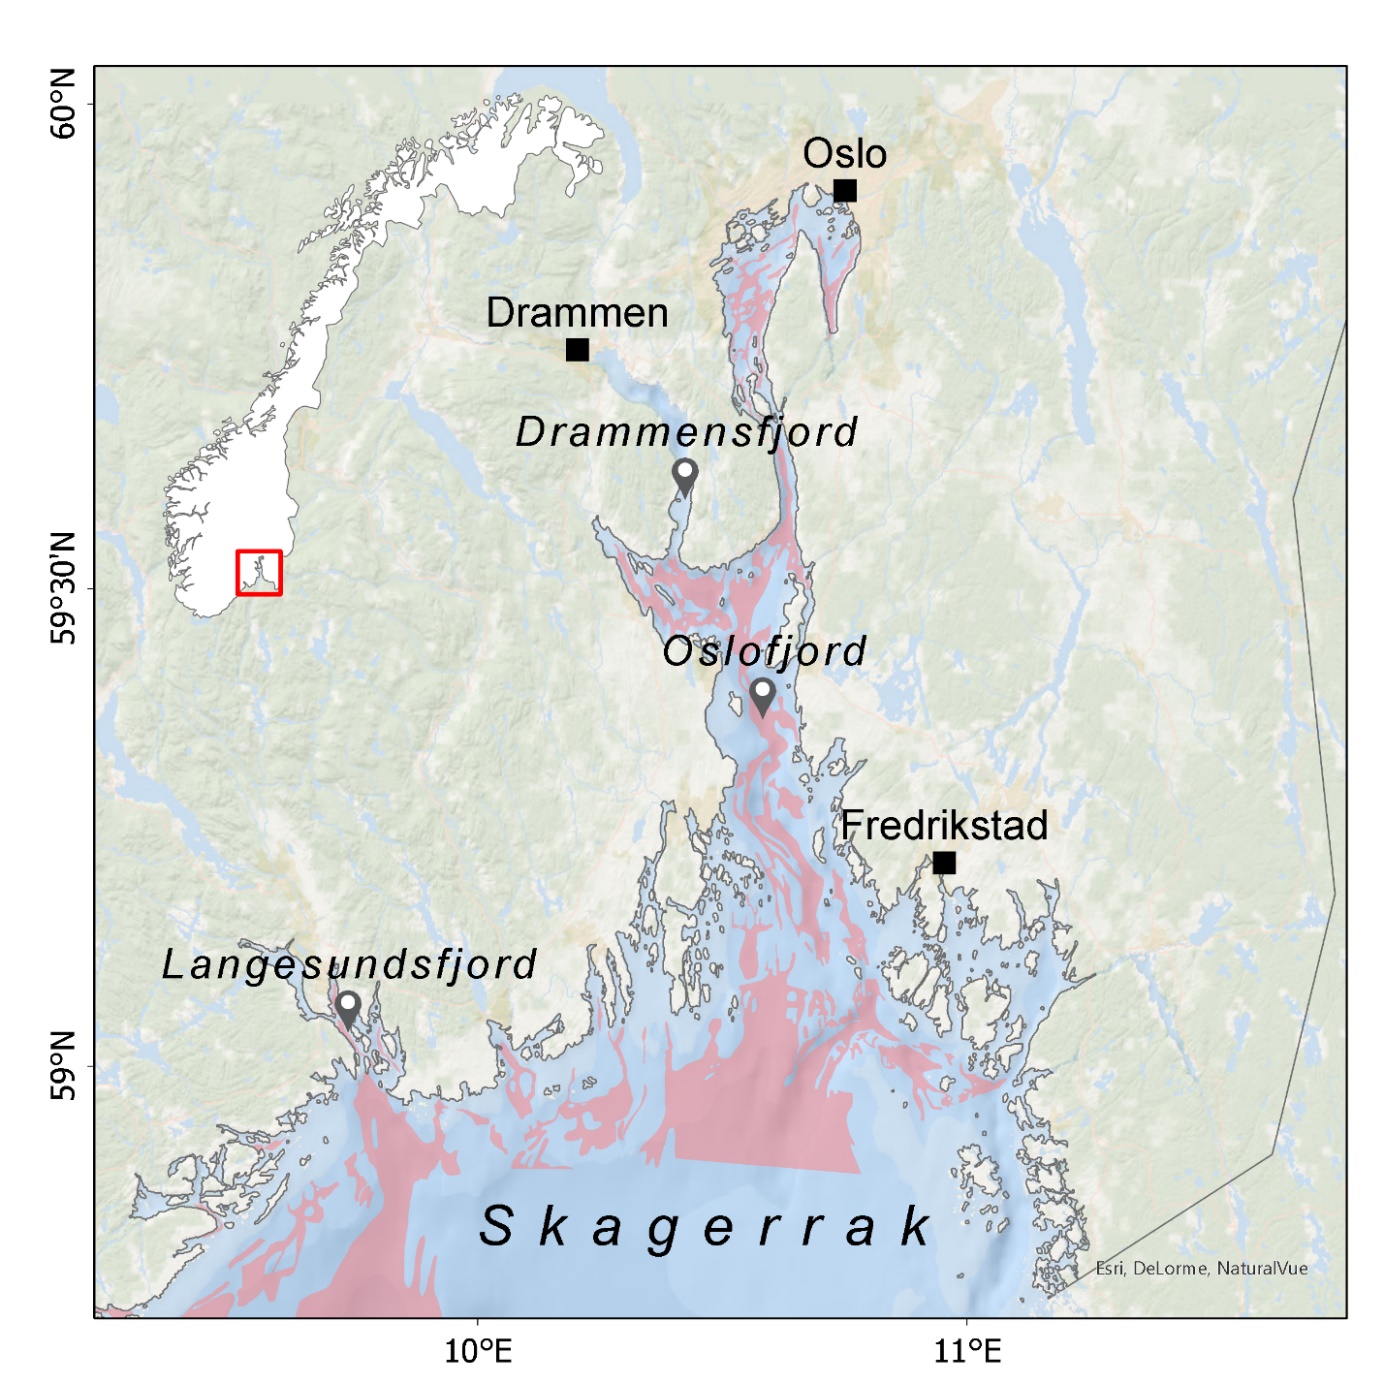
The Norwegian fishery for northern shrimp (Pandalus borealis) (hereafter shrimp) started by mere chance in the late 1890s, as the large stocks of shrimp in the Oslofjord and eastern Skagerrak region were discovered through fishery investigations with other purposes than finding shrimp (Hjort and Ruud 1938). In 1897, Johan Hjort, together with Danish C. G. Johannes Petersen, discovered high densities of shrimp in the Swedish Gullmarsfjord, and the Larviksfjord and Langesundsfjord in southern Norway (Figure 1). Before 1897, large, harvestable stocks of shrimp were only known from the Drammensfjord, where a shrimp fishery by hand net had taken place.
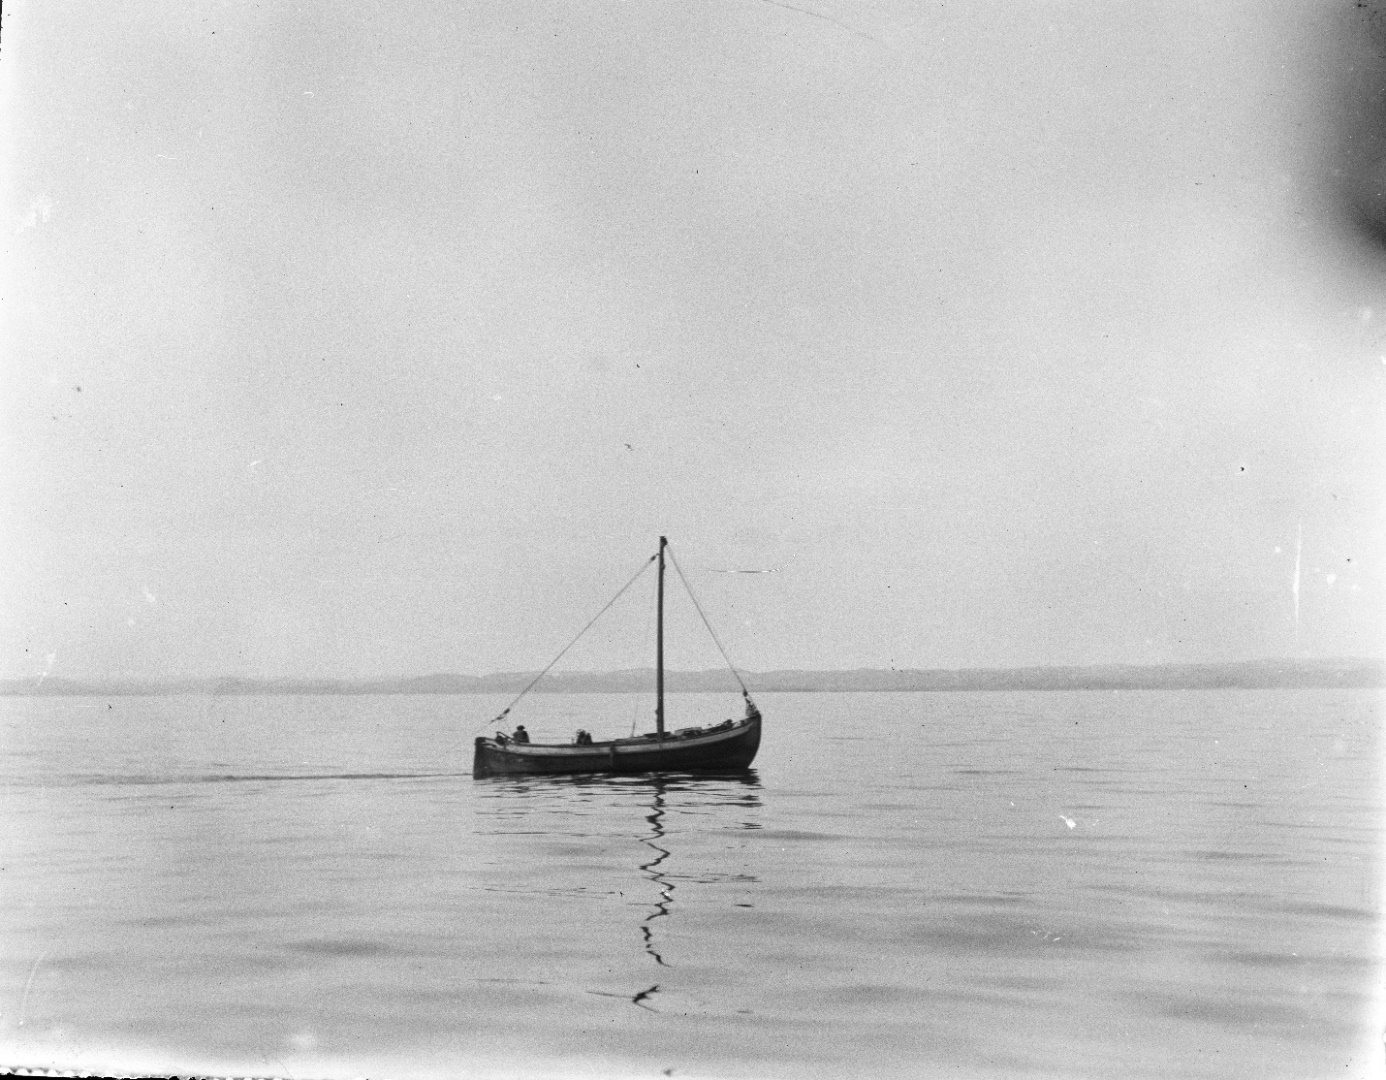
A profitable shrimp fishery was established a year after the discovery of the new resource. In 1899, ten vessels participated in the shrimp fishery in the Langesundsfjord, and in 1901, eleven vessels trawled for shrimp in the inner parts of the Oslofjord. Much work was devoted to the development of suitable gear, equipment of vessels, mapping of shrimp fields, and development of a new market, mainly driven by the fishers themselves (Hjort and Ruud 1938, Iversen 1926). The fishery was first conducted by sailing vessels (Figure 2), but these were rather quickly replaced by steam and motorboats. During World War I, sails were again utilized due to fuel shortages. Shrimp trawling with sailing boats in the small and narrow shrimp fields along the Norwegian coast (Figure 1) was challenging. As new shrimp fields were discovered along the coast, the fishery gradually moved westwards.
Official statistics of shrimp landings are available from 1908 onwards (Hjort and Ruud 1938). In 1908, 405.8 tonnes (t) of shrimp were landed, and the shrimp fishery was by then conducted along the coast from Østfold county to Rogaland county. Since 1908, landings statistics by year and county, and for many years also by municipality, are available through “Norges Fiskerier” (Norwegian Fisheries), as scanned reports. The data were previously not digitized, and, thus, not readily available.
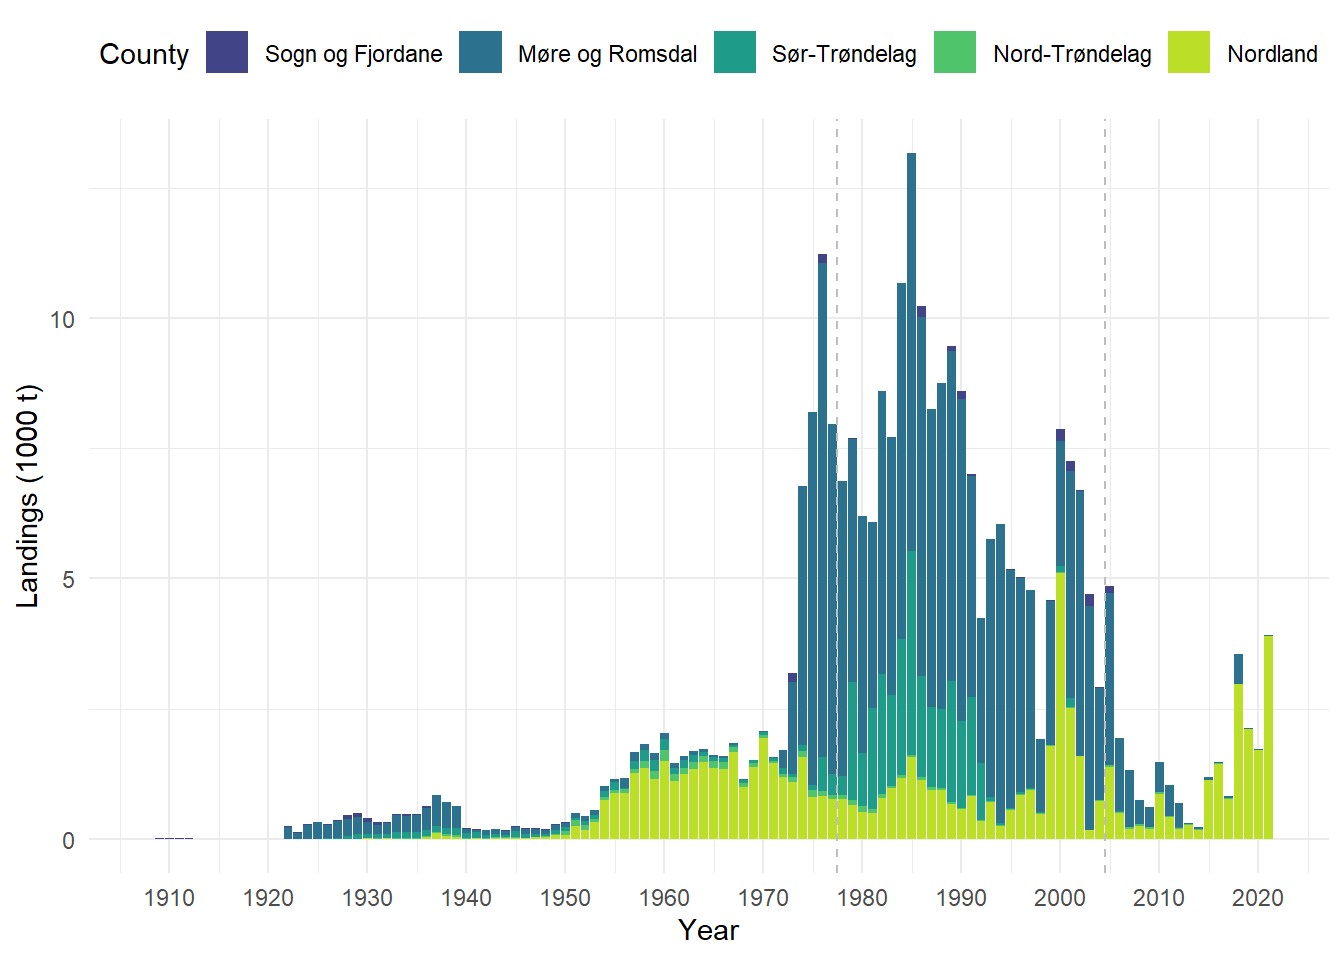
An overview over the Norwegian historic shrimp landings constitutes an important part of the history of the Norwegian fisheries. Landings statistics are also important input data to stock assessment models. The goal of our work was threefold: 1) provide the first description of the Norwegian shrimp landings and their value by county from the infancy of the fishery until today, 2) describe the shrimp landings over time from Sogn og Fjordane to Nordland, a region where the shrimp fishery has been declining or has disappeared in more recent years, and finally 3) provide historic Norwegian landings by statistical area as input data to the current stock assessment model for the shrimp stock in the Skagerrak and Norwegian Deep area (pra.27.3a4a). The last task was part of the data input to a benchmark of shrimp stocks in 2021-2022 conducted by the International Council for the Exploration of the Sea (ICES) (ICES 2022a).
Figure 1. Map of the Oslofjord and eastern Skagerrak region. Pink shading are commercial shrimp fishing grounds (shrimp fields) from the Norwegian Directorate of Fisheries (Maps from the Directorate of Fisheries).
Figure 2. Shrimp trawler with sail in Langesundsbukta in 1925. Photo: Alf Dannevig.
2 - Material and Methods
2.1 - Data
Data on shrimp landings and their value were collected from the Statistisk sentralbyrå (SSB) landings register for 1908-1976 (historical landings), and combined with data on landings and value for 1977-2021 from the Norwegian landings and sales slips register (Landings- og Sluttseddelregister, Norwegian Directorate of Fisheries).
Landings per county and municipality were available from the time periods 1908-1929 and 1935-1976, while in 1930-1934, only landings per county were available. All data from 1908-1976 were digitized based on the scanned reports "Norges Fiskerier" (Norwegian Fisheries). Data on landings per municipality were also digitized, but are not presented in this report. Table 4 in the “Norges Fiskerier” reports was used to retrieve data for 1908-1952, Table 5 for 1953-1962, Table 1 for 1963-1975, and Table 2 for 1976.
The names of some counties and municipalities, as well as their borders, have changed throughout the century. In 1908-1918, Vestfold was recognized as Jarlsberg og Larviks amt, and Hordaland and Sogn og Fjordane were recognized as Søndre Bergenshus amt and Nordre Bergenshus amt respectively. Bergen had status as its own county, and Stavanger amt constituted the entire present-day Rogaland county (Thorsnæs 2021). Another, more current, regional reformation of the counties occurred in 2020, where some counties were merged, such that Akershus, Buskerud and Østfold became Viken, Vestland was created from the merging of Hordaland and Sogn og Fjordane, Vest-Agder and Aust-Agder became Agder, while Vestfold and Telemark were merged to form Vestfold og Telemark. County names were standardized across the time series to their definition post-2020 for the complete overview and pre-2020 for detailed county-level representation, respectively.
The resolution of the available data from the landings and sales slips register has varied over time. Landings and value per landing municipality, county and fishing area for 1977-2004 were made available to us upon request by the Norwegian Directorate of Fisheries, such that the historic time series could be extended until present. Data for this time span already in the database of the Institute of Marine Research (IMR) were only available per fishing area, not landing county. For the years 2005-2021, detailed sales slip documents including landing weight and first-hand price information for all fishing trips were available, by both fishing area and landing site (IMR database, shared through the Norwegian Directorate of Fisheries). All landings from 1977 onwards were assigned to a major fishing region (Greater North Sea, Norwegian Coast, Barents Sea, Svalbard, Greenland and Jan Mayen, Grand Banks and Flemish Cap) based on registered statistical area (Table 1). To achieve standardized time series, landings include all shrimp that have been landed in Norway independent of origin of catches or vessels, as information on nationality of the vessels landing shrimp in Norwegian ports or the fishing area were not available in the statistics until 1976.
All monetary data were corrected for consumer price inflation using the Norwegian consumer price index (SSB, consumer price index), adjusting prices and values to the level of 2014. Prices of individual landing transactions were only available from 2005 onwards. Mean prices before 2005 were therefore produced by dividing total value with total landings, while the mean of prices weighted by landings weight was used for 2005-2021.
Fishing region
Statistical areas
Greater North Sea
08, 09, 28, 41, 42
Norwegian coast
00, 03, 04, 05, 06, 07
Barents Sea
01, 02, 10, 11, 12, 13, 14, 15, 16, 17, 18, 20
Svalbard
21, 22, 23, 24, 25, 26
Greenland and Jan Mayen
60, 61, 68, and 35, 36, 38
Grand Banks and Flemish Cap
80, 81, 82
Others
30, 43, 47
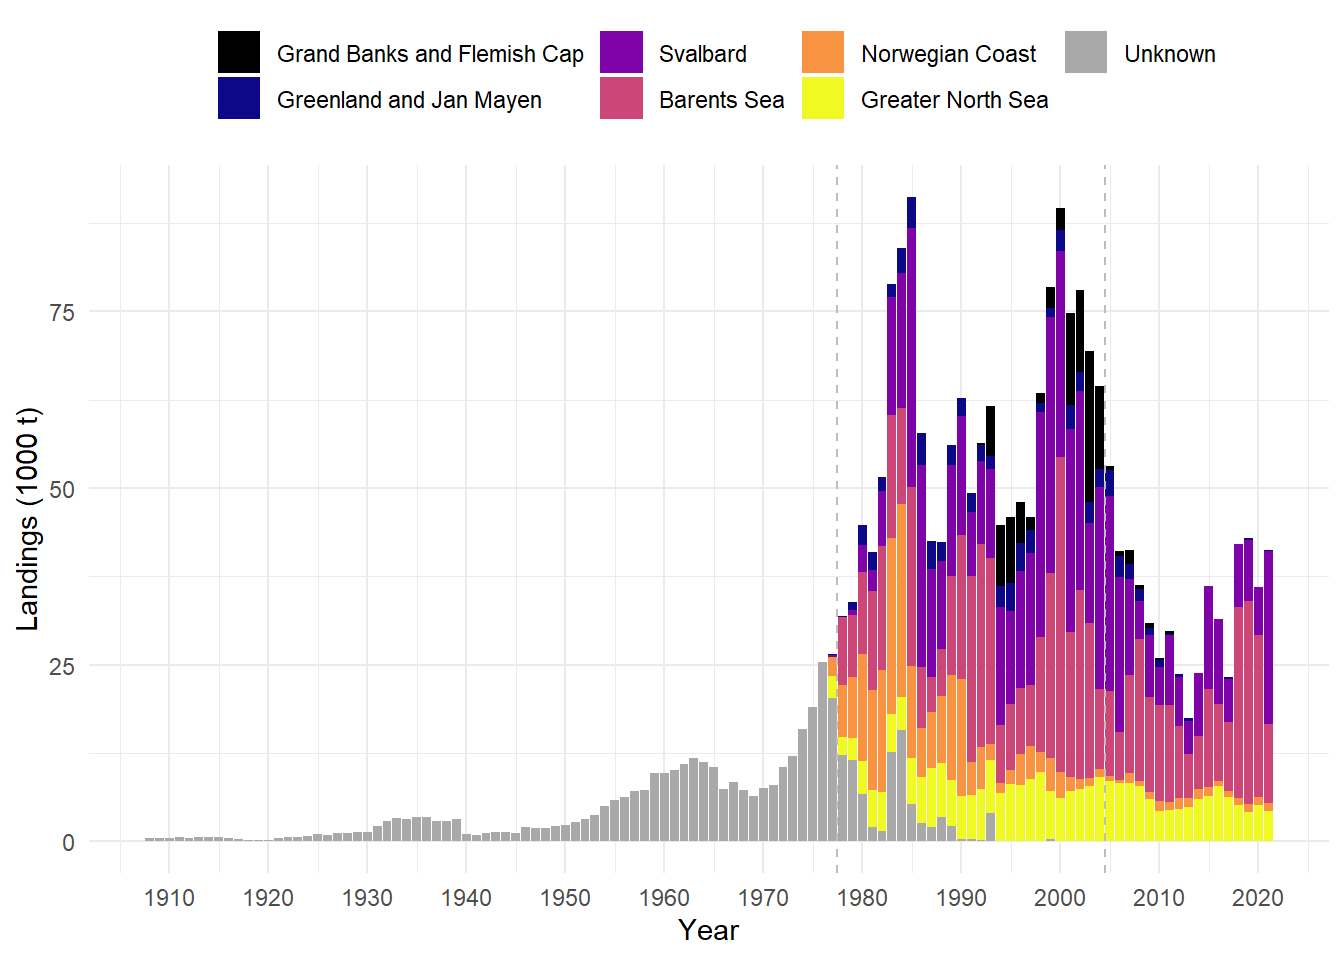
Table 1. Major fishing regions by statistical area for the Norwegian shrimp fishery, as defined in this report. Landings outside these regions (statistical areas 30, 43, 47) may be misreported and are grouped together with registrations without statistical area (Figures 6, 10).
2.2 - Species and fishery
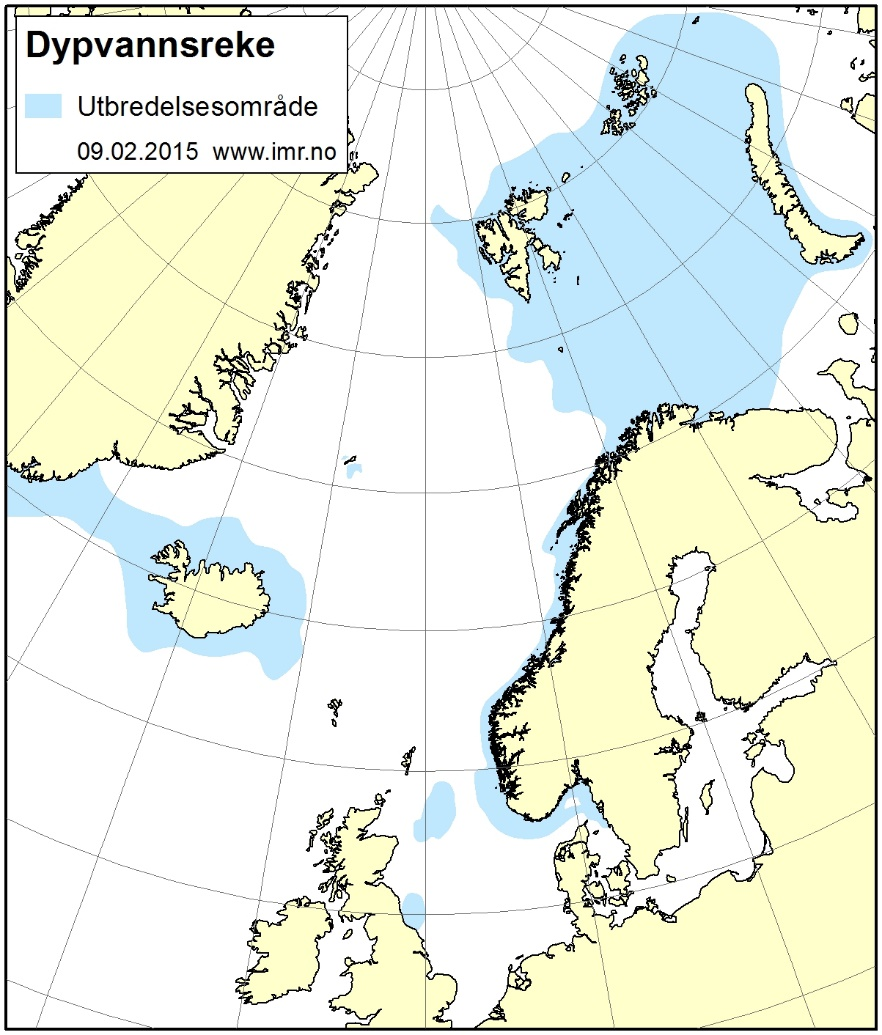
In the North-Atlantic, northern shrimp is distributed along the Norwegian coast, in the North Sea and Skagerrak, in the Barents Sea, around Jan Mayen, Iceland and Greenland, and off the Canadian coast (Figure 3) (Shumway et al. 1985). The species can be found at depths between 9 and 1450 m, with highest densities between approximately 100 and 400 m, predominately on soft bottom. Commercial shrimp fishing grounds (shrimp fields) have been mapped by the Norwegian Directorate of Fisheries (Maps from the Directorate of Fisheries). Shrimp fields along the Norwegian coast appear as a mosaic of large and small areas of soft sediment interspersed between rocky bottom (Zimmermann et al. 2019). In the Skagerrak, North Sea and the Barents Sea, on the other hand, large coherent areas of soft bottom (ICES 2021) provide suitable habitat for the much larger offshore shrimp stocks.
Shrimps are caught using bottom trawls with a mesh size of minimum 35 mm in the codend, and with an obligatory fish sorting device, i.e. a grid which excludes fish larger than approximately 20 cm length from the catch (ICES 2022b). The sorting grid was made compulsory for the counties Nordland, Troms and Finnmark in 1990 (within 12 nautical miles), and for the whole Norwegian exclusive economic zone (EEZ) north of 62°N in 1991. Shrimp grounds where bycatches of juvenile fish exceed legal limits are closed by the Norwegian Directorate of Fisheries (IMR 2021). There are two shrimp management units in Norwegian waters: 1) Skagerrak and Norwegian Deep and 2) Shrimp north of 62°N. Annual quotas (total allowable catch (TAC)) for the Skagerrak and Norwegian Deep stock have been determined since 1992 following advice from ICES, while there are no quotas for the shrimp stock north of 62°N (NAFO/ICES 2021).
Shrimp catches in the Skagerrak and Norwegian Deep are sorted on board, and the largest shrimp are boiled and landed fresh, fetching high prices (around 110 NOK/kg), while the medium-sized shrimp are landed raw to the industry, fetching much lower prices (15-18 NOK/kg) (ICES 2022b, Knutsen 2022). The smallest sizes can now also be landed but have traditionally been discarded (ICES 2022). Sorting and boiling on board take place also along the coast, while the offshore fleet in the Barents Sea and Svalbard area processes and freezes all catches on board. Frozen shrimp fetch lower prices than shrimp landed fresh (prices). Discards of shrimp are not estimated but are believed to be small as the Barents Sea fishery is not limited by quotas (NAFO/ICES 2021).
Figure 3. Distribution of northern shrimp, indicated by blue. Map from the Norwegian Institute of Marine Research (IMR).
3 - Results
3.1 - Landings
3.1.1 - National trends
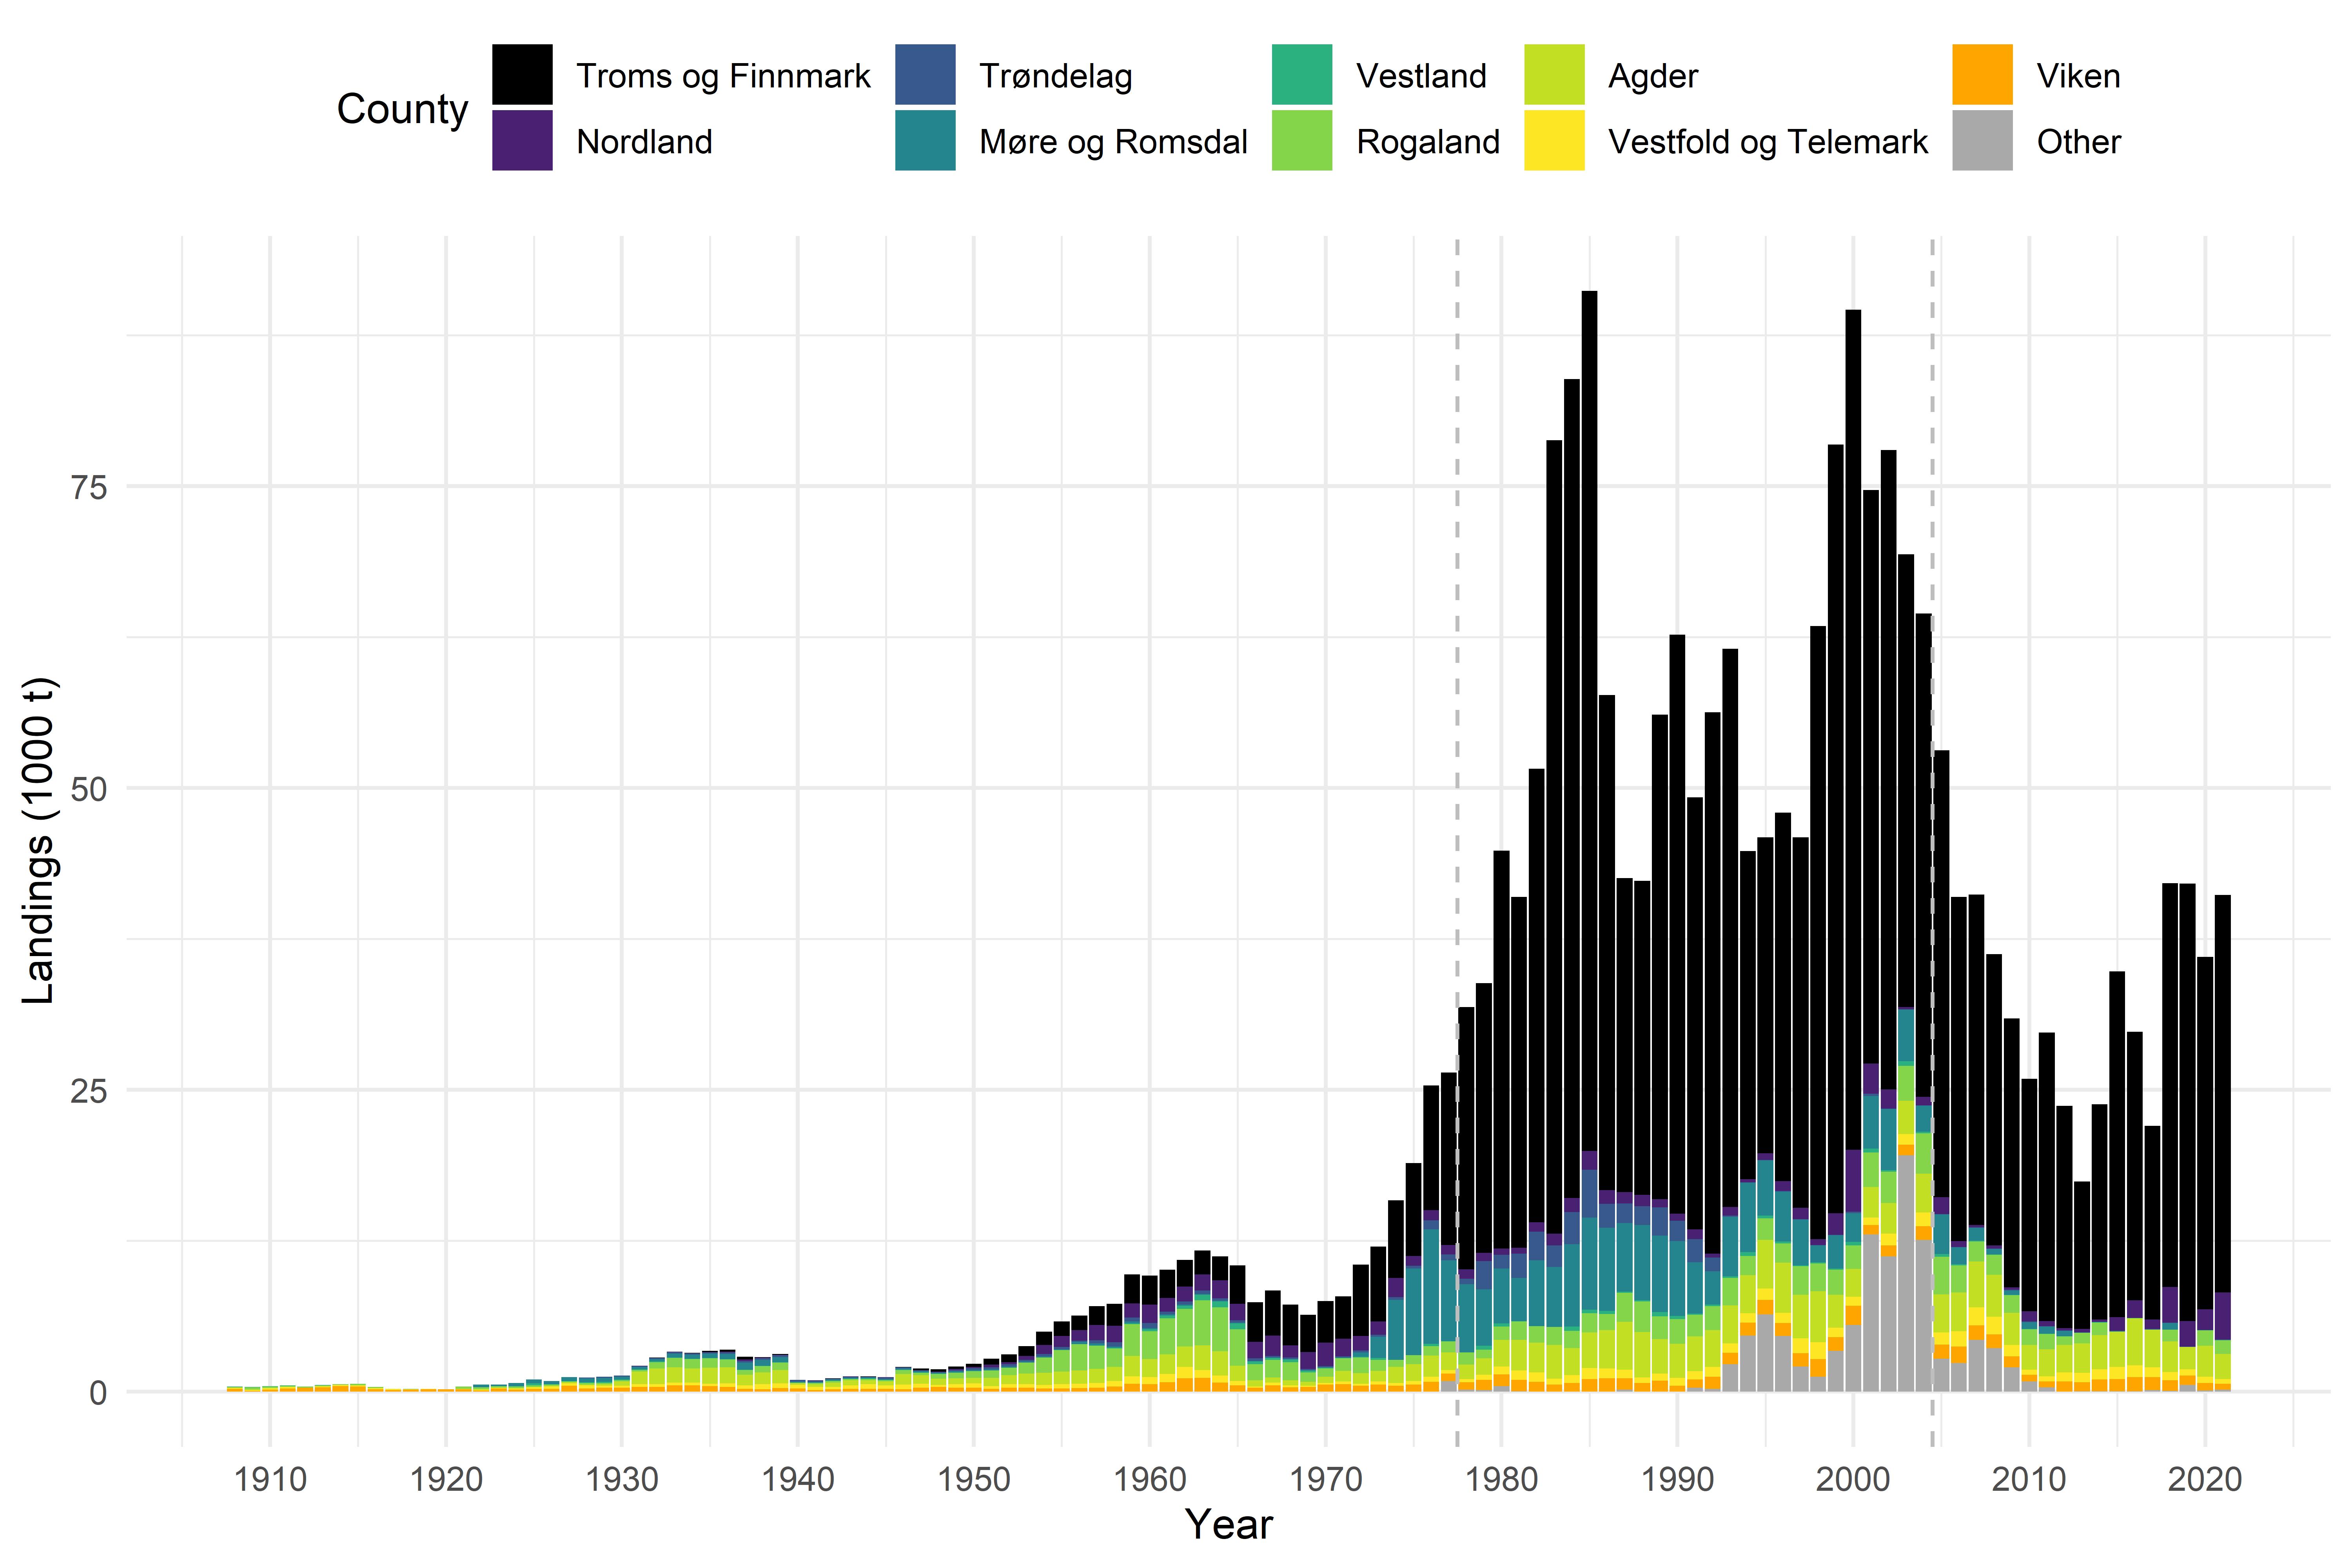
The Norwegian shrimp fishery has developed substantially since its infancy more than a century ago (Figures 4, 5, Table 2 (Appendix)). As new shrimp fields were discovered along the coast, the fishery grew and expanded, from the inner part of Skagerrak, along the southern and western coast of Norway, to Nordland county, and then finally to Troms and Finnmark counties (Figure 5). Increases in landings were facilitated by technological progress, notably the initial advancements in shrimp trawling and later development of a powerful offshore fleet capable of bottom trawling in areas such as the Barents Sea and around Svalbard.
From 1908 to 2021, the total Norwegian shrimp landings have shown large fluctuations over time, both on a national and a regional scale (Figure 4). Five main periods with contrasting trends are seen in the time series of total landings. From 1908 to 1970, there was a gradual increase in landings, from only 419 t to 7 511 t, including a drop in landings during World War II as well as in the late 1960s. The latter drop was caused by decreasing landings in southern Norway. Then over a period of about 15 years, from 1970 to 1985, there was a more than twelvefold increase in landings, to 91 165 t in 1985, the highest annual landings in the time series. Total landings were high in the years 1980-2005, peaking in 1985, 1989-1993 and 2000. The high level was then followed by a drop in landings, to 17 397 t in 2013, and then a gradual increase again, to 39 974 t in 2021. The recent increase is due to increasing landings into ports in Troms and Finnmark.
Initially, in the 1920s, shrimp fishing was concentrated in southern Norway, including Skagerrak and the southern and western Norwegian coast, with only minor landings registered further north. Large offshore shrimp fields in Skagerrak and the Norwegian trench were discovered in the 1920s (Hjort and Ruud 1938) (see below). From the 1920s onwards, the shrimp fishery gradually moved northwards, with landings more and more evenly distributed along the Norwegian coast, including northern Norway. In 1970, Norwegian vessels started the offshore shrimp fishery in the Barents Sea (NAFO/ICES 2021). Due to the large catches in the Barents Sea and Svalbard area (Figure 6), the total Norwegian shrimp landings have since the 1980s been dominated by landings into ports in northern Norway (Figure 4). Norwegian vessels also have had quotas and have trawled for shrimp around West- and East-Greenland, and on the Grand Banks and Flemish Cap in international waters in the Northwest-Atlantic (Casas 2012). Changes in landings over time reflect therefore both the expansion of fishing areas as well as periods of long-distance fishing outside of the Norwegian EEZ (Figure 6). In several years in the 1990s and up to 2005, a substantial share of the total landings in Norway originated from the Grand Banks and Flemish Cap region, and to a lesser extent from Greenland and Jan Mayen. After 2010, this fishery has been negligible (Figure 6).
3.1.2 - Trends in southwestern Norway
The overall picture for southwestern Norway, from 1908 to 2021, is that of increasing landings, but there have been large fluctuations over the decades (Figure 7). A gradual increase in landings from 1908 to 1939, where landings from Agder and Rogaland dominated the statistics from 1931 onwards, was followed by a drop in landings during World War II. The increase from 1920 onwards is explained by the fleet moving offshore following the discovery of the shrimp stock on Svennerbanken in eastern Skagerrak, while the sharp increase in landings in the beginning of the 1930s was caused by the discovery of large amounts of shrimp on Revet, a large area of soft bottom stretching from Skagen into the North Sea (Hjort and Ruud 1938). From 1950 to 1963, landings increased sharply, followed by a large decline in the second half of the 1960s. Rasmussen (1967) explained this decline by unusual cold winters in 1963 and 1966 leading to formation of cold bottom water which penetrated into Skagerrak and displaced the shrimp. The cold bottom water held a temperature of 4-6°C compared to normally 6-8°C. Following these cold winters, landings increased almost sevenfold over the next 28 years, from 1970 to 1998, with the highest recorded landings in the time series of 9478 t. The 1980s, 1990s and 2000s were characterized by landings fluctuating at a high level, dominated by landings into Agder. After a sharp decline from 2008 to 2010, landings again increased to reach a new, although lower peak in 2016. The most recent years have seen landings of around 4000-5000 t. The shrimp stock in southwestern Norway has since around 2010 been at a lower level (ICES 2022b), which explains the recent lower landings. Recruitment has been low since 2008, except for the 2013-year class, which caused an increase in biomass, reflected in increased quotas and transient higher landings.
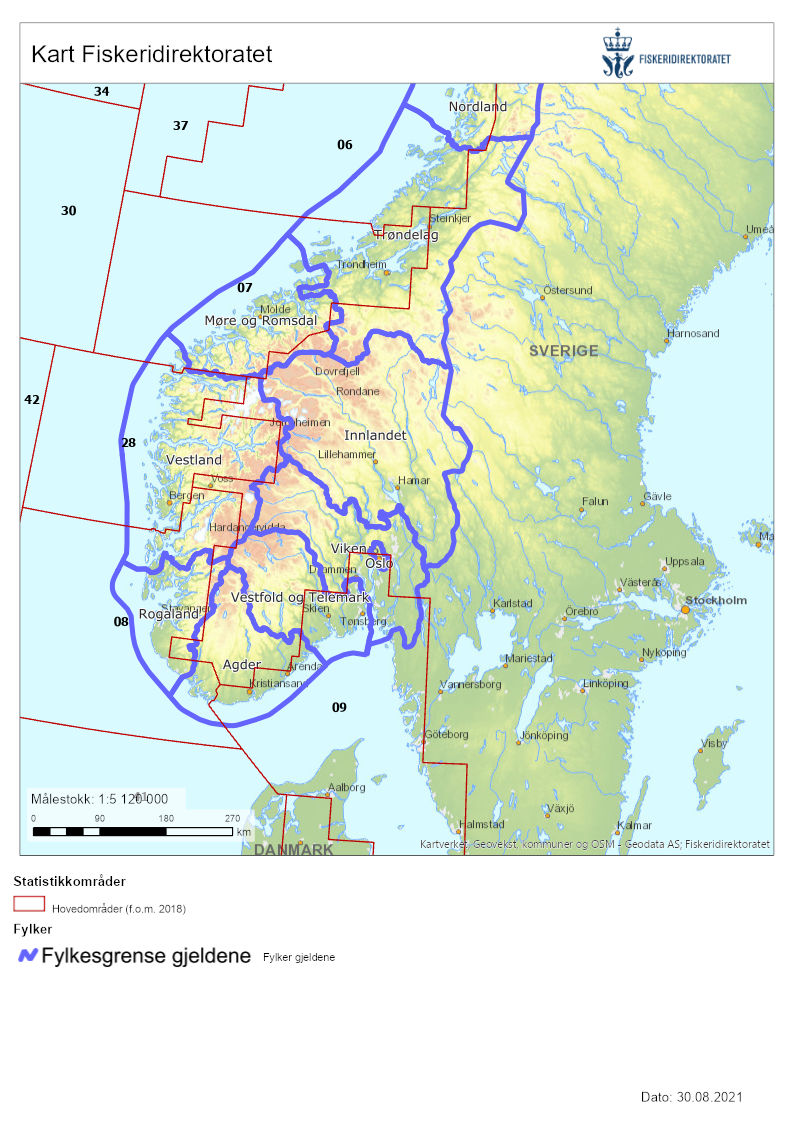
To reconstruct a time series of historic landings of the pra.27.3a4a stock in the ICES divisions 3.a (Skagerrak) and 4.a East (the Norwegian Deep), counties were grouped into the statistical areas 09 and 08+28, which correspond quite well to 3.a and 4.a East, respectively (Figure 8). Area 09 was thus defined to consist of the counties Buskerud, Akershus, Østfold, Oslo, Telemark, Vestfold, Aust-Agder and Vest-Agder, while area 08+28 was defined to consist of Rogaland, Hordaland and Sogn og Fjordane. County borders do not completely overlap with the borders of the statistical areas but approximate them sufficiently (Figure 8).
3.1.3 - Trends in Mid-Norway
Although a minor shrimp fishing region explained by the limited area of suitable shrimp habitat in fjords and near-coastal areas, Mid-Norway (the counties from Sogn og Fjordane to Nordland) contributed a significant share of the total Norwegian landings from around 1975 to around 2005, with annual landings of 5000-12 000 t (Figure 9). Landings in Nordland have been relatively stable since the 1950s, whereas the landings in Møre og Romsdal and Sør-Trøndelag increased steeply around 1975 only to mostly disappear again in the early 1990s (Sør-Trøndelag) and mid-2000s (Møre og Romsdal). Landings in Sogn og Fjordane have always been marginal compared to the other counties. The highest total landings were in 1985 with 13 164 t and the county with the highest landings was Møre og Romsdal with 9483 t landed in 1976. In recent years, there have been few to no landings into ports outside of Nordland. In Nordland, however, an increasing trend has been observed since 2015. The trends are elaborated on in the section below.
3.1.4 - Trends on county level
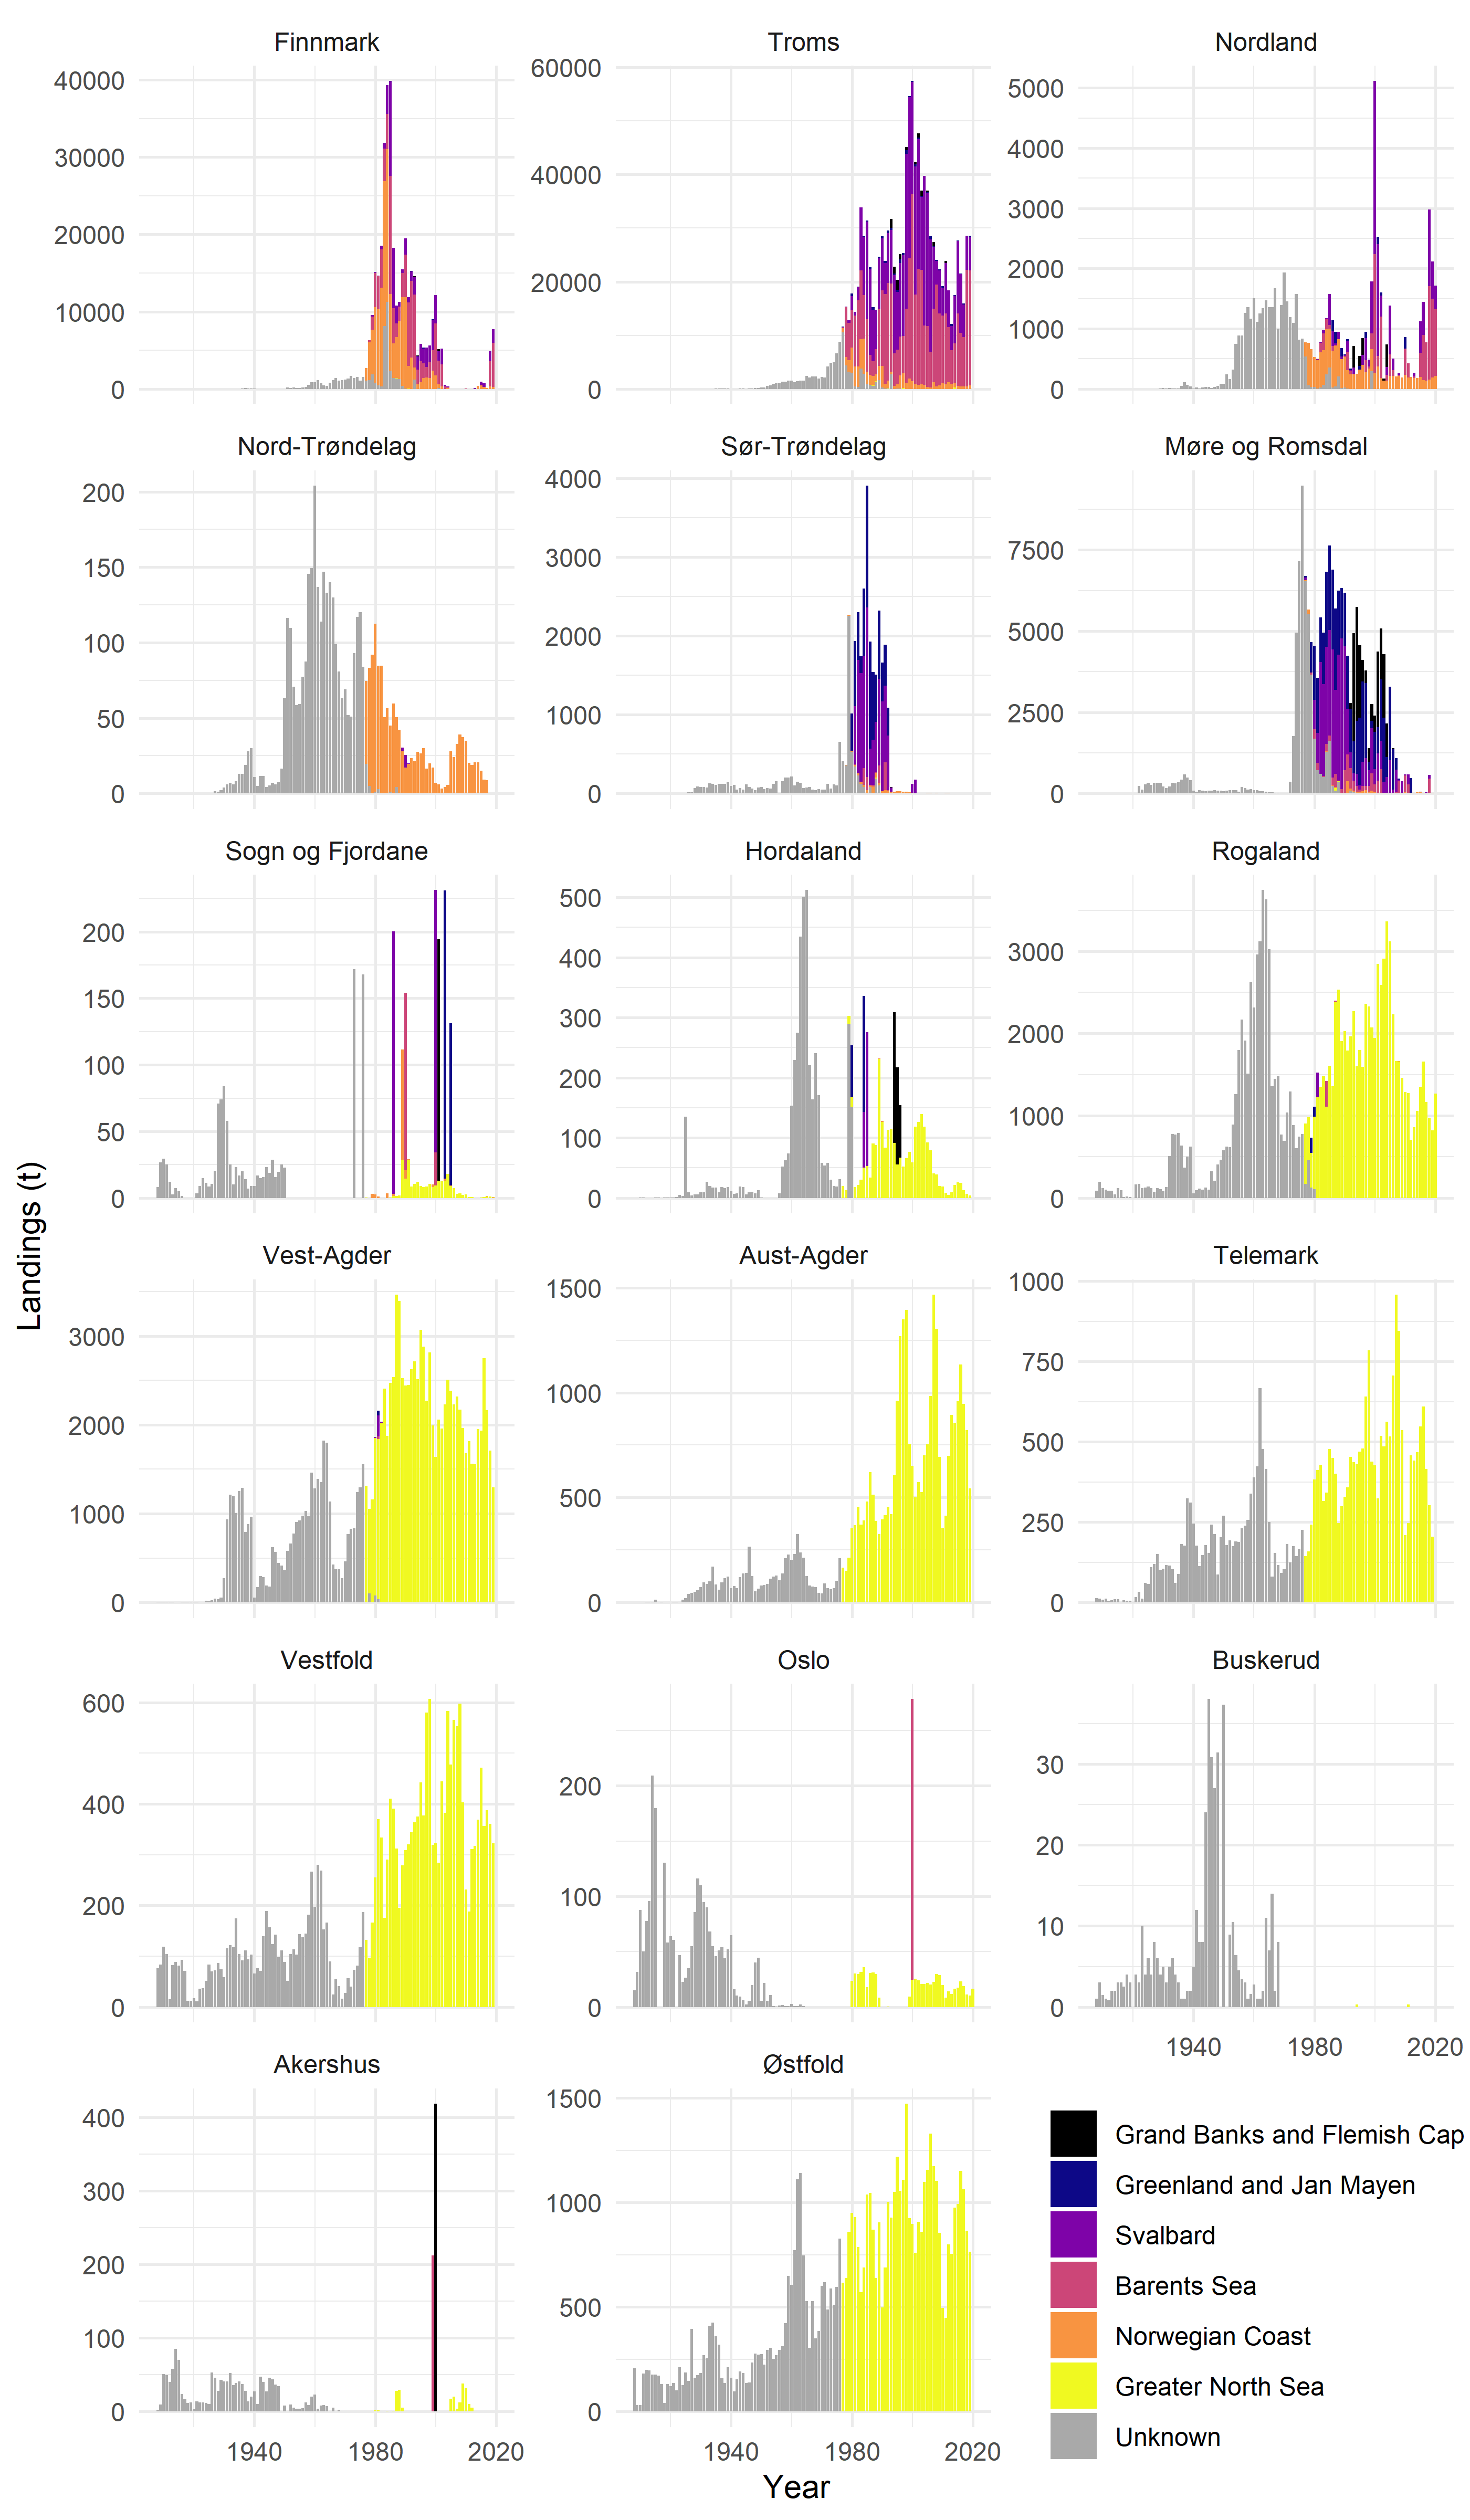
Many counties have had their largest landings in more recent years, mostly between 1980 and 2021 (Figure 10, Table 2 (Appendix)), reflecting the overall national trend of increasing landings from 1970 onwards (Figure 4). Oslo, Akershus and Buskerud stand out with highest landings during earlier years around 1920-1950, and with low or no landings in more recent years. Stålesen (1963) described how the shrimp fishery in the Oslofjord decreased as the human population, and pollution, around the fjord increased. Trawling in the innermost Bunnefjorden ceased after 1949, and the fishery moved further out. The counties in southern Norway with the historical highest landings are Rogaland and Vest-Agder, followed by Aust-Agder, Østfold and Telemark. The high landings into Rogaland and Vest-Agder most likely came from the offshore shrimp ground Revet, supported by the fact that landings during World War II decreased in these two counties, but not in any of the other southern counties. There was a large peak in landings in Rogaland in the 1950s-1960s, which was notable in Hordaland as well, and to a lesser extent further east. The large decline in landings in the late 1960s is evident in the landings statistics for all counties from Østfold to Hordaland, and according to Rasmussen (1967), the decrease “moved” along the Norwegian coast from east to west. Landings have remained at a relatively high level in the Skagerrak counties in recent years, with the exception of Oslo, Akershus and Buskerud, while landings into Rogaland have declined by two-thirds from the beginning of the 2000s until today, reflecting the currently very low stock level in the Norwegian EEZ in the North Sea (ICES 2022b). A similar reduction, albeit starting earlier is seen in Hordaland, where the landings, and thus fishery, are now almost non-existent. In Sogn og Fjordane, the shrimp fishery has always been small and has presently ceased, as in Hordaland. Indeed, recent investigations have shown that currently there are practically no shrimp on the former shrimp fishing grounds in these two counties (Zimmermann et al. 2021).
The high landings into ports in mid-Norway in the years 1975-2005 (Figure 9) did not come from local shrimp grounds but the Barents Sea, Svalbard waters and the Northwest-Atlantic (Figure 10). In fact, more or less all the Norwegian landings from the Flemish Cap and Grand Banks were landed in Møre og Romsdal and Sør-Trøndelag. The much smaller landings in these counties from earlier years can be assumed to have come from local shrimp fishing grounds, but this local fishery has now ceased. Further north, catches from coastal areas (local grounds) dominate the landings statistics, particularly in Nord-Trøndelag and to a lesser extent in Nordland. However, Nordland totally dominates the coastal shrimp landings in Mid-Norway when it comes to quantities. Both these counties had the highest landings in the 1950s-1970s when landings from the Barents Sea and Svalbard area into Nordland are ignored. The coastal shrimp fishery has since decreased in both counties. The fish sorting grid was made compulsory north of 62°N in 1990-1991, and unlike for the shrimp fishery in southwestern Norway, a fish retention device (collecting bag) at the grid’s fish outlet is not legal. As shrimp fishers lost part of their revenue base, some may have left the fishery, thus contributing to the decrease in coastal landings seen in Nord-Trøndelag and Nordland in the beginning of the 1990s. Trends in the landings in Sogn og Fjordane have been described above. Occasionally large peaks in landings in this county were the result of shrimp caught in the Barents Sea, around Svalbard, or in areas outside the Norwegian EEZ being landed in the county (Figure 10).
The shrimp fishery in Troms started in 1931, and in Finnmark in 1935 (Table 2 (Appendix)). The highest landings have occurred during more recent years (Figure 10). In Finnmark, landings peaked in 1980-1995, while Troms had the highest landings in 1998-2005. In Finnmark, the Tanafjord and Porsangerfjord have been closed for all bottom trawling since the early 1970s (Søvik et al. 2020), thus the main shrimp fishing grounds are found in the Varangerfjord and Laksefjord. The decrease in coastal landings in Finnmark started in the mid-1980s and as such cannot be explained by the closing of the two fjords. While there have been relevant landings in Troms og Finnmark from coastal areas, the landings in later decades have become heavily dominated by shrimp caught in the Barents Sea and around Svalbard, especially so in Troms, which is the county with the highest landings in all of Norway. Landings from the Barents Sea and Svalbard area have shown great fluctuations due to variations in stock size caused by irregular recruitment and predation by cod, but the fishing effort has also varied (Garcia 2007).
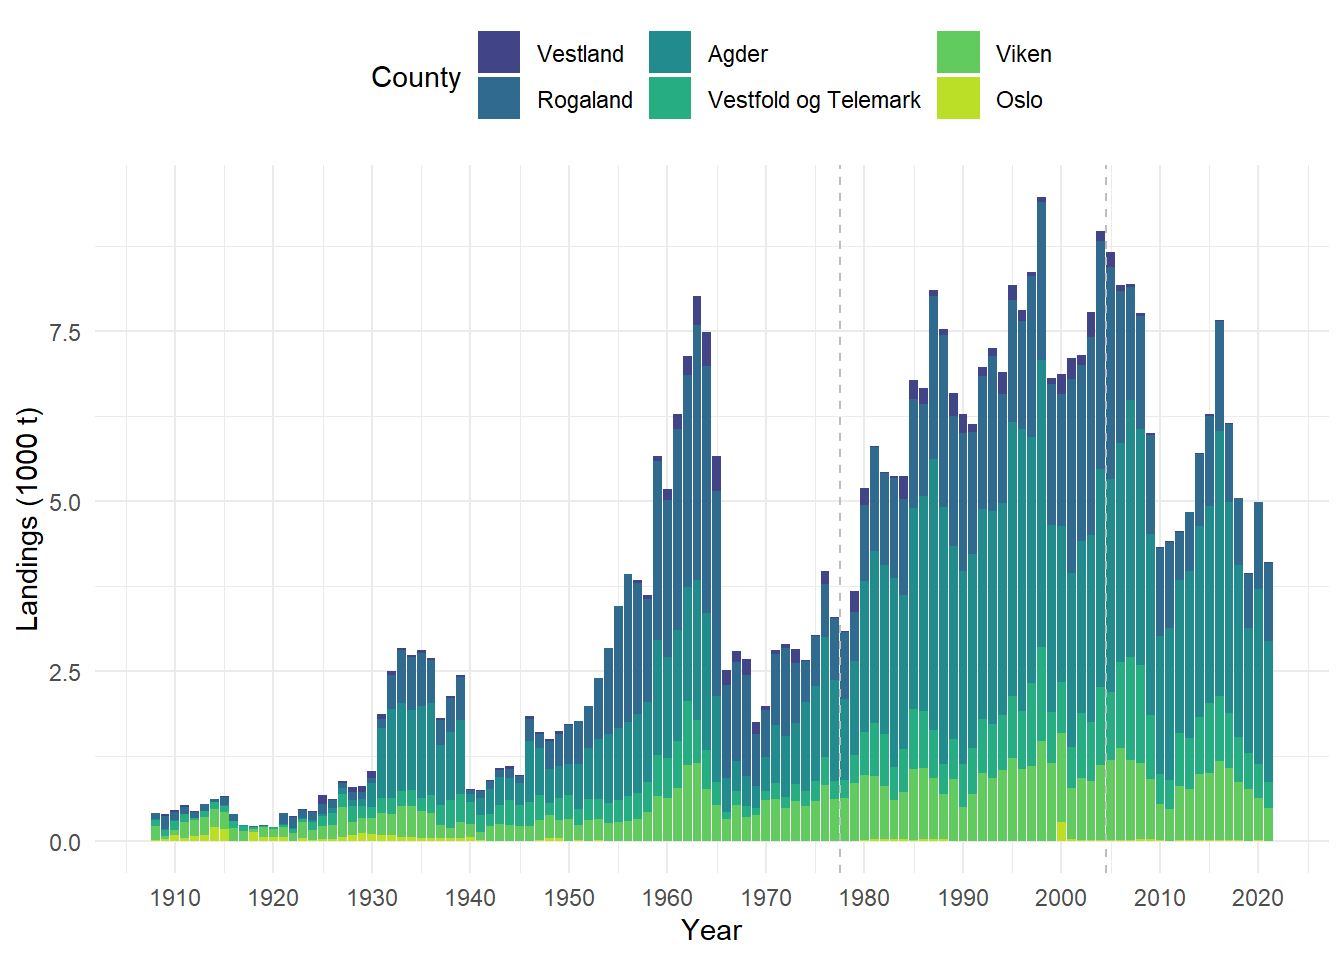
Figure 4. Total Norwegian landings (1000 t) per year and county (county borders since January 1, 2020), including landings from foreign vessels into Norwegian ports. The data include landings from both Norwegian waters as well as waters of other countries and international waters. “Other” includes landings landed abroad or at unknown locations. Annual amounts landed in Oslo were too negligible to be visible and are therefore included in Viken landings. Vertical dashed lines indicate the different time
series: historic landings data (1908-1976, SSB), aggregated (1977-2004) and detailed sales slips (2005-2021, Norwegian Directorate of Fisheries).
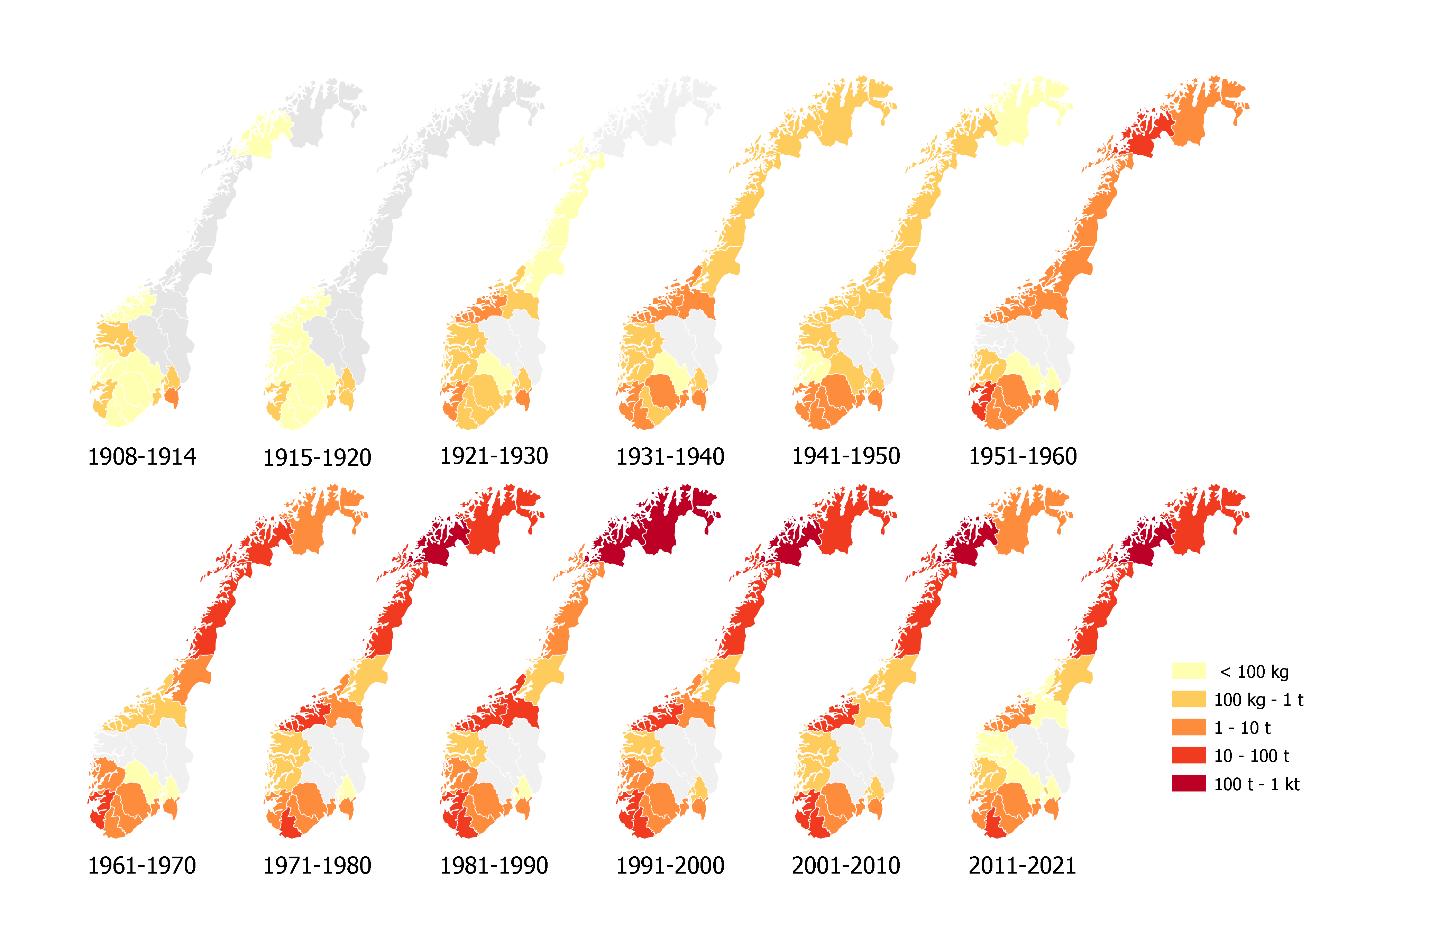
Figure 5. Landings of northern shrimp (t) by county (county borders until December 31, 2019) for 10-year periods, 1908-2021. The first two maps show shorter time periods. The colour scale shows weight of landings, from <100 kg (light yellow) to the highest landings (100 t-1 kt) (dark red).
Figure 6. Total Norwegian landings (1000 t) per year and fishing region (Table 1), including landings from foreign vessels into Norwegian ports. “Unknown” includes landings without a fishing area listed (applies for all landings before 1977 and parts of 1977-2004). Vertical dashed lines indicate the different time series: historic landings data (1908-1976, SSB), aggregated (1977-2004) and detailed sales slips (2005-2021, Norwegian Directorate of Fisheries).
Figure 7. Total Norwegian landings (1000 t) per year and county in southwestern Norway (county borders since January 1, 2020), including landings from foreign vessels (mainly Swedish and Danish) into Norwegian ports. The data include landings from both Norwegian waters as well as waters of other countries. Vertical dashed lines indicate the different time series: historic landings data (1908-1976, SSB), aggregated (1977-2004) and detailed sales slips (2005-2021, Norwegian Directorate of Fisheries).
Figure 8. Counties (county borders since January 1, 2020) (thick, blue line) and statistical areas from the Norwegian Directorate of Fisheries (thin, red line). Map from the Norwegian Directorate of Fisheries (Maps from the Directorate of Fisheries).Figure 9. Total Norwegian landings (1000 t) per year and county in Mid-Norway (county borders until December 31, 2019), including landings from foreign vessels into Norwegian ports. The data include landings from both Norwegian waters as well as waters of other countries and international waters. Vertical dashed lines indicate the different time series: historic landings data (1908-1976, SSB), aggregated (1977-2004) and detailed sales slips (2005-2021, Norwegian Directorate of Fisheries). Note that landings in Sogn og Fjordane are shown in Figure 7 as well, included in landings from the new county of Vestland.
Figure 10. Total landing weight (t) per county (county borders until December 31, 2019) and fishing region (Table 1) for 1908-2020 , including landings from foreign vessels into Norwegian ports. “Unknown” includes landings without a fishing area listed (applies for all landings before 1977 and parts of 1977-2004).
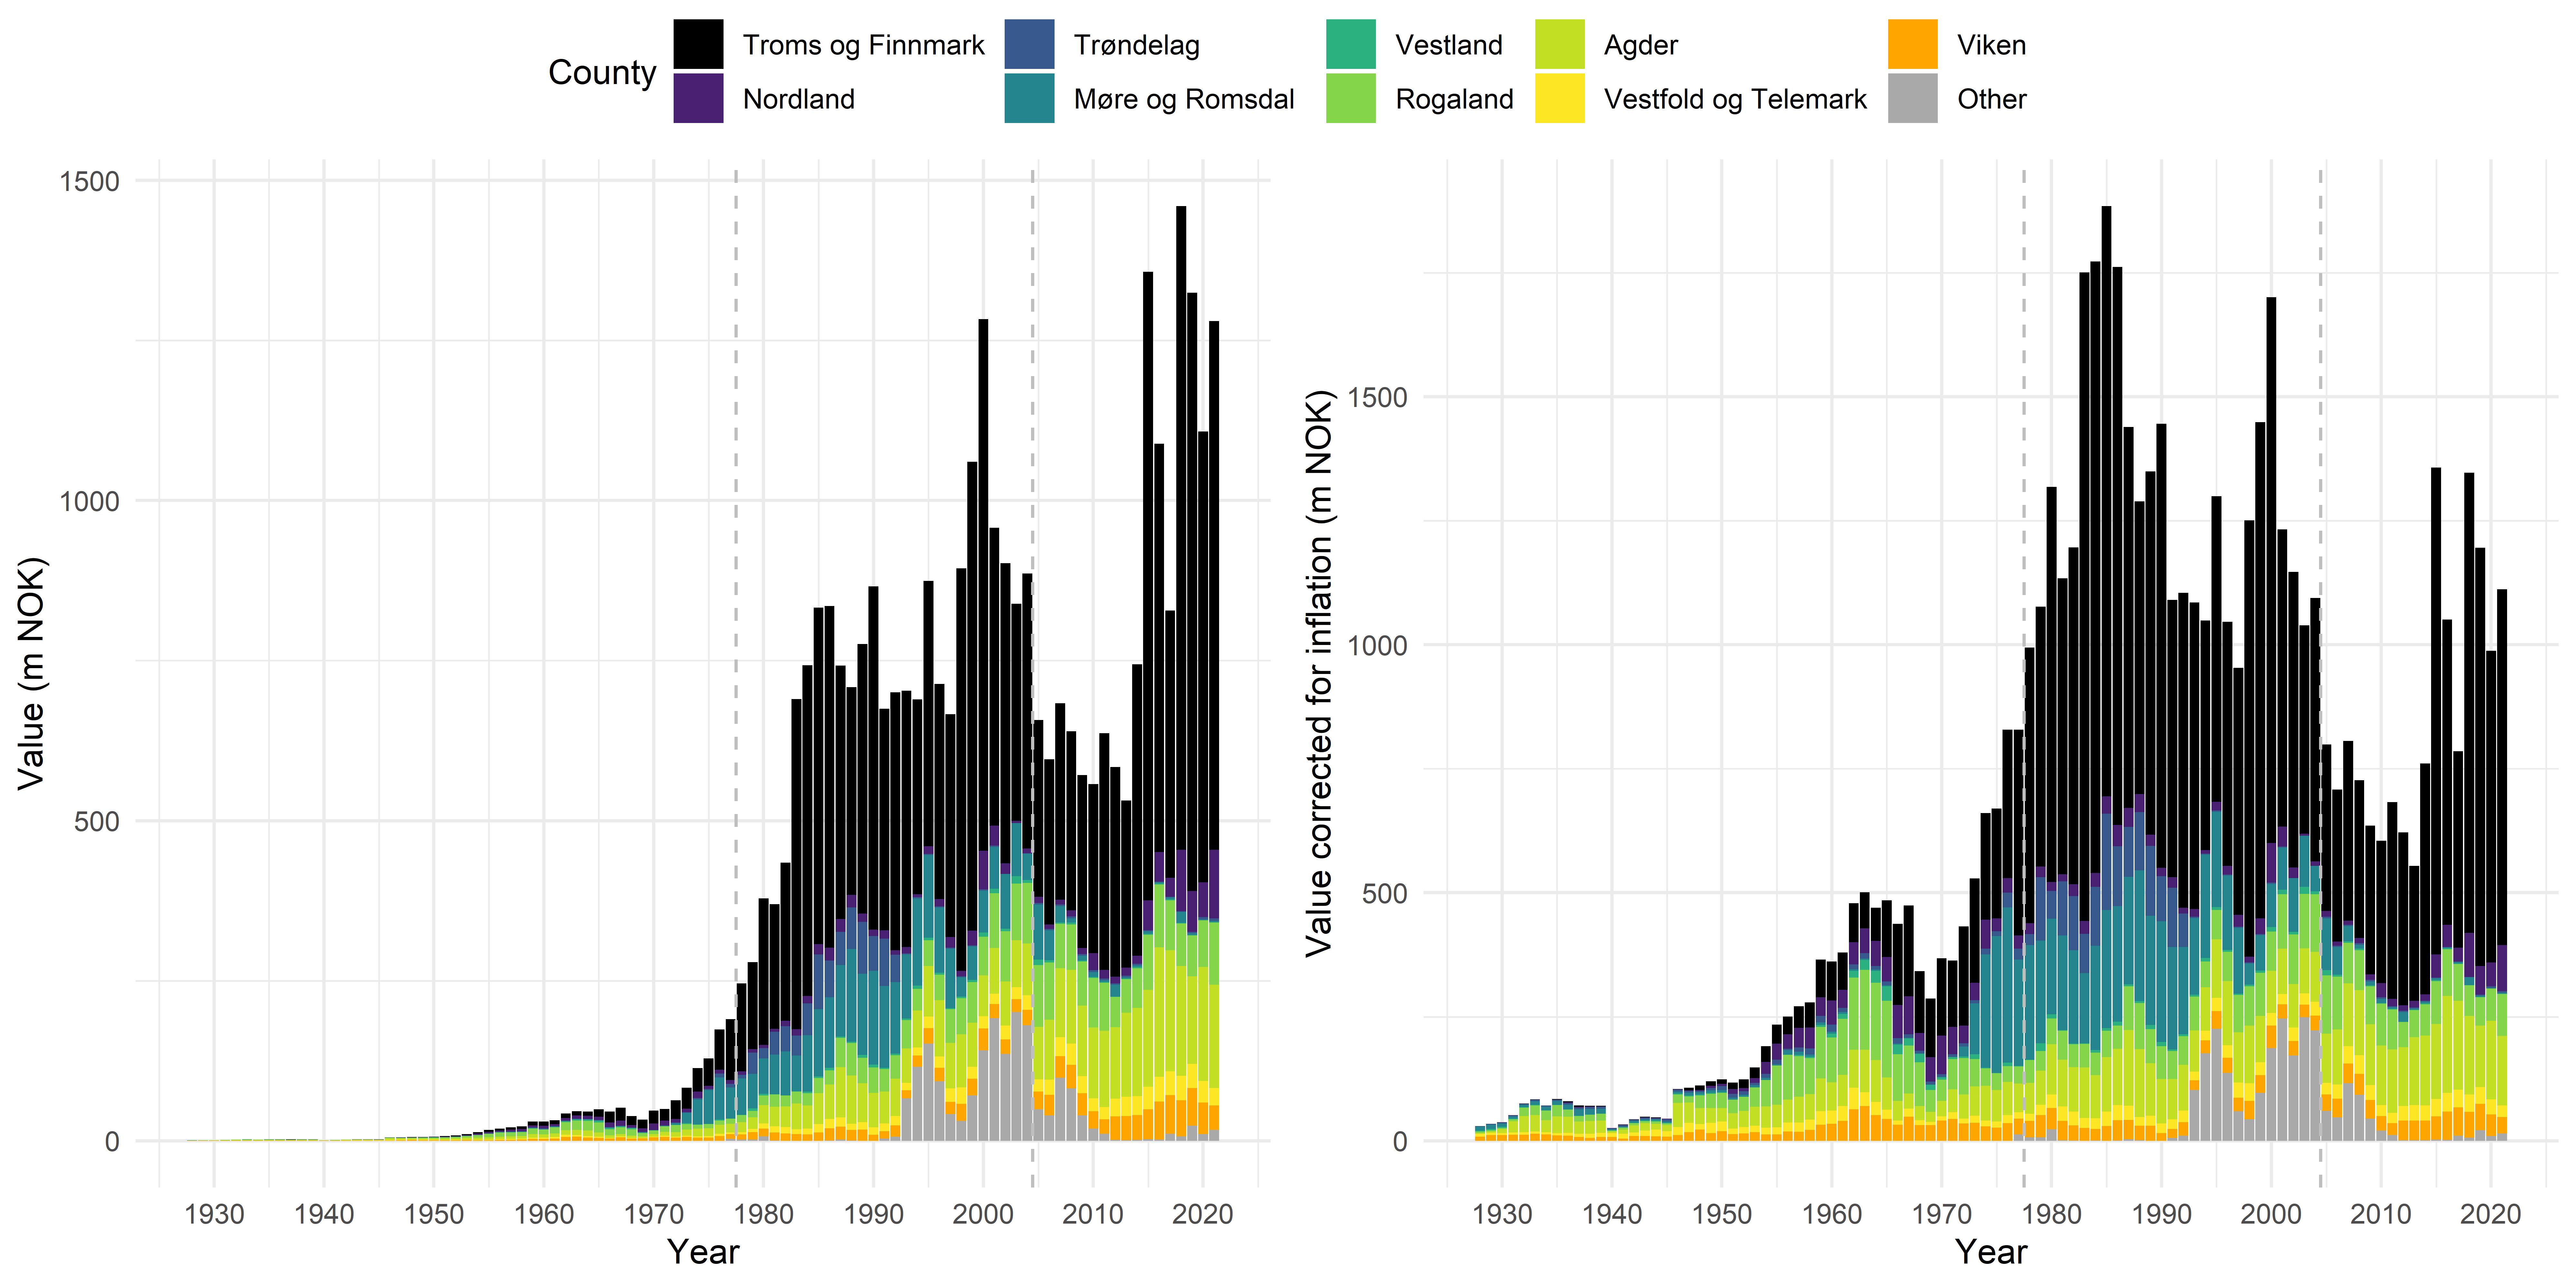
3.2 - Value of landings
The total value of the Norwegian shrimp landings has increased enormously throughout the time series (Figure 11). This trend is naturally much more pronounced for the nominal value due to increasing price levels over time. After correcting for consumer price inflation, the trend in value reflects more closely the development in landings over time (Figures 4, 11). There are no data on value from years prior to 1928, when the total value, corrected for inflation, was 29 747 NOK. Value (corrected for inflation) increased steadily from 1928 to 1965 to around 500 million NOK, followed by a drop to about 250 million NOK in 1970. The value then again increased steadily to peak in 1985 at 1 883 million NOK, the year of the highest total landings. A subsequent decline until 2010 was followed by a recent increase.
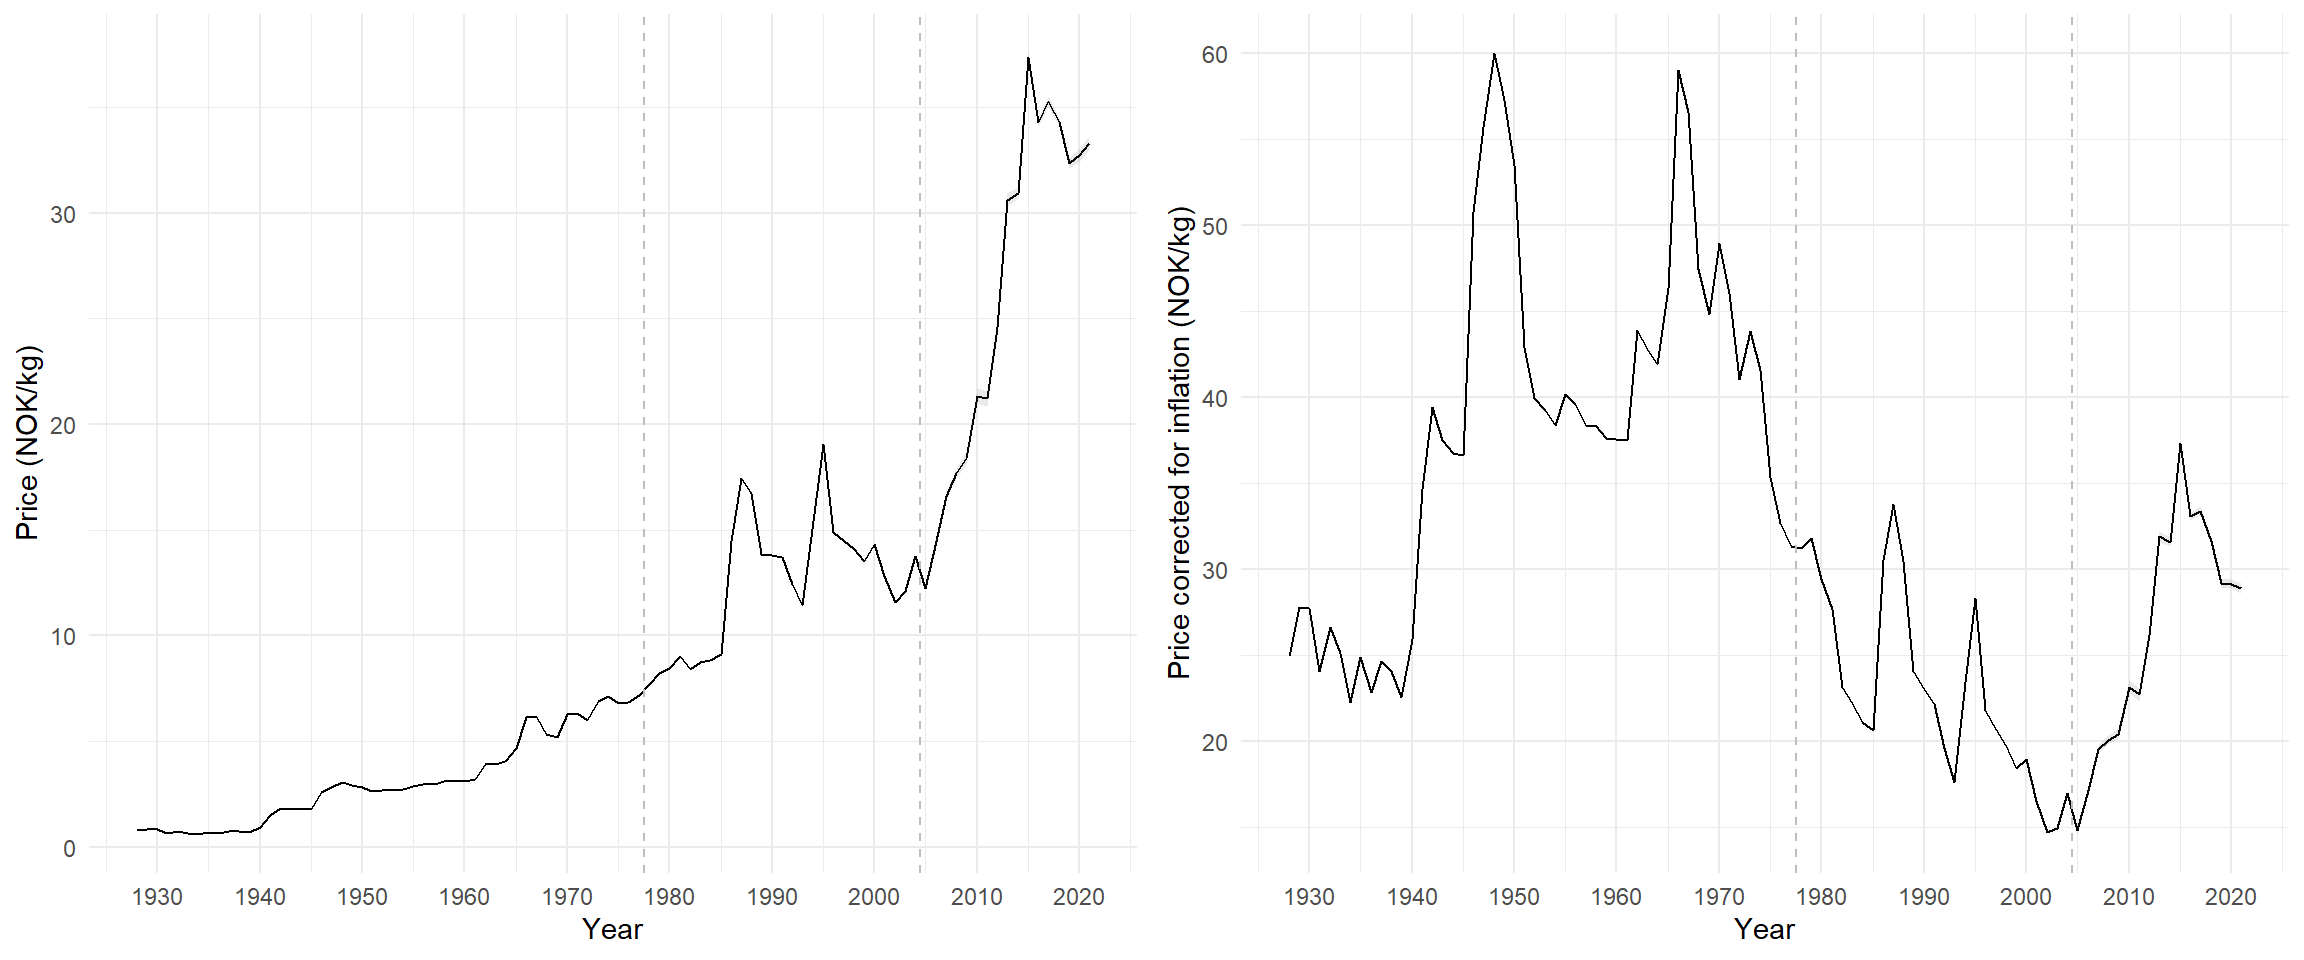
The pattern in total value is partly reflected in the mean price per kilo (first-hand price) that nominally increased almost exponentially from 2004 to the mid-2010s, to around 35 NOK/kg (Figure 12). When corrected for inflation, however, the first sale price has fluctuated substantially over the years, with two main peaks after World War II, one in the late 1940s and one in the mid-1960s (Figure 12). While total landings and, thus, total value increased and remained high until the early 2000s, the adjusted price per kg declined steadily during the same period. The first-hand price started recovering again following its lowest level in 2006, in parallel to the increasing shrimp landings in the past decade.
Figure 11. Total value of landings (million NOK) over time per county (county borders since January 1, 2020), nominal (left) and corrected for consumer price inflation (adjusted to 2014, right). “Other” includes landings abroad or at unknown locations. Value of landings in Oslo were too negligible to be visible and are therefore included in Viken values. Vertical dashed lines indicate the different time series: historic landings data (1908-1976, SSB), aggregated (1977-2004) and detailed sales slips (2005-2021, Norwegian Directorate of Fisheries).
Figure 12. Landing price over time, nominal average prices (left) and average prices corrected for consumer price inflation (adjusted to 2014, right). The price in 1928-2004 is the ratio of total value over landings, while from 2005 onwards mean price per landing was used. Vertical dashed lines indicate the different time series: historic landings data (1908-1976, SSB), aggregated (1977-2004) and detailed sales slips (2005-2021, Norwegian Directorate of Fisheries).
4 - Discussion
Long time series of fisheries landings are an important source of information to trace the development of a fishery and provide a historic baseline. Although many fisheries in the Northeast-Atlantic Ocean have existed for centuries, fisheries data are often only available for the most recent decades, limiting our knowledge about the dynamics of fisheries and fish stocks. Archiving and digitalizing spatially resolved historic fisheries data, when such records exist, therefore produce a valuable data source for research and stock assessment. Here, we presented for the first time the complete time series of the Norwegian shrimp landings per county, enabling us to follow the Norwegian shrimp fishery across more than a century.
The emergence of shrimp fishing in the Oslofjord and eastern Skagerrak in the end of the 19th century, and its subsequent expansion along the Norwegian coast and into offshore areas that facilitated a large increase in production, were the result of technological and scientific progress. Because of their preferred habitat, northern shrimp remained a largely inaccessible resource until early fisheries scientists became capable of surveying deeper areas and discovered relevant shrimp fields. Progress in gear technology and vessel power around the same time enabled fishers to exploit the newly discovered resource and expand the fishery in subsequent years. As for many other major fisheries, a large increase in production occurred with the emergence of industrial fisheries after World War II that made offshore fishing viable and, thus, expanded the accessible fishing grounds drastically. These dynamics are reflected by increasing landings, first mainly from the Skagerrak and Norwegian Deep area, later from the Barents Sea that began to dominate shrimp landings in the 1970s. In addition, fishing grounds around Jan Mayen, Greenland, and in international waters on the Grand Banks and the Flemish Cap became accessible for Norwegian vessels during periods from the 1980s to the early 2000s, resulting in substantial landings of shrimp in Norway originating from distant regions. Over time, offshore landings have virtually eclipsed the amounts produced in the inshore areas that have been decreasing or disappearing in many counties in the most recent decades.
Since northern shrimp consist of different populations and are managed as several stocks, spatially resolved landings data detail the onset and changes in the stock-specific fisheries and therefore provide valuable information for stock assessment and management. However, landings data alone are not sufficient as indicators of changes in the shrimp stocks, as changes in landings are the result of multiple drivers, of which stock dynamics are but one. As previously detailed, significant changes in shrimp landings were caused by technological development, increased fishing efficiency and the emergence of long-distance fleets. In addition, landing catches in a specific county is conditional on the availability of landing sites and processing plants, which in turn often depend on a local fishing fleet. While landing sites are a reasonable proxy for the fishing location in smaller-scale inshore fisheries where fishing vessels operate in a limited area, long-range offshore vessels can deliver their catches to landing sites far away from their fishing areas. For shrimp in Norway, this can be observed for Troms and Finnmark where most landings from the 1980s onwards originate from the Svalbard area and the central Barents Sea, inflating the relevance of these two counties. Other striking examples are the counties from Sogn og Fjordane until Sør-Trøndelag where landings from coastal areas were always low and changes over time therefore largely driven by the inflow of catches originating from the Barents Sea and Svalbard area, Jan Mayen, Greenland, the Grand Banks and the Flemish Cap. Because in these cases fluctuations in landings were mostly the result of where fishing vessels had their port of registry or processing plants were available, time series of landings might give a biased perspective of changes in the fishery within the specific county if the fishing areas were not accounted for. It is, thus, not possible to determine from landings data alone whether the decrease or disappearance of shrimp landings in many counties in Mid- and West-Norway over the past three decades has been caused by declining shrimp abundance in these areas, driven by economic factors such as the consolidation of shrimp landing sites and the fishing fleet, or a combination thereof. Local populations in Møre og Romsdal and Sør-Trøndelag have, furthermore, never sustained a significant fishery due to limited shrimp habitat in this region.
The first-hand price reflects both the size and processing of the landed shrimp (frozen, boiled/fresh, raw) and therefore the fishing area. The peaks in the first-hand price occurred while the shrimp landings were still dominated by landings from southwestern Norway and coastal areas, where shrimp are landed fresh, fetching high prices. As frozen landings from offshore areas started to dominate the total landings from the mid-1970s, the first-hand price decreased. The total value of the fishery similarly reflects fishing grounds; the landings into Troms og Finnmark (dominated by offshore landings) make up a disproportionally lower percentage of the total value of shrimp landings (Figure 11) then the landings volume should indicate (Figure 4). However, prices are also affected by an international market and other economic drivers, notably with the development of a global seafood trade in recent decades.
Fisheries dynamics are strongly governed by economic parameters such as landing prices and fuel costs, especially when they are not managed through catch limits. This applies for a large segment of the shrimp fishery in Norway, as only the shrimp stock in the Skagerrak and Norwegian Deep is regulated through a quota. Entry and catches in the fisheries for the shrimp stocks along the coast north of 62°N and in the Barents Sea are not restricted, and thus they are essentially open-access fisheries, as were many of the distant water fisheries in the past. Consequently, shrimp fishing vessels have likely been operating at the margin where total cost equate total revenue, making the fishing activity very price sensitive. As reported here, there have been substantial fluctuations in landing prices for shrimp over time, which likely have driven fluctuations in landings in response. In contrast to regional markets for fresh boiled shrimp along the coast, the largest share of landings is processed as frozen shrimp and is therefore part of an internationally integrated market. While there are probably feedbacks between prices and landings in Norway itself, it can be assumed that prices are strongly affected by the production of northern shrimp in other countries, as well as possibly of other shrimp species as substitutes. Unsurprisingly, the low point in mean prices in the early 2000s coincided with a peak in global production following large increases in landings in Canada and Greenland (Hvingel et al. 2021). The subsequent decline in global landings led to recovering prices and an increase in landings in Norway, especially from the Barents Sea and Svalbard area. These patterns demonstrate that economics can contribute substantially to our understanding of fisheries dynamics, and therefore underline the importance of maintaining and making available historic time series on landings value and prices, as achieved in this study.
Time series of landings that span the entire fishing history can provide an important reference against which today’s state of the fishery and stock can be compared, especially when integrated into an analytical stock assessment. The spatial resolution of the shrimp landings presented here enabled us to approximate catch time series for the two assessment areas of the northern shrimp stock in the Skagerrak and Norwegian Deep as defined today, and use them as input in the stock assessment model. This allowed for the estimation of stock size from 1908 onwards (ICES 2022b), creating a time series of stock dynamics that is longer than for almost any other stock. Furthermore, this made it possible to test the robustness of the stock assessment to the length of the inputted landings time series, showing that the default approach of using landings dating only back until the 1970s produces stock estimates in line with those estimated from the complete time series. The case of shrimp in the Skagerrak and Norwegian Deep underlines therefore the practical relevance of historic landings data. Consequently, we recommend that all landings data for all species are made accessible in the highest possible spatial resolution to broaden our perspective of the development of fisheries, contributing to the sustainable management of marine resources.
5 - Acknowledgements
We are grateful to the Norwegian Directorate of Fisheries, by Trond Almendingen and Randi Sofie Sletten Hopland, for providing us with shrimp landings data by county for the years 1977-2004. We are grateful to the Norwegian Directorate of Fisheries, by Trond Almendingen and Randi Sofie Sletten Hopland, for providing us with shrimp landings data by county for the years 1977-2004. This study was funded by the Norwegian Ministry of Trade, Industry and Fisheries through the Norwegian Institute of Marine Research projects “Coastal shellfish resources” in the research program “Coastal Ecosystems” and “Shrimp in the North Sea and Skagerrak” in the research program “North Sea”, and the Norwegian Research Council project CoastRisk (project number 299554).
6 - References
Casas, J.M. (2012) Assessment of the International Fishery for Shrimp (Pandalus borealis) in Division 3M (Flemish Cap), 1993-2012. NAFO SCR Doc.12/52. 16 pp.
Garcia, E.G. (2007) The Northern Shrimp (Pandalus borealis) Offshore Fishery in the Northeast Atlantic. Advances in Marine Biology 52: 147-266.
Hjort, J. and Ruud, J.T. (1938) Rekefisket som naturhistorie og samfundssak. Report on Norwegian Fishery and Marine Investigations Vol. V, No. 4. 158 pp. (In Norwegian)
Hvingel, C., Sainte-Marie, B. and Kruse, G.H. (2021) Cold-water shellfish as harvestable resources and important ecosystem players. ICES Journal of Marine Science 78(2): 479-490. doi:10.1093/icesjms/fsab005.
ICES. (2021) Greater North Sea Sea Ecoregion – Ecosystem overview. In Report of the ICES Advisory Committee, 2021. ICES Advice 2021, Section 9.1, https://doi.org/10.17895/ices.advice.9434.
ICES. (2022a) Benchmark workshop on Pandalus stocks (WKPRAWN). ICES Scientific Reports. 4:20. Edited by C. Lordan, and J. Lövgren. 249 pp. 10.17895/ices.pub.19714204.v1
ICES. (2022b) Joint NAFO\ICES Pandalus Assessment Working Group (NIPAG). ICES Scientific Reports. 4:38. 25 pp. 10.17895/ices.pub.19692181
IMR (2021) Tema: Northern shrimp. Reke – Barentshavet | Institute of Marine Research (https://www.hi.no/hi/temasider/arter) (In Norwegian)
Iversen, T. (1926) Rækefisket og ræketrawlen. Særtryk av «Aarsberetning vedk. Norges Fiskerier» 1. hefte, 1926. 23 pp. (In Norwegian)
Knutsen, E.R. (2022) Kvantifisering av utkast i det sørlige, norske rekefisket. Master thesis. Department of Biological Sciences, University of Bergen. 116 pp. (In Norwegian)
NAFO/ICES. (2021) Report of the NAFO/ICES Pandalus Assessment Group Meeting, 1-4 November 2021, WebEx. NAFO SCS Doc. 21/19. 68 pp.
Rasmussen, B. (1967) Temperaturforhold og rekefiske i Skagerak 1962-66. Fiskets Gang 47: 842-847. (In Norwegian)
Shumway, S.E., Perkins, H.C., Schick, D.F. and Stickney, A.P. (1985) Synopsis of Biological Data on the Pink Shrimp, Pandalus borealis Krøyer, 1838. NOAA Technical Report NMFS 30. FAO Fisheries Synopsis No. 144. 65 pp.
Statistisk sentralbyrå. Digitaliserte publikasjoner utgitt av SSB 1977-1996
Stålesen, O. (1963) Fisken på rekefeltene i Oslofjorden. Master thesis. University of Oslo. 51 pp. (In Norwegian)
Søvik, G., Nedreaas, K., Zimmermann, F., Husson, B., Strand, H.K., Jørgensen, L.L., Strand, M., Thangstad, T.H., Hansen, A., Båtevik, T., Albretsen, J. og Staby, A. (2020) Kartlegging av fjordøkosystemene i Tana- og Porsangerfjorden. Råd og kunnskapsbidrag fra Havforskningsinstituttet i forbindelse med vurdering av en eventuell åpning av direktefiske etter reker med bunntrål i Tana- og Porsangerfjorden. Rapport fra Havforskningen 2020-39, ISSN:1893-4536. 140 s. https://www.hi.no/hi/nettrapporter/rapport-fra-havforskningen-2020-39 (In Norwegian)
Thorsnæs, G. (2021) amt i Store norske leksikon. https://snl.no/amt (In Norwegian)
Zimmermann, F., Søvik, G. og Thangstad, T.H. (2019) Kunnskapsstatus rekefelt langs norskekysten. Bestilling fra Fiskeridirektoratet. Rapport fra Havforskningen nr. 2019-15. ISSN:1893-4536. 13 pp. (In Norwegian)
Zimmermann, F., Nedreaas, K.H., Thangstad, T.H. og Søvik, G. (2021) Kartlegging av bunnfisk og reker på rekefelt i vestlandsfjorder (toktnummer 2021854). Toktrapport/Havforskningsinstituttet/ISSN 15036294/Nr. 16-2021. 41 pp. (In Norwegian)
7 - Appendix
Østfold
Akershus
Buskerud
Oslo
Vestfold
Telemark
Aust-Agder
Vest-Agder
Rogaland
Hordaland
Sogn og Fjordane
Møre og Romsdal
Sør-Trøndelag
Nord-Trøndelag
Nordland
Troms
Finnmark
1908
206
2
1
15
76.4
12.6
1
8.5
88.5
8
0.05
1909
30.1
9.3
3
31.9
83
11.5
0.8
8
193
26.6
1.2
1910
30.1
51
1.5
87.8
118
9
1.6
7
116
0.2
29.4
0.2
0.03
1911
180
49.4
1
50
104
11.5
1.7
8.1
102
0.8
25
1912
200
40
0.85
77.5
15.5
4
1.8
4.5
89.2
12.3
1913
197
58
2
95.9
82.2
6.5
3
7
90
2.56
1.2
1914
176
85.2
2
209
88.6
9.5
2.1
4
42
7.5
4.25
1915
176
70.5
3
180
81.2
10
12.2
3
120
0.6
5.2
1
1916
172
23.9
3
93
1.1
0.6
5.5
97
0.3
1.4
10
1917
130
16.5
2.5
70.8
6.5
3
6.2
10
1918
40
11.4
4
131
12.2
5
6.7
16
0.5
1919
130
12.6
3
58.2
12.3
5.5
8.5
10
0.5
1920
120
3
64
16.9
2
0.1
8.6
0.4
1.5
1921
135
14
4
60.4
10.9
16
3.8
6
166
0.8
3.4
1922
102
12
3
35.8
33.6
3.2
3.5
168
1.4
8.9
237
1923
212
12.5
10
47
37.3
11
1.7
4
118
5
15
121
1924
127
11.7
4
22.5
51
60.1
12.2
17.9
127
3
11.5
280
1925
188
10.4
6
26.4
83.7
57.7
20
12.6
139
135
8.4
325
2
1926
145
52.7
4
35
69.8
109
39.5
27.5
120
9.3
10.5
264
12
1927
395
46
8
55
72
120
45.4
40
74.1
3.7
20.3
325
16.3
1.5
1928
161
28
6
86
87
150
50
39
119
6
71
319
68
1
1929
173
43
4
116
74
101
57
54
108
6
74
331
91
2
2
1930
185
41
5
110
59
105
72
276
81
9
84
219
83
4
16
1931
269
41
3
95
116
117
96
934
130
9.4
58
169
81
6
10.3
0.2
1932
255
52
5
90
122
114
87
1214
507
27
25
212
73
7
13
14
1933
410
36
6
68
118
103
1193
776
20
10
328
127
6
6
14
1934
425
39
4
55
174
61
170
1008
770
17
23
318
122
8
4
13
1935
360
41
3
46
104
88
86
1256
791
17
17
335
110
13
8
109
3
1936
319
37
1
51
92
182
61
1292
635
9
20
425
118
13
50
109
58
1937
160
28
1
54
111
177
95
793
367
18
14
585
123
19
111
105
132
1938
135
14
2
44
94
323
116
882
502
16
7
495
124
28
65
27
47
1939
211
20
2
52
103
311
122
967
623
18
9
414
142
30
45
28
28
1940
162
27
5
65
66
245
67
56
57
11
9
91
97
11
3
4
20
1941
96
10
12
16
76
177
77
174
95
7
17
46
105
5
21
9
5
1942
153
47.4
8
10.2
70.8
112
68
300
115
7.9
15
96.5
48.7
11.6
9.3
12.8
11.2
1943
192
40.3
8
9.2
140
148
120
284
99.2
19
15.7
84.3
68.6
11.4
22.3
24.3
1944
183
27.6
24
5.8
189
179
138
190
125
18.3
23.3
70.7
49
4.1
28.8
21.2
1945
136
46.2
38
2.2
156
154
140
181
102
5.6
18.9
82
113
5.3
28.2
7.3
1946
139
43.4
30.8
5.6
124
242
267
624
324
9.2
28.7
86.3
81.3
6.9
18.8
23.7
1947
234
36.6
27
20
142
213
126
571
206
10.3
15.8
106
58.5
6
31.8
115
1948
276
34.8
31.4
40.4
98
87.1
53.9
444
407
7.9
19.5
78.1
41.4
7.3
49.7
179
1949
272
44.6
112
203
65.2
417
463
12.9
25.3
86.2
73.9
16.6
87.6
212
1950
275
7.8
37.3
5.5
89.1
269
79.9
366
577
0.6
22.8
73.6
83.6
63.1
87.9
273
1951
224
21.5
51.5
179
83
583
622
84.5
53
116
245
293
173
1952
294
9.4
8.9
5.5
104
193
87
665
618
104
65.2
110
167
559
104
1953
304
4.9
10.5
10.8
114
175
112
774
895
106
63.9
70.7
324
647
152
1954
251
3.6
6.4
0.6
103
190
123
903
1264
98.5
119
58.4
746
972
121
1955
269
3.6
4.5
0.3
144
188
129
921
1796
57
151
59.4
888
1087
127
1956
294
4.6
3.4
1.1
137
231
105
979
2172
7.3
202
5.8
77.5
888
1004
205
1957
312
12.1
3
1.8
144
238
138
1027
1916
52.1
172
157
87.3
1260
1330
219
1958
422
8.8
1
0.9
182
257
210
974
1511
62.5
115
203
146
1357
1322
499
1959
648
20
1.6
1
266
338
228
1460
2631
74.2
138
204
149
1162
1553
831
1960
606
22.8
2.8
2.9
197
388
204
1282
2317
153
107
214
204
1504
1534
876
1961
772
4
1
1
280
423
231
1388
2963
229
106
102
137
1117
1250
1106
1962
1110
8
1
1
269
667
327
1354
3119
275
73
149
114
1257
1432
752
1963
1140
9
2
2
153
478
237
1823
3744
435
64
135
147
1338
1530
468
1964
746
7
11
1
166
415
213
1797
3629
501
54
71
133
1471
1571
416
1965
528
7
90
250
126
1134
3022
512
38
75
140
1357
2406
769
1966
305
5
14
24
80
81
426
1360
221
39
80
130
1353
2165
1132
1967
529
2
54
154
76
371
1449
164
23
46
99
1669
2334
1413
1968
349
2
8
41
117
72
371
1481
241
23
44
81
1004
2318
1051
1969
386
16
92
45
272
772
171
16
57
63
1389
1970
1138
1970
601
28
104
44
460
691
58
19
46
69
1932
2255
1204
1971
618
57
182
91
767
1040
54
19
49
52
1456
2154
1350
1972
487
40
125
67
831
1296
58
353
119
51
1193
4229
1667
1973
589
73
175
62
835
888
30
172
1773
61
93
1092
4838
1385
1974
511
81
144
67
1242
603
20
4958
117
117
1574
4924
1525
1975
596
118
167
103
1293
744
19
7158
98
120
813
6632
1088
1976
827
187
225
211
1553
776
31
168
9483
657
84
832
8772
1547
1977
616
132
144
166
1312
907
20
0.13
6698
407
74.6
775
11589
2711
1978
638
96.7
159
151
1052
982
13
5664
363
83.1
768
15395
6317
1979
860
167
242
214
1162
730
303
3
4669
2269
92.1
656
12836
9527
1980
950
1.62
23.5
255
383
355
1863
1110
254
2.62
4546
1016
113
530
17775
15162
1981
929
1.37
30.3
369
412
369
2158
1524
18.1
0.87
3567
1935
84.6
498
14415
14627
1982
786
0.24
29.7
334
429
457
2032
1349
21.3
5426
2304
84.7
781
19038
18526
1983
570
0.36
31.5
175
315
371
2405
1479
30.4
4951
1744
50.5
972
33861
31849
1984
688
0.7
35.8
290
342
390
1873
1420
336
3.37
6836
2600
56.4
1176
28481
39341
1985
1038
17.8
410
478
481
2473
1607
276
0.24
7638
3908
45
1573
31383
39836
1986
1045
0.86
30.8
390
450
620
2535
1357
33.9
200
6894
1930
59.5
1139
22734
18256
1987
870
28.2
31.1
312
401
514
3466
2398
91
1.63
5701
1544
50.5
948
15224
10787
1988
637
29.4
29.7
196
247
387
3394
2532
88.2
1.83
6249
1510
42.3
947
14739
11254
1989
905
5.5
8.44
279
299
326
2524
1905
232
112
6327
2322
30.4
676
24638
15489
1990
497
309
329
395
2440
2032
128
154
6189
1664
25.5
570
28517
19452
1991
688
320
357
416
2449
1795
84
28.9
4243
1884
19.8
826
23885
11891
1992
1004
0.3
344
453
456
2624
1968
113
8.7
2780
1090
23.5
341
29542
15298
1993
928
364
437
420
2716
2272
115
10.4
4942
78.6
21.3
712
31663
14575
1994
1051
0.3
375
430
606
2515
1598
309
12.2
5739
20.4
27.6
253
22831
4359
1995
1218
443
469
961
3072
1797
217
9.13
4561
27.9
26.5
551
20334
5821
1996
1055
377
478
1268
2880
1592
155
8.09
4108
30.8
30.1
842
25158
5355
1997
1108
580
641
1350
2271
2364
51.8
8.76
3795
20.4
16.3
944
25362
5313
1998
1473
606
785
1393
2815
2329
66.3
10.5
1399
18.6
19.8
482
45175
5591
1999
926
213
9.37
319
439
756
1992
2075
76.9
10.2
2760
15.6
17
1781
54681
8997
2000
898
419
278
322
426
651
1637
1948
59
231
2394
119
7.03
5112
57439
12157
2001
758
25.3
284
324
500
2060
2847
119
194
4362
175
6.05
2524
42315
5165
2002
906
0.12
24.1
444
517
574
1955
2589
126
12.4
5077
2.39
3.3
1598
47711
5235
2003
860
0.31
20.6
382
486
526
2229
2909
140
231
4291
0.84
4.19
175
36985
544
2004
1098
21
583
563
701
2506
3362
118
18
2147
0.81
5.77
738
39733
295
2005
1157
17.4
21.6
478
516
753
2385
3121
91.9
131
3290
10.8
27.9
1387
37020
4.24
2006
1328
20.2
20
565
706
984
2229
2236
79.2
7.45
1401
9.28
23.9
499
28507
1.49
2007
1175
3.9
22.5
553
958
1467
2318
1664
40.5
2.94
1084
2.82
32.9
203
27359
2008
1104
12.4
30
597
844
1304
2172
1662
38.9
3.4
452
4.69
39
256
24114
0.3
2009
855
38.1
28.7
403
536
693
1964
1462
19.5
2.28
376
3.05
37.4
193
22273
2010
496
31.8
19.8
231
209
357
1680
1290
18.5
2.77
584
2.21
34.8
861
19210
44.3
2011
449
9.98
0.3
8.39
188
246
414
1818
1274
8.26
0.75
591
7.63
20.3
425
23905
7.86
2012
799
5.03
14.2
311
458
698
1562
706
5.07
0.65
470
10.2
19
196
18402
5.36
2013
754
11.7
317
441
894
1557
863
9.57
0.06
22.6
0.1
20.6
271
12107
102
2014
975
16.3
369
467
857
1951
1058
21.5
28.9
0.11
20.7
178
17466
375
2015
992
17.3
471
548
960
1937
1330
26.1
0.44
55
0.2
15.2
1126
27687
941
2016
1152
23.1
356
610
1135
2753
1617
25.5
0.81
17.8
0.17
9.24
1446
21506
736
2017
1063
18.9
388
415
947
2165
1147
12.4
1.33
42.6
0.08
8.74
775
15917
141
2018
864
11.4
361
302
822
1710
978
6.88
0.92
567
2976
28554
4874
2019
763
10.5
322
204
545
1296
794
4.48
0.52
18.4
2118
28544
7692
2020
620
16.6
500
2579
1270
2.61
8.45
21.6
1712
29184
2021
478
10.4
376
2077
1157
2.1
23.8
22.8
3895
32928
Table 2. Landings (t) per county in 1908-2021. Landings that were less than 10 t were rounded to two decimal places, landings between 10 and 100 t were rounded to one decimal place and landings above 100 t were rounded to the nearest whole number.