On 30 th March 2022 all Russian participation in ICES was temporally suspended. Although the announcement of the suspension stressed the role of ICES as a “multilateral science organization”, this suspension applied not only to research activities, but also to the ICES work providing fisheries advice for the sustainable management of fish stocks and ecosystems. As a result of the suspension, the ICES AFWG provided advice only for saithe, coastal cod north, coastal cod south, and golden redfish ( Sebastes norvegicus ). Northeast Arctic (NEA) cod, haddock and Greenland halibut assessments have been conducted outside of ICES in a newly constituted Joint Russian-Norwegian Working Group on Arctic Fisheries (JRN-AFWG). Although this work has been conducted independently of ICES, the methodologies agreed at ICES benchmarks and agreed HCRs (Harvest Control Rules) have been followed in providing this advice.
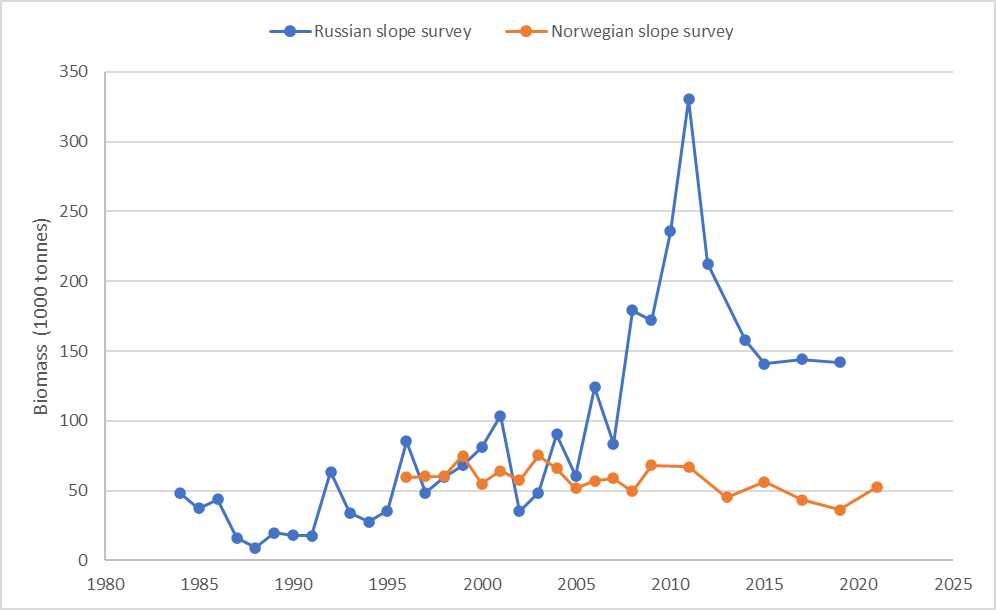
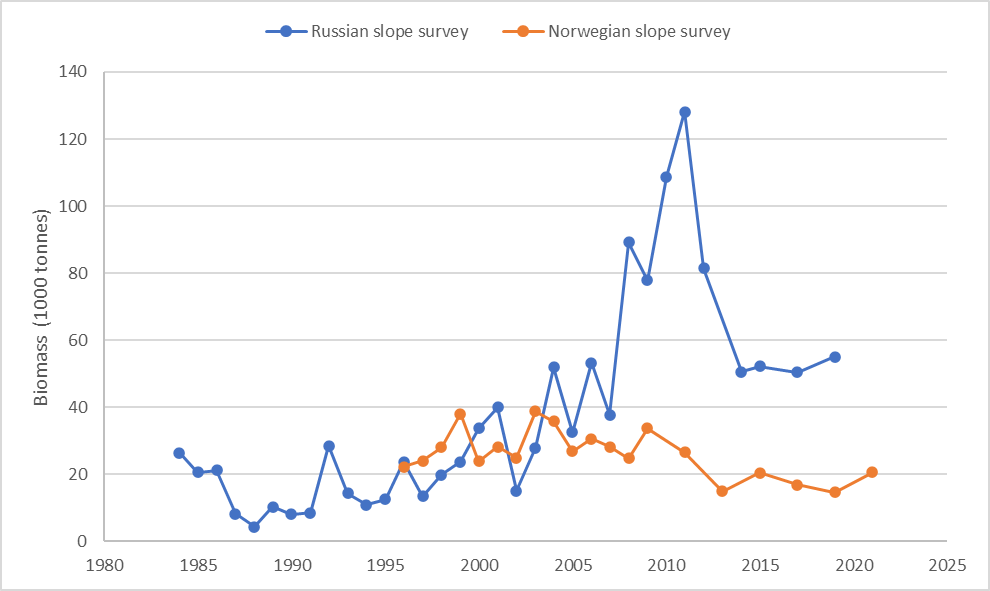
The Greenland halibut model has been revised at an ICES benchmark in 2023. The JRN-AFWG has agreed to use the new ICES model, with the addition of revising the Russian survey tuning index (as was recommended at the benchmark). Although the overall biomass level in the model has been revised, the trends and advice are similar to the old model. The Greenland halibut advice is for one year to bring the timing back in line with the slope survey, after this a two-year advice cycle will resume. The main worry with that stock is a history of TACs and catches well above advice. Given that the model is now indicating that the stock will drop below B pa by the end of 2023, continuing to set quota above advice poses a risk of serious harm to the stock.
Advice on fishing opportunities for NEA cod
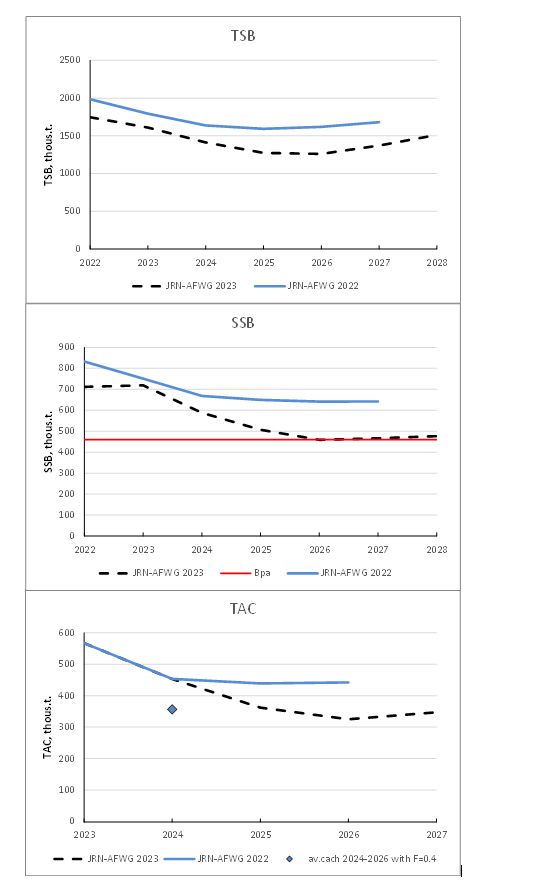
The NEA cod stock is continuing to decline following a period of moderate to poor recruitment. Following the agreed HCR, the advice is constrained by the interannual stability constraint criteria of 20% annual change in quota. Advice is that catches in 2024 should not exceed 453 427 tonnes.
Advice on fishing opportunities for NEA haddock
Advice is that catches in 2024 should not exceed 127 550 tonnes, down 25% from the advice for 2023 (constrained by the interannual stability constraint criteria of 25% annual change in quota. The haddock total stock biomass is declining as the relatively large 2016 yearclass is caught.
Advice on fishing opportunities for Greenland halibut
Advice is that catches in 2024 should not exceed 15 560 tonnes, down 16% from the advice for 2023. The stock is projected to drop below Bpa by the end of 2023. Note that this stock has a history of being fished above advice, and the advised quota is 38% below the TAC for 2023. There are signs of recent good recruitment, and projections indicate that the stock should increase in the medium term if catches are in line with advice.
23.06.23: Tables and figures in chapter 3 have been updated
2 - Introduction and ecosystem overview
This report presents the details of the stock assessments conducted for Northeast Arctic cod, haddock and Greenland halibut in ICES subareas 1 and 2. Due to the temporary suspension of Russian scientists from ICES, this is a joint Russian-Norwegian advice and explicitly not an ICES advice. However, the assessment methodology has followed the standard ICES procedure, using the models approved at ICES benchmarks and the Harvest Control Rules which have been evaluated as precautionary by ICES.
The work presented here would typically form a part of the ICES Arctic Fisheries Working Group (AFWG). In order to keep continuity with previous reports, and to minimize the chances of errors arising from renumbering given the tight deadline to prepare this report, the chapter numbers for each stock chapter are maintained from the last AFWG report (ICES 2021). This also allows for anyone with previous AFWG experience to locate information rapidly and easily. As a result, this report contains Chapter 1 (executive summary), Chapter 2 (this introduction, and the ecosystem overview), Chapter 3 (Northeast Arctic cod), Chapter 4 (Northeast Arctic haddock), and Chapter 8 (Greenland halibut).
2.1 - Introduction and ecosystem overview
The aim of this chapter is to identify important ecosystem information influencing the fish stocks. Ecosystem and climate changes, along with fishery, determine the stock dynamics of commercial species. Water temperature and ice conditions influence on distribution of the commercial fishes in the Barents Sea. Apart from this, temperature impacts on growth rate and mortality at the early stages (larvae, juveniles). Currents affect the strength of year-classes by providing transport of eggs, larvae and 0-group of commercial species from the spawning areas into the Barents Sea. Food availability is another important ecosystem driver that influence on the rate of growth and maturation of commercial fishes. It depends not only on the prey availability, but also on feeding competition. Mortality due to predation, including cannibalism, can greatly affect population abundance of commercial species. The impact of ecosystem changes on the dynamics of bycatches of juveniles and non-target species in mixed fisheries should also be taken into account.
Specification of the ecosystem impact on the assessed species :
Cod
The cod stock is decreasing. A further reduction is expected in stock size, which will lead to reduction of cod predation pressure on its prey species. It should be expected relatively less consumption of capelin, haddock and shrimp. The main effect of the ecosystem impact on cod stock dynamics is manifested in the change in the abundance of its recruitment. There were no strong year-classes of cod since 2005 despite high cod SSB. Meso-zooplankton is important for survival of larvae and 0-group cod, so their distribution must overlap with areas of relatively high plankton biomasses. Despite a large number of studies (see e.g. summary in Ottersen et. al, 2014), the underlying mechanism of the impact of the Barents Sea ecosystem on cod recruitment is still not well understood.
Haddock
Warm conditions are positive, but not sufficient to ensure good recruitment and growth. Plankton bloom (timing and strength) and influx are important for recruitment, and feeding conditions indices for the different age classes is important for growth and reproduction. In 2019-2020 feeding conditions of haddock in the Barents Sea were poor, which reduced its condition. Older haddock include a high proportion of benthic invertebrates in their diet, the availability of this prey group is not known. Reduction in cod stock, and increase in capelin could lead to less predation on haddock by cod, and therefore lower mortality on both pre-recruits and younger haddock recruited into the fishery.
Greenland halibut
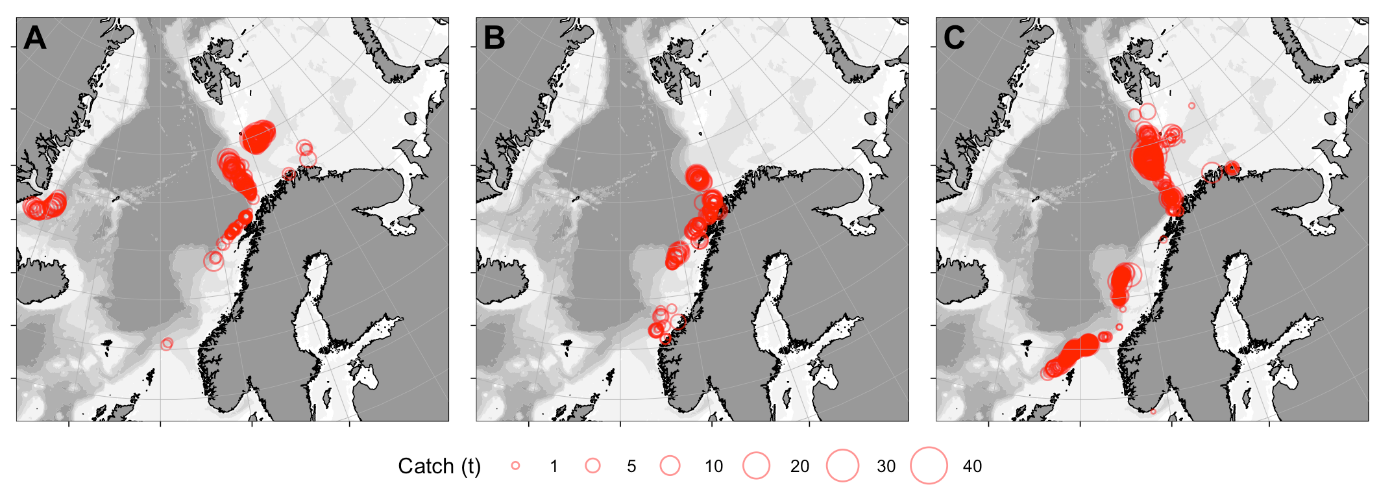
The distribution of the Greenland halibut stock is very uneven in the Barents Sea and adjacent waters and strongly depends on the migrations that it makes throughout its life. The highest densities of adult fish are observed in spawning grounds on the slope of the continental shelf. Juveniles are widely distributed along the northern part of the shelf and their abundance in the Barents Sea may be affected by water temperature and currents, although the effect of these factors is not fully understood and uncertain. Growth and maturation of the Greenland halibut depend on prey abundance. Greenland halibut feed on zooplankton, capelin, herring, polar cod and other small fishes. Cod can be both predator and food competitor for Greenland halibut. Cannibalism can be also observed in areas with overlapping of adults and juveniles. Mammals can consume Greenland halibut in the spawning areas.
Beaked redfish
As a boreal species, it is benefiting from the warming in the Barents Sea. Its stock has increased in recent years. Feeding condition for beaked redfish in 2021-2022 were likely to be relatively stable. Cod and Greenland halibut are main predators for the beaked redfish. However, as abundance of these species is declining and abundance of capelin and polar cod is increased, the predation pressure on redfish probably is relatively low. In recent years, the mortality rate of young beaked redfish has been high due to bycatches in the shrimp fishery (ICES AFWG, 2023). This strongly depends on the overlap between the distribution areas of redfish juveniles and shrimp fishery areas. The stock size and distribution of shrimp as well as currents and temperature affect this.
Current situation :
Some features of the Barents Sea ecosystem that determined the distribution and development of fish stocks in 2022 and that will affect stocks dynamics in 2023 were considered at the annual meeting between Russian and Norwegian scientists, 15-17 March 2023 and are presented in the national Russian and Norwegian ecosystem status reports. The lack of synopticity and incomplete spatial coverage in the 2022 joint ecosystem survey (van der Meeren and Prozokevitch, 2023) makes the evaluation of the ecosystem status more uncertain than usual. In particular, the abundance of pelagic and 0-group fish is uncertain.
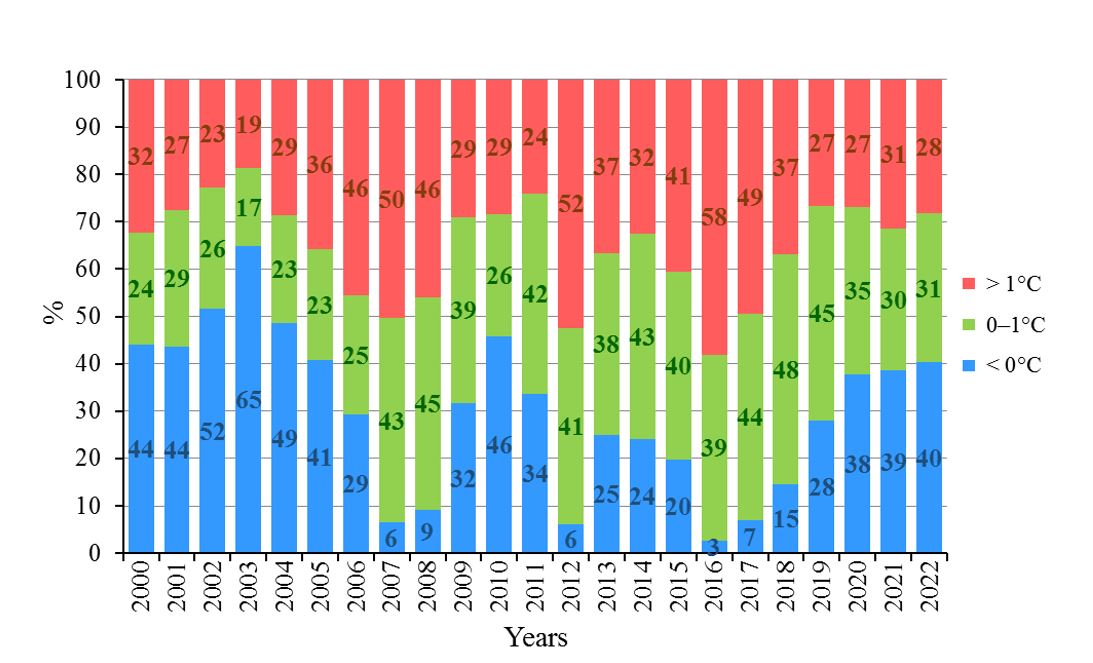
A warming was evident in 2022 in the Barents Sea, with temperatures well above the long-term mean (1981-2010). Ice coverage of the Barents Sea in 2022 was below average and close to that in 2021. Compared to 2021, the area averaged sea surface temperature in the northwest of the Barents Sea was higher by 0.3°C, in the southwest by 0.5°C, and in the southeast by 0.7°C. The area of the Barents Sea occupied by bottom waters with a temperature < 0°C amounted to 37% and was close to the level of the last three years (Fig. 1). According to the expert evaluation, Atlantic water temperature in the Murman Current in 2023 is expected to decline slightly but remain typical of warm years. Due to high temperatures and low sea-ice extent in recent years, the ice coverage of the Barents Sea is expected to remain below normal. Lower than average ice coverage and longer duration of ice-free season, increase primary productivity of the Barents Sea.
Figure 1. Area of bottom waters with different temperature ranges in the Barents Sea in September-October 2000-2022.
Euphausiids, amphipods and shrimp are important prey for most commercial fish in the Barents Sea. In 2022 the total biomass of euphausiids was slightly less than long term mean (2015-2021). In recent years, the northern shrimp stock has remained stable, showing fluctuations but without a clear trend.
Capelin, polar cod and young herring are the main forage pelagic fish in the Barents Sea, which are important prey for most predators in the area, including commercial demersal species. These species are very sensitive to various changes in the ecosystem, the influence of predators, fishing, or the plankton availability. Historically, their stocks change rapidly depending on year-classes strength. Capelin abundance is still around average level, although the lack of coverage of pelagic fish in the eastern part of the Barents Sea during the ecosystem survey in 2022 makes the situation somewhat uncertain. The capelin stock is expected to decrease in 2023-2024 due to below average recruitment. The 2022 year- class of herring was very abundant in the ecosystem survey as 0-group and also frequently found in cod stomachs in autumn 2022. This strong herring year class may have a negative impact on capelin recruitment. Polar cod biomass index was at a high level in 2021, the situation in 2022 and the outlook is uncertain due to lack of synoptic coverage during the ecosystem survey.
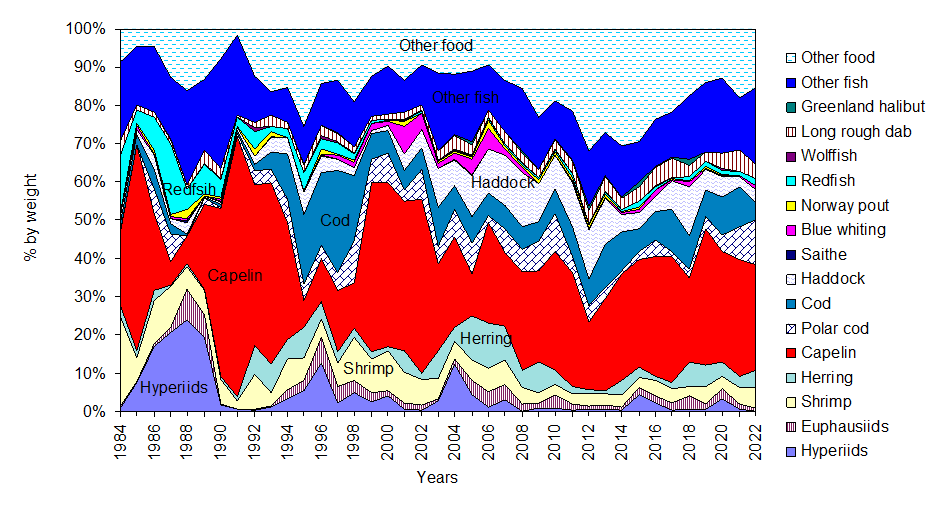
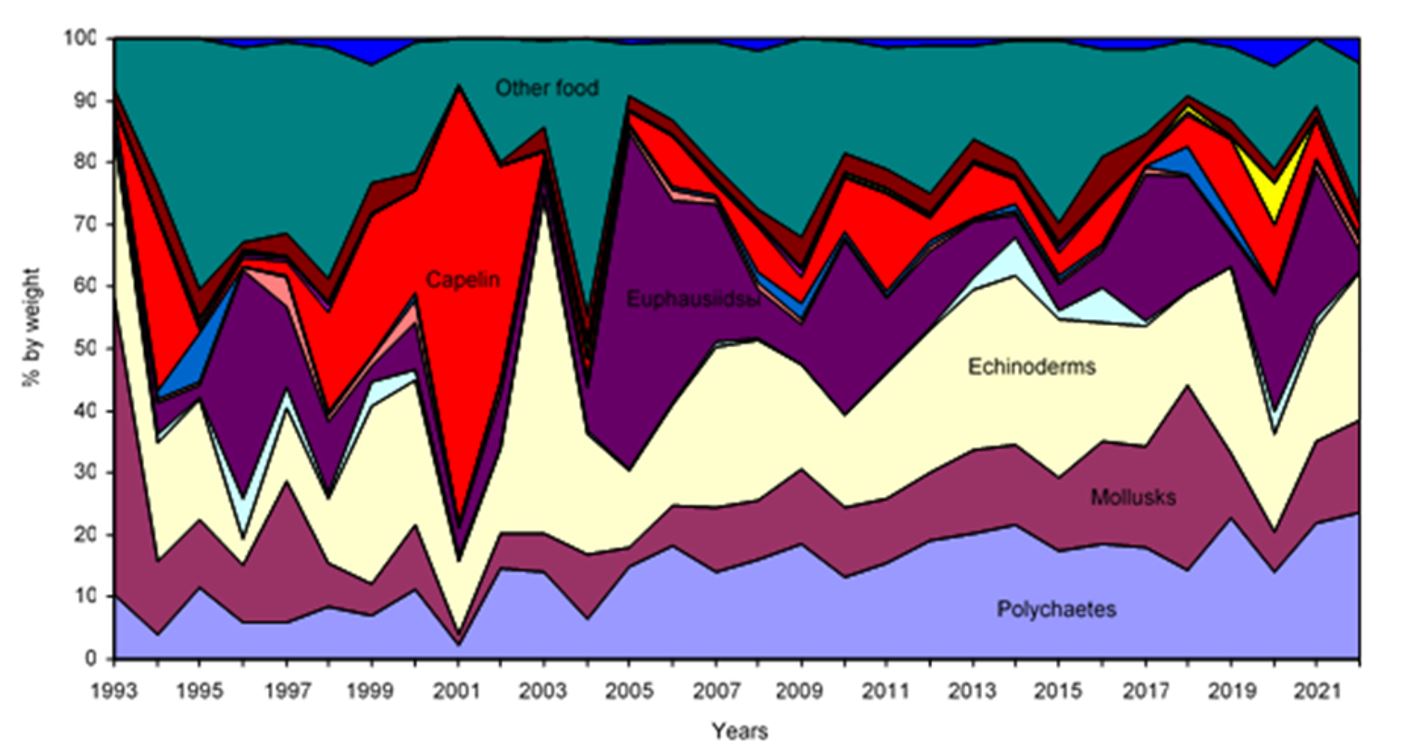
Cod is a main predator in the Barents Sea. Its diet was relatively stable in recent years; capelin was the main prey. The diet composition of cod in 2022 was similar to that in 2021 (Fig. 2). However, it should be mentioned increased importance of polar cod (up to 12 % by weight), as well as red king crab (from approximately 1 % by weight in previous years to 3.2 % in 2022) and herring. Fig. 3 shows the consumption by cod in the period 1984-2022. Consumption of most prey decreased from 2021 to 2022 due to decrease in cod abundance. Figs 2 and 3 are calculated using the same data but somewhat different methodology (see e. g. ICES AFWG 2021).
Fig. 4 and 5 show the proportion of cod and haddock in the diet of cod. Predation of cod on juvenile cod and haddock was relatively low in recent years, in particular in 2020 when the low abundance of the 2019 and 2020 year-classes of cod and haddock resulted in low abundance of the youngest (ages 0 and 1) cod and haddock for cod as predator.
Individual growth of cod has increased somewhat in the last couple of years. Feeding conditions for cod are expected to be adequate in the near future, as the cod likely will be able to feed on other prey if the capelin stock decreases (see Gjøsæter et al. 2009 for a discussion of ecosystem effects of capelin collapses). Also, the cod stock is decreasing so there will be less competition for food.
The diet composition of haddock is presented in Fig. 6
Figure 2. Diet composition of cod in 1984-2022, % by weight (The state …, 2023).
Figure 3. Consumption of various prey items by cod in 1984-2022. Norwegian calculations.
Figure 4. Proportion of cod in cod diet by predator age group.
Figure 5. Proportion of haddock in cod diet by predator age group. Figure 6. Diet composition of haddock in 1993-2022, % by weight
Reference
Gjøsæter, H., Bogstad, B., and Tjelmeland, S. 2009. Ecosystem effects of three capelin stock collapses in the Barents Sea. In Haug, T., Røttingen, I., Gjøsæter, H., and Misund, O. A. (Guest Editors). 2009. Fifty Years of Norwegian-Russian Collaboration in Marine Research. Thematic issue No. 2, Marine Biology Research 5(1):40-53. Doi: 10.1080/17451000802454866
Ottersen, G., Bogstad, B., Yaragina, N. A., Stige, L. C., Vikebø, F., and Dalpadado, P. 2014. A review of early life history dynamics of Barents Sea cod (Gadus morhua). ICES Journal of Marine Science 71(8): 2064-2087.
The state of biological resources of the Barents, White and Kara Seas and the North Atlantic in 2023. Murmansk, PINRO 2023, 170 p.
van der Meeren, G. and Prozorkevitch, D. (eds.) 2023. Survey report from the joint Norwegian/Russian Ecosystem Survey in the Barents Sea and the adjacent waters August- December 2022. IMR/PINRO-report series x/2023 (in prep)
3 - Northeast Arctic Cod (Subareas 1 and 2)
3.1 - Status of the fisheries
3.1.1 - Historical development of the fisheries (Table 3.1)
From a level of about 900 000 t in the mid-1970s, total catch declined steadily to around 300 000 t in 1983—1985 (Table 3.1). Catches increased to above 500 000 t in 1987 before dropping to 212 000 t in 1990, the lowest level recorded in the post-war period. The catches increased rapidly from 1991 onwards, stabilized around 750 000 t in 1994—1997 but decreased to about 414 000 t in 2000. From 2000—2009, the reported catches were between 400 000 and 520 000 t, in addition there were unreported catches (see below). Catches have been above the long-term average since 2011 and have decreased from a peak of 986 000 tonnes in 2014 to 693 000 tonnes in 2019-2020 before increasing to 767 000 tonnes in 2021 and decreasing again to 719 000 tonnes in 2022. The fishery is conducted both with an international trawler fleet and with coastal vessels using traditional fishing gears. Quotas were introduced in 1978 for the trawler fleets and in 1989 for the coastal fleets. In addition to quotas, the fishery is regulated by a minimum catch size, a minimum mesh size in trawls and Danish seines, a maximum bycatch of undersized fish, closure of areas having high densities of juveniles and by seasonal and area restrictions.
The provisional catch of cod in Subarea 1 and divisions 2.a and 2.b for 2022 reported to the working group is 759 520 t (including both NEA cod and NCC catches).
The historical practice (considering catches between 62°N and 67°N for the whole year and catches between 67°N and 69°N for the second half of the year to be Norwegian coastal cod) has been used for estimating the Norwegian landings of Northeast Arctic cod up to and including 2011 (Table 3. 2 ). The catches of coastal cod subtracted from total cod catches in Subarea 1 and divisions 2.a and 2.b for the period 1960—2022 are given in Table 3.2. For 2012–2022 the Norwegian catches have been analysed by an ECA-version designed for simultaneously providing estimates of catch numbers-at-age for each of the two stocks.
Coastal cod catches in 2022 for the southern and northern area combined were 40 309 tonnes and this amount was as in previous years subtracted from the total cod catch north of 62° N to get the figure for NEA cod used in that assessment (Table 3.1 and 3.2).
The time series for coastal cod catches are now inconsistent with the coastal cod catches presented in ICES AFWG 2023 Chapter 2, as the coastal cod catch time series were revised at WKBarFar, but not the NEA cod time series. At WKBarFar, the proposal for revision of NEA cod catch data series was rejected, as Norwegian data for many years and age groups (especially ages 12+ in years prior to 2013) were changed considerably and the reason for this was not sufficiently explained. WKBarFar recommended that when the revision of the historical Norwegian catch data is ready it should be submitted to ICES for review, ideally by a review attached to the AFWG.
The catch by area is shown in Table 3.1, and further split into trawl and other gears in Table 3.3. The distribution of catches by areas and gears in 2022 was similar to 2021. The nominal landings by country are given in Table 3.4.
There is information on cod discards (see ICES AFWG 2021 section 0.4) but it was not included in the assessment because these data are fragmented and different estimates are in contradiction with each other. Moreover the level of discards is relatively small in the recent period and inclusion of these estimates in the assessment should not change our perception on NEA cod stock size.
In summer/autumn 2018, a Norwegian vessel caught 441 t of cod in the Jan Mayen EEZ, which is a part of ICES area 2a, mostly by long-line. Cod is known to occasionally occur in this area, but rarely in densities which are suitable for commercial fisheries. The cod caught in this area in 2018 was large (65-110 cm), and otolith readings and genetics both showed this cod to be a mix of Northeast Arctic and Icelandic cod. Norway did in 2019-2020 carry out an experimental long-line fishery during four different periods in each year in order to investigate further the occurrence of cod in this area in space and time as well as stock identity. A description of this fishery as well as a historic overview of cod observations around Jan Mayen is given in Bogstad (2023).
Quotas, catches and advice for the period 2019-2023 for cod in the Jan Mayen area are given in Table 3.1a. These catches are not included in the catch statistics for Northeast Arctic cod.
3.1.3 - Unreported catches of Northeast Arctic cod (Table 3.1)
In the years 2002—2008 certain quantities of unreported catches (IUU catches) have been added to the reported landings. More details on this issue are given in the Working group reports for that period.
There are no reliable data on level of IUU catches outside the periods 1990—1994 and 2002—2008, but it is believed that their level was not substantial enough to influence on historical stock assessment.
According to reports from the Norwegian-Russian analysis group on estimation of total catches the total catches of cod since 2009 were very close to officially reported landings.
3.1.4 - TACs and advised catches for 2022 and 2023
The Joint Norwegian-Russian Fisheries Commission (JNRFC) agreed on a cod TAC of 708 480 t for 2022, and in addition 21 000 t Norwegian coastal cod. The total reported catch of 759 520 t in 2022 was 30 040 t above the agreed TAC. Since 2015 JNRFC has decided that Norway and Russia can transfer to next year or borrow from last year 10% of the cod country’s quota. That may lead to some deviation between agreed TAC and reported catch. As an extraordinary measure due to expected underfishing of the TAC in 2021, JNRFC decided that it should be possible to transfer 15% of the TAC between 2021 and 2022, but for 2022-2023 the transfer was reset back to the agreed 10%.
The advice for 2023 given by JRN-AFWG in 2022 was 566 784 t based on the agreed harvest control rule. The quota established by JNRFC for 2023 was set equal to the advice. In addition, the TAC for Norwegian Coastal Cod was set to the same value for 2023 as for 2022: 21 000 t.
3.2 - Status of research
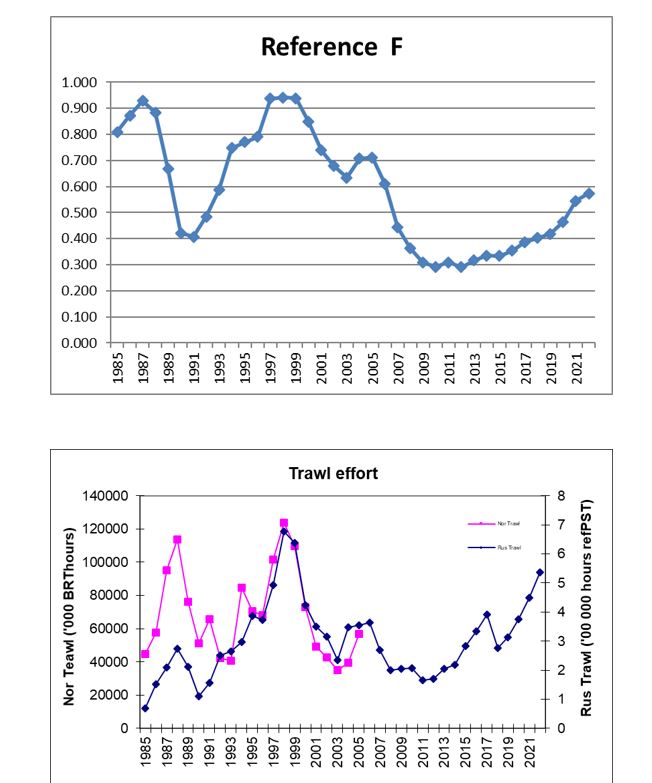
3.2.1 - Fishing effort and CPUE (Table A1, Figure 3.4-3.5)
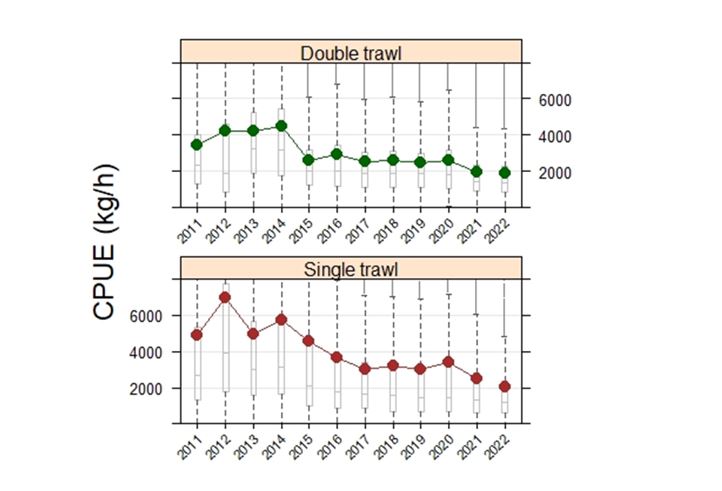
CPUE series of the Norwegian and Russian trawl fisheries are given in Table A1. The data reflect the total trawl effort (Figure 3.4), both for Norway and Russia. The Norwegian series is given as a total for all areas. Norwegian data for 2011–2022 are not necessarily compatible with data for 2007 and previous years. Norwegian CPUE declined from 2020 to 2022 and reached the lowest level in the 2011-2022 time series (Figure 3.5). Note that double trawl is now the dominant gear in the Norwegian trawl fishery (Nedreaas WD02), but trends are the same for single and double trawl. Russian CPUE was the lowest since 2008 in all areas and in area 2a it was the lowest since 1999.
3.2.2 - Survey results - abundance and size at age (Tables 3.5, A2-A14)
Joint Barents Sea winter survey (bottom trawl and acoustics) Acronyms: BS-NoRu-Q1 (BTr) and BS-NoRu-Q1 (Aco)
The survey was carried out as planned with relatively good spatial coverage, although bad weather and ice limited the coverage somewhat.
Before 2000 this survey was made without participation from Russian vessels, while in 2001—2005, 2008—2016 and 2018-2023 Russian vessels have covered important parts of the Russian zone. In 2006—2007 the survey was carried out only by Norwegian vessels. In 2007, 2016, and 2021-2023 the Norwegian vessels were not allowed to cover the Russian EEZ. The methods for adjustment for incomplete area coverage are described in detail in Fall et al. (2023) and references therein. Table 3.5 shows areas covered in the time-series and the additional areas implied in the method used to adjust for missing coverage in the Russian Economic Zone.
Regarding the older part of this time-series it should be noted that the survey prior to 1993 covered a smaller area (Jakobsen et al . 1997), and the number of young cod (particularly 1- and 2-year old fish) was probably underestimated. Changes in the survey methodology through time are described in Fall et al. 2023 (Appendix 2). Note that the change from 35 to 22 mm mesh size in the codend in 1994 is not corrected for in the time-series. This mainly affects the age 1 indices.
It is likely that in recent years the coverage in the February survey (BS-NoRu-Q1 (BTr) and BS-NoRu-Q1 (Aco)) has been incomplete, in particular for the younger ages. This could cause a bias in the assessment, but the magnitude is unknown. The 2014–2023 surveys covered considerably larger areas than earlier winter surveys, and showed that most age groups of cod (particularly ages 1 and 2) were distributed far outside the standard survey area. The bottom trawl survey estimates including the extended area for 2014-2023 were used in the tuning data separately from the same index before 2014, as decided at WkBarFar 2021.
Lofoten acoustic survey on spawners Acronym: Lof-Aco-Q1
The estimated abundance indices from the Norwegian acoustic survey off Lofoten and Vesterålen (the main spawning area for this stock) in March/April are given in Table A4. A description of the survey, sampling effort and details of the estimation procedure can be found in Korsbrekke (1997). The 2023 survey results in biomass terms was 128 thousand tonnes, this is 30 % below the 2022 level and the lowest since 2001.
A pilot survey on spawning grounds north of the area covered by the Lofoten survey was carried out in 2023 (Korsbrekke 2023 WD03), at about the same time and in the same way as the Lofoten survey. The total abundance in that area was about 16% of that in the Lofoten area. The area covered by this pilot survey is mostly covered also by the winter survey, but with much larger distance between transects at that time.
Russian autumn survey Acronym: RU-BTr-Q4
Abundance estimates from the Russian autumn survey (November-December) are given in Table A9 (acoustic estimates) and Table A10 (bottom trawl estimates). The entire bottom trawl time-series was in 2007 revised backwards to 1982 (Golovanov et al ., 2007, WD3), using the same method as in the revision presented in 2006, which went back to 1994. The new swept area indices reflect Northeast Arctic cod stock dynamics more precisely compared to the previous one - catch per hour trawling. The Russian autumn survey in 2006 was carried out with reduced area coverage. Divisions 2a and 2b were adequately investigated in the survey in contrast to Subarea 1, where the survey covered approximately 40% of the long-term average area coverage. The Subarea 1 survey indices were calculated based on actual covered area (40 541 sq. miles). The 2007 AFWG decided to use the “final" year class indices without any correction because of satisfactory internal correspondence between year class abundances at age 2—9 years according to the 2006 survey and ones due to the previous surveys.
This survey was not conducted in 2016 , but was carried out in 2017, when 79% of the standard survey area was covered (Sokolov et al 2018, WD 11). The index shows a reliable internal consistence and it was decided to use it in the assessment. This survey was not carried out in 2018-2022 and is discontinued.
Joint Ecosystem survey Acronym: Eco-NoRu-Q3 (Btr)
Swept area bottom trawl estimates from the joint Norwegian-Russian ecosystem survey in August-September for the period 2004–2022 are given in Table A14. This survey normally covers the entire distribution area of cod at that time of the year.
In 2014 this survey had an essential problem with area coverage in the north-west region because of difficult ice conditions. In the area covered by ice in 2014 a substantial part of population was distributed during 2013 survey. So, based on those observations AFWG decided in 2015 to exclude 2014 year from that tuning series in current assessment. In 2016 there was incomplete coverage in the international waters and close to the Murman coast. An adjustment for this incomplete coverage was made based on interpolation from adjacent areas (Kovalev et al 2017, WD 12). At this time of the year, usually a relatively small part of the cod stock is found in the area which was not covered in 2016. In 2017 and 2019 the coverage was close to complete, although the far northeastern part of the survey area (west of the north island of Novaya Zemlya) was not covered due to military restrictions. In 2018, a large area in the eastern part of the Barents Sea was not covered. Thus it was decided not to include 2018 data from this survey in the assessment.
The coverage in 2020 was less synoptic than usual, but it was decided to keep them in the assessment. The 2021 coverage was good, although as in several previous years, most of the international waters in the Barents Sea was not covered.
In 2022 the coverage of the Russian EEZ was done much later than the coverage of the Norwegian EEZ, with the entire survey period being from 15 August to 3 December (van der Meeren and Prozorkevitch, 2023). Also some areas were not covered. Indices based on the combined data have been calculated (Table A14), but due to the poor synopticity and incomplete coverage it was decided not to use this index in this year’s assessment.
The survey indices are calculated both the BioFox and StoX calculation methods, and as in earlier years, the Biofox series was used in the tuning. A research recommendation from WkBarFar was to unify these two methods for estimating indices from ecosystem survey. However, the benchmark decided to use weight at age from the StoX in calculations of weight at age used in the assessment.
Length-at-age is shown in Table A5 for the Joint survey in the Barents Sea in winter, in Table A7 for the Lofoten survey and in Table A11 for the Russian survey in October-December. Weight-at-age is shown in Table A6 for the Norwegian survey in the Barents Sea in winter, in Table A8 for the Lofoten survey, Table A12 for the Russian survey in October-December and Table A15 for the BESS survey (calculated using StoX). Table A16 presents combined data on Weight-at-age from winter survey and Lofoten survey.
Length and weight at age in the Joint winter survey in the Barents Sea was fairly stable from 2022 to 2023, with some increase noted for ages 4 and 7. Weight at age in the Lofoten survey increased from 2022 to 2023 for age groups 7 and decreased for ages 9 and 10. The size at age in the BESS survey increased from 2021 to 2022 for ages 3 and older, this could be partly related to the later timing of the survey.
3.2.3 - Age reading
The joint Norwegian-Russian work on cod otolith reading has continued, with regular exchanges of otoliths and age readers (see ICES AFWG 2021 chapter 0.7). The results of fifteen years of annual comparative age readings are described in Yaragina et al . (2009). Zuykova et al . (2009) re-read old otoliths and found no significant difference in contemporary and historical age determination and subsequent length at age. However, age at first maturation in the historical material as determined by contemporary readers is younger than that determined by historical readers. Taking this difference into account would thus have effect on the spawning stock-recruitment relationship and thus on the biological reference points. The overall percentage agreement for the 2017–2018 exchange was 87.7% (Zuykova et al. 2020 ) . The main reason for cod ageing discrepancies between Russian and Norwegian specialists remains the same, representing the latest summer growth zone, and different interpretations of the false zones. The general trend is that the Russian readers assign slightly lower ages than the Norwegian readers compared to the modal age for all age groups. This is opposite of what we have seen in previous readings, where the Russian readers has tended to be slightly overestimating the age compared to the Norwegian readers.
The trend with bias in NEA cod age determination registered for some years of the period 1992–2018 between experts of both countries is a solid argument to continue comparative cod age reading between PINRO and IMR to monitor the situation. The German participant has expressed an intention to join the age reading cooperation in future.
3.3 - Data available for use in assessment
Data for the period 1946–1983 are taken from the AFWG 2001 report (ICES CM 2001/ACFM:19) and were not revised at the WKBarFar benchmark in 2021.
3.3.1 - Catch-at-age (Table 3.6)
For 2022, age compositions from all areas were available from Norway, Russia, Spain and Germany.
There is still a concern about the biological sampling from parts of the Norwegian fishery that may be too low. Also the split between NEA cod and coastal cod may be affected by the sampling coverage. Data from Norwegian Coast Gard vessels’ length measurements onboard Russian vessels in some quarters of 2022 were used for calculation of age composition of Russian catches in Division 2b.
3.3.2 - Survey indexes available for use in assessment (Table 3.13, A13)
The following survey data series were available:
Fleetcode
Name
Place
Season
Age
Years
Fleet 15*
Joint bottom trawl survey
Barents Sea
Feb-Mar
3–12+
1981–2013, 2014-2023
Fleet 16
Joint acoustic survey
Barents Sea+Lofoten
Feb-Mar
3–12+
1985–2023
Fleet 18
Russian bottom trawl surv.
Barents Sea
Oct-Dec
3–12+
1982–2017
Fleet 007
Ecosystem surv.
Barents Sea
Aug-Sep
3–12+
2004–2021**
*Survey indices for Fleet 15 were divided by two series (before and after 2014) in model tuning as decided at WKBarFar 2021.
**2022 data not used in the assessment
The tuning fleet file is shown in Table 3.13. Note that the joint acoustic survey (sum of Barents Sea and Lofoten acoustic survey indices) is given in Table A13.
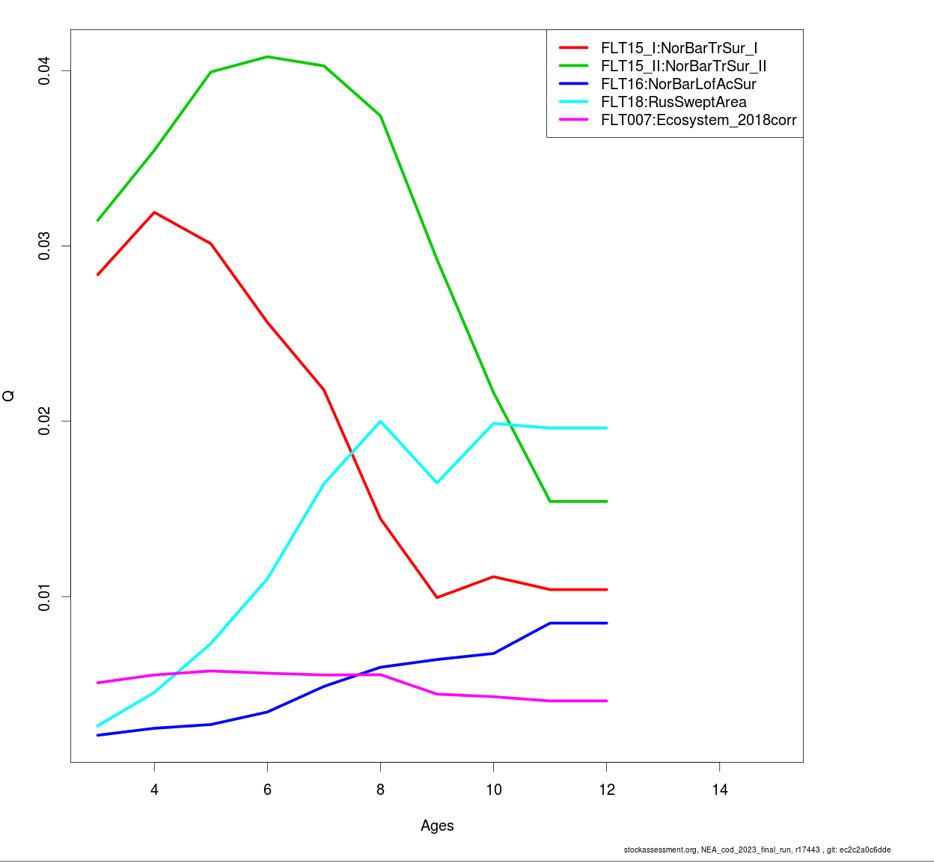
Survey indices for Fleet 15 have been multiplied by a factor 100, while survey indices for Fleets 007, 16 and 18 have been multiplied by a factor 10. This is done to keep the dynamics of the surveys even for very low indices, because some models (e.g. XSA) adds 1.0 to the indices before the logarithm is taken.
For 2022, weight-at-age in the catch for areas 1, 2a and 2b was provided by Norway, Russia, Spain and Germany (Table 3.7). For ages up to and including 11, observations are used. Following the WKBarFar 2021 decision, weight at age in catch for the years 1983-present for ages 12-15+ are calculated by a cohort-based von Bertalanffy approach used to replace previous fixed values.
Stock weights
For ages 1—11 stock weights-at-age at the start of year y (Wa,y ) for 1983—2023 are calculated combining, when available, weight at age from the Winter, Lofoten, Russian autumn and ecosystem surveys. The details are given in the Stock Annex. For ages 12-15+ a similar approach as for weight at age in the catch was used.
3.3.4 - Natural mortality including cannibalism (Table 3.12, Table 3.17)
A natural mortality (M) of 0.2 + cannibalism was used. Cannibalism is assumed to only affect natural mortality of ages 3-6.
2022 data are available and 2021 data have been updated.
The method used for calculation of the prey consumption by cod described by Bogstad and Mehl (1997) is used to calculate the consumption of cod by cod for use in cod stock assessment. The consumption is calculated based on cod stomach content data taken from the joint PINRO-IMR stomach content database (methods described in Mehl and Yaragina 1992). On average about 9000 cod stomachs from the Barents Sea have been analysed annually in the period 1984—2022.
These data are used to calculate the per capita consumption of cod by cod for each half-year (by prey age groups 0—6 and predator age groups 1–11+). It was assumed that the mature part of the cod stock is found outside the Barents Sea for three months during the first half of the year. Thus, consumption by cod in the spawning period was omitted from the calculations.
An iterative procedure was applied to include the per capita consumption data in the SAM run. It is described in detail in Stock Annex.
For the cod assessment data from annual sampling of cod stomachs has been used for estimating cannibalism, since the 1995 assessment. The argument has been raised that the uncertainty in such calculations are so large that they introduce too much noise in the assessment. A rather comprehensive analysis of the usefulness of this was presented in Appendix 1 in the 2004 AFWG report. The conclusion was that it improves the assessment.
The data on cod cannibalism for the historical period (1946—1983) was included in assessment during the benchmark to make the time-series consistent (ICES 2015, WKARCT 2015). These estimates were based on hindcasted values of NEA cod natural mortality at ages 3—5 using PINRO data base on food composition from cod stomach for the historical period (Yaragina et al . 2018).
It was noted that for 2022, the consumption estimates may somewat overestimate age 1 consumption and underestimate age 3+ consumption. This is due to lack of length measurements for stomachs which contained high cod weight, they likely represent large prey but have partly been allocated to small prey as length measurements were mostly available for stomachs containing low weight of cod.
3.3.5 - Maturity-at-age (Tables 3.10-3.11)
Historical (pre–1982) Norwegian and Russian time-series on maturity ogives were reconstructed by the 2001 AFWG meeting (ICES CM 2001/ACFM:19). The Norwegian maturity ogives were constructed using the Gulland method for individual cohorts, based on information on age at first spawning from otoliths. For the time period 1946—1958 only the Norwegian data were available. The Russian proportions mature-at-age, based on visual examinations of gonads, were available from 1959.
Since 1982 Russian and Norwegian survey data have been used (Table 3.10). For the years 1985—2023, Norwegian maturity-at-age ogives have been obtained by combining the Barents Sea winter survey and the Lofoten survey. Russian maturity ogives from the autumn survey as well as from commercial fishery for November-February are available from 1984 until present. The Norwegian maturity ogives tend to give a higher percent mature-at-age compared to the Russian ogives, which is consistent with the generally higher growth rates observed in cod sampled by the Norwegian surveys. The percent mature-at-age for the Russian and Norwegian surveys have been arithmetically averaged for all years, except 1982—1983 when only Norwegian observations were used and 1984 when only Russian observations were used.
Russian data for the autumn survey for 2018 and later years were not available as the survey was not conducted. In WD1 5 , 2019, updated correction factors to allow for this when calculating the combined maturity-at-age in 2019 were calculated, based on historical differences between Norwegian and Russian data. These correction factors were then applied to the Norwegian data for 2020-2023.
The approach used for calculating maturity at age is the same as previously used and consistent with the approach used to estimate the weight-at-age in the stock, except that no data from the BESS survey are used. However, since survey data, both abundance indices and proportion mature, have been revised, the entire time series of ogives back to 1994 was revised at the benchmark. The proportions of mature cod for age 13–15 are set to 1 for the period 1984–present.
Maturity-at-age for cod has been variable the last years, particularly for ages 6–9. According to the combined data, maturity at age increased from 2022 to 2023 for age groups 7-9 (Table 3.11).
3.4 - Assessment using SAM
3.4.1 - SAM settings (Table 3.14)
The SAM model settings optimised by WKBarFar are shown in Table 3.14.
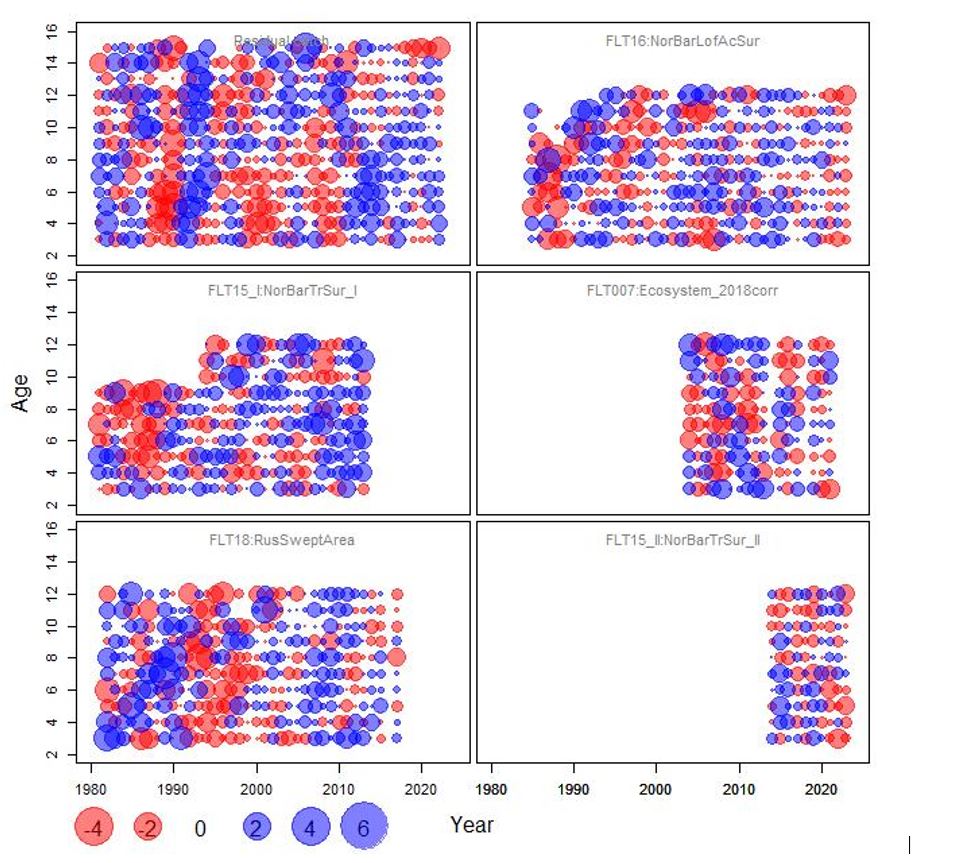
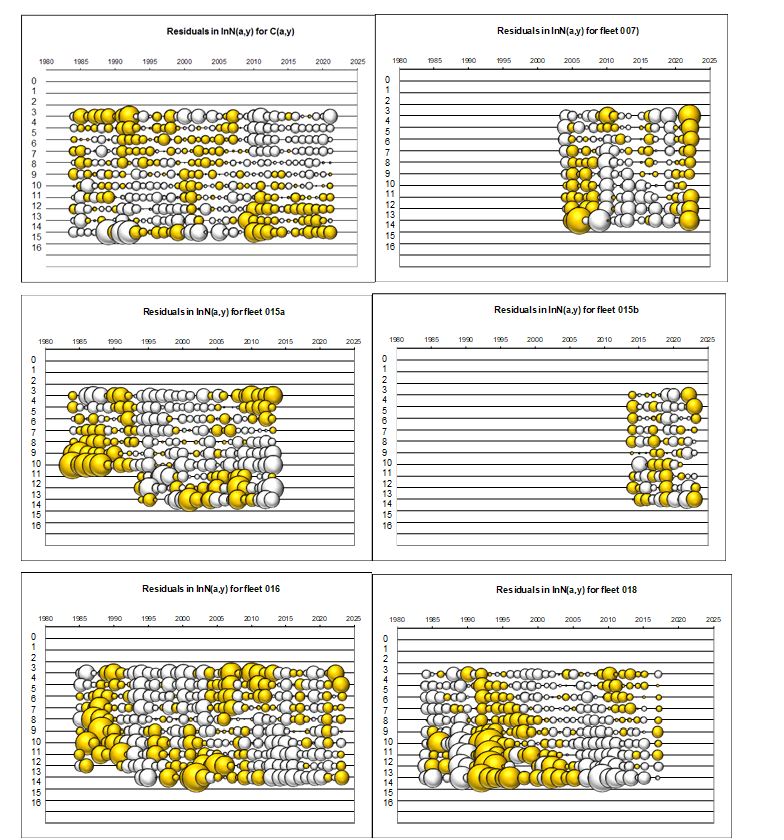
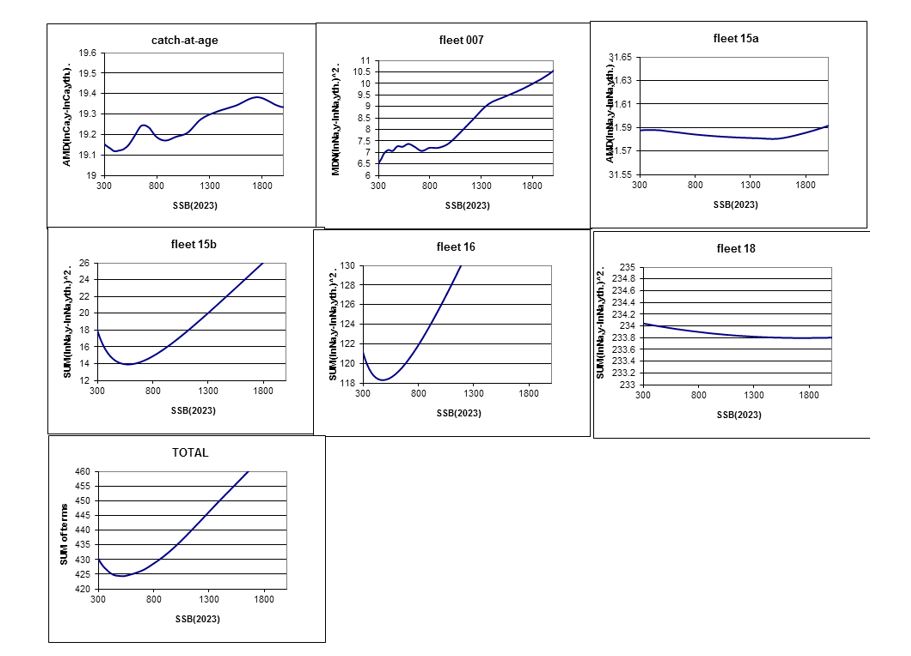
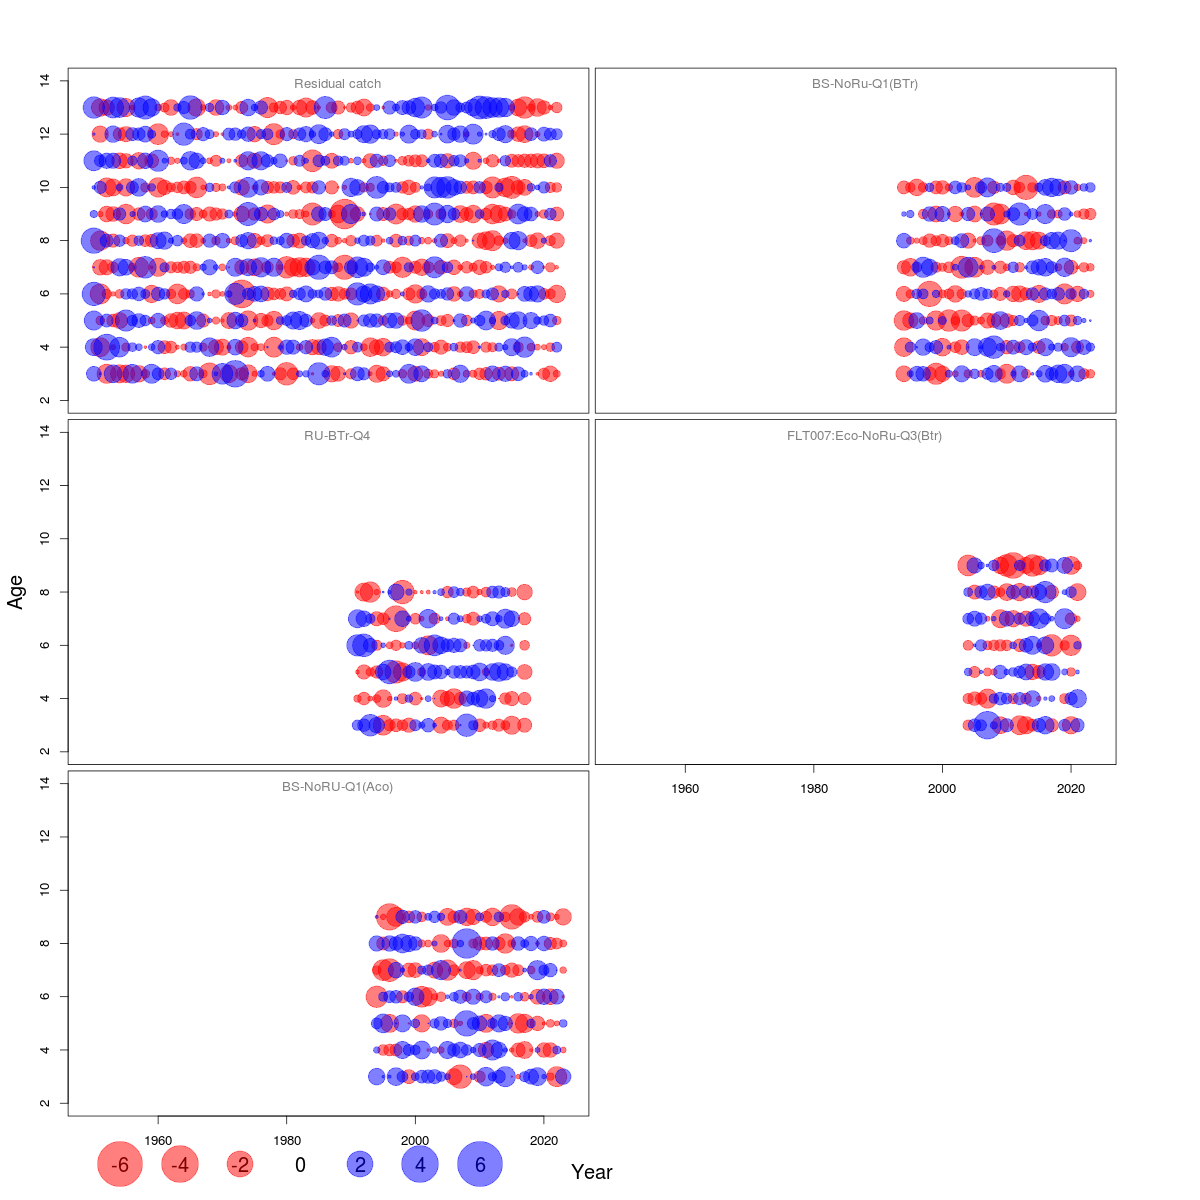
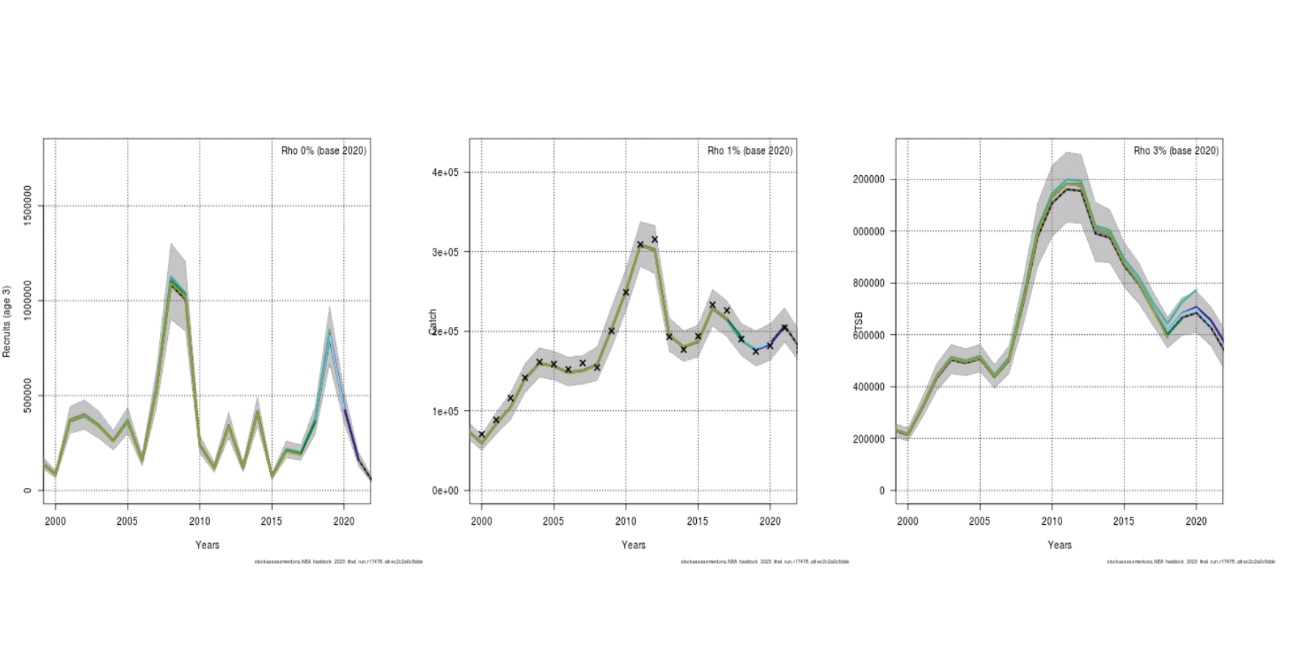
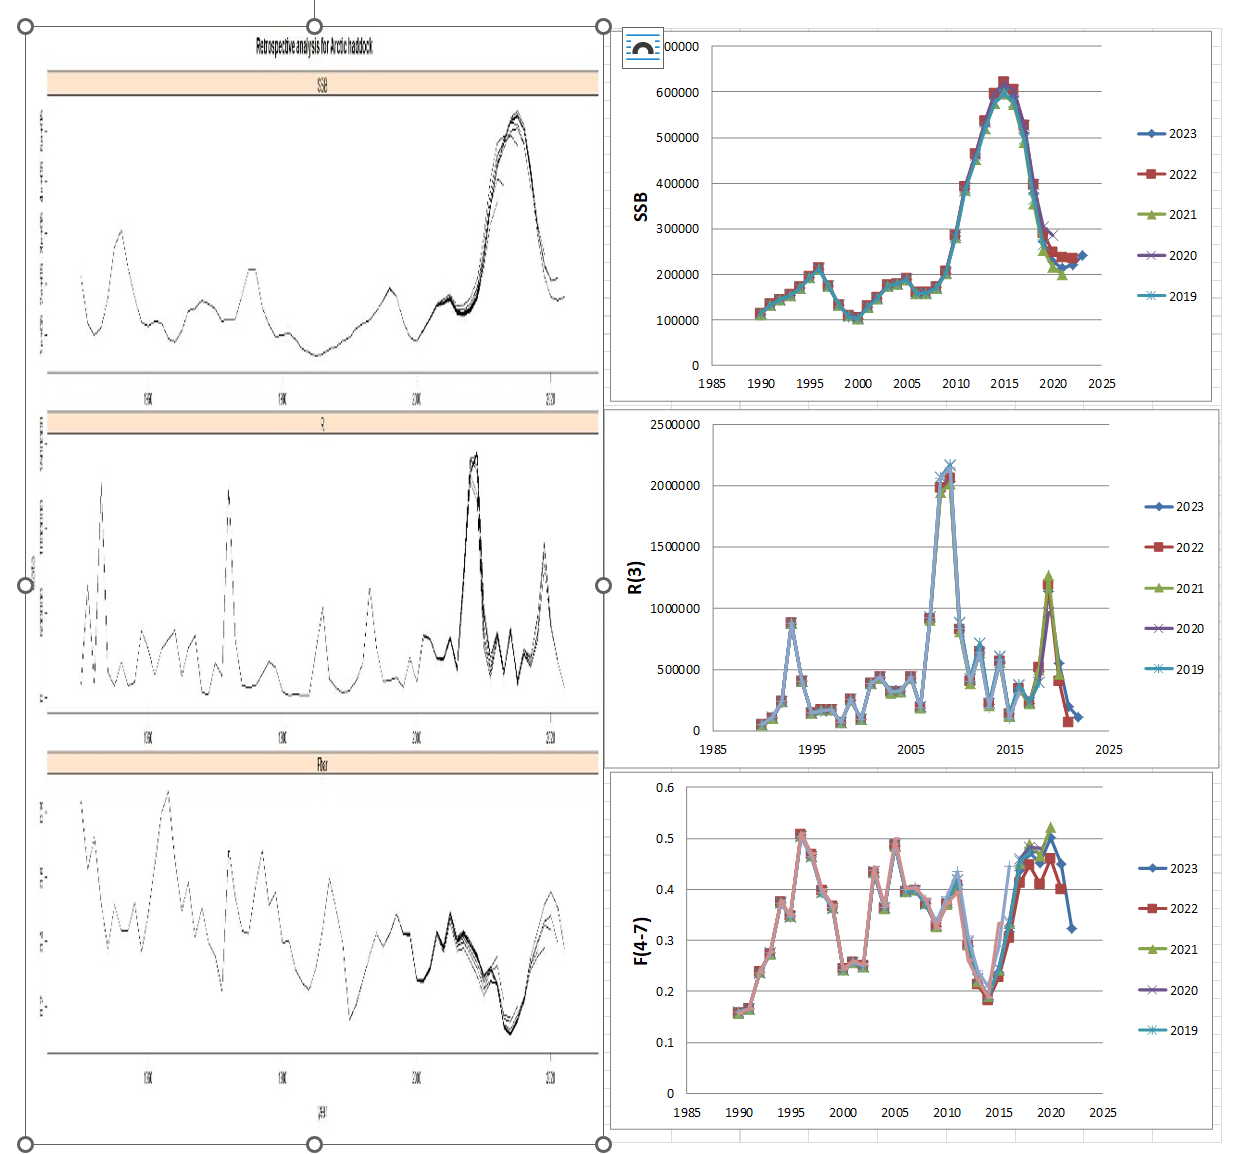
3.4.2 - SAM diagnostics (Figure 3.2 a-e)
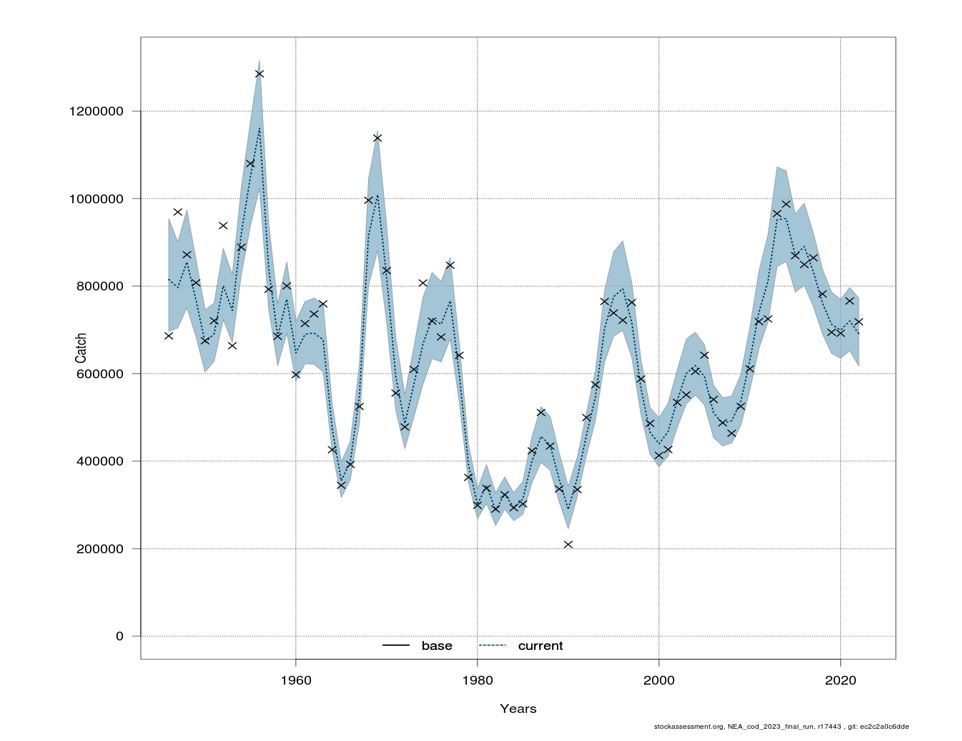
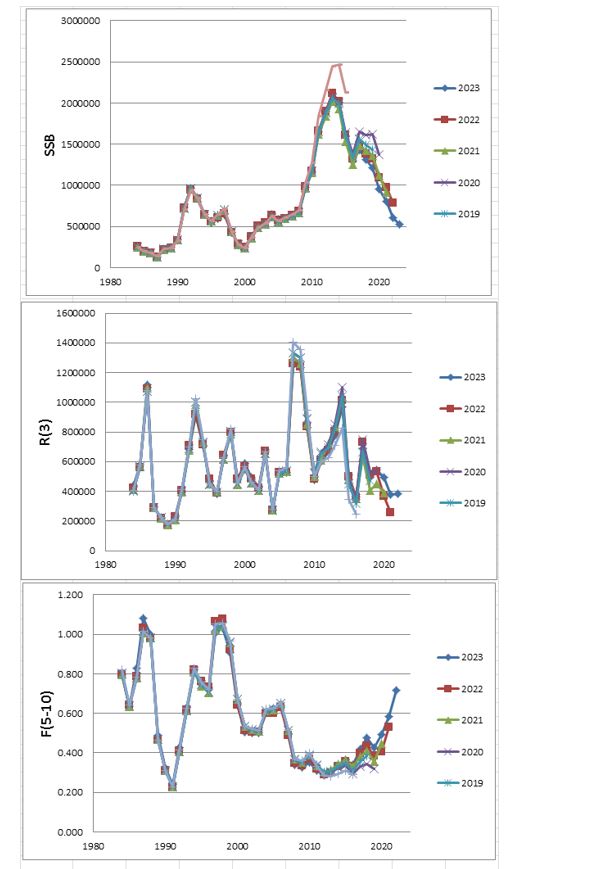
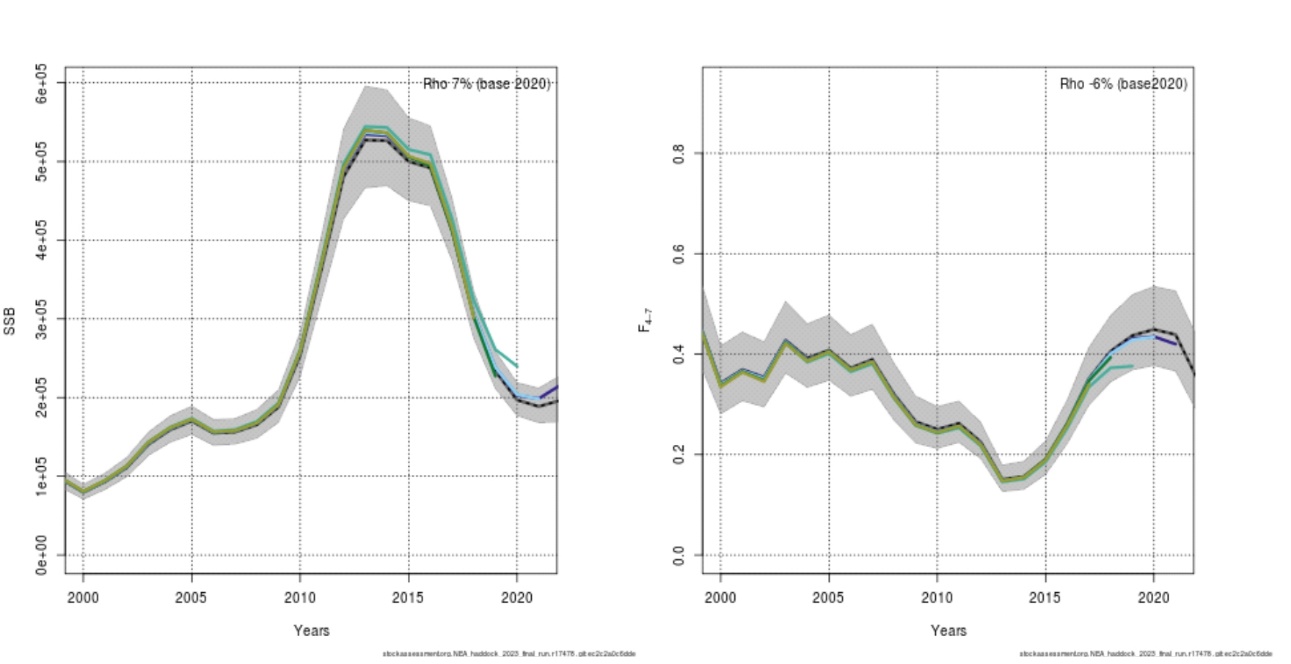
Residuals for the SAM run are shown in Figure 3.2a, while model retrospective plots of F, SSB and recruitment are shown in Figure 3.2b. Historical retrospective pattern for final SAM run are shown in Figure 3.2c. Figure 3.2d compares observed and modelled catches in tonnes and Figure 3.2e shows the catchability by survey and age group.
The retrospective pattern is generally good (Figure 3.2b), with absolute values of Mohn’s rho < 10% for SSB, R and F.
The observed catch in tonnes in 2021 and 2022 is higher than modelled, and for 2021 just inside the confidence interval.
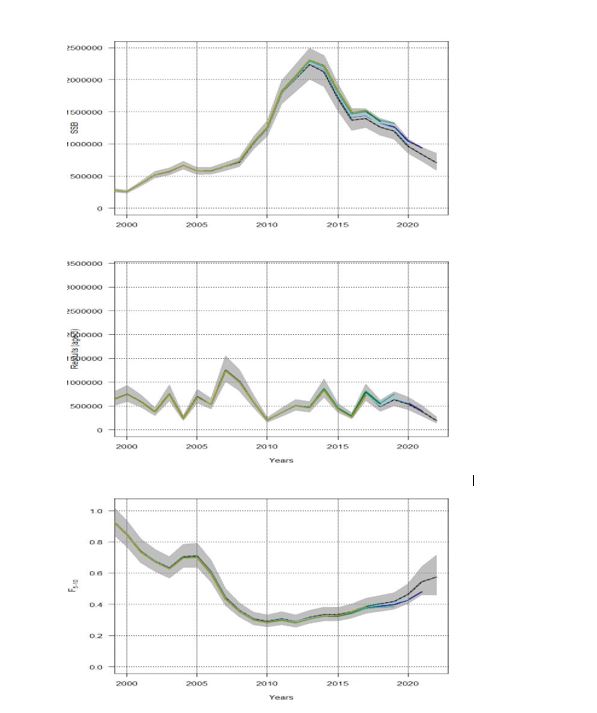
3.4.3 - Results of assessment (Tables 3.15-3.18, Figure 3.1)
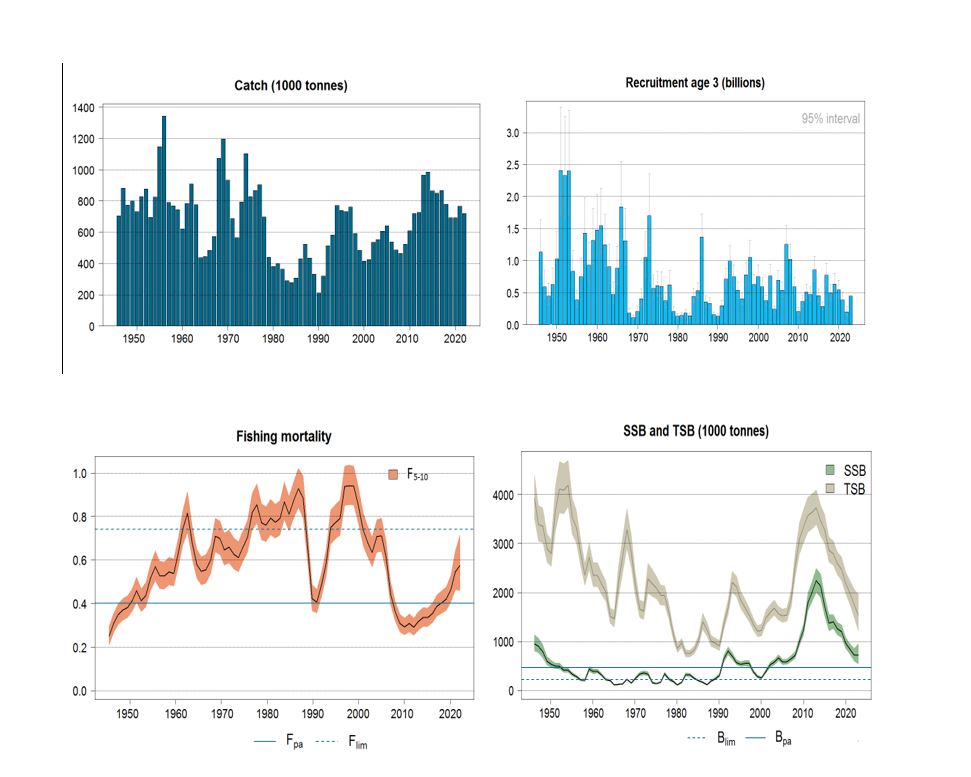
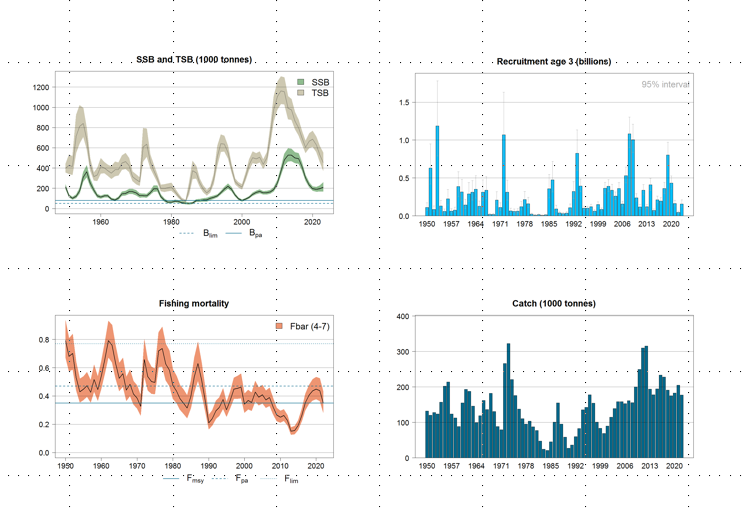
Summaries of landings, fishing mortality, stock biomass, spawning stock biomass and recruitment since 1946 are given in Table 3.18 and Figure 3.1.
The fishing mortalities and population numbers are given in Tables 3.15 and 3.16.
The estimated F5-10 in 2022 is 0.574, which is above Fpa and within the Fmsy range (Table 3.18). Fishing mortality has been increasing steadily in recent years. The spawning stock biomass in 2023 is estimated to be 719 kt (Table 3.20), which is high but much lower than the peak in 2013 (2,239 kt). One should bear in mind that in the early part of the time-series (before the 1980s) the fraction at age of mature fish was considerably lower.
Total stock biomass in 2023 is estimated to 1,610 kt, which is somewhat below the long-term mean and well below the highest level observed after 1955 (3,728 kt in 2013).
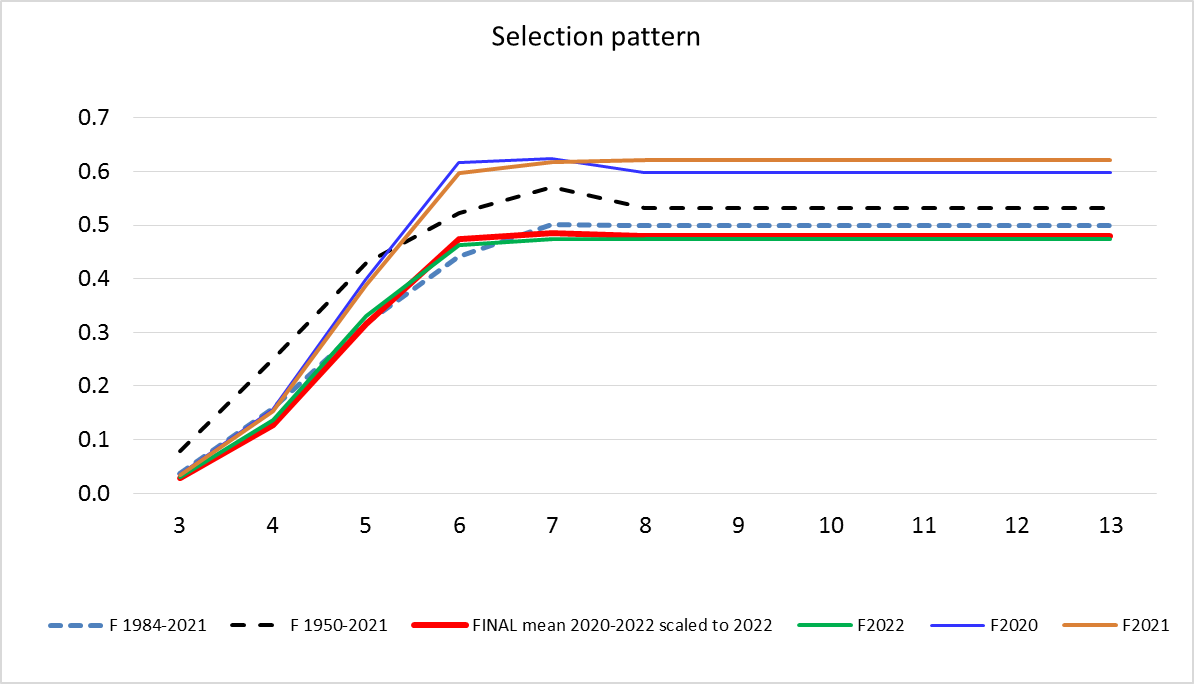
It is noted that the exploitation pattern is still dome-shaped with a marked decrease in selectivity above age 12, although the dome-shape is not as strong than in assessments made before the 2021 benchmark.
M values (M = 0.2+cannibalism mortality) are given in Table 3.17. For ages 3—5 the M matrix in 1946—1983 also includes cannibalism mortality since the benchmark meeting in 2015 (WKARCT 2015).
3.5 - Reference points and harvest control rules
The current reference points for Northeast Arctic cod were estimated by SGBRP (ICES CM 2003/ACFM:11) and adopted by ACFM at the May 2003 meeting.
At the 46th session of JRNFC a new version of the management rule was adopted (see section 3.7.3) . The TAC advice for 2024 is based on the agreed harvest control rule.
3.5.1 - Biomass reference points
The values adopted by ACFM in 2003 are Blim = 220 000 t, Bpa = 460 000 t. (ICES CM 2003/ACFM:11).
3.5.2 - Fishing mortality reference points
The values adopted by ACFM in 2003 are Flim = 0.74 and Fpa = 0.40 (ICES CM 2003/ACFM:11). The Fmsy for NEA cod was estimated by WKBaRFar 2021 to be in the range 0.40 - 0.60.
3.5.3 - Harvest control rule
The history of how the harvest control rule has developed is given in the 2017 AFWG report. JNRFC in 2015 asked ICES to explore the consequences of 10 different harvest control rules. This was done by WKNEAMP (ICES 2015, 2016). JNRFC in 2016 adopted one of the rules explored by WKNEAMP (Rule 6 in that report).
The current rule reads as follows:
The TAC is calculated as the average catch predicted for the coming 3 years using the target level of exploitation (Ftr).
The target level of exploitation is calculated according to the spawning stock biomass (SSB) in the first year of the forecast as follows:
If the spawning stock biomass in the present year, the previous year and each of the three years of prediction is above Bpa, the TAC should not be changed by more than +/- 20% compared with the previous year’s TAC. In this case, Ftr should however not be below 0.30.
3.6 - Prediction
3.6.1 - Prediction input (Tables 3.19a)
The input data to the short-term prediction with management option table (2023—2026) are given in Table 3.19a. For 2023 stock weights and maturity were calculated from surveys as described in Sections 3.3.2 and 3.3.4.
Catch weights in 2023 onwards and stock weights in 2024 and onwards for age 3–11 are predicted by the method described by Brander (2002), where the latest observation of weights by cohort are used together with average annual increments to predict the weight of the cohort the following year. The method is given by the equation
W(a+1,y+1)=W(a,y) + Incr(a), where Incr(a) is a “medium term” average of Incr(a,y)= W(a+1,y+1)-W(a,y)
This method was introduced in the cod prediction in the 2003 working group. Since 2005 working group an average of the 3 most recent values of annual increments have been used for predicting stock weights. For catch weights the last 5-year period for averaging the increments is used (changed from 10-year period at the 2021 benchmark).
The maturity ogive for the years 2024—2026 was predicted by using the 2021-2023 average. The fishing pattern in 2023 and later years was set equal to the previous 3 years. The stock annex prescribes average over 5 years, but as there has been a clear shift in the fishing pattern in recent years towards exploiting younger fish, a 3-year average was considered to be more appropriate.
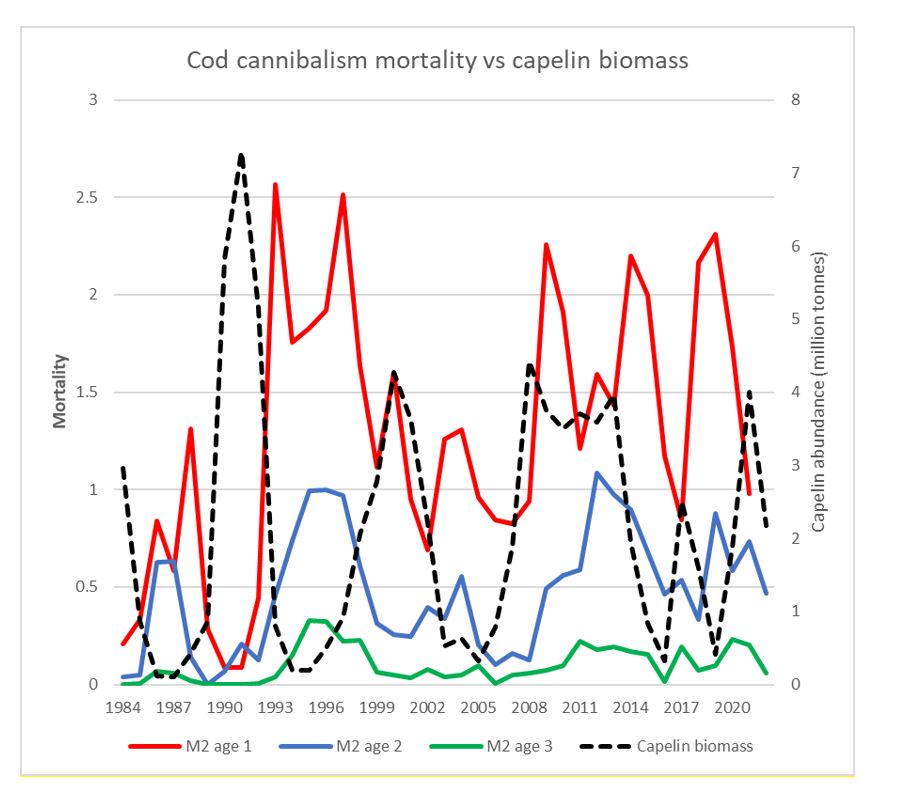
The stock number-at-age in 2023 was taken from the final SAM run (Table 3.16) for ages 4 and older. The recruitment at age 3 in the years 2023—2026 was estimated as described in section 3.7.2. Figure 3. 3 shows the development in natural mortality due to cannibalism for cod (prey) age groups 1-3 together with the abundance of capelin in the period 1984—2022. There was a decreasing trend in natural mortality, but the average M values for the last 3 years are used to predict natural mortality of age groups 3—6 for years 2023—2026 (based on benchmark decision, WKARCT 2015 and unchanged at WKBaRFar 2021). Predation mortalities in 2022 for age 3 and older could be somewhat underestimated as described in section 3.3.4.
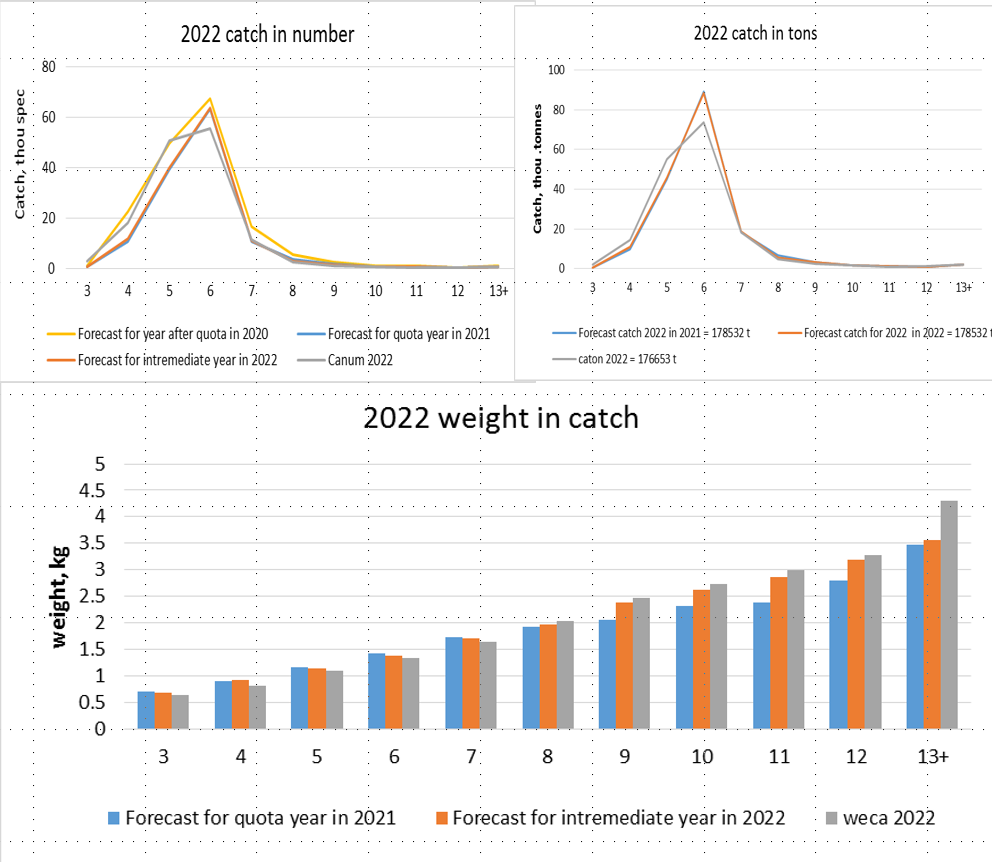
The assessment shows an increasing F from 2012 to 2022. In accordance with the benchmark decision (WKARCT 2015, not reviewed at WKBarFar 2021) and with support from AFWG-2019 WD 11 (Kovalev and Chetyrkin, 2019), the last year’s assessment F in terminal year 2022 (status quo) is used for F in the intermediate year (2023). Table 3.19 shows input data to the predictions. The results of prediction show that the catch in 2023 predicted using Fsq is very close to the agreed TAC.
3.6.2 - Recruitment prediction (Table 3.19b-d )
At the 2008 AFWG meeting it was decided to use a hybrid model, which is a weighted arithmetic mean of different recruitment models. It was agreed to use the same approach this year. The input data for those models are the following time-series; ice coverage, intensity of interaction between the arctic and boreal oceanic systems on the shelf of the Barents Sea, temperature and oxygen saturation at the Kola section. Input data to the prediction are presented in Tables 3.19b-c and prognosis from all the models, including the hybrid is presented in Table 3.19d. Since 2014 the hybrid model is based on objective weighting of different sub-models and includes the RCT3 model (see AFWG report 2021 section 1.4 for details). The numbers-at-age 3 calculated by the hybrid method were: 446 million for the 2020 year class, 209 million for the 2021 year class, 439 million for the 2022 year class and 400 million for the 2023 year class (Table 3.19d).
Although age 3 indices from the winter bottom trawl and acoustic surveys are now also included in the SAM tuning, it was decided at the benchmark to continue using in the predictions recruitment estimates at age 3 in the assessment year ( intermediate year in prediction) from the hybrid model. The difference between the SAM estimate and the hybrid model estimate of age 3 in 2023 was large (188 vs. 446 million individuals). Such a discrepancy was also observed in the 2022 assessment (189 vs. 476 million individuals for 2019 year class), and the SAM estimate for the 2019 year class at age 3 is practically unchanged this year (from 189 million in 2022 assessment to 197 million in this year’s assessment). It is also noted that the retrospective pattern for recruitment estimated by SAM in recent years is quite good as shown in Fig. 3.2b (Mohn’s rho 7%).
Despite these discrepancies between hybrid and SAM in recent years and the associated inconsistent historical retrospective pattern for recruitment (Fig 3.2c), it was decided to use the hybrid model also this year. One reason for this is that the predicted generally low recruitment level is in line with recent survey observations of trends year-class strength, although the recruitment values by year differ.
However, a review of the methodology for predicting recruitment should be carried out before next year’s working group and if possible an improved methodology should be proposed.
3.6.3 - Prediction results (Tables 3.20-3.21)
The catch corresponding to Fsq in 2023 is 573 kt (Table 3.20). The resulting SSB in 2024 is 588 kt, which is 18 % lower than the SSB in 2023. Table 3.20 shows the short-term consequences over a range of F-values in 2024. The detailed outputs corresponding to Fsq in 2023 and the F corresponding to the HCR and Fpa in 2024 is given in Table 3.21. Summarised results are shown in the text table below.
Since SSB in 2023 is between Bpa =460 000 t and 2 × Bpa = 920 000 t, F = 0.40 is used in the 3-year prediction, giving catches of 357 377, 354 196 and 355 390 tonnes in 2024, 2025 and 2026, respectively. The average of this is 355 655 tonnes. According to the HCR the maximum year-to-year decrease in TAC is limited by 20 % which corresponds to a TAC of 453 427 tonnes for 2024. The HCR also says that SSB in the 3 preceding years (2024-2026) should be above Bpa for the 20% limit to apply, and a prediction with F=0.40 gives a SSB in 2026 of 558 361 tonnes, which is above Bpa .
Cod in ICES subareas 1 and 2. Annual catch options. All weights are in tonnes.
Basis
Total catch (202 4 )
Ftotal (202 4 )
SSB(202 5 )
% SSB change *
% TAC change **
% Advice change ***
ICES advice basis
Management plan^
453 427
0. 540
506 615
- 14
-20
-20
Other options
F = 0 .4****
357 377
0.40
586 401
0
-37
-37
F = 0
0
0
900 153
53
-100
-100
F = F202 2
475 016
0.574
489 013
-17
-16
-16
F pa
357 377
0.40
586 401
0
-37
-37
F lim
571 054
0.74
412 367
-30
1
1
Weights in tonnes.
^ 20 % decrease from TAC 2023
* SSB 2025 relative to SSB 2024.
** Catch 2024 relative to TAC 2023
*** Advice for 2024 relative to advice for 2023
**** F = 0.40 corresponds to the lower bound of the FMSY range (0.40-0.60).
This catch forecast covers all catches. It is then implied that all types of catches are to be counted against this TAC. It also means that if any overfishing is expected to take place, the above calculated TAC should be reduced by the expected amount of overfishing.
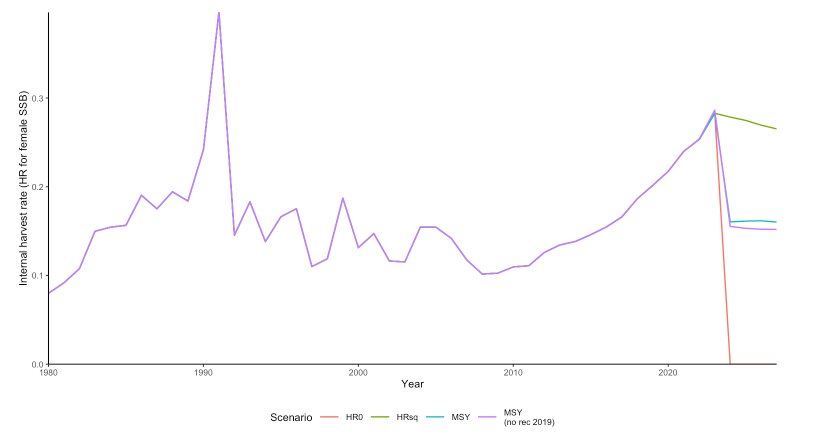
3.6.4 - Medium-term predictions ( Figure 3.8)
The inputs for medium-term prediction are the same as for short-term ones. For years after terminal year in short-term prediction the same value as for this year are used for all parameters except target fishing mortality which is according to the HCR.
The stock size has been decreasing in recent years due to low incoming recruitment, downward adjustment of the stock size (due to model modifications at the benchmark in 2021) and increasing fishing mortality. The increase in fishing mortality is partly due to the 20% limit on annual reduction of TAC and 10-15 % transferring of quotas between years. Recruitment in coming years (2021-2024 year classes) is also estimated to be below average. The reason for low recent recruitment is not known. Previous periods of low recruitment have mainly occurred when temperature is below average, which is not the case at present.
The predictions for 2025 and following years indicate that a further 20% reduction in catch from 2024 to 2025 will be advised and then catches will stabilize around 350 000 tonnes and stock size will also stabilize around 1.3 million tonnes (Figure 3.8). However, SSB is now approaching Bpa , below which level recruitment may be impaired. Also, due to rather uncertain medium-term forecast in stock size, SSB might fall below Bpa in coming years in which case advice according to the agreed HCR will be further reduced and the 20 % stability constraint will no longer be applied.
3.7 - Comparison with last year’s assessment and prediction
3.7.1 - Comparison to 2022 assessment
The text table below compare this year’s estimates with the final 2022 JRN-AFWG estimates for numbers at age (millions), total biomass, spawning biomass (thousand tonnes) in 2022, as well as reference F for the year 2021.
*estimated by recruitment models **assuming Fsq
In the current assessment, the number at all ages was adjusted downwards compared to the 2022 JRN-AFWG assessment.
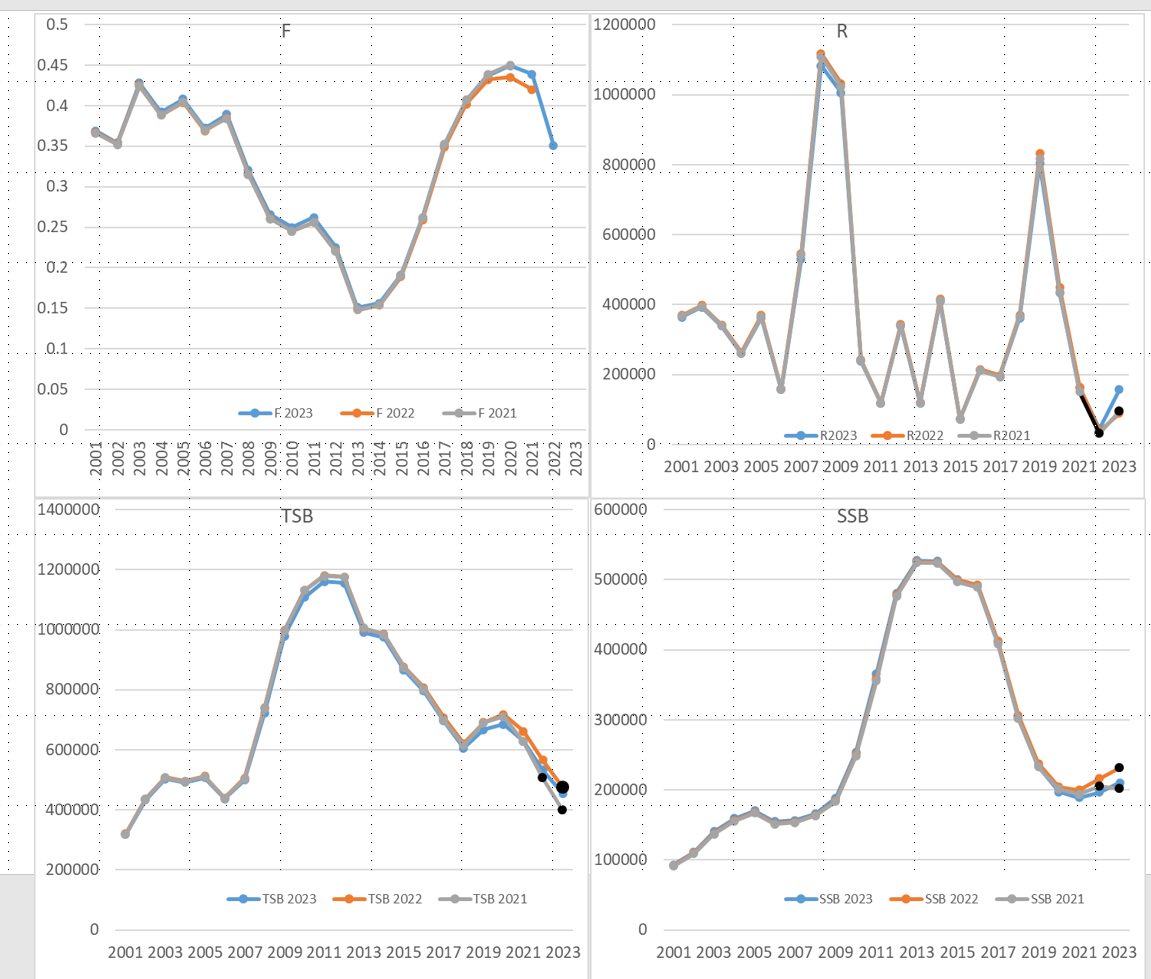
3.7.2 - Comparison to prediction
The change in the advice is large compared to last year. The advice for 2024 is 453 427 tonnes, while the advice for 2023 given by JRN-AFWG was 566 784 tonnes.
The 2023 assessment adjusted the stock size in recent years downwards. The main tendency for stock decrease in recent years was similar to last year’s assessment.
3.8 - Concerns with the assessment
The WG realizes that imprecise input data, in particular the catch-at-age matrix, and discontinuation of some surveys as well as incomplete spatial coverage and reduced synopticity in surveys could be a main obstacle to producing precise stock assessments, regardless of which model is used.
3.9 - Additional assessment methods
All models use the same tuning data.
3.9.1 - TISVPA (Tables 3.22-3.24, Figure 3.6a-c )
This year the TISVPA model was applied to NEA cod with the same settings as last year and using the same data as SAM except that natural mortality values from cannibalism were taken from the SAM runs. During WG the results of exploratory runs using the TISVPA model (Tables 3.22-3.24) were discussed. The residuals of the model approximation of catch-at-age and “fleets” data are presented in Figure 3.6a. Likelihood profiles for different data source are presented in Figure 3.6b. Retrospective run results are shown in Figure 3.6c.
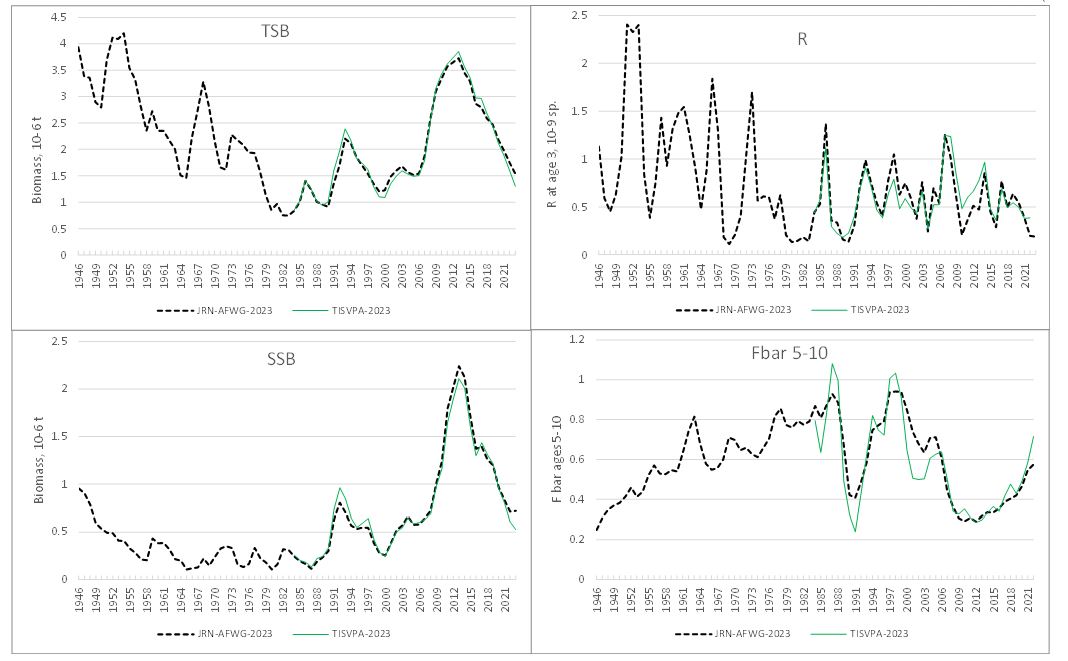
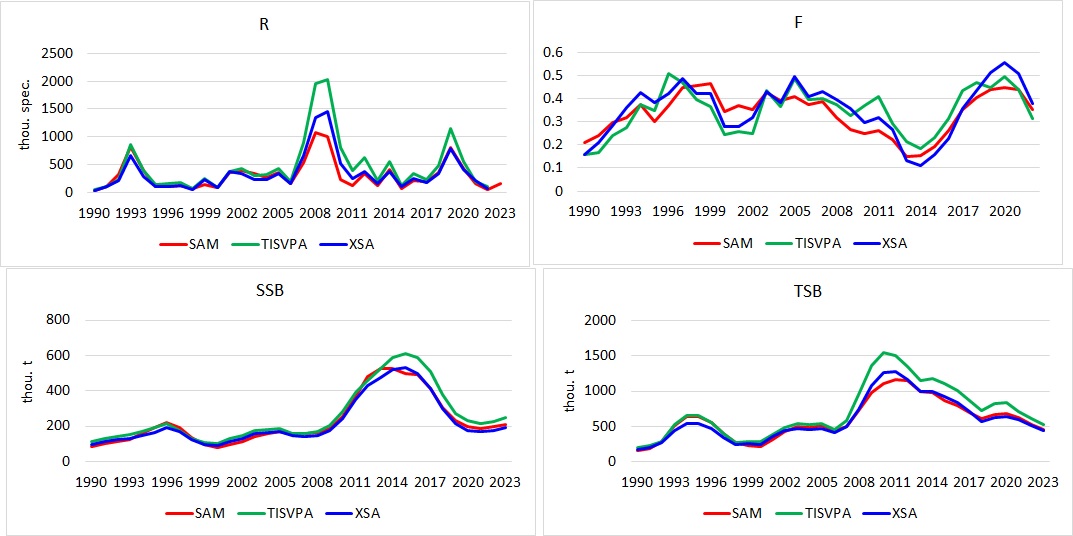
3.9.2 - Model comparisons ( Figures 3.2a, 3.6a, 3.7)
Figure 3.7 compares the results of SAM and TISVPA, showing F, SSB, TSB and recruitment. Trends are similar in all models, but TISVPA gives higher F in 2022 and lower biomass in 2023 than SAM. However, recruitment in 2022 is higher in TISVPA than in SAM. Both models show a reasonable retrospective pattern (F igures 3.2a, 3.6c).
3.10 - New and revised data sources
This section describes some data sources, which could be revised or included in the assessment in the future.
3.10.1 - Consistency between NEA cod and coastal cod catch data (Table 3.2)
Consistency between the catch data used for NEA cod and coastal cod should be ensured. The revised catch figures used in the coastal cod assessment do not correspond to the difference between the total cod catch and the catch used in the NEA cod assessment (Table 3.2). These discrepancies will be adjusted when the NEA cod catch series are revised (section 3.2.2).
3.10.2 - Discard and bycatch data
Work on updating discard and bycatch data series is ongoing. Revised bycatch estimates in numbers for the period 2005-2022 are shown in ICES AFWG-2023 Fig. 0.1. At WKARCT in 2015 it was, however, decided not to include those data in the catch-at-age matrix.
The bycatch mainly consists of age 1 and 2 fish, but the bycatch is generally small compared to other reported sources of mortality: catches, discards and the number of cod eaten by cod. From 1992 onwards, bycatches of age 3 and older fish are negligible, because use of sorting grids was made mandatory. However, in 1985, bycatches of age 5 and 6 cod were about one third of the reported catches for those age groups. The year class for which the bycatches were highest, was the 1983 year class (total bycatch of age 2 and older fish of about 60 million, compared to a stock estimate of about 1300 million at age 3.
3.11 - References
Anon. 2022. Report of the Joint Russian-Norwegian Working Group on Arctic Fisheries (JRN-AFWG) 2022. IMR-PINRO Report Series 6-2022, 213 pp.
Bogstad, B. and Mehl, S. 1997. Interactions Between Cod ( Gadus morhua ) and Its Prey Species in the Barents Sea. Forage Fishes in Marine Ecosystems. Proceedings of the International Symposium on the Role of Forage Fish-es in Marine Ecosystems. Alaska Sea Grant College Program Report No. 97-01: 591-615. University of Alaska Fairbanks.
Brander, K. 2002. Predicting weight at age. Internal ICES note to assessment working groups. 2003. Software implementation of process models. Working Document No. 2 to the Arctic Fisheries Working Group, San Sebastian, Spain, 23 April- 2 May 2003.
Fall, J., Wenneck, T. de Lange, Bogstad, B., Fuglebakk, E., Godiksen, J., Høines, Å., Korsbrekke, K., Skage, M. L., Staby, A., Tranang, C. Aa., Windsland, K., Russkikh, A. A., and Kharlin, S. 2023. Fish investigations in the Barents Sea winter 2022. IMR-PINRO Joint Report Series 1-2023, 100 pp.
Golovanov S.E., Sokolov A.M., and Yaragina, N.A. 2007. Revised indices of the Northeast Arctic cod abundance according to the 1982-2006 data from Russian trawl-acoustic survey (TAS). Working Document #3 for AFWG 2007.
ICES 2001. Report of the Arctic Fisheries Working Group. Bergen, Norway, 24 April – 3 May 2001. ICES CM 2001/ACFM:19. 380 pp.
ICES 2003. Study Group on Biological Reference Points for Northeast Arctic Cod. Svanhovd, Norway 13-17 January 2003. ICES CM 2003/ACFM:11.
ICES. 2015. Report of the Benchmark Workshop on Arctic Stocks (WKARCT), 26-30 January 2015, ICES Headquarters, Denmark. ICES CM 2015\ACOM:31. 126 pp.
ICES 2015. Report of the first Workshop on Management Plan Evaluation on Northeast Arctic cod and haddock and Barents Sea capelin ( WKNEAMP-1) , , . ICES CM 2015/ACOM:60, 27 pp.
ICES 2016. Report of the second Workshop on Management Plan Evaluation on Northeast Arctic cod and haddock and Barents Sea capelin (WKNEAMP-2) , 25-28 January 2016, Kirkenes, Norway. ICES CM 2016/ACOM:47, 76 pp.
ICES. 2021. Benchmark Workshop for Barents Sea and Faroese Stocks (WKBARFAR 2021). ICES Scientific Reports. 3:21. 205 pp. https://doi.org/10.17895/ices.pub.7920
ICES. 2023. Arctic Fisheries Working Group (AFWG). ICES Scientific Reports
Jakobsen, T., Korsbrekke, K., Mehl, S., and Nakken, O. 1997. Norwegian combined acoustic and bottom trawl surveys for demersal fish in the Barents Sea during winter. ICES CM 1997/Y:17.
Korsbrekke, K. 1997. Norwegian acoustic survey of Northeast Arctic cod on the spawning grounds off Lofoten. ICES C.M 1997/Y:18.
Korsbrekke, K. 2023. Some observations of Northeast Arctic cod spawning north of Lofoten Islands. WD 03, JRN-AFWG 2023.
Kovalev, Y., Prozorkevich, D., and Chetyrkin, A. 2017. Estimation of Ecosystem survey 2016 index in situation of not full area coverage. Working Document No. 12 to the Arctic Fisheries Working Group, Copenhagen, 18-25 April 2017.
Kovalev, Y., and Chetyrkin, A. 2019. What does NEA cod want for prediction - Fsq or TAC constrain? Working Document No. 11 to the Arctic Fisheries Working Group. ICES. 2019. Arctic Fisheries Working Group (AFWG). ICES Scientific Reports. 1:30. 934 pp.
Mehl, S., and Yaragina, N. A. 1992. Methods and results in the joint PINRO-IMR stomach sampling program. In: Bogstad, B. and Tjelmeland, S. (eds.), Interrelations between fish populations in the Barents Sea. Proceedings of the fifth PINRO-IMR Symposium. Murmansk, 12–16 August 1991. Institute of Marine Research, Bergen, Norway, 5–15.
Nedreaas, K. H. and Otterå, H. 2023. Effort and catch-per-unit-effort (CPUE) for Norwegian trawlers fishing cod north of 67˚N in 2011-2022
Sokolov A., Russkikh A., Kharlin S., Kovalev Yu. A., and Yaragina N.A. 2018. Results of the Russian trawl-acoustic survey on cod and haddock in the Barents Sea and adjacent waters in October-December 2017. Working Document no. 11. ICES Arctic Fisheries Working Group, ICES CM 2018/ACOM:06.
Thygesen, U. H., Albertsen, C. M., Berg, C. W., Kristensen, K., and Nielsen, A. 2017. Validation of ecological state space models using the Laplace approximation Environmental and Ecological Statistics 24 (2): 317-339.
van der Meeren, G. and Prozorkevitch, D. (eds.) 2023. Survey report from the joint Norwegian/Russian Ecosystem Survey in the Barents Sea and the adjacent waters August- December 2022 . IMR/PINRO-report series x/2023 (in prep.)
WD 15. 2019. Updated mean ratios between the combined and Norwegian data on weight at age and maturity at age in Northeast Arctic cod. Working document no 15, AFWG 2019.
Yaragina N.A. Nedreaas K.H., Koloskova V., Mjanger H., Senneset H., Zuykova N. and Ǻgotnes P. 2009. Fifteen years of annual Norwegian-Russian cod comparative age readings. Marine Biology Research 5(1): 54-65.
Yaragina N. A., Kovalev Yu. A., and Chetyrkin A. 2018. Extrapolating predation mortalities back in time: an example from North-east Arctic cod cannibalism, Marine Biology Research: https://doi.org/10.1080/17451000.2017.1396342
Zuykova N.V., Koloskova V.P., Mjanger H., Nedreaas K.H., Senneset H., Yaragina N.A., Ågotnes P., and Aanes S. 2009. Age determination of Northeast Arctic cod otoliths through 50 years of history. Marine Biology Research 5(1): 66-74.
Zuykova N.V., et al. 2020. Report on the meeting between Norwegian and Russian age reading specialists at Polar Branch of FSBSI “VNIRO” Murmansk, 20-24 May 2019. Working document no 8 in: ICES. 2020c.Arctic Fisheries Working Group (AFWG). ICES Scientific Reports. 2:52. 577 pp. http://doi.org/10.17895/ices.pub.6050.
Year
Subarea 1
Division 2.a
Division 2.b
Unreported catches
Total catch
1961
409 694
153 019
220 508
783 221
1962
548 621
139 848
220 797
909 266
1963
547 469
117 100
111 768
776 337
1964
206 883
104 698
126 114
437 695
1965
241 489
100 011
103 430
444 983
1966
292 253
134 805
56 653
483 711
1967
322 798
128 747
121 060
572 605
1968
642 452
162 472
269 254
1 074 084
1969
679 373
255 599
262 254
1 197 226
1970
603 855
243 835
85 556
933 246
1971
312 505
319 623
56 920
689 048
1972
197 015
335 257
32 982
565 254
1973
492 716
211 762
88 207
792 685
1974
723 489
124 214
254 730
1 102 433
1975
561 701
120 276
147 400
829 377
1976
526 685
237 245
103 533
867 463
1977
538 231
257 073
109 997
905 301
1978
418 265
263 157
17 293
698 715
1979
195 166
235 449
9 923
440 538
1980
168 671
199 313
12 450
380 434
1981
137 033
245 167
16 837
399 037
1982
96 576
236 125
31 029
363 730
1983
64 803
200 279
24 910
289 992
1984
54 317
197 573
25 761
277 651
1985
112 605
173 559
21 756
307 920
1986
157 631
202 688
69 794
430 113
1987
146 106
245 387
131 578
523 071
1988
166 649
209 930
58 360
434 939
1989
164 512
149 360
18 609
332 481
1990
62 272
99 465
25 263
25 000
212 000
1991
70 970
156 966
41 222
50 000
319 158
1992
124 219
172 532
86 483
130 000
513 234
1993
195 771
269 383
66 457
50 000
581 611
1994
353 425
306 417
86 244
25 000
771 086
1995
251 448
317 585
170 966
739 999
1996
278 364
297 237
156 627
732 228
1997
273 376
326 689
162 338
762 403
1998
250 815
257 398
84 411
592 624
1999
159 021
216 898
108 991
484 910
2000
137 197
204 167
73 506
414 870
2001
142 628
185 890
97 953
426 471
2002
184 789
189 013
71 242
90 000
535 045
2003
163 109
222 052
51 829
115 000
551 990
2004
177 888
219 261
92 296
117 000
606 445
2005
159 573
194 644
121 059
166 000
641 276
2006
159 851
204 603
104 743
67 100
537 642
2007
152 522
195 383
97 891
41 087
486 883
2008
144 905
203 244
101 022
15 000
464 171
2009
161 602
207 205
154 623
523 431
2010
183 988
271 337
154 657
609 983
2011
198 333
328 598
192 898
719 829
2012
247 938
331087
148 638
727 663
2013
360 673
421678
183 858
966 209
2014
320 347
468 934
197 168
986 449
2015
272405
375328
216651
864384
2016
321347
351468
176607
849422
2017
309902
360477
197898
868276
201 8
249397
321548
207681
778627
201 9
234985
318539
139084
692609
2020
234029
298707
160166
692903
2021
281198
268942
217144
767284
20221
236173
256394
226644
719211
Table 3.1. Northeast Arctic COD. Total catch (t) by fishing areas and unreported catch.
Data provided by Working Group members
1 Provisional figure
Year
Advice
TAC
CATCH
2018
-
-
441
2019
-
800
628
2020
-
800
522
2021
600
600
146
2022
347
347
276
2023
315
Table 3.1a Advice, quota and official Norwegian catches (tonnes) in the fishery zone around Jan Mayen (part of ICES area 2a).
Year
Norwegian catches of cod removed from the NEACcod-assessment
v1960–70
38.6
1971–79
no data
1980
40
1981
49
1982
42
1983
38
1984
33
1985
28
1986
26
1987
31
1988
22
1989
17
1990
24
1991
25
1992
35
1993
44
1994
48
1995
39
1996
32
1997
36
1998
29
1999
23
2000
19
2001
14
2002
20
2003
19
2004
14
2005
13
2006
15
2007
13
2008
13
2009
15
2010
13.5
2011
18.8
2012
35.5
2013
30.1
2014
33.6
2015
35.8
2016
54.9
2017
51.0
2018
36.3
2019
40.1
2020
45.3
2021
42.0
2022
40.3
Table 3.2. Catches of Norwegian Coastal Cod in subareas 1 and 2, 1000 tonnes, which are removed from the NEA cod assessment.
Subarea 1
Division 2.a
Division 2.b
Year
Trawl
Others
Trawl
Others
Trawl
Others
1967
238
84.8
38.7
90
121.1
-
1968
588.1
54.4
44.2
118.3
269.2
-
1969
633.5
45.9
119.7
135.9
262.3
-
1970
524.5
79.4
90.5
153.3
85.6
-
1971
253.1
59.4
74.5
245.1
56.9
-
1972
158.1
38.9
49.9
285.4
33
-
1973
459
33.7
39.4
172.4
88.2
-
1974
677
46.5
41
83.2
254.7
-
1975
526.3
35.4
33.7
86.6
147.4
-
1976
466.5
60.2
112.3
124.9
103.5
-
1977
471.5
66.7
100.9
156.2
110
-
1978
360.4
57.9
117
146.2
17.3
-
1979
161.5
33.7
114.9
120.5
8.1
-
1980
133.3
35.4
83.7
115.6
12.5
-
1981
91.5
45.1
77.2
167.9
17.2
-
1982
44.8
51.8
65.1
171
21
-
1983
36.6
28.2
56.6
143.7
24.9
-
1984
24.5
29.8
46.9
150.7
25.6
-
1985
72.4
40.2
60.7
112.8
21.5
-
1986
109.5
48.1
116.3
86.4
69.8
-
1987
126.3
19.8
167.9
77.5
129.9
1.7
1988
149.1
17.6
122
88
58.2
0.2
1989
144.4
19.5
68.9
81.2
19.1
0.1
1990
51.4
10.9
47.4
52.1
24.5
0.8
1991
58.9
12.1
73
84
40
1.2
1992
103.7
20.5
79.7
92.8
85.6
0.9
1993
165.1
30.7
155.5
113.9
66.3
0.2
1994
312.1
41.3
165.8
140.6
84.3
1.9
1995
218.1
33.3
174.3
143.3
160.3
10.7
1996
248.9
32.7
137.1
159
147.7
6.8
1997
235.6
37.7
150.5
176.2
154.7
7.6
1998
219.8
31
127
130.4
82.7
1.7
1999
133.3
25.7
101.9
115
107.2
1.8
2000
111.7
25.5
105.4
98.8
72.2
1.3
2001
119.1
23.5
83.1
102.8
95.4
2.5
2002
147.4
37.4
83.4
105.6
69.9
1.3
2003
146
17.1
107.8
114.2
50.1
1.8
2004
154.4
23.5
100.3
118.9
88.8
3.5
2005
132.4
27.2
87
107.7
115.4
5.6
2006
141.8
18.1
91.2
113.4
100.1
4.6
2007
129.6
22.9
84.8
110.6
91.6
6.3
2008
123.8
21.1
94.8
108.4
95.3
5.7
2009
130.1
31.5
102
105.2
142.1
11.4
2010
151.1
32.9
130
141.4
149.2
5.4
2011
158.1
38.4
163.5
167
181
11.9
2012
212.1
35.9
172.7
158.4
133.8
14.9
2013
308.5
52.2
216.9
204.7
159.7
24.1
2014
268.8
51.5
246.8
222.1
177.9
19.3
2015
224.3
48.1
192.2
183.2
197.7
19.0
2016
285.5
35.8
181.7
169.8
156.3
20.3
2017
265.4
44.5
189.5
171.0
180.0
17.9
201 8
204.7
44.7
156.7
164.9
192.0
15.6
201 9
199.4
35.6
177.8
140.7
128.9
10.1
2020
199.4
34.6
157.2
141.5
153.5
6.7
2021
220.8
60.4
120.2
148.7
202.1
15.1
2022
1
192.9
43.3
108.9
147.4
212.9
13.7
Table 3.3. Northeast Arctic COD. Total nominal catch ('000 t) by trawl and other gear for each
Data provided by Working Group members
1 Provisional figures
Year
Faroe Islands
France
German Dem.Rep.
Fed.Rep. Germany
Greenland
Iceland
Norway
Poland
United Kingdom
Russia**
Spain
Others
Total
1961
3934
13755
3921
8129
268377
-
158113
325780
1212
783221
1962
3109
20482
1532
6503
225615
-
175020
476760
245
909266
1963
-
18318
129
4223
205056
108
129779
417964
-
775577
1964
-
8634
297
3202
149878
-
94549
180550
585
437695
1965
-
526
91
3670
197085
-
89962
152780
816
444930
1966
-
2967
228
4284
203792
-
103012
169300
121
483704
1967
-
664
45
3632
218910
-
87008
262340
6
572605
1968
-
-
225
1073
255611
-
140387
676758
-
1074084
1969
29374
-
5907
5543
305241
7856
231066
612215
133
1197226
1970
26265
44245
12413
9451
377606
5153
181481
276632
-
933246
1971
5877
34772
4998
9726
407044
1512
80102
144802
215
689048
1972
1393
8915
1300
3405
394181
892
58382
96653
166
565287
1973
1916
17028
4684
16751
285184
843
78808
387196
276
792686
1974
5717
46028
4860
78507
287276
9898
90894
540801
38453
1102434
1975
11309
28734
9981
30037
277099
7435
101843
343580
19368
829377
1976
11511
20941
8946
24369
344502
6986
89061
343057
18090
867463
1977
9167
15414
3463
12763
388982
1084
86781
369876
17771
905301
1978
9092
9394
3029
5434
363088
566
35449
267138
5525
698715
1979
6320
3046
547
2513
294821
15
17991
105846
9439
440538
1980
9981
1705
233
1921
232242
3
10366
115194
8789
380434
1981
12825
3106
298
2228
277818
5262
83000
14500
-
399037
1982
11998
761
302
1717
287525
6601
40311
14515
-
363730
1983
11106
126
473
1243
234000
5840
22975
14229
-
289992
1984
10674
11
686
1010
230743
3663
22256
8608
-
277651
1985
13418
23
1019
4395
211065
3335
62489
7846
4330
307920
1986
18667
591
1543
10092
232096
7581
150541
5497
3505
430113
1987
15036
1
986
7035
268004
10957
202314
16223
2515
523071
1988
15329
2551
605
2803
223412
8107
169365
10905
1862
434939
1989
15625
3231
326
3291
158684
7056
134593
7802
1273
332481
1990
9584
592
169
1437
88737
3412
74609
7950
510
187000
1991
8981
975
2613
126226
3981
119427***
3677
3278
269158
1992
11663
2
3911
3337
168460
6120
182315
6217
1209
383234
1993
17435
3572
5887
5389
9374
221051
11336
244860
8800
3907
531611
1994
22826
1962
8283
6882
36737
318395
15579
291925
14929
28568
746086
1995
22262
4912
7428
7462
34214
319987
16329
296158
15505
15742
739999
1996
17758
5352
8326
6529
23005
319158
16061
305317
15871
14851
732228
1997
20076
5353
6680
6426
4200
357825
18066
313344
17130
13303
762403
1998
14290
1197
3841
6388
1423
284647
14294
244115
14212
8217
592624
1999
13700
2137
3019
4093
1985
223390
11315
210379
8994
5898
484910
2000
13350
2621
3513
5787
7562
192860
9165
166202
8695
5115
414870
2001
12500
2681
4524
5727
5917
188431
8698
183572
9196
5225
426471
2002
15693
2934
4517
6419
5975
202559
8977
184072
8414
5484
445045
2003
19427
2921
4732
7026
5963
191977
8711
182160
7924
6149
436990
2004
19226
3621
6187
8196
7201
212117
14004
201525
11285
6082
489445
2005
16273
3491
5848
8135
5874
207825
10744
200077
9349
7660
475276
2006
16327
4376
3837
8164
5972
201987
10594
203782
9219
6271
470527
2007
14788
3190
4619
5951
7316
199809
9298
186229
9496
5101
445796
2008
15812
3149
4955
5617
7535
196598
8287
190225
9658
7336
449171
2009
16905
3908
8585
4977
7380
224298
8632
229291
12013
7442
523431
2010
15977
4499
8442
6584
11299
264701
9091
267547
12657
9185
609983
2011
13429
1173
4621
7155
12734
331535
8210
310326
13291
17354^
719829
2012
17523
2841
8500
8520
9536
315739
11166
329943
12814
11081
727663
2013
13833
7858
8010
7885
14734
438734
12536
432314
15042
15263
966209
2014
33298
8149
6225
10864
18205
431846
14762
433479
16378
13243
986449
2015
26568
7480
6427
7055
16120
377983
11778
381778
19905
9880
864384
2016
24084
7946
6336
8607
16031
348949
13583
394107
14640
15139
849422
2017
28637
9554
5977
13638
11925
357419
16731
396180
14414
13802
868276
2018
26152
6605
9768
12743
10708
333539
11533
340364
13143
14071
778627
2019
22270
6371
8470
7553
12294
282120
11214
316813
13939
11565
692609
2020
21679
5796
9725
7391
9734
289472
12113
312683
11403
12908
692903
2021
21767
4459
6190
8246
8933
337931
5426
352064
11080
11188
767284^^
2022*
21530
4988
7134
7688
6214
310145
7024
333697
12214
8577
719211^^
Table 3.4. Northeast Arctic COD. Nominal catch(t) by countries. (Subarea 1 and divisions 2a and 2b combined, data provided by Working group members
* Provisional figures
** USSR prior to 1991.
*** Includes Baltic countries.
^ Includes unspecified EU catches.
^^ In 2022 and 2023 assessment and advice was carried out by the Joint Russian-Norwegian working group on Arctic Fisheries (JRN-AFWG) which compiled catches for 2021 and 2022 and gave advice for 2023 and 2024.
Year
Area covered
Additional area implied in adjustment
Adjustment method
1981-92
88.1
1993
137.6
1994
161.1
199 5
191.9
1996
166.1
1997
88.4
56.2
Index ratio by age
1998
100.4
51.1
Index ratio by age
1999
118.5
2000
163.2
2001
164.7
2002
157.4
2003
147.4
2004
164.4
2005
179.9
2006
170.1
18.1
Partly covered strata raised to full strata area
2007
123.9
56.7
Index ratio by age
2008
165.2
2009
171.8
2010
160.5
2011
174.3
2012
151.3
16.7
Index ratio by age
2013
20 3.6
2014
2 66.8
2015
243.3
2016
228.0
2017
184.4
37.5
Index ratio by age
2018
236.3
2019
241.2
2020
203.2
25.1
Index ratio by age
2021
232.0
10.9
Index ratio by age
2022
232.7
2023
253.3
Table 3.5. Barents Sea winter survey. Area covered (‘000 square nautical miles) and areas implied in the method used to adjust for missing coverage in Russian Economic Zone (REZ). “Index ratio by age” means that the index by age (for the area outside REZ) was scaled by the observed ratio between total index and the index outside REZ observed in the years prior to the survey.
Table 3.6. Northeast Arctic cod. Catch numbers-at-age (Thous) SAM Wed May 31 08:24:02 2023
Year_age
3
4
5
6
7
8
9
10
11
12
13
14
+gp
1946
4008
10387
18906
16596
13843
15370
59845
22618
10093
9573
5460
1927
750
1947
710
13192
43890
52017
45501
13075
19718
47678
31392
9348
9330
4622
4103
1948
140
3872
31054
55983
77375
21482
15237
9815
30041
7945
4491
3899
4205
1949
991
6808
35214
100497
83283
29727
13207
5606
8617
13154
3657
1895
2167
1950
1281
10954
29045
45233
62579
30037
19481
9172
6019
4133
6750
1662
1450
1951
24687
77924
64013
46867
37535
33673
23510
10589
4221
1288
1002
3322
611
1952
24099
120704
113203
73827
49389
20562
24367
15651
8327
3565
647
467
1044
1953
47413
107659
112040
55500
22742
16863
10559
10553
5637
1752
468
173
156
1954
11473
155171
146395
100751
40635
10713
11791
8557
6751
2370
896
268
123
1955
3902
37652
201834
161336
84031
30451
13713
9481
4140
2406
867
355
128
1956
10614
24172
129803
250472
86784
51091
14987
7465
3952
1655
1292
448
166
1957
17321
33931
27182
70702
87033
39213
17747
6219
3232
1220
347
299
173
1958
31219
133576
71051
40737
38380
35786
13338
10475
3289
1070
252
40
141
1959
32308
77942
148285
53480
18498
17735
23118
9483
3748
997
254
161
98
1960
37882
97865
64222
67425
23117
8429
7240
11675
4504
1843
354
102
226
1961
45478
132655
123458
51167
38740
17376
5791
6778
5560
1682
910
280
108
1962
42416
170566
167241
89460
28297
21996
7956
2728
2603
1647
392
280
103
1963
13196
106984
205549
95498
35518
16221
11894
3884
1021
1025
498
129
157
1964
5298
45912
97950
58575
19642
9162
6196
3553
783
172
387
264
131
1965
15725
25999
78299
68511
25444
8438
3569
1467
1161
131
61
79
197
1966
55937
55644
34676
42539
37169
18500
5077
1495
380
403
77
9
70
1967
34467
160048
69235
22061
26295
25139
11323
2329
687
316
225
40
14
1968
3709
174585
267961
107051
26701
16399
11597
3657
657
122
124
70
46
1969
2307
24545
238511
181239
79363
26989
13463
5092
1913
414
121
23
46
1970
7164
10792
25813
137829
96420
31920
8933
3249
1232
260
106
39
35
1971
7754
13739
11831
9527
59290
52003
12093
2434
762
418
149
42
25
1972
35536
45431
26832
12089
7918
34885
22315
4572
1215
353
315
121
40
1973
294262
131493
61000
20569
7248
8328
19130
4499
677
195
81
59
55
1974
91855
437377
203772
47006
12630
4370
2523
5607
2127
322
151
83
62
1975
45282
59798
226646
118567
29522
9353
2617
1555
1928
575
231
15
37
1976
85337
114341
79993
118236
47872
13962
4051
936
558
442
139
26
53
1977
39594
168609
136335
52925
61821
23338
5659
1521
610
271
122
92
54
1978
78822
45400
88495
56823
25407
31821
9408
1227
913
446
748
48
51
1979
8600
77484
43677
31943
16815
8274
10974
1785
427
103
59
38
45
1980
3911
17086
81986
40061
17664
7442
3508
3196
678
79
24
26
8
1981
3407
9466
20803
63433
21788
9933
4267
1311
882
109
37
3
1
1982
8948
20933
19345
28084
42496
8395
2878
708
271
260
27
5
5
1983
3108
19594
20473
17656
17004
18329
2545
646
229
74
58
20
5
1984
6942
14240
18807
20086
15145
8287
5988
783
232
153
49
12
8
1985
24634
45769
27806
19418
11369
3747
1557
768
137
36
31
32
8
1986
28968
70993
78672
25215
11711
4063
976
726
557
136
28
34
14
1987
13648
137106
98210
61407
13707
3866
910
455
187
227
21
59
20
1988
9828
22774
135347
54379
21015
3304
1236
519
106
69
43
14
5
1989
5085
17313
32165
81756
27854
5501
827
290
41
13
1
11
16
1990
1911
7551
12999
17827
30007
6810
828
179
59
15
6
5
2
1991
4963
10933
16467
20342
19479
25193
3888
428
48
12
1
1
2
1992
21835
36015
27494
23392
18351
13541
18321
2529
264
82
3
9
1
1993
10094
46182
63578
33623
14866
9449
6571
12593
1749
377
63
22
1
1994
6531
59444
102548
59766
32504
10019
6163
3671
7528
995
121
19
4
1995
4879
42587
115329
98485
32036
7334
3014
1725
1174
1920
222
41
1
1996
7655
28782
80711
100509
54590
10545
2023
930
462
230
809
84
1
1997
12827
36491
69633
83017
65768
28392
4651
1151
373
213
144
238
1
1998
31887
88874
48972
40493
34513
26354
6583
965
197
69
42
22
53
1999
7501
77714
92816
31139
15778
15851
8828
1837
195
40
34
8
30
2000
4701
33094
93044
47210
12671
6677
4787
1647
321
71
11
1
14
2001
5044
35019
62139
62456
22794
5266
1773
1163
343
85
6
7
22
2002
2348
31033
76175
67656
42122
11527
1801
529
223
120
21
9
6
2003
7263
20885
64447
71109
36706
14002
2887
492
142
97
21
43
1
2004
2090
38226
50826
68350
50838
18118
6239
1746
295
127
39
16
8
2005
5815
19768
113144
61665
44777
20553
6285
2348
562
100
21
24
7
2006
8548
47207
33625
78150
31770
15667
7245
1788
737
210
26
45
155
2007
25473
43817
62877
26303
34392
11240
4080
1381
505
285
44
13
35
2008
8459
51704
40656
35072
14037
20676
5503
1794
715
229
42
26
13
2009
4866
38711
83998
46639
20789
8417
8920
1957
872
987
76
21
20
2010
1778
16193
53855
75853
36797
17062
4784
4325
3034
913
189
49
35
2011
1418
8033
32472
70938
73875
21116
11708
5058
3237
600
434
12
0
2012
2695
10462
16646
40372
70014
48315
12326
5214
1926
1124
317
70
24
2013
2903
13659
22752
21020
54231
74451
47124
9143
2963
694
449
89
145
2014
5234
19226
38407
36633
29901
56109
47540
22738
3717
1169
313
210
157
2015
4315
31383
41181
51209
33745
22530
23609
24553
16071
2510
468
134
254
2016
2076
11291
50231
43609
35265
23417
14592
20105
15862
4781
871
249
308
2017
6535
13128
28365
66504
46136
28507
15307
10073
12169
6465
1927
399
285
2018
6120
28569
27128
33816
54328
28323
16208
9722
7132
3740
2295
840
271
2019
4389
21405
48422
29849
26548
39759
17395
8883
4606
2109
715
564
322
2020
3992
22446
37649
52454
31009
20904
23618
11768
6130
1572
591
310
278
2021
2983
17935
54005
59732
59136
22397
14744
13589
4919
1737
678
228
344
2022
5725
23486
53467
68112
47067
30569
11776
6046
3797
1489
575
164
107
Norway
Year
Age
2
3
4
5
6
7
8
9
10
11
12
13
14
15+
1983
0.41
0.82
1.32
2.05
2.82
3.94
5.53
7.70
9.17
11.46
16.59
16.42
16.96
24.46
1984
1.16
1.47
1.97
2.53
3.13
3.82
4.81
5.95
7.19
7.86
8.46
7.99
9.78
10.64
1985
0.34
0.99
1.43
2.14
3.27
4.68
6.05
7.73
9.86
11.87
14.16
14.17
13.52
15.33
1986
0.30
0.67
1.34
2.04
3.14
4.60
5.78
6.70
7.52
9.74
10.68
12.86
9.59
16.31
1987
0.24
0.48
0.88
1.66
2.72
4.35
6.21
8.78
9.78
12.50
13.75
15.12
10.43
19.95
1988
0.36
0.56
0.83
1.31
2.34
3.84
6.50
8.76
9.97
11.06
14.43
19.02
12.89
10.16
1989
0.53
0.75
0.90
1.17
1.95
3.20
4.88
7.82
9.40
11.52
11.47
19.47
14.68
1990
0.40
0.81
1.22
1.59
2.14
3.29
4.99
7.83
10.54
14.21
17.63
7.97
14.64
1991
0.63
1.37
1.77
2.31
3.01
3.68
4.63
6.06
8.98
12.89
17.00
14.17
16.63
1992
0.41
1.10
1.79
2.45
3.22
4.33
5.27
6.21
8.10
10.51
11.59
15.81
6.52
1993
0.30
0.83
1.70
2.41
3.35
4.27
5.45
6.28
7.10
7.82
10.10
16.03
19.51
17.68
1994
0.30
0.82
1.37
2.23
3.35
4.27
5.56
6.86
7.45
7.98
9.53
12.16
11.45
19.79
1995
0.44
0.78
1.26
1.87
2.80
4.12
5.15
5.96
7.90
8.67
9.20
11.53
17.77
21.11
1996
0.29
0.90
1.15
1.67
2.58
4.08
6.04
6.62
7.96
9.36
10.55
11.41
9.51
24.24
1997
0.35
0.78
1.14
1.56
2.25
3.48
5.35
7.38
7.55
8.30
11.15
8.64
12.80
1998
0.38
0.68
1.03
1.64
2.23
3.24
4.85
6.88
9.18
9.84
15.78
14.37
13.77
15.58
1999
0.46
0.88
1.16
1.65
2.40
3.12
4.26
6.00
6.52
10.64
14.05
12.67
9.20
17.22
2000
0.31
0.65
1.23
1.80
2.54
3.58
4.49
5.71
7.54
7.86
12.71
14.71
15.40
20.26
2001
0.30
0.77
1.18
1.83
2.75
3.64
4.88
5.93
7.43
8.90
10.22
11.11
13.03
18.85
2002
0.31
0.90
1.40
1.90
2.60
3.55
4.60
5.80
7.40
9.56
8.71
12.92
8.42
17.61
2003
0.55
0.88
1.39
2.01
2.63
3.59
4.83
5.57
7.262
9.36
9.52
9.52
10.68
21.66
2004
0.54
1.08
1.41
1.95
2.69
3.46
4.77
6.72
7.90
8.66
12.21
14.02
16.50
11.37
2005
0.58
0.92
1.38
1.86
2.61
3.54
4.57
6.41
8.24
9.89
11.04
14.08
11.81
20.08
2006
0.51
0.97
1.45
2.06
2.71
3.56
4.57
5.53
6.61
7.53
8.55
8.44
9.82
12.31
2007
0.53
1.07
1.70
2.37
3.26
4.36
5.45
6.71
8.08
8.56
9.75
11.72
12.72
15.58
2008
0.65
1.12
1.70
2.44
3.32
4.41
5.61
6.84
8.25
9.31
10.54
12.45
13.59
21.15
2009
0.56
0.98
1.47
2.10
2.83
3.90
5.06
5.76
7.31
7.79
7.81
10.68
11.83
14.76
2010
0.55
0.95
1.46
2.06
2.93
4.02
5.40
6.44
7.19
8.43
9.11
10.46
11.39
15.55
2011
0.53
1.09
1.50
2.06
2.85
3.70
5.01
6.26
7.33
8.34
9.87
13.23
2012
0.83
1.32
1.92
2.65
3.52
4.71
6.34
8.11
9.92
11.31
13.45
15.75
2013
0.43
0.95
1.40
2.00
2.64
3.44
4.51
5.67
7.29
8.80
10.33
11.38
12.56
2014
0.59
1.07
1.55
2.15
2.80
3.70
4.57
5.78
6.97
8.35
9.46
10.99
12.28
15.49
2015
0.64
0.96
1.42
1.96
2.57
3.30
4.13
5.49
6.46
7.18
8.63
10.37
12.24
14.60
2016
0.59
0.96
1.46
1.99
2.71
3.57
4.56
5.78
6.82
8.08
9.33
10.01
11.68
14.79
2017
0.55
0.99
1.53
2.06
2.69
3.64
4.72
5.91
6.91
7.88
9.41
10.93
11.78
15.07
2018
0.62
1.05
1.51
2.11
2.80
3.48
4.54
5.80
6.97
7.64
9.11
10.29
11.35
14.05
201 9
0.51
0.96
1.43
2.02
2.72
3.60
4.51
5.80
6.91
7.94
8.89
10.94
11.55
14.49
2020
0.58
0.94
1.42
2.01
2.66
3.50
4.59
5.77
7.03
8.46
9.78
10.97
12.74
16.08
2021
0.39
0.75
1.27
1.86
2.55
3.42
4.52
5.86
7.13
8.55
10.09
11.79
12.98
15.75
2022
0.32
0.71
1.15
1.73
2.42
3.36
4.47
5.79
7.18
8.65
10.09
11.45
12.93
16.43
Table 3.7. Northeast Arctic COD. Weights-at-age (kg) in landings from various countries
Russia (trawl only)
Year
Age
2
3
4
5
6
7
8
9
10
11
12
13
14
15+
1983
0.65
1.05
1.58
2.31
3.39
4.87
6.86
8.72
10.40
12.07
14.43
1984
0.53
0.88
1.45
2.22
3.21
4.73
6.05
8.43
10.34
12.61
14.95
1985
0.33
0.77
1.31
1.84
2.96
4.17
5.94
6.38
8.58
10.28
1986
0.29
0.61
1.14
1.75
2.45
4.17
6.18
8.04
9.48
11.33
12.35
14.13
1987
0.24
0.52
0.88
1.42
2.07
2.96
5.07
7.56
8.93
10.80
13.05
18.16
1988
0.27
0.49
0.88
1.32
2.06
3.02
4.40
6.91
9.15
11.65
12.53
14.68
1989
0.50
0.73
1.00
1.39
1.88
2.67
4.06
6.09
7.76
9.88
1990
0.45
0.83
1.21
1.70
2.27
3.16
4.35
6.25
8.73
10.85
13.52
1991
0.36
0.64
1.05
2.03
2.85
3.77
4.92
6.13
8.36
10.44
15.84
19.33
1992
0.55
1.20
1.44
2.07
3.04
4.24
5.14
5.97
7.25
9.28
11.36
1993
0.48
0.78
1.39
2.06
2.62
4.07
5.72
6.79
7.59
11.26
14.79
17.71
1994
0.41
0.81
1.24
1.80
2.55
2.88
4.96
6.91
8.12
10.28
12.42
16.93
1995
0.37
0.77
1.21
1.74
2.37
3.40
4.71
6.73
8.47
9.58
12.03
16.99
1996
0.30
0.64
1.09
1.60
2.37
3.42
5.30
7.86
8.86
10.87
11.80
1997
0.30
0.57
1.00
1.52
2.18
3.30
4.94
7.15
10.08
11.87
13.54
1998
0.33
0.68
1.06
1.60
2.34
3.39
5.03
6.89
10.76
12.39
13.61
14.72
1999
0.24
0.58
0.98
1.41
2.17
3.26
4.42
5.70
7.27
10.24
14.12
2000
0.18
0.48
0.85
1.44
2.16
3.12
4.44
5.79
7.49
9.66
10.36
2001
0.12
0.31
0.62
1.00
1.53
2.30
3.31
4.57
6.55
8.11
9.52
11.99
2002
0.20
0.60
1.05
1.46
2.14
3.27
4.47
6.23
8.37
10.06
12.37
2003
0.23
0.63
1.06
1.78
2.40
3.41
4.86
6.28
7.55
11.10
13.41
12.12
14.51
2004
0.30
0.57
1.09
1.55
2.37
3.20
4.73
6.92
8.41
9.77
11.08
2005
0.33
0.65
0.98
1.50
2.10
3.08
4.31
5.81
8.42
10.37
13.56
14.13
2006
0.27
0.68
1.05
1.49
2.25
3.16
4.54
5.90
8.59
10.31
12.31
2007
0.23
0.67
1.12
1.66
2.25
3.31
4.57
6.27
8.20
10.02
12.36
12.42
2008
0.28
0.64
1.16
1.74
2.65
3.58
4.74
5.73
7.32
8.07
9.52
12.52
2009
0.31
0.64
1.09
1.58
2.11
3.19
4.80
6.58
7.97
9.84
11.51
2010
0.25
0.57
1.00
1.64
2.28
3.14
4.53
5.98
8.03
9.71
10.70
13.53
2011
0.25
0.62
1.05
1.56
2.18
2.95
4.33
6.21
8.04
10.13
12.25
15.18
2012
0.29
0.60
1.07
1.66
2.25
2.95
4.17
6.23
8.58
11.08
12.24
14.07
15.22
16.39
2013
0.33
0.63
1.05
1.54
2.26
3.09
4.08
5.47
7.37
9.59
12.57
15.54
17.05
2014
0.32
0.61
1.05
1.61
2.26
3.15
4.00
5.24
7.13
9.46
11.18
14.47
2015
0.30
0.60
0.97
1.49
2.11
3.13
4.64
5.78
7.13
9.53
12.12
16.71
17.37
2016
0.26
0.55
0.97
1.53
2.20
3.19
4.50
6.12
7.97
9.55
10.95
14.35
14.74
17.25
2017
0.33
0.63
1.03
1.56
2.24
3.24
4.67
6.34
7.74
9.40
11.12
14.43
16.67
11.91
2018
0.33
0.68
1.06
1.62
2.40
3.22
4.66
6.23
7.79
8.91
10.26
11.26
13.41
10.14
2019
0.29
0.62
1.10
1.60
2.33
3.22
4.44
6.45
8.10
9.60
11.02
13.83
10.65
10.65
2020
0.27
0.47
0.93
1.44
2.05
2.95
4.28
5.73
7.59
8.45
10.66
12.26
12.18
12.23
2021
0.19
0.44
0.76
1.35
2.02
2.81
4.25
6.26
7.81
9.59
10.67
10.86
13.62
12.31
2022
0.39
0.62
0.91
1.42
2.21
3.22
4.45
6.15
8.16
9.91
10.83
11.96
10.33
Table 3.7. Northeast Arctic COD. Weights-at-age (kg) in landings from various countries (continued)
Germany (Division IIa and IIb)
Year
Age
2
3
4
5
6
7
8
9
10
11
12
13
14
15+
1994
0.68
1.04
2.24
3.49
4.51
5.79
6.93
8.16
8.46
8.74
9.48
15.25
1995
0.44
0.84
1.5
2.72
3.81
4.46
4.81
7.37
7.69
8.25
9.47
1996
0.84
1.15
1.64
2.53
3.58
4.13
3.9
4.68
6.98
6.43
11.32
1997
0.43
0.92
1.42
2.01
3.15
4.04
5.16
4.82
3.96
7.04
8.8
1998
0.23
0.73
1.17
1.89
2.72
3.25
4.13
5.63
6.5
8.57
8.42
11.45
8.79
1999
1
0.853
1.448
1.998
2.65
3.473
4.156
5.447
6.82
5.902
8.01
2000
2
0.26
0.73
1.36
2.04
2.87
3.67
4.88
5.78
7.05
8.45
8.67
9.33
6.88
2001
0.38
0.80
1.21
1.90
2.74
3.90
4.99
5.69
7.15
7.32
11.72
9.11
6.60
2002
0.35
1.00
1.31
1.80
2.53
3.64
4.38
5.07
6.82
9.21
7.59
13.18
19.17
19.20
2003
0.22
0.44
1.04
1.71
2.31
3.27
4.93
6.17
7.77
9.61
9.99
12.29
13.59
2004
2
0.22
0.73
1.01
1.75
2.58
3.33
4.73
6.32
7.20
8.45
9.20
11.99
10.14
13.11
2005
3
0.57
0.77
1.13
1.66
2.33
3.36
4.38
5.92
6.65
7.26
10.01
11.14
2006
2
0.71
0.91
1.39
1.88
2.56
3.77
5.33
6.68
9.14
10.89
11.51
16.83
18.77
2007
3
0.59
1.35
1.79
2.51
3.53
4.00
4.95
6.55
7.54
9.71
11.40
11.57
23.34
15.61
2008
3
0.23
0.51
1.14
1.76
2.57
3.15
4.40
5.43
7.18
8.39
10.15
10.03
10.99
14.26
2009
3
0.35
0.60
1.19
1.83
2.96
4.08
5.61
6.97
8.55
9.13
10.54
13.34
10.30
17.06
2010
3
0.36
0.67
0.93
1.71
2.46
3.21
4.93
6.75
7.80
8.70
8.53
10.17
12.36
14.11
2011
1
1.75
3.09
3.30
3.28
4.13
4.99
6.61
7.91
9.38
10.79
14.67
14.91
2013
3
1.03
1.37
1.87
2.65
3.45
4.49
7.26
11.42
12.86
13.07
2014
4
0.68
0.96
1.39
1.69
3.06
4.07
5.65
8.15
10.36
13.07
13.52
2015
4
0.82
1.05
1.67
2.33
3.56
4.50
5.41
6.20
6.39
2016
1
1.38
2.60
3.55
4.81
6.33
7.61
8.90
9.26
10.83
13.41
16.84
17.03
17.76
2017
1
1.58
2.79
3.93
3.93
4.77
6.35
8.16
9.09
10.39
11.24
12.48
14.39
13.04
2018
3
0.58
1.16
1.76
2.45
3.34
4.13
5.81
7.16
8.99
9.96
10.85
11.73
14.01
17.79
2019
1
0.82
1.37
1.80
2.26
3.49
4.45
5.44
7.08
9.25
9.39
13.30
12.24
15.25
2020
5
1.6
1.63
2.48
3.13
5.01
5.93
8.36
9.31
12.16
12.96
12.77
14.08
2021
2
0.68
1.3
1.52
2.25
3.22
4.58
6.49
7.43
10.37
11.73
14.64
14.34
15.74
2022
1
0.59
0.82
1.40
2.20
3.04
4.13
5.54
7.36
8.56
10.79
13.12
14.96
15.18
1
Division IIa only
2
IIa and IIb combined
3
I,IIa and IIb combined
4
Division II b only
5
I and IIa combined
Table 3.7. Northeast Arctic COD. Weights-at-age (kg) in landings from various countries (continued)
Spain (Division IIb)
Year
Age
2
3
4
5
6
7
8
9
10
11
12
13
14
15+
1994
0.43
1.08
1.38
2.32
2.47
2.68
3.46
5.20
7.04
6.79
7.20
8.04
10.46
15.35
1995
0.42
0.51
0.98
1.99
3.41
4.95
5.52
8.62
9.21
11.42
9.78
8.08
1996
0.66
1.12
1.57
2.43
3.17
3.59
4.44
5.48
6.79
8.10
1997
1
0.51
0.65
1.22
1.68
2.60
3.39
4.27
6.67
7.88
11.34
13.33
10.03
8.69
1998
0.47
0.74
1.15
1.82
2.44
3.32
3.71
5.00
7.26
1999
1
0.21
0.69
1.06
1.69
2.50
3.32
4.72
5.76
6.77
7.24
7.63
2000
1
0.23
0.61
1.24
1.75
2.47
3.12
4.65
6.06
7.66
10.94
11.40
7.20
2001
0.23
0.64
1.25
1.95
2.86
3.55
4.95
6.46
8.50
11.07
13.09
2002
0.16
0.55
1.00
1.48
2.17
3.29
4.47
5.35
8.29
12.23
9.01
12.16
15.2
2003
0.58
1.05
1.70
2.33
3.33
4.92
6.24
9.98
13.07
14.74
14.17
2004
1
0.31
0.56
0.80
1.28
1.96
2.59
3.72
5.36
5.28
7.41
11.43
2005
1
0.63
1.14
1.85
2.48
3.43
4.25
5.38
8.41
11.19
15.04
16.93
2006
0.30
0.61
0.99
1.46
2.04
2.55
3.39
3.50
4.70
6.36
2007
0.42
0.60
1.20
1.76
2.40
3.18
3.96
5.19
6.61
9.48
7.65
12.65
15.74
19.66
2009
1
0.12
0.45
0.95
1.60
2.18
3.36
4.52
6.04
7.30
9.42
10.35
11.47
12.54
2010
2
0.18
0.56
1.11
1.73
2.36
3.36
5.14
6.88
8.64
9.65
6.83
2011
1
0.45
0.90
1.26
1.84
2.55
4.08
5.61
8.17
8.14
7.31
8.91
2012
2
0.40
0.84
1.29
1.96
2.78
3.71
4.99
7.42
7.19
9.32
2013
0.17
0.72
1.06
1.63
2.36
3.14
3.90
4.36
6.55
2014
0.24
0.43
0.74
1.27
1.85
2.60
3.56
4.51
5.52
7.18
9.42
9.26
13.16
15.05
2015
2
0.40
0.80
1.19
1.79
2.45
3.38
4.41
5.85
6.64
7.48
6.77
2016
3
0.11
0.38
0.76
1.20
1.72
2.50
3.39
4.96
7.11
8.56
2017
2
0.12
0.42
0.75
1.17
1.69
2.50
3.39
4.47
5.69
5.93
6.00
10.91
13.57
10.52
2018
2
0.19
0.45
0.83
1.30
1.86
2.57
3.55
4.92
5.51
7.84
7.08
7.28
2019
2
0.19
0.39
0.90
1.30
1.85
2.65
3.48
4.83
5.96
5.67
7.04
8.36
2021
2
0.36
0.60
1.20
1.83
2.49
3.11
4.55
6.10
6.50
7.03
9.013
17.13
2022
2
0.49
0.80
1.25
1.83
2.77
4.06
5.52
7.71
8.87
12.18
1
IIa and IIb combined
2
I,IIa and IIb combined
3
I and IIb combined
Iceland (Sub-area I)
1994
0.42
0.85
1.44
2.77
3.54
4.08
5.84
6.37
7.02
7.48
7.37
1995
1.17
0.91
1.60
2.28
3.61
4.73
6.27
6.26
1996
0.36
0.99
1.55
2.83
3.79
4.81
5.34
7.25
7.68
9.08
8.98
10.52
1997
0.42
0.43
0.76
1.60
2.40
3.45
4.40
5.74
6.15
8.28
10.52
9.89
UK (England & Wales)
1995
1
1.47
2.11
3.47
5.57
6.43
7.17
8.12
8.05
10.2
10.1
1996
2
1.55
1.81
2.42
3.61
6.3
6.47
7.83
7.91
8.93
9.38
10.9
1997
2
1.93
2.17
3.07
4.17
4.89
6.46
12.3
8.44
1
Division IIa and IIb
2
Division IIa
Poland (Division IIb)
2006
0.18
0.51
0.89
1.55
2.23
3.6
5.28
6.95
8.478
11
10.8
15.6
18.9
2008
0.49
0.90
1.45
2.24
2.79
3.82
4.68
5.015
6.45
7.02
7.22
5.99
6.91
2009
1.02
1.72
2.65
3.81
5.23
6.91
8.862
11.1
13.6
16.5
2010
1.39
1.66
2.29
2.98
3.92
5.18
6.313
6.66
8.72
9.05
2011
0.99
1.50
2.17
3.15
4.43
7.45
7.28
2016
1
0.84
1.59
2.29
2.81
3.91
4.78
5.61
6.709
7.89
8.54
11.6
13.7
16.09
2017
2
0.71
1.23
1.52
2.47
3.52
4.78
6.97
9.193
9.95
10.9
14.1
2018
3
0.74
1.15
1.66
2.45
3.55
4.48
6.06
6.31
7.59
7.91
8.28
8.52
9.40
2019
1
1.57
2.00
2.69
4.04
5.61
7.23
9.13
11.62
12.41
13.46
11.47
1
Division IIa
2
Division IIa and IIb
3
I and IIb combined
Table 3.7. Northeast Arctic COD. Weights at age (kg) in landings from various countries (continued)
SAM Wed May 31 08:24:02 2023
Year_age
3
4
5
6
7
8
9
10
11
12
13
14
+gp
1946
0.35
0.59
1.11
1.69
2.37
3.17
3.98
5.05
5.92
7.2
8.15
8.13
9.25
1947
0.32
0.56
0.95
1.5
2.14
2.92
3.65
4.56
5.84
7.42
8.85
8.79
10
1948
0.34
0.53
1.26
1.93
2.46
3.36
4.220
5.31
5.92
7.09
8.43
8.18
9.43
1949
0.37
0.67
1.11
1.66
2.5
3.23
4.070
5.27
5.99
7.08
8.22
8.26
8.7
1950
0.39
0.64
1.29
1.7
2.36
3.48
4.520
5.62
6.4
7.96
8.89
9.07
10.27
1951
0.4
0.83
1.39
1.88
2.54
3.46
4.880
5.2
7.14
8.22
9.39
9.5
9.52
1952
0.44
0.8
1.33
1.92
2.64
3.71
5.060
6.05
7.42
8.43
10.19
10.13
10.56
1953
0.4
0.76
1.28
1.93
2.81
3.72
5.060
6.34
7.4
8.67
10.24
11.41
11.93
1954
0.44
0.77
1.26
1.97
3.03
4.33
5.400
6.75
7.79
10.67
9.68
9.56
11.11
1955
0.32
0.57
1.13
1.73
2.75
3.94
4.900
7.04
7.2
8.78
10.08
11.02
12.11
1956
0.33
0.58
1.07
1.83
2.89
4.25
5.550
7.28
8
8.35
9.94
10.25
11.56
1957
0.33
0.59
1.02
1.82
2.89
4.28
5.490
7.51
8.24
9.25
10.61
10.82
12.07
1958
0.34
0.52
0.95
1.92
2.94
4.21
5.610
7.35
8.67
9.58
11.63
11
13.83
1959
0.35
0.72
1.47
2.68
3.59
4.32
5.450
6.44
7.17
8.63
11.62
11.95
13
1960
0.34
0.51
1.09
2.13
3.38
4.87
6.120
8.49
7.79
8.3
11.42
11.72
13.42
1961
0.31
0.55
1.05
2.2
3.23
5.11
6.150
8.15
8.68
9.6
11.95
13.18
13.42
1962
0.32
0.55
0.93
1.7
3.03
5.03
6.550
7.7
9.27
10.56
12.72
13.48
14.44
1963
0.32
0.61
0.96
1.73
3.04
4.96
6.440
7.91
9.62
11.31
12.74
13.19
14.29
1964
0.33
0.55
0.95
1.86
3.25
4.97
6.410
8.07
9.34
10.16
12.89
13.25
14
1965
0.38
0.68
1.03
1.49
2.41
3.52
5.730
7.54
8.47
11.17
13.72
13.46
14.12
1966
0.44
0.74
1.18
1.78
2.46
3.82
5.360
7.27
8.63
10.66
14.15
14
15
1967
0.29
0.81
1.35
2.04
2.81
3.48
4.890
7.11
9.03
10.59
13.83
14.15
16.76
1968
0.33
0.7
1.48
2.12
3.14
4.21
5.270
6.65
9.01
9.66
14.85
16.3
17
1969
0.44
0.79
1.23
2.03
2.9
3.81
5.020
6.43
8.33
10.71
14.21
15
17
1970
0.37
0.91
1.34
2
3
4.15
5.590
7.6
8.97
10.99
14.07
14.61
16
1971
0.45
0.88
1.38
2.16
3.07
4.22
5.810
7.13
8.62
10.83
12.95
14.25
15.97
1972
0.38
0.77
1.43
2.12
3.23
4.38
5.830
7.62
9.52
12.09
13.67
13.85
16
1973
0.38
0.91
1.54
2.26
3.29
4.61
6.570
8.37
10.54
11.62
13.9
14
15.84
1974
0.32
0.66
1.17
2.22
3.21
4.39
5.520
7.86
9.82
11.41
13.24
13.7
14.29
1975
0.41
0.64
1.11
1.9
2.95
4.37
5.740
8.77
9.92
11.81
13.11
14
14.29
1976
0.35
0.73
1.19
2.01
2.76
4.22
5.880
9.3
10.28
11.86
13.54
14.31
14.28
1977
0.49
0.9
1.43
2.05
3.3
4.56
6.460
8.63
9.93
10.9
13.67
14.26
14.91
1978
0.49
0.81
1.45
2.15
3.04
4.46
6.540
7.98
10.15
10.85
13.18
14
15
1979
0.35
0.7
1.24
2.14
3.15
4.29
6.580
8.61
9.22
10.89
14.34
14.5
15.31
1980
0.27
0.56
1.02
1.72
3.02
4.2
5.840
7.26
8.84
9.28
14.45
15
15.5
1981
0.49
0.98
1.44
2.09
2.98
4.85
6.570
9.16
10.82
10.77
13.93
15
16
1982
0.37
0.66
1.35
1.99
2.93
4.24
6.460
8.51
12.24
10.78
14.04
15
16
1983
0.84
1.37
2.09
2.86
3.99
5.58
7.770
9.29
11.55
11.42
12.8
14.18
15.55
1984
1.42
1.93
2.49
3.14
3.91
4.91
6.020
7.4
8.13
11.42
12.8
14.18
15.55
1985
0.94
1.37
2.02
3.22
4.63
6.04
7.660
9.81
11.8
11.42
12.8
14.18
15.55
1986
0.64
1.27
1.88
2.79
4.49
5.84
6.830
7.69
9.81
11.42
12.8
14.18
15.55
1987
0.49
0.88
1.55
2.33
3.44
5.92
8.600
9.6
12.17
11.42
12.8
14.18
15.55
1988
0.54
0.85
1.32
2.24
3.52
5.35
8.060
9.51
11.36
11.42
12.8
14.18
15.55
1989
0.74
0.96
1.31
1.92
2.93
4.64
7.520
9.12
11.08
11.42
12.8
14.18
15.55
1990
0.81
1.22
1.64
2.22
3.24
4.68
7.300
9.84
13.25
11.42
12.8
14.18
15.55
1991
1.05
1.45
2.15
2.89
3.75
4.71
6.080
8.82
11.8
11.42
12.8
14.18
15.55
1992
1.16
1.57
2.21
3.1
4.27
5.19
6.140
7.77
10.12
11.42
12.8
14.18
15.55
1993
0.81
1.52
2.16
2.79
4.07
5.53
6.470
7.19
7.98
11.457
12.8
14.18
15.55
1994
0.82
1.3
2.06
2.89
3.21
5.2
6.800
7.57
8.01
9.955
13.012
14.18
15.55
1995
0.77
1.2
1.78
2.59
3.81
4.99
6.230
8.05
8.74
9.774
11.388
14.546
15.55
1996
0.79
1.11
1.61
2.46
3.82
5.72
6.740
8.04
9.28
10.451
11.19
12.819
16.045
1997
0.67
1.04
1.53
2.22
3.42
5.2
7.190
7.73
8.61
11.145
11.926
12.608
14.234
1998
0.68
1.05
1.62
2.3
3.3
4.86
6.870
9.3
10.3
10.754
12.676
13.394
14.011
1999
0.63
1.01
1.54
2.34
3.21
4.29
6
6.73
10.08
11.151
12.255
14.191
14.839
2000
0.57
1.04
1.61
2.34
3.34
4.48
5.72
7.52
8.02
11.93
12.682
13.743
15.675
2001
0.66
1.05
1.62
2.51
3.51
4.78
6.04
7.54
9
10.23
13.519
14.197
15.206
2002
0.72
1.13
1.56
2.31
3.52
4.78
6.2
7.66
9.14
10.379
11.687
15.081
15.681
2003
0.67
1.12
1.83
2.5
3.58
5.04
6.36
8.2
10.71
10.167
11.848
13.138
16.602
2004
0.72
1.13
1.61
2.43
3.27
4.72
6.71
7.98
9.19
10.84
11.619
13.31
14.571
2005
0.69
1.08
1.57
2.21
3.26
4.44
6.23
8.19
9.72
10.626
12.347
13.066
14.752
2006
0.72
1.16
1.6
2.39
3.32
4.54
5.47
6.78
7.7
10.8
12.116
13.842
14.494
2007
0.74
1.21
1.83
2.51
3.82
5.04
6.58
8.08
8.94
10.349
12.304
13.596
15.309
2008
0.77
1.27
1.87
2.82
3.79
5.12
6.22
7.75
8.4
10.139
11.816
13.795
15.052
2009
0.75
1.17
1.74
2.42
3.86
5.35
6.43
8.01
8.67
10.055
11.588
13.276
15.261
2010
0.78
1.2
1.74
2.44
3.4
5.04
6.25
7.32
8.53
10.378
11.496
13.033
14.715
2011
0.78
1.31
1.72
2.37
3.2
4.62
6.18
7.47
8.57
10.387
11.847
12.935
14.459
2012
0.67
1.14
1.73
2.34
3.12
4.4
6.28
8.24
10.35
10.367
11.857
13.309
14.356
2013
0.71
1.17
1.67
2.36
3.19
4.22
5.58
7.31
9.08
11.029
11.835
13.32
14.75
2014
0.79
1.2
1.73
2.34
3.28
4.21
5.49
6.98
8.67
10.823
12.551
13.297
14.761
2015
0.78
1.09
1.55
2.18
3.14
4.46
5.61
6.62
7.34
10.215
12.328
14.058
14.737
2016
0.78
1.14
1.66
2.26
3.25
4.5
5.98
7.31
8.54
9.372
11.67
13.822
15.536
2017
0.71
1.15
1.66
2.32
3.32
4.67
6.13
7.15
8.14
9.597
10.752
13.121
15.288
2018
0.86
1.17
1.71
2.5
3.31
4.61
6.03
7.32
8.06
9.707
10.998
12.137
14.552
2019
0.68
1.15
1.66
2.39
3.33
4.45
6.11
7.29
8.41
9.806
11.117
12.401
13.513
2020
0.709
1.084
1.604
2.195
3.092
4.39
5.731
7.218
8.406
9.989
11.226
12.529
13.793
2021
0.527
0.896
1.487
2.159
2.982
4.364
6.048
7.348
8.796
9.991
11.424
12.645
13.928
2022
0.623
0.956
1.478
2.245
3.247
4.441
5.877
7.328
8.738
10.122
11.427
12.858
14.051
Table 3.8. Northeast Arctic COD. Catch weights at age (kg)
SAM Wed May 31 08:24:02 2023
Year_age
3
4
5
6
7
8
9
10
11
12
13
14
+gp
1946
0.35
0.59
1.11
1.69
2.37
3.17
3.98
5.05
5.92
7.2
8.146
8.133
9.253
1947
0.32
0.56
0.95
1.5
2.14
2.92
3.65
4.56
5.84
7.42
8.848
8.789
9.998
1948
0.34
0.53
1.26
1.93
2.46
3.36
4.22
5.31
5.92
7.09
8.43
8.181
9.433
1949
0.37
0.67
1.11
1.66
2.5
3.23
4.07
5.27
5.99
7.08
8.218
8.259
8.701
1950
0.39
0.64
1.29
1.7
2.36
3.48
4.52
5.62
6.4
7.96
8.891
9.07
10.271
1951
0.4
0.83
1.39
1.88
2.54
3.46
4.88
5.2
7.14
8.22
9.389
9.502
9.517
1952
0.44
0.8
1.33
1.92
2.64
3.71
5.06
6.05
7.42
8.43
10.185
10.134
10.563
1953
0.4
0.76
1.28
1.93
2.81
3.72
5.06
6.34
7.4
8.67
10.238
11.409
11.926
1954
0.44
0.77
1.26
1.97
3.03
4.33
5.4
6.75
7.79
10.67
9.68
9.557
11.106
1955
0.32
0.57
1.13
1.73
2.75
3.94
4.9
7.04
7.2
8.78
10.077
11.023
12.105
1956
0.33
0.58
1.07
1.83
2.89
4.25
5.55
7.28
8
8.35
9.944
10.248
11.564
1957
0.33
0.59
1.02
1.82
2.89
4.28
5.49
7.51
8.24
9.25
10.605
10.825
12.075
1958
0.34
0.52
0.95
1.92
2.94
4.21
5.61
7.35
8.67
9.58
11.631
11
13.832
1959
0.35
0.72
1.47
2.68
3.59
4.32
5.45
6.44
7.17
8.63
11.621
11.95
13
1960
0.34
0.51
1.09
2.13
3.38
4.87
6.12
8.49
7.79
8.3
11.422
11.719
13.424
1961
0.31
0.55
1.05
2.2
3.23
5.11
6.15
8.15
8.68
9.6
11.952
13.181
13.422
1962
0.32
0.55
0.93
1.7
3.03
5.03
6.55
7.7
9.27
10.56
12.717
13.482
14.44
1963
0.32
0.61
0.96
1.73
3.04
4.96
6.44
7.91
9.62
11.31
12.737
13.193
14.287
1964
0.33
0.55
0.95
1.86
3.25
4.97
6.41
8.07
9.34
10.16
12.886
13.251
14
1965
0.38
0.68
1.03
1.49
2.41
3.52
5.73
7.54
8.47
11.17
13.722
13.465
14.118
1966
0.44
0.74
1.18
1.78
2.46
3.82
5.36
7.27
8.63
10.66
14.148
14
15
1967
0.29
0.81
1.35
2.04
2.81
3.48
4.89
7.11
9.03
10.59
13.829
14.146
16.756
1968
0.33
0.7
1.48
2.12
3.14
4.21
5.27
6.65
9.01
9.66
14.848
16.3
17
1969
0.44
0.79
1.23
2.03
2.9
3.81
5.02
6.43
8.33
10.71
14.211
15
17
1970
0.37
0.91
1.34
2
3
4.15
5.59
7.6
8.97
10.99
14.074
14.611
16
1971
0.45
0.88
1.38
2.16
3.07
4.22
5.81
7.13
8.62
10.83
12.945
14.25
15.973
1972
0.38
0.77
1.43
2.12
3.23
4.38
5.83
7.62
9.52
12.09
13.673
13.852
16
1973
0.38
0.91
1.54
2.26
3.29
4.61
6.57
8.37
10.54
11.62
13.904
14
15.841
1974
0.32
0.66
1.17
2.22
3.21
4.39
5.52
7.86
9.82
11.41
13.242
13.704
14.291
1975
0.41
0.64
1.11
1.9
2.95
4.37
5.74
8.77
9.92
11.81
13.107
14
14.293
1976
0.35
0.73
1.19
2.01
2.76
4.22
5.88
9.3
10.28
11.86
13.544
14.311
14.284
1977
0.49
0.9
1.43
2.05
3.3
4.56
6.46
8.63
9.93
10.9
13.668
14.255
14.906
1978
0.49
0.81
1.45
2.15
3.04
4.46
6.54
7.98
10.15
10.85
13.177
14
15
1979
0.35
0.7
1.24
2.14
3.15
4.29
6.58
8.61
9.22
10.89
14.344
14.5
15.315
1980
0.27
0.56
1.02
1.72
3.02
4.2
5.84
7.26
8.84
9.28
14.448
15
15.5
1981
0.49
0.98
1.44
2.09
2.98
4.85
6.57
9.16
10.82
10.77
13.932
15
16
1982
0.37
0.66
1.35
1.99
2.93
4.24
6.46
8.51
12.24
10.78
14.041
15
16
1983
0.37
0.92
1.6
2.44
3.82
4.76
6.17
7.7
9.25
12.621
14.544
16.466
18.388
1984
0.42
1.16
1.81
2.79
3.78
4.57
6.17
7.7
9.25
12.621
14.544
16.466
18.388
1985
0.413
0.875
1.603
2.81
4.059
5.833
7.685
10.117
14.29
12.621
14.544
16.466
18.388
1986
0.311
0.88
1.47
2.467
3.915
5.81
6.58
6.833
11.004
12.621
14.544
16.466
18.388
1987
0.211
0.498
1.254
2.047
3.431
5.137
6.523
9.3
13.15
12.621
14.544
16.466
18.388
1988
0.212
0.404
0.79
1.903
2.977
4.392
7.812
12.112
13.107
12.621
14.544
16.466
18.388
1989
0.299
0.52
0.868
1.477
2.686
4.628
7.048
9.98
9.25
12.621
14.544
16.466
18.388
1990
0.398
0.705
1.182
1.719
2.458
3.565
4.71
7.801
8.956
12.621
14.544
16.466
18.388
1991
0.518
1.136
1.743
2.428
3.214
4.538
6.88
10.719
9.445
12.621
14.544
16.466
18.388
1992
0.44
0.931
1.812
2.716
3.895
5.176
6.774
9.598
12.427
12.621
14.544
16.466
18.388
1993
0.344
1.172
1.82
2.823
4.031
5.497
6.765
8.571
10.847
12.621
14.544
16.466
18.388
1994
0.237
0.757
1.419
2.458
3.845
5.374
6.648
7.653
8.136
12.916
16.114
16.466
18.388
1995
0.197
0.487
1.141
2.118
3.504
4.915
6.949
9.051
9.775
11.409
15.248
18.62
18.388
1996
0.206
0.482
0.98
2.041
3.52
5.507
7.74
9.922
10.63
12.093
13.533
17.659
21.171
1997
0.211
0.537
1.11
1.876
3.381
5.258
8.546
10.653
10.776
13.232
14.313
15.745
20.122
1998
0.242
0.561
1.179
1.936
2.944
4.583
7.092
10.7
12.042
13.771
15.607
16.617
18.021
1999
0.209
0.514
1.183
2.007
3.037
4.479
6.512
10.028
11.117
14.698
16.215
18.057
18.981
2000
0.194
0.465
1.218
1.963
3.064
4.12
5.746
7.157
9.961
14.589
17.26
18.733
20.557
2001
0.284
0.513
1.21
2.25
3.299
5.066
6.373
9.29
11.456
13.317
17.138
19.887
21.294
2002
0.23
0.603
1.184
2.138
3.336
4.81
6.912
8.809
10.475
12.534
15.703
19.752
22.549
2003
0.233
0.551
1.317
2.022
3.239
4.984
6.727
8.422
14.226
12.524
14.815
18.164
22.403
2004
0.24
0.55
1.074
2.038
2.911
4.402
6.263
8.535
10.197
12.371
14.803
17.176
20.674
2005
0.225
0.61
1.083
1.87
3.002
3.971
5.789
8.127
12.759
12.611
14.63
17.163
19.594
2006
0.252
0.591
1.219
2.014
3.028
4.434
5.999
7.774
9.954
13.679
14.902
16.97
19.58
2007
0.249
0.663
1.329
2.127
3.183
4.59
6.477
8.88
12.124
12.261
16.111
17.274
19.368
2008
0.286
0.726
1.418
2.41
3.331
4.914
6.747
8.851
10.393
12.776
14.504
18.617
19.701
2009
0.274
0.652
1.353
2.312
3.803
5.103
6.75
9.252
10.119
12.323
15.09
16.83
21.168
2010
0.258
0.608
1.208
2.01
3.088
4.903
6.498
7.992
9.689
12.467
14.574
17.483
19.214
2011
0.225
0.6
1.097
1.926
2.861
4.403
6.531
8.648
9.885
12.508
14.738
16.909
19.929
2012
0.227
0.555
1.182
1.834
2.831
4.124
6.056
8.584
11.498
12.249
14.785
17.092
19.3
2013
0.247
0.577
1.134
1.998
2.841
4.015
5.523
8.077
10.304
13.207
14.491
17.144
19.501
2014
0.216
0.577
1.137
1.791
2.781
3.85
5.245
6.992
9.378
12.746
15.578
16.816
19.558
2015
0.229
0.54
1.134
1.934
2.753
4.081
5.315
7.135
8.947
11.778
15.056
18.025
19.198
2016
0.21
0.536
1.001
1.812
2.72
3.958
5.64
7.064
8.569
10.885
13.954
17.445
20.522
2017
0.255
0.675
1.107
1.896
2.826
4.158
5.7
7.628
9.071
10.634
12.934
16.216
19.888
2018
0.286
0.62
1.188
1.949
2.768
4.059
5.749
7.38
9.097
10.8
12.646
15.073
18.54
2019
0.24
0.603
1.085
1.82
3.025
4.296
5.891
7.293
9.667
11.186
12.837
14.749
17.28
2020
0.148
0.503
1.055
1.692
2.59
4.064
5.617
7.673
9.313
11.306
13.278
14.964
16.922
2021
0.17
0.437
0.954
1.718
2.669
3.804
5.822
7.396
9.334
11.187
13.415
15.459
17.159
2022
0.293
0.48
0.929
1.616
2.741
3.933
5.744
8.012
9.648
11.255
13.279
15.613
17.706
2023
0.271
0.645
1.022
1.71
2.876
4.353
5.925
7.864
9.824
11.36
13.478
15.46
17.876
Table 3.9. Northeast Arctic COD. Stock weights at age (kg)
Norway
Percentage mature
Age
Year
3
4
5
6
7
8
9
10
1982
0
5
10
34
65
82
92
100
1983
5
8
10
30
73
88
97
100
Russia
Percentage mature
Age
Year
3
4
5
6
7
8
9
10
1984
0
5
18
31
56
90
99
100
1985
0
1
10
33
59
85
92
100
1986
0
2
9
19
56
76
89
100
1987
0
1
9
23
27
61
81
80
1988
0
1
3
25
53
79
100
100
1989
0
0
2
15
39
59
83
100
1990
0
2
6
20
47
62
81
95
1991
0
3
1
23
66
82
96
100
1992
0
1
8
31
73
92
95
100
1993
0
3
7
21
56
89
95
99
1994
0
1
8
30
55
84
95
98
1995
0
0
4
23
61
75
94
97
1996
0
0
1
22
56
82
95
100
1997
0
0
1
10
48
73
90
100
1998
0
0
2
15
47
87
97
96
1999
0
0.2
1.3
9.9
38.4
74.9
94
100
2000
0
0
6
19.2
51.4
84
95.5
100
2001
0.1
0.1
3.9
27.9
62.3
89.4
96.3
100
2002
0.1
1.9
10.9
34.4
68.1
82.8
97.6
100
2003
0.2
0
11
29.2
65.9
89.6
95.1
100
2004
0
0.7
8
33.8
63.3
83.4
96.4
96.4
2005
0
0.6
4.6
24.2
61.5
84.9
95.3
98.1
2006
0
0
6.1
29.6
59.6
89.5
96.4
100
2007
0
0.4
5.7
20.8
60.4
83.5
96
100
2008
0
0.5
4
24.6
48.3
84.4
94.7
98.7
2009
0
0
6
28
66
85
97
100
2010
0
0.2
1.5
22.8
47
77.4
90.2
95.5
2011
0
0
2.2
20.7
50.4
73.7
90.6
95.6
2012
0.2
0
1.5
10.8
43.9
76.1
90.8
96.4
2013
0
0
0.6
10.6
41.8
70.6
89.8
96.9
2014
0
0
1.9
14.1
45.9
76
92
97.5
2015
0
0.2
0.2
7.9
27
60.8
83.4
93.7
2016
0
0
0.2
5.2
22.4
44.1
74.8
92.5
2017*
0
0
0.8
6.3
20.8
51.6
80.4
98.6
2018
0
0.5
2.5
23.6
53.9
79.4
92.5
96.0
2019**
0
0
4.5
11.9
56.4
91.8
95.1
100
2020**
0
0.4
1.7
15.8
43.8
71.2
74.9
84.9
2021**
0
0
2.7
16.1
44.1
72.2
87.1
88.1
2022**
0
0
0.8
11.6
59.7
72.6
80.4
96.2
2023**
0
0
0.3
12.3
50.9
84.3
92.6
97.5
*Not used in inputs (instead ratios presented in WD 10, 2017 used for further calculations) **Not used in inputs (instead ratios presented in WD 15, 2019 used for further calculations)
Table 3.10. Northeast Arctic COD. Basis for maturity ogives (percent) used in the assessment. Norwegian and Russian data.
Table 3.21. Northeast Arctic COD. Detailed prediction output assuming Fsq in 2023 and HCR in 2024.
Fbar age
range: 5-10
Year: 2023
F multiplier: 1
Fbar: 0.5740
Age F CatchNos Yield StockNos Biomass SSNos(Jan) SSB(Jan)
3 0.016 6050 4 446000 121 3122 1
4 0.078 10119 10 150647 97 3013 2
5 0.226 33809 49 184991 189 3515 4
6 0.396 47528 102 159696 273 11818 20
7 0.532 39351 123 104371 300 47384 136
8 0.610 22744 102 54409 237 42113 183
9 0.765 17223 102 35086 208 32630 193
10 0.915 5036 36 9129 72 8499 67
11 0.901 1968 17 3602 35 3602 35
12 0.849 1473 15 2802 32 2802 32
13 0.706 584 7 1259 17 1259 17
14 0.340 126 2 481 7 481 7
15+ 0.340 313 4 1190 21 1190 21
Total NA 186326 573 1153663 1610 161427 719
Thous Thou. Thous Thou. Thous Thou.
tonnes tonnes tonnes
Fbar age
range: 5-10
Year: 2024
F multiplier: 0.94
Fbar: 0.5399
Age F CatchNos Yield StockNos Biomass SSNos(Jan) SSB(Jan)
3 0.015 5221 3 409000 106 3136 1
4 0.074 19306 19 304908 179 2236 1
5 0.213 19031 28 110020 125 1284 1
6 0.372 33636 72 118887 205 11611 20
7 0.500 31525 96 87667 245 36294 102
8 0.574 20057 88 50216 213 35235 149
9 0.720 11393 68 24207 151 20810 130
10 0.861 7090 51 13362 106 12828 102
11 0.848 1572 13 2992 29 2951 29
12 0.799 605 6 1197 14 1197 14
13 0.664 436 5 981 13 981 13
14 0.320 127 2 509 8 509 8
15+ 0.320 243 3 973 17 973 17
Total NA 150243 453 1124921 1413 130045 588
Thous Thou. Thous Thou. Thous Thou.
tonnes tonnes tonnes
Year
B(3+)
SSB
R(3)
F(5-10)
1984
848315
259576
438301
0.795
1985
1021968
203508
576945
0.634
1986
1413066
183468
1118185
0.830
1987
1252144
134681
295170
1.081
1988
1017331
224093
219760
0.996
1989
939353
246071
179884
0.489
1990
1006289
337439
226371
0.324
1991
1592561
740169
394031
0.240
1992
1955419
961489
680832
0.429
1993
2389501
845419
911676
0.628
1994
2168890
648440
711684
0.820
1995
1827121
550744
468339
0.748
1996
1736798
595151
384281
0.722
1997
1624589
644463
635610
1.007
1998
1295836
426940
789361
1.033
1999
1103539
288836
480545
0.909
2000
1088474
246892
586038
0.643
2001
1343495
371749
492055
0.505
2002
1489706
504053
424923
0.499
2003
1595022
546868
665568
0.502
2004
1536836
649394
272246
0.605
2005
1492200
587645
520097
0.626
2006
1504824
601797
524445
0.637
2007
1789876
635742
1247697
0.497
2008
2511154
686322
1235842
0.340
2009
3155379
975732
830759
0.326
2010
3426711
1163810
479221
0.352
2011
3617727
1648544
598775
0.310
2012
3734732
1895471
662659
0.286
2013
3853296
2108771
773721
0.298
2014
3567447
2010815
966249
0.333
2015
3363582
1600261
478138
0.364
2016
2975787
1298142
360407
0.340
2017
2964602
1435210
689449
0.417
2018
2674149
1310754
492277
0.477
2019
2447306
1212661
544168
0.429
2020
2121410
956320
495370
0.492
2021
1879219
802243
379310
0.585
2022
1596295
610859
384660
0.715
2023
1300251
527975
Table 3.22. Northeast Arctic COD. Assessments results by means of TISVPA
3
4
5
6
7
8
9
10
11
12
13
14
15
1984
438301
144939
73951
43281
27660
11490
9665
1474
596
354
179
30
20
1985
576945
351716
104931
43213
18687
8116
2980
2549
465
297
141
95
24
1986
1118185
451332
242344
60971
19758
6436
2784
1152
1158
224
202
85
35
1987
295170
829710
302210
119904
24649
6567
1909
862
349
379
67
138
47
1988
219760
218217
540129
150298
37400
6546
1980
688
165
121
103
34
12
1989
179884
168327
154118
292761
61326
9772
1648
580
157
34
42
47
68
1990
226371
143305
119224
97243
158336
25836
3475
653
246
90
16
32
13
1991
394031
183665
110469
84441
62653
99572
14593
2043
372
151
59
8
17
1992
680832
318726
141552
76862
52032
35420
59693
8542
1277
253
110
47
5
1993
911676
537528
232547
93040
42696
26315
16747
31401
4423
748
134
84
4
1994
711684
707943
400480
137834
47641
20043
11432
6916
13268
1829
286
61
13
1995
468339
496871
492566
236538
60270
13562
6410
3382
1991
4060
563
132
3
1996
384281
271882
326773
290789
111421
21887
4657
2156
1037
553
1494
265
3
1997
635610
222036
173452
187141
142317
44635
7906
1828
731
353
203
586
2
1998
789361
406832
139568
81954
75002
48047
11480
1847
410
142
67
54
129
1999
480545
491590
240788
68597
30074
26029
12022
3238
452
121
33
21
79
2000
586038
362022
321680
112542
25801
10774
6859
2392
968
150
50
3
48
2001
492055
451910
262756
171470
49192
9634
3532
1864
645
470
59
30
94
2002
424923
383844
330027
162040
81280
20748
3455
1469
621
249
287
41
27
2003
665568
319225
283064
203129
75541
30986
7513
1314
740
308
106
207
5
2004
272246
517526
242293
177119
102888
32039
12632
3496
614
454
164
68
34
2005
520097
209891
381948
153596
86815
39708
11244
4547
1325
242
251
100
29
2006
524445
381249
152590
215261
74478
33558
13833
3956
1550
561
106
178
615
2007
1247697
420629
264835
95013
105837
32685
12968
4623
1577
556
253
62
167
2008
1235842
954684
307913
155319
54148
54032
16148
6496
2251
799
213
163
81
2009
830759
947159
724454
214884
92405
31542
26612
8468
3609
1179
449
136
129
2010
479221
627233
732344
514100
134228
55690
17987
13932
5013
2105
261
299
213
2011
598775
354267
478598
537164
342709
76210
29896
10161
7391
1823
982
79
0
2012
662659
390290
251621
357872
368928
209856
42837
14723
4369
3434
986
481
165
2013
773721
451221
279569
189363
252043
235557
125197
23938
7609
2052
1851
562
916
2014
966249
520116
344099
205706
133787
156705
128580
62660
11802
3741
1088
1138
850
2015
478138
663446
370727
243532
134664
82084
80492
64321
30794
6141
1974
632
1199
2016
360407
331813
483374
255402
152717
78611
46087
43362
30661
11957
2799
1189
1470
2017
689449
288403
246433
324949
165248
91983
42845
24738
18971
12352
5568
1558
1113
2018
492277
460446
219481
171328
201805
91976
48174
20873
11394
6054
4741
2911
939
2019
544168
370882
345394
153315
104505
110205
46961
23708
8491
3723
1970
2077
1186
2020
495370
401148
279601
232262
97020
59633
53456
22659
11288
3197
1384
1027
921
2021
379310
317948
297365
190134
135573
51132
29022
22672
8659
4199
1275
666
1006
2022
384660
248743
227678
185662
99471
57103
21917
11039
7187
2973
1820
519
339
2023
290978
180482
137219
89171
38852
19092
7289
3567
2449
1087
970
277
Table 3.23. NEA cod TISVPA estimates of abundance at age (thousands)
3
4
5
6
7
8
9
10
11
12
13
14
15
F(5-10)
1984
0.023
0.144
0.284
0.478
1.130
0.732
1.112
1.034
0.374
0.820
0.573
0.573
0.573
0.795
1985
0.022
0.129
0.335
0.402
0.539
1.063
0.589
0.879
0.757
0.291
0.359
0.466
0.466
0.634
1986
0.023
0.170
0.441
0.751
0.699
0.817
1.504
0.771
1.102
0.907
0.209
0.582
0.582
0.830
1987
0.027
0.166
0.536
0.911
1.294
0.940
0.916
1.891
0.810
1.133
0.515
0.640
0.640
1.081
1988
0.025
0.172
0.448
0.963
1.307
1.518
0.872
0.871
1.509
0.694
0.522
0.597
0.597
0.996
1989
0.014
0.094
0.257
0.396
0.614
0.648
0.603
0.420
0.392
0.556
0.201
0.301
0.301
0.489
1990
0.008
0.061
0.161
0.270
0.329
0.426
0.386
0.369
0.250
0.230
0.198
0.191
0.191
0.324
1991
0.006
0.039
0.118
0.195
0.262
0.275
0.307
0.285
0.256
0.173
0.104
0.141
0.141
0.240
1992
0.009
0.066
0.166
0.331
0.459
0.549
0.496
0.572
0.489
0.426
0.177
0.240
0.240
0.429
1993
0.014
0.079
0.242
0.392
0.674
0.831
0.855
0.777
0.843
0.686
0.352
0.341
0.341
0.628
1994
0.016
0.109
0.258
0.517
0.692
1.098
1.139
1.215
0.982
1.046
0.472
0.426
0.426
0.820
1995
0.014
0.103
0.291
0.433
0.715
0.816
1.079
1.152
1.107
0.880
0.517
0.419
0.419
0.748
1996
0.020
0.094
0.287
0.517
0.618
0.894
0.850
1.164
1.123
1.047
0.474
0.431
0.431
0.722
1997
0.025
0.167
0.336
0.694
1.094
1.105
1.431
1.380
1.904
1.716
0.744
0.596
0.596
1.007
1998
0.029
0.168
0.485
0.598
1.043
1.420
1.129
1.522
1.301
1.678
0.737
0.603
0.603
1.033
1999
0.023
0.180
0.441
0.823
0.773
1.149
1.236
1.030
1.214
1.030
0.650
0.548
0.548
0.909
2000
0.020
0.112
0.371
0.551
0.789
0.619
0.733
0.795
0.635
0.703
0.367
0.386
0.386
0.643
2001
0.015
0.105
0.239
0.497
0.578
0.690
0.469
0.558
0.557
0.446
0.298
0.299
0.299
0.505
2002
0.013
0.088
0.265
0.376
0.642
0.631
0.638
0.445
0.492
0.480
0.241
0.279
0.279
0.499
2003
0.013
0.078
0.220
0.421
0.477
0.705
0.586
0.605
0.396
0.428
0.258
0.261
0.261
0.502
2004
0.014
0.097
0.237
0.435
0.698
0.672
0.864
0.724
0.690
0.436
0.288
0.304
0.304
0.605
2005
0.015
0.093
0.265
0.410
0.615
0.862
0.691
0.914
0.702
0.654
0.257
0.309
0.309
0.626
2006
0.016
0.102
0.261
0.481
0.601
0.786
0.934
0.760
0.930
0.695
0.382
0.327
0.327
0.637
2007
0.013
0.084
0.223
0.356
0.523
0.553
0.606
0.723
0.557
0.649
0.305
0.264
0.264
0.497
2008
0.009
0.061
0.165
0.272
0.346
0.432
0.393
0.435
0.475
0.369
0.260
0.194
0.194
0.340
2009
0.008
0.053
0.154
0.262
0.351
0.387
0.417
0.387
0.400
0.426
0.209
0.187
0.187
0.326
2010
0.007
0.053
0.147
0.272
0.377
0.439
0.418
0.460
0.398
0.403
0.264
0.200
0.200
0.352
2011
0.007
0.044
0.125
0.220
0.331
0.398
0.400
0.388
0.399
0.339
0.215
0.183
0.000
0.310
2012
0.006
0.043
0.107
0.195
0.279
0.366
0.380
0.390
0.354
0.356
0.191
0.176
0.176
0.286
2013
0.007
0.044
0.121
0.190
0.284
0.356
0.407
0.431
0.413
0.367
0.230
0.192
0.192
0.298
2014
0.008
0.051
0.133
0.234
0.299
0.394
0.432
0.507
0.501
0.469
0.256
0.228
0.228
0.333
2015
0.009
0.060
0.152
0.253
0.368
0.409
0.471
0.529
0.580
0.561
0.316
0.267
0.267
0.364
2016
0.008
0.055
0.155
0.247
0.334
0.422
0.405
0.475
0.497
0.532
0.311
0.263
0.263
0.340
2017
0.012
0.064
0.178
0.321
0.420
0.499
0.549
0.537
0.591
0.605
0.383
0.333
0.333
0.417
2018
0.014
0.087
0.189
0.338
0.506
0.575
0.587
0.664
0.600
0.647
0.389
0.384
0.384
0.477
2019
0.012
0.082
0.215
0.293
0.426
0.550
0.533
0.555
0.580
0.515
0.332
0.357
0.357
0.429
2020
0.011
0.082
0.246
0.412
0.450
0.573
0.639
0.631
0.611
0.624
0.332
0.406
0.406
0.492
2021
0.019
0.083
0.250
0.488
0.675
0.624
0.685
0.788
0.717
0.675
0.403
0.475
0.475
0.585
2022
0.017
0.111
0.301
0.523
0.740
0.896
0.901
0.930
0.877
0.806
0.429
0.429
0.429
0.715
Table 3.24. NEA cod TISVPA estimates of fishing mortality coefficients
Figure 3.1. Standard plots for Northeast Arctic cod (ICES subareas 1 and 2)Figure 3.2a. Standardized one-observation-ahead residuals for log-catches and log-indices (Thygesen et al. 2017) in the final SAM runFigure 3.2b. NEA cod SSB, R and Fbar model retrospective pattern for final SAM run.Figure 3.2c. NEA cod SSB, Fbar and R historical retrospective pattern for final SAM runFigure 3.2d. NEA cod final SAM run fit. Total catch in weight. Modelled catches from the final run and point wise 95% confidence intervals are shown by line and shaded area. The yearly ob-served total catch weight (crosses) are calculated as Catch(y)=sum(W(a,y)*C(a,y)). Figure 3.2e. NEA cod. Catchability of different fleets used for final SAM run fit.Figure 3.3. NEA cod cannibalism mortality vs. capelin abundance.Figure 3.4. Northeast Arctic cod. Fishing mortality (F5-10) (top panel) and trawl efforts (bottom panel)Figure 3. 5. Cod CPUE in Norwegian trawl catches where cod is the main species (double and single trawl, Nedreaas WD02). Connected line shows mean, line inside the box shows the medi-an, and the box shows 25 and 75 percentiles. Figure 3.6a. Residuals of the TISVPA data approximation (yellow circles are positive residuals, white – negative). Figure 3.6b. Profiles of the components of the TISVPA objective function.Figure 3.6c. TISVPA retrospective runs.
Figure 3.7. Model comparison. TSB (total stock biomass, age 3+), SSB recruitment and F in SAM and TISVPA.Figure 3.8. Medium term prediction of NEA cod stock dynamics and TAC according to HCR based on assessments of current year and previous year.
Sub-area |I
Division IIb
Division IIa
Total
Year
Norway 2
UK 3
Russia 4
Norway 2
UK 3
Russia 4
Norway 2
UK 3
Norway
1966
-
0.074
0.42
-
0.078
0.19
-
0.067
1967
-
0.081
0.53
-
0.106
0.87
-
0.052
1968
-
0.110
1.09
-
0.173
1.21
-
0.056
1969
-
0.113
1.00
-
0.135
1.17
-
0.094
1970
-
0.100
0.80
-
0.100
0.80
-
0.066
1971
-
0.056
0.43
-
0.071
0.16
-
0.062
1972
0.90
0.047
0.34
0.59
0.051
0.18
1.08
0.055
1973
1.05
0.057
0.56
0.43
0.054
0.57
0.71
0.043
1974
1.75
0.079
0.86
1.94
0.106
0.77
0.19
0.028
1975
1.82
0.077
0.94
1.67
0.100
0.43
1.36
0.033
1976
1.69
0.060
0.84
1.20
0.081
0.30
1.69
0.035
1977
1.54
0.052
0.63
0.91
0.056
0.25
1.16
0.044
1.17
1978
1.37
0.062
0.52
0.56
0.044
0.08
1.12
0.037
0.94
1979
0.85
0.046
0.43
0.62
-
0.06
1.06
0.042
0.85
1980
1.47
-
0.49
0.41
-
0.16
1.27
-
1.23
Spain5
Russia4
1981
1.42
-
0.41
(0.96)
-
0.07
1.02
0.35
1.21
1982
1.30
-
0.35
-
0.86
0.26
1.01
0.34
1.09
1983
1.58
-
0.31
(1.31)
0.92
0.36
1.05
0.38
1.11
1984
1.40
-
0.45
1.20
0.78
0.35
0.73
0.27
0.96
1985
1.86
-
1.04
1.51
1.37
0.50
0.90
0.39
1.29
1986
1.97
-
1.00
2.39
1.73
0.84
1.36
1.14
1.70
1987
1.77
-
0.97
2.00
1.82
1.05
1.73
0.67
1.77
1988
1.58
-
0.66
1.61
(1.36)
0.54
0.97
0.55
1.03
1989
1.49
-
0.71
0.41
2.70
0.45
0.78
0.43
0.76
1990
1.35
-
0.70
0.39
2.69
0.80
0.38
0.60
0.49
1991
1.38
-
0.67
0.29
4.96
0.76
0.50
0.90
0.44
1992
2.19
-
0.79
3.06
2.47
0.23
0.98
0.65
1.29
1993
2.33
-
0.85
2.98
3.38
1.00
1.74
1.03
1.87
1994
2.50
-
1.01
2.82
1.44
1.14
1.27
0.86
1.59
1995
1.57
-
0.59
2.73
1.65
1.10
1.00
1.01
1.92
1996
0.74
1.11
0.85
0.99
1.81
1997
0.61
0.57
0.74
1.36
1998
0.37
0.29
0.40
0.83
1999
0.29
0.34
0.39
0.74
2000
0.34
0.37
0.53
0.92
2001
0.46
0.46
0.69
1.21
2002
0.58
0.66
0.57
1.35
2003
0.70
1.22
0.73
1.67
2004
0.48
0.78
0.84
1.67
2005
0.45
0.62
0.81
1.23
2006
0.49
0.54
0.84
0.88
2007
0.71
0.51
0.88
1.16
2008
0.93
0.79
1.21
2009
1.33
1.16
0.83
2010
1.47
1.18
1.16
2011
1.77
1.69
2.46
4.87 6
2012
2.25
1.44
2.11
6.97 6
2013
2.30
1.46
2.60
4.96 6
2014
2.07
1.54
2.38
5.75 6
2015
1.06
1.38
1.93
4.54 6
2016
1.15
1.06
1.39
3.64 6
2017
1.00
1.0 0
1.0 5
3.01 6
2018
1.0 6
1. 40
1. 31
3.20 6
2019
1 .01
0.89
1.16
3.02 6
2020
0.78
0.68
1.42
3.38 6
2021
0.70
0.89
0.86
2.51 6
2022 1
0.60
0.72
0.49
2.046
Table A1. North-East Arctic COD. Catch per unit effort.
1 Preliminary figures.
2 Norwegian data - t per 1,000 tonnage*hrs fishing.
3 United Kingdom data - t per 100 tonnage*hrs fishing.
4 Russian data - t per hr fishing.
5 Spanish data - t per hr fishing.
6 2011-2022 Norwegian data on t per hr fishing are from single-trawl only, not comparable to data from previous years
Period
Sub-area I
Divisions IIa and IIb
1960–1973
RT
RT
1974–1980
PST
RT
1981–
PST
PST
Vessel type: RT = side trawlers, 800–1000 HP, PST = stern trawlers, up to 2000 HP.
Age
Year
1
2
3
4
5
6
7
8
9
10
11
12
13
14
15+
10+
Total
12+
1981
8.00
82.00
40.00
63.00
106.00
103.00
16.00
3.00
1.00
1.00
423.0
1982
4.00
5.00
49.00
43.00
40.00
26.00
28.00
2.00
+
0.00
197.0
1983
60.49
2.78
5.34
14.27
17.37
11.13
5.58
2.98
0.45
0.06
120.5
1984
745.44
146.11
39.13
13.59
11.26
7.44
2.81
0.19
0.02
0.00
966.0
1985
69.06
446.29
153.04
141.59
19.66
7.58
3.32
0.22
0.09
0.04
840.9
1986
353.63
243.90
499.61
134.27
65.90
8.28
2.15
0.37
0.06
0.02
1308.2
1987
1.62
34.07
62.80
204.93
41.41
10.40
1.22
0.19
0.66
0.00
357.3
1988
1.98
26.25
50.42
35.53
56.20
6.48
1.35
0.15
0.01
0.00
178.4
1989
7.53
7.98
17.00
34.39
21.38
53.82
6.88
0.97
0.10
0.05
150.1
1990
81.13
24.92
14.82
20.63
26.08
24.30
39.78
2.37
0.06
0.03
234.1
1991
181.04
219.51
50.23
34.64
29.33
28.87
16.89
17.33
0.86
0.03
578.7
1992
241.38
562.13
176.48
65.79
18.84
13.23
7.58
4.50
2.78
0.21
1092.9
1993
1074.04
494.68
357.24
191.05
108.24
20.84
8.12
4.98
2.25
2.51
2264.0
1994
902.64
624.38
323.88
374.47
205.53
70.24
13
3.59
2.6
0.71
1.15
0.11
0.13
NA
0
2522.4
0.24
1995
2175.25
212.29
137.74
139.49
197.08
66.38
15.73
2.43
0.91
0.32
0.48
0.17
NA
NA
0
2948.3
0.17
1996
1826.33
271.71
99.4
89.62
111.34
82.96
22.17
2.22
0.3
0.1
0.07
0.05
0.1
0.01
0
2506.4
0.16
1997
1698.49
565.31
158.57
44.22
49.91
40.91
23.48
5.02
0.84
0.27
0.09
NA
NA
0.01
0
2587.1
0.01
1998
2523.56
475.15
391.16
189.79
44.87
41.22
27.85
16.06
1.81
0.5
0.04
NA
NA
NA
0.06
3712.1
0.06
1999
364.84
231.51
147.62
130.29
52.03
11.93
6.94
4.13
1.47
0.24
0.01
0.03
0.01
NA
0
951.1
0.04
2000
153.42
262.81
294.83
167.25
145.55
50.75
11.33
4.7
2.75
0.85
0.18
0.11
0.03
NA
0
1094.6
0.14
2001
363.55
51.45
177.44
160.63
80.8
44.47
11.1
1.73
0.46
0.19
0.08
NA
NA
NA
0.01
891.9
0.01
2002
19.22
209.1
61.37
106.23
98.78
52.18
20.07
2.9
0.32
0.52
0.09
NA
NA
NA
0.02
570.8
0.02
2003
1505
52.53
306.71
116.8
124.62
116.52
37.69
10.05
1.93
0.31
0.07
NA
0.08
0.07
0
2272.4
0.15
2004
161.2
117.19
33.41
85.21
32.96
28.03
18.14
5.33
1.16
0.31
0.08
0
0.01
NA
0
483.0
0.01
2005
499.71
138.66
125.03
33.28
65.94
21.21
15.02
4.95
1.01
0.25
0.05
0.07
0.05
0.03
0
905.3
0.15
2006
411.21
157.95
64.77
53.82
18.35
29.52
9.5
4.9
1.28
0.2
0.13
0.3
NA
NA
0
751.9
0.3
2007
85.13
47.09
58.49
30.4
29.35
9.04
18.07
6.41
2.67
0.53
0.24
0.07
NA
NA
0
287.5
0.07
2008
50.87
94.2
199.85
288.71
116.17
72.91
21.82
14.43
2.8
0.81
0.04
0.01
0.01
NA
0
862.6
0.02
2009
204.9
25.46
107.83
182.54
138.08
41.48
13.87
4.69
4.32
0.5
0.14
0.02
0.01
NA
0
723.8
0.03
2010
620.25
43.56
22.82
87.98
160.16
154.39
44.56
14.57
3.9
2.89
0.94
0.11
0.12
0.09
0.01
1156.4
0.33
2011
266
91
40.36
28.32
65.2
106.97
101.8
19.76
6.11
1.7
0.92
0.25
0.15
0.09
0.02
728.7
0.51
2012
496.49
40.23
82.79
49.38
33.77
72.53
132.31
65.59
8.37
4.39
1.21
0.66
0.47
0.04
0.1
988.3
1.27
2013
313.11
89.17
60.55
84.49
72.18
47.75
98.41
130.54
55.32
5.41
4.02
1.3
0.73
0.2
0.07
963.3
2.3
2014
1758.58
211.04
286.89
124.18
111.14
74.47
39.41
89.89
61.31
22.64
2.56
1.31
0.16
0.05
0.19
2783.8
1.71
2015
1903.54
211.41
138.71
235.58
128.8
140.36
80.55
35.07
53.8
24.38
7.91
0.8
0.13
0.05
0.01
2961.1
0.99
2016
240.8
201.89
56.29
76.91
119.38
64.84
50.17
25.8
13.49
17.83
7.35
2.15
0.72
0.22
0.1
877.9
3.19
2017
439.4
73.3
111.54
42.35
44.25
65.3
35.75
24.31
11.97
4
2.88
3.15
0.67
0.19
0.11
859.2
4.12
2018
2057.6
280.29
109.03
149.94
53.4
54.93
66.09
34.35
10.78
6.27
1.73
2.25
1.5
0.15
0.23
2828.5
4.13
2019
1437.21
362.38
203.63
125.42
144.06
60.98
34.99
37.86
9.64
3.47
0.55
0.32
0.18
0.28
0.24
2421.2
1.02
2020
92.68
157.92
117.32
117.32
81.36
90.6
42.35
26.57
21.41
6.23
1.75
0.67
0.66
0.51
0.89
758.2
2.73
2021
45.92
28.51
64.86
59.08
55.48
38.54
30.80
12.41
6.32
4.67
2.17
0.29
0.18
0
0.21
349.4
0.68
2022
524.71
43.42
29.42
52.98
56.69
47.05
42.94
27.77
7.85
2.44
1.51
0.94
0.18
0
0.28
838.2
1.40
2023
244.43
103.24
28.66
26.54
33.54
33.83
23.81
12.62
7.08
1.58
0.33
0.11
0.04
0.00
0.08
515.9
0.23
Table A2. North-east Arctic COD. Abundance indices (millions) from the Norwegian acoustic survey in the Barents Sea in January-March. New TS and rock-hopper gear (1981-1988 back-calculated from bobbins gear). Corrected for length-dependent effective spread of trawl. Data from 1994 onwards corrected for three northern areas and the method of filling in gaps (WD 1, WKBarFar 2021).
Age
Year
1
2
3
4
5
6
7
8
9
10
11
12
13
14
15+
10+
Total
12+
1981
4.60
34.30
16.40
23.30
40.00
38.40
4.80
1.00
0.30
0.00
163.1
1982
0.80
2.90
28.30
27.70
23.60
15.50
16.00
1.40
0.20
0.00
116.4
1983
152.90
13.40
24.95
52.34
43.33
16.96
5.82
3.21
0.97
0.05
313.9
1984
2755.04
379.11
97.49
28.28
21.44
11.74
4.07
0.40
0.08
0.08
3297.7
1985
49.49
660.04
166.79
125.98
19.92
7.67
3.34
0.21
0.07
0.05
1033.6
1986
665.79
399.61
805.00
143.93
64.14
8.30
1.91
0.34
0.04
0.03
2089.1
1987
30.72
444.98
240.38
391.15
54.35
15.70
2.00
0.45
0.03
0.00
1179.8
1988
3.21
72.83
148.03
80.49
173.31
20.48
3.58
0.53
0.03
0.00
502.5
1989
8.24
15.62
46.36
75.86
37.79
90.19
9.82
0.94
0.10
0.07
285.0
1990
207.17
56.72
28.35
34.87
34.59
20.56
27.23
1.61
0.38
0.03
411.5
1991
460.45
220.14
45.85
33.67
25.65
21.49
12.15
12.67
0.61
0.02
832.7
1992
126.56
570.92
158.26
57.71
17.82
12.83
7.67
4.29
2.72
0.22
959.0
1993
534.48
420.40
273.89
140.13
72.48
15.83
6.24
3.89
2.23
2.36
1471.9
1994
1043.78
556.68
293.92
307.04
153.33
45.72
7.95
2.61
1.48
0.55
0.55
0.08
0.05
NA
0
2413.7
0.13
1995
5356.43
541.25
282.84
242.36
251.01
76.42
17.98
2.42
1.07
0.5
0.61
0.19
NA
NA
0
6773.1
0.19
1996
5899.23
791.62
163.08
117.43
138.59
108.88
24.43
2.64
0.37
0.17
0.12
0.07
0.07
0.02
0
7246.7
0.16
1997
5044.09
1422.92
317.99
68.44
74.26
59.99
26.67
4.85
0.64
0.91
0.08
NA
NA
NA
0
7020.8
0.00
1998
2490.54
496.48
355.1
166.94
31.67
26.15
17.52
8.16
0.79
0.52
0.04
NA
NA
NA
0.04
3594.0
0.04
1999
473.04
350.21
188.48
180.75
61.39
12.71
6.81
5.14
1.01
0.26
0.02
0.04
0.02
NA
0
1279.9
0.06
2000
128.57
242.33
245.81
130.03
111.73
26.75
4.56
1.84
1.21
0.33
0.1
0.03
0.02
NA
0
893.3
0.05
2001
712.77
78.03
182.79
195.11
82.9
37.96
9.45
1.17
0.44
0.19
0.04
NA
NA
NA
0.01
1300.9
0.01
2002
34.11
418.73
118.36
137.56
108.95
45.79
14.4
2.2
0.32
0.18
0.05
NA
NA
NA
0.02
880.7
0.02
2003
3022.23
65.78
376.7
126.31
93.93
66.88
17.5
4.67
1.02
0.17
0.04
NA
0.02
0.02
0
3775.3
0.04
2004
322.87
242.94
63.88
184.62
53.46
43.24
30.59
6.85
1.65
0.28
0.07
0.01
0.01
NA
0
950.5
0.02
2005
853.43
216.67
248.88
55.06
102.97
22.38
16.36
3.81
0.92
0.3
0.04
0.02
0.04
0.04
0
1520.9
0.10
2006
674.21
289.39
116.49
115.38
28.32
43.42
13.72
5.24
1.36
0.24
0.18
0.18
NA
NA
0
1288.1
0.18
2007
594.69
369.74
361.13
127.73
68.51
13.65
23.6
6.82
2.3
0.41
0.11
0.1
NA
NA
0
1568.8
0.10
2008
68.83
101.96
194.37
300.59
111.9
40.24
17.34
8.11
1.79
0.36
0.03
0.02
0.01
NA
0
845.6
0.03
2009
389.48
35.59
126.28
196.7
220.23
60.69
17.9
9.02
5.24
0.51
0.17
0.03
0.04
NA
0
1061.9
0.07
2010
1027.59
95.14
36.81
114.25
154.80
144.50
39.56
11.24
3.67
1.60
0.58
0.04
0.02
0.04
0.02
1629.9
0.12
2011
617.18
225.81
85.40
50.37
129.70
138.66
103.51
16.37
4.36
1.20
0.82
0.19
0.14
0.04
0.02
1373.8
0.39
2012
702.97
100.30
75.72
64.59
33.71
90.69
132.58
48.61
9.02
2.26
0.88
0.55
0.44
0.07
0.05
1262.4
1.11
2013
435.72
142.96
68.84
114.09
63.18
40.43
64.54
76.38
33.52
2.22
2.87
0.40
0.35
0.06
0.03
1045.6
0.84
2014
1245.71
191.48
226.85
93.79
88.59
56.39
32.74
53.05
36.19
9.81
1.01
0.95
0.15
0.02
0.08
2036.8
1.20
2015
1642.00
342.76
144.07
228.25
147.29
113.53
74.43
29.22
53.51
18.08
3.38
0.75
0.12
0.07
0.04
2797.5
0.98
2016
312.16
305.57
99.37
135.48
188.31
113.47
72.33
28.56
13.17
16.06
6.77
0.97
0.52
0.17
0.14
1293.1
1.80
2017
644.51
128.92
179.25
62.15
84.54
90.16
37.82
26.33
8.18
3.26
2.61
3.70
0.58
0.17
0.06
1272.2
4.51
2018
2714.35
500.69
139.41
184.78
61.81
64.17
73.88
25.88
9.28
5.87
1.29
2.46
1.23
0.13
0.37
3785.6
4.19
2019
1790.57
559.44
281.57
179.15
221.90
79.65
32.96
38.31
8.15
2.62
0.54
0.24
0.16
0.18
0.12
3195.6
0.70
2020
164.75
273.82
237.73
160.24
131.56
114.88
49.83
24.26
20.44
4.53
1.66
0.93
0.51
0.26
0.73
1186.1
2.43
2021*
80.88
34.87
111.50
119.35
112.31
54.28
37.98
13.57
7.27
3.53
1.25
0.42
0.25
0.04
0.32
577.8
1.03
2022
667.82
65.64
51.98
88.68
86.60
66.51
44.60
30.42
5.70
2.29
2.08
1.49
0.16
0.00
0.90
1114.9
2.55
2023
305.40
163.06
41.21
39.82
46.52
43.17
32.24
14.26
7.49
1.58
0.34
0.14
0.06
0.00
0.14
695.4
0.35
Table A3. North-East Arctic COD. Abundance indices (millions) from the Norwegian bottom trawl survey in the Barents Sea in January-March. Rock-hopper gear (1981-1988 back-calculated from bobbins gear). Corrected for length-dependent effective spread of trawl. Data from 1994 and onwards corrected - WD 1, WKBarFar 2021
*revised
Year
5
6
7
8
9
10
11
12+
Sum
1985
0.68
7.45
12.36
3.11
1.15
1.01
0.45
26.21
1986
2.49
3.30
5.54
2.71
0.16
0.40
0.08
14.68
1987
8.77
7.04
0.23
2.83
0.04
0.03
0.03
18.97
1988
1.57
4.43
2.56
0.05
0.01
0.05
8.67
1989
0.04
13.20
9.73
2.20
0.38
0.12
0.06
25.73
1990
0.13
2.60
27.02
4.85
0.49
0.32
35.41
1991
0.00
5.00
19.83
32.67
2.75
0.19
0.17
60.61
1992
2.74
5.23
20.80
20.87
79.60
4.17
1.61
0.22
135.24
1993
4.87
14.58
17.35
20.22
25.44
41.95
4.74
0.71
129.86
1994
23.78
25.85
10.36
8.21
7.68
3.49
17.53
2.61
99.51
1995
6.49
35.24
12.34
2.27
3.60
2.56
2.15
7.96
72.61
1996
1.41
14.43
24.00
3.65
0.79
0.25
0.80
1.30
46.63
1997
0.40
4.95
27.56
16.50
1.50
0.42
0.75
52.08
1998
0.05
0.30
7.06
11.05
3.24
0.51
0.18
0.02
22.41
1999
0.25
1.92
4.84
14.58
8.42
0.75
0.19
0.10
31.05
2000
3.61
3.85
3.25
2.15
2.23
0.45
0.39
0.05
15.98
2001
4.33
17.61
8.03
0.96
0.33
0.36
0.26
0.09
31.97
2002
2.30
19.11
16.50
6.49
0.83
0.31
0.47
0.01
46.02
2003
2.49
29.56
30.01
13.46
1.90
0.11
0.04
0.02
77.59
2004
1.96
17.52
29.82
16.34
7.67
2.04
0.15
0.68
76.18
2005
3.33
12.93
28.75
13.06
6.51
1.55
0.06
0.16
66.35
2006
0.20
12.50
8.11
10.98
7.42
2.12
0.16
0.66
42.14
2007
1.46
3.88
28.52
8.69
5.35
2.80
0.68
0.36
51.72
2008
0.45
5.96
2.95
20.72
2.70
2.02
1.66
0.71
37.17
2009
3.42
14.48
27.64
8.10
22.31
3.07
1.56
0.37
80.95
2010
0.96
20.06
16.98
16.84
6.89
9.61
3.05
2.60
76.96
2011
2.01
51.73
170.09
44.72
17.16
5.12
6.54
0.40
297.76
2012
0.46
12.56
91.58
67.75
17.30
5.98
2.59
1.53
199.76
2013
0.22
5.89
33.69
101.76
106.39
16.08
7.05
6.48
277.56
2014
0.25
2.82
15.49
58.75
112.10
75.33
12.07
8.82
285.62
2015
0.87
1.40
15.42
14.73
42.98
44.20
24.62
11.75
155.97
2016
0.24
1.46
9.05
14.53
22.06
38.65
27.06
25.45
138.51
2017
0.17
7.51
12.84
21.94
14.79
12.70
11.67
18.84
100.46
2018
0.61
3.28
11.11
11.21
8.44
7.82
4.42
9.60
56.50
2019
0.25
2.35
13.34
36.00
17.68
18.35
5.96
9.93
103.87
2020
0.58
3.17
7.75
24.37
28.05
13.28
6.66
5.29
89.15
2021
0.34
1.68
6.13
3.90
5.04
9.68
5.99
2.77
35.53
2022
0.31
3.34
4.58
6.70
3.77
4.39
3.75
2.53
29.37
20 23
0.08
0.72
4.01
5.73
6.45
1.66
1.40
1.28
21.34
Table A4. North East Arctic COD. Abundance at age (millions) from the Norwegian acoustic survey on the spawning grounds off Lofoten in March-April.
Year
1
2
3
4
5
6
7
8
9
10
11
12
13
14
1981
17.0
26.1
35.5
44.7
52.0
61.3
69.6
77.9
1982
14.8
25.8
37.6
46.3
54.7
63.1
70.8
82.9
1983
12.8
27.6
34.8
45.9
54.5
62.7
73.1
78.6
1984
14.2
28.4
35.8
48.6
56.6
66.2
74.1
79.7
1985
16.5
23.7
40.3
48.7
61.3
71.1
81.2
85.7
1986
11.9
21.6
34.4
49.9
59.8
69.4
80.3
93.8
1987
13.9
21.0
31.8
41.3
56.3
66.3
77.6
87.9
1988
15.3
23.3
29.7
38.7
47.6
56.8
71.7
79.4
1989
12.5
25.4
34.7
39.9
46.8
56.2
67.0
83.3
1990
14.4
27.9
39.4
47.1
53.8
60.6
68.2
79.2
1991
13.6
27.2
41.6
51.7
59.5
67.1
72.3
77.6
1992
13.2
23.9
41.3
49.9
60.2
68.4
76.1
82.8
1993
11.3
20.3
35.9
50.8
59.0
68.2
76.8
85.8
1994
11.3
17.9
30.2
44.6
55.2
65.7
73.9
78.9
87.4
97.2
97.6
104.7
122.4
1995
12.2
18.1
29.0
42.2
53.9
63.9
75.4
80.4
85.9
99.1
90.1
109.0
1996
12.1
18.8
28.8
40.5
49.4
60.9
71.8
85.1
92.4
94.9
96.1
104.2
103.9
121.0
1997
10.8
16.9
29.7
41.0
50.6
59.4
69.6
81.2
92.3
80.4
103.2
1998
10.5
17.8
30.8
40.9
50.9
58.5
67.7
76.7
87.2
103.0
111.4
105.9
1999
12.0
18.4
29.0
40.0
50.4
59.4
70.4
78.4
88.5
87.6
117.0
62.0
108.0
2000
12.8
20.7
28.4
39.7
51.5
61.4
70.4
76.3
84.9
84.3
100.0
116.2
90.0
2001
11.6
22.6
33.0
41.2
52.2
63.3
70.4
78.3
86.0
95.7
104.7
2002
12.0
19.6
28.9
43.6
52.1
61.9
71.4
79.5
91.2
89.7
103.7
2003
11.4
18.1
29.1
39.7
53.4
61.7
70.6
80.8
89.1
90.1
105.4
104.3
110.5
2004
10.6
18.4
31.7
40.6
51.7
61.6
68.6
79.7
90.9
90.4
92.2
116.0
112.0
2005
11.2
18.3
29.5
43.4
51.1
60.4
71.0
79.6
89.0
96.4
109.3
113.7
129.6
107.0
2006
12.0
19.4
30.9
42.1
53.8
60.3
66.7
76.7
84.9
98.9
95.4
84.9
2007
13.2
20.7
29.6
41.1
52.8
62.5
70.4
78.2
87.5
92.7
101.8
121.6
110.0
2008
12.1
22.3
33.0
43.2
51.8
64.0
69.9
81.3
88.7
95.3
108.9
103.0
102.0
2009
11.2
21.1
32.1
42.6
53.2
61.9
76.6
81.8
89.5
97.8
99.5
94.2
110.0
2010
11.2
18.4
31.4
42.7
52.4
60.7
70.5
80.4
88.8
96.3
102.2
99.8
100.8
126.0
2011
11.9
19.5
29.4
41.9
51.0
60.7
68.1
78.3
86.1
95.4
102.2
110.4
114.3
116.9
2012
10.6
18.4
29.7
41.0
52.4
58.1
66.5
75.6
86.0
91.8
105.9
114.0
119.0
115.5
2013
11.2
19.3
31.1
41.1
51.7
62.0
69.7
76.5
81.2
95.3
93.7
110.7
110.8
145.0
2014
9.7
17.1
29.5
40.5
52.0
59.6
70.2
76.8
81.8
87.1
97.4
98.9
107.8
91.1
2015
10.5
15.9
30.0
40.3
51.1
60.2
68.8
77.5
81.2
88.7
94.0
101.9
127.5
121.1
2016
12.2
18.3
27.7
40.6
49.8
60.5
68.3
76.6
85.5
86.5
90.5
94.1
112.0
122.5
2017
12.3
22.2
31.2
42.5
51.2
60.5
69.6
75.5
85.2
90.9
96.0
92.6
108.6
108.7
2018
11.2
19.1
32.7
42.4
51.2
61.6
69.0
77.5
83.4
87.6
97.0
99.3
101.8
106.8
2019
11.7
17.5
31.2
42.4
51.0
59.6
69.7
77.0
84.1
87.1
99.3
103.4
104.6
109.8
2020
12.0
17.5
25.5
39.5
50.2
58.6
66.7
74.8
83.0
90.0
93.9
92.4
111.2
113.9
2021
11.6
19.9
26.5
37.4
48.0
58.5
66.7
74.9
84.0
91.7
97.7
102.1
105.8
115.0
2022
10.8
20.4
32.4
39.1
49.3
58.4
68.7
75.3
84.1
92.5
98.2
102.6
113.2
2023
11.4
19.7
32.3
42.2
50.0
59.1
67.6
75.9
81.7
86.8
104.2
104.1
115.6
Table A5. North East Arctic COD. Length (cm) at-age in the Barents Sea from the investigations winter survey in February. Data for ages 1-11 from 1994 and onwards - WD 1, WKBarFar 2021.
Year \ Age
1
2
3
4
5
6
7
8
9
10
11
12
13
14
1983
20
190
372
923
1597
2442
3821
4758
1984
23
219
421
1155
1806
2793
3777
4566
1985
20
171
576
1003
2019
3353
5015
6154
1986
20
119
377
997
1623
2926
3838
7385
1987
21
65
230
490
1380
2300
3970
6000
1988
24
114
241
492
892
1635
3040
4373
1989
16
158
374
604
947
1535
2582
4906
10943
5226
1990
26
217
580
1009
1435
1977
2829
4435
10772
11045
9615
1991
18
196
805
1364
2067
2806
3557
4502
7404
13447
1992
20
136
619
1118
1912
2792
3933
5127
6420
8103
17705
22060
1993
9
71
415
1179
1743
2742
3977
5758
7068
7515
7521
10744
1994
13
56
262
796
1470
2386
3481
4603
6777
8195
8516
13972
1995
15
54
240
658
1336
2207
3570
4715
5712
8816
6817
12331
1996
15
62
232
627
1084
1980
3343
5514
7722
8873
9613
12865
12556
1997
13
52
230
638
1175
1797
2931
4875
7529
5739
10194
1998
11
52
280
635
1182
1728
2588
4026
6076
11257
14391
1999
14
59
231
592
1178
1829
2991
4128
6321
7342
2000
16
74
210
558
1210
1963
3036
3867
5401
6154
10023
2001
14
106
336
646
1288
2233
3088
4439
5732
8442
11429
2002
14
67
238
747
1229
2063
3199
4578
7525
6598
12292
2003
13
61
234
597
1316
2014
2989
4715
6517
7500
12812
2004
11
59
275
608
1143
1947
2623
4137
6673
7368
8109
2005
13
61
246
723
1146
1866
2949
4226
6436
8646
12537
24221
11640
2006
13
69
280
669
1420
1970
2641
4260
5914
10179
9439
8328
2007
19
73
235
639
1302
2190
3039
4411
6394
8056
10826
20104
2008
15
90
335
798
1399
2442
3235
5210
6981
9641
2009
13
83
294
704
1302
2065
4067
5087
6874
9460
9511
2010
12
64
304
700
1296
2033
3162
4743
6562
8984
10315
22766
2011
15
66
246
668
1131
1940
2726
4013
5969
8275
10309
13159
14868
2012
13
62
252
609
1276
1681
2489
3764
5920
7809
12199
15006
17582
2013
11
65
269
602
1208
2055
2809
3843
4822
8447
9101
15108
14743
2014
8
50
246
603
1226
1780
2866
3930
4927
6203
8570
9566
12239
2015
10
44
242
602
1221
1929
2741
4043
4804
6817
7759
11544
21652
2016
13
53
200
593
1049
1928
2674
3830
5540
6129
7110
8272
15256
21945
2017
15
102
292
720
1178
1972
3056
3962
5901
7429
9301
8599
12958
14894
2018
12
69
320
688
1228
2062
2803
4154
5409
6632
9156
10510
11810
12443
2019
12
48
273
685
1164
1870
2916
3974
5394
6068
9637
11507
12371
13993
2020
14
44
153
548
1077
1692
2476
3625
5074
6758
8040
8107
14892
15793
2021
14
68
164
462
910
1682
2484
3620
5379
7160
9313
10923
12410
2022
11
77
311
535
1052
1716
2885
3855
5321
7751
9538
11432
14940
2023
12
71
316
694
1111
1757
2802
4097
5119
6443
10937
10668
14732
Table A6. North East Arctic COD. Weight (g) at-age in the Barents Sea from the investigations winter survey in February. Data for ages 1-11 from 1994 and onwards - WD 1, WKBarFar 2021.
Year/age
5
6
7
8
9
10
11
12
13
14
12+
1985
59.6
71.1
79.0
88.2
97.3
105.2
114.0
1986
62.7
70.0
80.0
89.4
86.6
105.8
115.0
1987
58.2
64.5
76.7
86.2
88.0
118.5
116.0
1988
53.1
67.1
71.6
94.0
97.0
119.6
1989
54.0
59.0
69.8
80.8
96.6
103.0
125.0
1990
56.9
65.1
69.2
79.5
83.7
100.1
1991
59.0
67.3
74.4
81.0
91.3
99.8
85.0
1992
66.3
68.7
78.3
83.9
89.2
92.2
101.9
127.0
1993
58.3
66.1
72.8
83.6
87.4
92.7
95.4
111.2
1994
64.3
70.6
82.0
87.3
90.0
95.3
92.4
101.4
1995
61.5
69.7
77.8
84.4
92.6
96.7
100.3
99.5
1996
62.2
67.1
75.9
81.0
93.6
100.9
97.4
104.1
1997
63.7
68.6
74.2
83.8
99.9
108.4
109.0
1998
55.0
62.6
70.2
80.0
92.0
98.0
96.7
115.0
1999
52.7
67.0
69.4
78.6
85.8
100.3
102.0
125.0
2000
58.4
66.5
72.6
77.0
83.9
90.6
93.7
112.4
2001
59.3
66.9
73.2
87.1
88.7
102.8
98.5
128.2
2002
58.6
66.0
73.2
80.8
88.2
101.8
91.0
101.4
2003
62.3
65.0
73.2
80.9
88.9
86.4
120.0
122.0
2004
58.8
64.7
71.2
80.1
85.6
97.0
102.6
115.8
2005
56.3
65.4
72.3
76.0
85.3
95.5
110.5
117.8
2006
56.2
63.7
72.6
77.5
82.9
88.3
89.2
116.3
2007
63.0
66.4
72.4
82.5
88.2
99.8
103.7
115.0
2008
63.8
69.1
73.6
80.9
90.0
94.9
94.9
96.5
2009
60.5
69.3
76.5
82.7
88.7
98.8
92.9
111.6
2010
59.9
64.9
73.6
83.3
89.2
96.3
100.8
103.1
118.2
123.0
2011
57.1
64.3
70.0
79.9
91.2
98.3
101.6
103.6
110.0
102.0
2012
65.3
65.1
69.9
76.6
85.3
98.7
104.6
103.9
116.2
89.0
2013
63.6
68.7
73.0
78.4
83.5
90.9
99.1
96.6
103.0
116.8
2014
55.9
66.0
74.5
77.9
82.8
86.8
93.4
99.1
109.2
116.0
2015
61.0
66.5
72.9
78.6
83.4
89.0
95.4
99.5
106.1
114.5
2016
64.0
63.0
74.3
81.1
88.8
93.2
95.5
97.1
103.2
117.1
2017
58.0
64.8
70.7
81.6
87.3
94.8
98.7
99.4
102.7
106.1
2018
67.9
67.3
72.9
79.5
89.4
93.6
99.3
104.9
104.3
107.9
2019
59.9
69.4
74.7
81.4
87.9
93.9
98.1
106.2
111.1
109.8
2020
66.1
68.3
75.1
81.8
88.9
95.1
96.3
106.0
109.5
109.1
2021
63.3
66.3
74.3
78.6
89.4
93.3
96.9
103.7
103.1
108.4
2022
61.4
67.9
72.9
81.0
88.4
96.5
100.1
98.3
99.3
104.0
2023
60.0
69.1
76.7
80.5
87.1
93.1
99.3
107.2
114.0
120.6
Table A7. Northeast Arctic COD. Length at age in cm in the Lofoten survey.
Year
5
6
7
8
9
10
11
12
13
14+
12+
1985
2.00
3.42
4.61
6.67
8.89
10.73
14.29
1986
2.22
3.22
4.74
6.40
5.80
10.84
13.48
1987
1.44
1.94
3.61
5.40
5.64
13.15
12.55
1988
1.46
2.82
3.39
6.63
7.27
13.64
1989
1.30
1.77
2.89
4.74
8.28
9.98
26.00
1990
1.54
2.32
2.55
3.78
4.77
8.80
1991
2.21
2.52
3.51
5.18
7.40
11.36
5.35
1992
2.56
2.85
3.99
5.43
6.35
8.03
9.50
17.80
1993
1.79
2.58
3.55
5.31
6.21
7.69
9.28
14.71
1994
2.31
3.27
5.06
6.39
6.64
7.92
7.73
10.10
1995
2.20
3.24
4.83
5.98
7.80
10.03
10.39
10.68
1996
2.22
2.75
4.11
5.63
7.92
10.53
10.58
12.08
1997
2.42
2.92
3.86
5.71
9.65
13.41
12.67
1998
1.88
2.09
2.98
4.85
7.92
9.91
11.05
18.34
1999
1.51
2.80
2.96
4.22
5.92
9.33
9.17
16.00
2000
1.71
2.50
3.16
3.85
5.32
7.07
7.62
12.84
2001
1.90
2.72
3.49
6.23
6.82
10.95
10.29
28.58
2002
1.87
2.57
3.52
4.71
6.18
10.56
8.70
10.48
2003
2.30
2.34
3.48
4.59
5.89
8.07
24.50
27.70
2004
1.74
2.30
3.02
4.50
5.77
7.81
9.95
13.25
2005
1.56
2.40
3.20
3.71
5.79
8.52
16.27
18.63
2006
1.54
2.35
3.44
4.19
5.43
6.57
6.19
18.15
2007
2.34
2.67
3.53
5.30
6.70
9.95
11.24
16.62
2008
2.21
2.97
3.63
4.88
6.74
8.18
7.70
9.07
2009
2.04
2.98
4.10
5.19
6.56
9.38
8.58
15.67
2010
1.90
2.46
3.47
5.13
6.26
7.83
9.59
10.77
18.31
20.84
2011
1.66
2.28
2.89
4.52
6.82
8.82
9.55
9.08
13.38
10.70
2012
3.07
2.47
2.93
3.89
5.37
8.79
11.53
12.28
15.04
5.41
2013
2.49
3.05
3.52
4.46
5.54
7.56
10.26
10.23
11.49
16.61
2014
1.90
2.52
3.80
4.04
5.06
5.96
7.36
9.01
12.20
16.95
2015
2.16
2.62
3.42
3.95
5.21
6.53
8.32
9.95
12.45
14.21
2016
2.53
2.31
3.72
5.05
6.79
8.03
8.93
9.02
12.12
18.46
2017
2.01
2.52
2.94
4.91
5.75
7.16
8.18
9.10
10.49
11.59
2018
3.25
2.77
3.41
4.53
6.51
7.94
9.65
12.05
12.04
12.85
2019
2.12
3.02
3.76
4.81
6.07
7.44
8.71
11.06
13.86
13.40
2020
2.75
2.79
3.64
4.69
6.06
7.78
8.70
10.86
12.93
13.95
2021
2.30
2.62
3.76
4.40
6.59
7.39
8.56
10.15
11.821
14.79
2022
2.61
3.00
3.59
5.01
7.15
8.34
9.34
9.35
9.41
11.63
2023
1.86
2.94
4.16
4.84
6.00
7.19
9.36
11.88
15.31
17.69
Table A8. Northeast Arctic COD. Mean weight-at-age (kg) in the Lofoten survey.
Year
Age
1
2
3
4
5
6
7
8
9
10+
Total
1985
1
77
569
400
568
244
51
20
8
1
3
1941
1986
1
25
129
899
612
238
69
20
3
2
1
1998
1987
2
2
58
103
855
198
82
19
4
1
1
1323
1988
2
3
23
96
100
305
54
16
3
1
1
602
1989
1
1
3
17
45
57
91
75
25
13
5
332
1990
1
36
27
8
27
62
74
91
39
10
3
377
1991
1
63
65
96
45
50
54
66
49
5
1
494
1992
1
133
399
380
121
56
58
33
29
11
2
1222
1993
1
20
44
220
234
164
51
19
13
8
10
783
1994
1
105
38
147
275
303
314
100
35
10
8
1335
1995
1
242
42
111
219
229
97
21
6
2
2
971
1996
1,3,5
424
275
189
316
449
314
126
27
3
4
2127
1997
4,5
72
160
263
198
112
57
27
9
1
1
900
1998
1
26
86
279
186
57
23
10
4
1
0
672
1999
1
19
79
166
260
98
20
8
5
2
1
658
2000
1,rev
24
82
191
159
127
48
6
3
1
1
642
2001
1
38
59
148
204
120
70
14
2
1
656
2002
1,5,6
83
2
106
85
140
151
67
30
7
1
672
2003
69
36
25
218
142
167
163
60
23
4
908
2004
375
35
170
85
345
194
229
167
49
19
1669
2005
112
48
65
154
70
214
68
47
17
8
803
2006
7
12
20
39
49
78
32
64
23
13
8
341
2007
13
35
165
372
208
189
74
113
32
20
1221
1
October-December
2
September-October
3
Area IIb not covered
4
Areas IIa, IIb covered in October-December, part of Area I covered in February-March 1998
5
Adjusted for incomplete area coverage
6
Area IIa not covered
7
Area I not fully covered
Table A9. Northeast Arctic COD. Results from the Russian trawl-acoustic survey in the Barents Sea and adjacent waters in the autumn. Stock number in millions.
Year
Age
0
1
2
3
4
5
6
7
8
9
10
11
12
13+
Sum
1982
849.3
1905.3
33.2
141.3
152.5
72.1
19.8
55.1
17.4
3.7
1.9
1.5
0.1
0.0
3253.3
1983
1872.2
2003.4
73.2
52.0
64.2
50.6
35.8
17.9
25.2
9.4
0
0
0
0
4203.9
1984
363.3
180.5
104.4
118.9
70.0
48.9
35.7
15.4
6.9
6.1
1.7
1.5
0.6
0.2
954.0
1985
284.6
15.6
129.0
118.8
159.2
106.8
36.5
16.5
3.7
0.8
1.6
0.1
2.1
0.0
875.3
1986
329.9
7.6
31.7
162.2
153.2
149.3
48.1
18.9
4.2
0.2
0.6
0.0
0.0
0.0
905.9
1987
7.7
1.3
46.9
55.7
307.6
90.0
70.1
18.4
6.0
2.5
0.4
0.1
0.3
0.0
607.0
1988
92.5
2.9
31.3
99.3
93.8
287.9
58.3
26.0
4.7
2.4
0.1
0.0
0.0
0.0
699.2
1989
355.8
3.0
14.7
49.0
97.8
106.2
145.4
116.7
29.9
11.2
4.7
1.8
0.7
0.5
937.4
1990
1248.4
31.1
51.0
16.7
48.7
62.7
97.2
153.8
67.3
15.3
4.9
0.9
0.2
0.0
1798.2
1991
974.0
64.0
91.1
107.7
48.4
53.2
58.3
68.5
74.7
9.8
1.4
0.3
0.0
0.0
1551.4
1992
1204.8
157.7
151.1
67.5
30.8
23.9
27.3
21.8
17.5
2.5
2.5
0.4
0.0
0.0
1707.8
1993
484.8
38.0
158.6
160.4
113.5
68.1
41.6
35.4
8.7
0.3
0.7
0.1
0.1
0.0
1110.3
1994
1606.6
833.2
69.9
136.3
130.9
101.9
35.4
12.8
4.9
2.1
1.1
0.6
0.2
0.0
2935.9
1995
5703.5
471.9
36.9
58.9
106.5
139.5
84.9
25.1
8.3
1.9
1.8
0.9
0.6
0.0
6640.8
1996
2660.3
396.5
128.5
73.3
78.4
103.5
77.3
34.8
13.2
1.9
0.5
1.2
0.2
0.0
3569.6
1997
1371.4
353.9
135.3
134.2
83.5
61.3
60.2
34.8
11.6
3.2
3.0
0.0
0.0
0.0
2252.4
1998
304.8
276.8
89.6
202.8
136.3
78.8
47.0
25.9
13.0
4.8
0.5
0.0
0.1
0.0
1180.4
1999
266.9
40.1
118.4
158.7
207.2
98.0
30.1
12.3
9.4
4.2
0.4
0.0
0.0
0.0
945.7
2000
1436.5
37.7
103.6
183.9
128.6
178.6
77.3
11.4
5.2
2.3
0.9
0.4
0.0
0.0
2166.4
2001
321.6
233.8
77.3
122.4
155.7
129.0
106.1
30.4
5.0
1.4
0.5
2.5
1.3
0.0
1187.1
2002
1797.9
26.7
135.6
98.0
147.3
147.3
89.6
60.0
18.2
2.9
0.8
0.1
0.1
0.0
2524.4
2003
489.5
517.5
26.8
124.6
105.7
116.6
120.3
53.5
24.1
4.0
0.9
0.3
0.0
0.1
1583.9
2004
1770.4
158.4
87.5
32.9
157.6
88.0
111.1
77.6
27.9
9.3
2.3
0.4
0.2
0.0
2523.6
2005
2298.0
323.9
61.7
140.8
63.1
183.2
74.4
60.5
24.4
8.8
2.8
0.6
0.1
0.0
3242.4
2006
427.4
52.4
63.2
92.7
161.3
77.7
180.1
66.2
34.2
16.1
4.3
1.7
0.7
0.0
1178.1
2007
177.5
37.0
148.6
257.9
161.7
190.3
84.6
152.5
55.3
22.6
8.6
4.9
1.1
0.7
1303.3
2008
1468.6
45.2
86.3
220.3
308.8
163.5
147.2
83.0
86.3
29.1
11.5
3.3
1.7
0.2
2654.9
2009
1877.7
287.8
21.9
97.4
231.7
368.7
201.6
117.5
62.0
41.3
20.5
6.5
3.2
0.9
3338.7
2010*
2210.4
214.9
47.0
33.4
107.0
250.5
371.5
181.7
78.9
39.5
29.9
15.6
5.5
2.0
3587.7
2011
2296.1
125.9
80.0
88.2
50.8
143.2
306.5
330.0
91.7
43.9
17.6
17.5
7.0
3.5
3602.1
2012
1096.0
196.2
45.1
81.5
111.4
83.9
212.2
335.8
187.8
43.2
19.5
4.6
5.7
1.9
2424.8
2013
297.1
654.0
107.6
74.7
117.4
117.7
88.4
234.9
313.2
136.7
30.6
9.2
5.4
4.5
2191.5
2014
909.7
211.0
72.1
139.9
136.8
172.5
148.3
111.1
192.9
129.7
38.3
9.3
3.5
2.0
2277.1
2015
572.9
465.4
51.5
65.7
158.3
174.2
193.2
161.0
92.5
115.8
76.1
24.2
6.5
4.9
2162.0
2016
NA
NA
NA
NA
NA
NA
NA
NA
NA
NA
NA
NA
NA
NA
2017
4325.9
5257.4
94.5
145.6
88.4
106.3
195.2
123.1
56.7
26.6
12.0
12.0
7.5
2.8
10454.0
2018
NA
NA
NA
NA
NA
NA
NA
NA
NA
NA
NA
NA
NA
NA
2019
NA
NA
NA
NA
NA
NA
NA
NA
NA
NA
NA
NA
NA
NA
Table A10. Northeast Arctic COD. Abundance indices (millions) from the Russian bottom trawl survey in the Barents Sea. Total (Sub-area I and Division IIa and IIb).
*revised
Year
Age
0
1
2
3
4
5
6
7
8
9
10
11
12
1984
15.7
22.3
30.7
44.3
51.7
63.6
73.4
82.5
88.4
97.0
-
-
-
1985
15.0
21.1
30.6
43.2
53.7
61.2
72.8
83.0
92.8
101.3
-
-
-
1986
15.2
19.7
28.3
39.0
51.8
62.2
70.9
83.0
91.3
104.0
-
-
-
1987
-
19.2
27.9
33.4
41.4
59.1
69.2
80.1
95.7
102.6
-
-
-
1988
11.3
21.3
28.7
36.2
43.9
53.3
65.3
79.5
85.0
-
-
-
-
1989
-
20.8
28.8
34.8
46.0
53.9
61.8
69.8
78.7
88.6
-
-
-
1990
16.0
24.0
30.4
46.5
54.9
62.5
69.7
77.6
87.8
102.0
-
-
-
1991
11.5
22.4
30.6
43.0
55.9
64.6
72.8
78.5
87.9
101.8
-
-
-
1992
11.3
21.3
31.9
50.1
59.8
69.1
78.6
84.0
90.8
97.5
-
-
-
1993
12.1
17.4
29.1
43.4
52.7
64.3
73.9
81.2
89.1
91.8
-
-
-
1994
12.2
20.3
26.3
33.7
47.4
58.7
70.6
80.8
90.1
96.1
-
-
-
1995
11.6
19.8
27.6
33.8
45.2
60.5
71.1
83.5
92.9
99.1
-
-
-
1996
10.2
20.0
28.1
36.7
48.7
58.9
70.5
80.0
93.6
102.7
-
-
-
1997
9.6
18.5
28.8
38.2
50.8
62.0
70.5
80.1
88.9
103.5
-
-
-
1998
11.4
19.0
28.0
36.4
50.5
61.0
70.7
80.3
91.1
102.5
-
-
-
1999
11.7
19.7
27.9
35.3
51.6
60.6
70.6
78.9
86.8
94.3
-
-
-
2000
10.7
20.8
30.1
34.7
49.8
61.1
71.6
82.0
88.3
85.7
104.2
-
-
2001
10.6
19.4
29.8
37.3
50.4
61.9
71.9
81.4
91.0
98.7
103.8
-
-
2002
10.7
19.2
29.9
38.2
52.5
60.4
70.6
82.2
91.3
97.2
104.1
-
-
2003
9.8
18.9
28.3
34.9
49.2
62.2
71.0
81.5
92.3
100.9
104.3
-
-
2004
9.8
19.6
29.3
38.4
49.1
60.0
70.5
80.0
91.0
98.0
106.0
-
-
2005
11.2
19.4
29.7
38.5
48.7
59.3
69.3
79.2
87.7
96.1
104.4
-
-
2006
13.0
21.9
31.6
42.7
53.2
60.1
70.2
79.1
88.3
95.2
107.7
-
-
2007
10.7
21.5
30.8
42.2
53.6
63.7
71.0
79.6
87.3
95.9
-
-
-
2008
10.2
20.0
30.3
40.2
53.7
64.5
74.6
82.7
89.5
98.2
102.3
110.2
111.9
2009
12.9
19.3
29.5
38.4
50.7
61.5
70.7
81.7
89.9
94.7
101.8
105.9
109.4
2010
11.1
19.3
28.7
38.5
48.9
59.1
68.0
78.4
88.2
97.3
102.5
108.4
117.7
2011
11.2
20.3
29.2
38.5
49.5
58.6
68.7
78.2
90.0
97.9
106.9
109.3
116.0
2012
11.0
20.3
31.1
40.8
50.8
60.7
68.4
77.6
87.4
97.7
105.2
111.7
116.6
2013
9.5
19.5
29.0
40.3
50.4
59.3
67.3
75.3
84.4
95.3
104.5
111.9
119.4
2014
10.1
20.1
29.8
39.2
50.7
60.9
69.4
77.9
85.1
93.6
102.7
113.3
122.8
2015
11.5
19.0
28.5
37.5
48.0
58.4
67.4
76.3
83.5
91.0
98.8
107.1
117.9
2016
-
-
-
-
-
-
-
-
-
-
-
-
-
2017
15
21
31
40
52
59
67
76
85
92.6
97.9
104
110.1
2018
-
-
-
-
-
-
-
-
-
-
-
-
-
2019
-
-
-
-
-
-
-
-
-
-
-
-
-
Table A11. Northeast Arctic COD. Length-at-age (cm) from Russian surveys in November-December.
Age
Year
0
1
2
3
4
5
6
7
8
9
10
11
12
1984
26
90
250
746
1187
2234
3422
5027
6479
9503
-
-
-
1985
26
80
245
762
1296
1924
3346
5094
7360
6833
11167
-
-
1986
25
63
191
506
1117
1940
2949
4942
7406
9300
-
-
-
1987
-
54
182
316
672
1691
2688
3959
8353
10583
13107
-
-
1988
15
78
223
435
789
1373
2609
4465
5816
-
-
-
-
1989
-
73
216
401
928
1427
2200
3133
4649
6801
8956
-
-
1990
28
106
230
908
1418
2092
2897
4131
6359
10078
13540
-
-
1991
26
93
260
743
1629
2623
3816
4975
7198
11165
15353
-
-
1992
10
76
273
1165
1895
2971
4377
5596
7319
9452
12414
-
-
1993
11
46
211
717
1280
2293
3509
4902
6621
7339
8494
-
-
1994
12
69
153
316
919
1670
2884
4505
6520
8207
9812
-
-
1995
11
61
180
337
861
1987
3298
5427
7614
9787
10757
-
-
1996
7
64
191
436
1035
1834
3329
5001
8203
10898
11358
-
-
1997
6
48
203
487
1176
2142
3220
4805
6925
10823
12426
-
-
1998
11
55
187
435
1186
2050
3096
4759
7044
11207
12593
-
-
1999
10
58
177
371
1214
1925
3064
4378
6128
7843
11543
-
-
2000
8
74
232
379
1101
2128
3341
5054
6560
8497
12353
-
-
2001
9
58
221
459
1125
2078
3329
4950
7270
9541
11672
-
-
2002
8
65
232
505
1299
1964
3271
5325
7249
9195
11389
-
-
2003
6
49
205
492
972
1993
2953
4393
6638
9319
11085
-
-
2004
6
55
231
543
1079
1798
2977
4110
5822
8061
12442
-
-
2005
10
59
223
521
1034
1910
3036
4619
6580
9106
12006
-
-
2006
13
72
270
707
1332
1953
2969
4340
6410
8622
12436
-
-
2007
10
96
252
669
1344
2277
3140
4691
6178
8567
10014
-
-
2008
7
58
228
558
1332
2305
3527
5001
6519
8848
10339
13276
15196
2009
15
54
214
495
1116
2024
3090
4876
6592
8087
10262
11472
13268
2010
9
54
191
794
989
1784
2719
4246
6384
8747
10499
12117
14199
2011
10
63
206
486
1037
1691
2827
4312
6698
8979
11557
12915
15694
2012
9
62
237
561
1087
1877
2688
3974
5930
8495
11000
13377
14826
2013
5
55
202
546
1062
1718
2541
3667
5258
7821
10509
13161
16581
2014
7
64
221
508
1079
1849
2734
3994
5418
7480
10100
14163
18404
2015
11
55
198
452
947
1735
2588
3728
5081
6827
8877
11623
15626
2016
-
-
-
-
-
-
-
-
-
-
-
-
-
2017
22
69
248
571
1150
1771
2539
3819
5426
7554
9236
11220
13536
2018
-
-
-
-
-
-
-
-
-
-
-
-
-
2019
-
-
-
-
-
-
-
-
-
-
-
-
-
Table A12. Northeast Arctic COD. Weight (g) at age from Russian surveys in November-December.
Age
Year
1
2
3
4
5
6
7
8
9
10
11
12
13+
12+
1985
69.1
446.3
153.0
141.6
20.4
15.1
15.7
3.3
1.3
1.0
0.5
na
na
0.0
1986
353.6
243.9
499.6
134.3
68.4
11.6
7.7
3.1
0.3
0.0
0.4
na
na
0.1
1987
1.6
34.1
62.8
204.9
50.2
17.4
1.4
3.0
0.7
0.0
0.0
na
na
0.0
1988
2.0
26.3
50.4
35.5
57.8
10.9
4.0
0.3
0.0
0.1
0.0
na
na
0.0
1989
7.5
8.0
17.0
34.4
21.4
67.0
16.6
3.2
0.5
0.2
0.0
na
na
0.1
1990
81.1
24.9
14.8
20.6
26.2
26.9
66.8
7.3
0.6
0.3
0.0
na
na
0.0
1991
181.0
219.5
50.2
34.6
29.3
33.9
36.7
50.0
3.7
0.2
0.2
na
na
0.0
1992
241.4
562.1
176.5
65.8
21.5
18.4
28.4
25.4
82.4
4.3
1.7
na
na
0.2
1993
1074.0
494.7
357.2
191.1
113.1
35.4
25.5
25.2
27.7
44.2
4.9
na
na
0.8
1994
902.6
624.4
323.9
374.5
229.3
96.1
23.4
11.8
10.3
4.2
18.7
na
na
2.9
1995
2175.3
212.3
137.7
139.5
203.6
101.6
28.1
4.7
4.5
2.9
2.6
na
na
8.1
1996
1826.3
271.7
99.4
89.6
112.8
97.4
46.2
5.9
1.1
0.4
0.9
na
na
1.5
1997
1698.5
565.3
158.6
44.2
50.3
45.9
51.0
21.5
2.3
0.7
0.1
na
na
0.8
1998
2523.6
475.2
391.2
189.8
44.9
41.5
34.9
27.1
5.1
1.0
0.2
na
na
0.1
1999
364.8
231.5
147.6
130.3
52.3
13.9
11.8
18.7
9.9
1.0
0.2
na
na
0.1
2000
153.4
262.8
294.8
167.3
149.2
54.6
14.6
6.9
5.0
1.3
0.6
na
na
0.2
2001
363.6
51.5
177.4
160.6
85.1
62.1
19.1
2.7
0.8
0.6
0.3
na
na
0.1
2002
19.2
209.1
61.4
106.2
101.1
71.3
36.6
9.4
1.2
0.8
0.6
na
na
0.0
2003
1505.0
52.5
306.7
116.8
127.1
146.1
67.7
23.5
3.8
0.4
0.1
na
na
0.2
2004
161.2
117.2
33.4
85.2
34.9
45.6
48.0
21.7
8.8
2.4
0.2
na
na
0.7
2005
499.7
138.7
125.0
33.3
69.3
34.1
43.8
18.0
7.5
1.8
0.1
na
na
0.3
2006
411.2
158.0
64.8
53.8
18.6
42.0
17.6
15.9
8.7
2.3
0.3
na
na
1.0
2007
85.1
47.1
58.5
30.4
30.8
12.9
46.6
15.1
8.0
3.3
0.9
na
na
0.4
2008
50.9
94.2
199.9
288.7
116.6
78.9
24.8
35.2
5.5
2.8
1.7
na
na
0.7
2009
204.9
25.5
107.8
182.5
141.5
56.0
41.5
12.8
26.6
3.6
1.7
na
na
0.4
2010
620.3
43.6
22.8
88.0
161.4
175.0
61.8
31.4
10.8
12.5
4.0
2.0
0.9
2.9
2011
266.0
91.0
40.4
28.3
67.4
159.5
272.7
64.5
23.3
6.8
7.5
0.4
0.5
0.9
2012
496.5
40.2
82.8
49.4
34.4
89.5
226.6
133.5
25.7
10.4
3.8
1.8
1.0
2.8
2013
313.1
89.2
60.6
84.5
72.4
54.1
133.6
233.8
161.7
21.5
11.1
5.5
3.2
8.8
2014
1758.6
211.0
286.9
124.2
111.5
77.7
55.3
149.0
173.9
98.0
14.6
6.8
3.8
10.5
2015
1903.5
211.4
138.7
235.6
130.0
144.2
96.4
49.8
96.9
68.6
32.5
6.6
6.1
12.7
2016
240.8
201.9
56.3
76.9
119.9
66.4
59.4
40.9
35.6
56.5
34.4
17.6
11.0
28.6
2017
439.4
73.3
111.5
42.4
44.4
74.2
48.6
48.4
26.8
16.7
14.6
15.1
7.8
23.0
2018
2057.6
280.3
109.0
149.9
54.0
58.4
77.5
45.6
19.3
14.1
6.1
6.0
7.8
13.7
2019
1437.2
362.4
203.6
125.4
144.6
63.9
49.3
73.9
27.3
21.8
6.5
2.9
8.1
11.1
2020
92.7
157.9
117.3
117.3
81.9
94.3
50.6
50.9
49.5
19.5
8.4
2.6
5.4
8.0
2021*
45.9
28.5
64.9
59.1
55.8
40.2
36.9
16.3
11.4
14.3
8.2
1.9
1.6
3.4
2022
524.7
43.4
29.4
53.0
57.0
50.4
47.5
34.5
11.6
6.8
5.3
2.2
1.8
3.9
2023
244.4
103.2
28.7
26.5
33.6
34.6
27.8
18.3
13.5
3.2
1.7
0.8
0.7
1.5
Table A13. Northeast Arctic COD. Sum of acoustic abundance estimates (millions) in the Joint winter Barents Sea survey (Table A2) and the Norwegian Lofoten acoustic survey (Table A4).
* revised
Y ear
0
1
2
3
4
5
6
7
8
9
10
11
12
13+
2004
543.0
330.6
329.7
147.7
421.5
150.2
79.8
40.2
10.1
2.2
0.5
0.1
0.1
0.1
2005
180.2
440.7
146.6
216.6
55.8
100.9
28.0
15.6
5.7
1.2
0.5
0.1
0.0
0.1
2006
276.0
479.0
509.7
186.1
205.6
59.9
69.8
17.6
8.1
2.6
0.6
0.2
0.0
0.0
2007
101.0
333.3
505.4
586.2
159.2
79.1
24.6
26.9
6.0
2.2
0.9
0.1
0.2
0.0
2008
483.4
130.9
372.6
652.6
483.4
132.3
51.1
12.8
17.5
3.3
0.9
0.2
0.2
0.2
2009
903.3
569.7
93.5
202.3
280.6
289.6
101.7
31.9
12.7
7.3
2.6
0.8
0.3
0.2
2010
652.6
310.3
84.2
56.8
177.0
397.2
424.9
142.7
38.5
10.5
6.8
1.6
0.3
0.3
2011
2083.0
509.8
160.0
123.6
101.5
240.2
300.4
178.4
32.3
7.7
1.8
1.3
0.6
0.3
2012
1412.7
1454.3
255.9
229.1
146.4
70.0
150.8
165.2
84.5
12.7
4.4
1.6
1.4
0.6
2013
2281.8
914.2
659.0
249.1
183.6
125.7
63.2
118.2
130.2
53.8
9.1
3.3
1.5
0.9
2014
2445.2
308.2
155.1
190.0
108.6
93.9
52.8
30.4
50.2
36.3
12.1
3.4
1.0
1.4
2014 *
2445.2
339.0
184.0
226.3
122.2
103.4
67.7
42.1
81.3
78.9
28.1
4.7
1.3
1.5
2015
350.9
725.3
154.0
174.4
225.2
141.3
72.6
48.6
26.2
35.3
26.6
7.9
1.7
1.0
2016
1164.8
350.8
341.3
77.2
93.7
121.6
70.1
44.4
27.2
13.8
13.2
5.4
1.7
1.4
2017
2316.3
757.5
260.6
375.0
141.5
104.9
120.9
62.6
28.0
11.2
6.4
4.4
4.5
2.7
2018*
1841.2
2100.3
413.8
183.6
148.9
60.0
37.6
57.1
20.2
14.4
5.8
3.6
3.5
2.8
2019
313.4
560.2
475.2
416.6
232.3
215.1
76.6
42.2
44.4
16.1
4.9
2.2
1.1
1.8
2020**
115.6
63.5
106.3
139.5
135.6
93.4
82.9
30.8
14.2
10.7
3.1
1.0
0.5
1.0
2021
749.1
62.1
51.2
84.7
99.8
81.1
45.7
33.6
12.4
4.7
5.0
2.4
1.0
0.7
2022***
399.2
218.2
39.6
25.6
32.8
34.4
33.8
18.6
9.8
2.5
0.8
0.5
0.1
0.2
Table A14. Swept area estimates (millions) of Northeast Arctic Cod from the Joint Norwegian- Russian ecosystem survey in August-September (2020 data are taken from WD 01 AFWG 2021).
*data adjusted taking into account not complete area coverage
** revised
*** incomplete and unsynoptic coverage
Year
0
1
2
3
4
5
6
7
8
9
10
11
12
13
14
15
16
17
2004
30
127
415
823
1464
2448
3266
4608
6323
9444
18331
13830
-
15924
2005
37
162
428
985
1723
2553
3697
4808
5958
8583
7662
-
8799
-
2006
39
155
473
1068
1759
2723
3725
5220
6798
10769
8904
9520
-
-
2007
52
173
523
1237
2078
3004
4163
5860
7638
11251
-
12683
-
15529
2008
39
193
511
1154
1958
3187
4262
5793
7741
9563
12039
11149
16320
-
2009
29
164
462
989
1614
2453
4034
5313
6334
7595
8221
12001
12040
-
2010
37
152
470
946
1634
2551
3801
5381
6921
7986
9063
8868
13406
19217
2011
35
143
419
991
1672
2523
3500
4812
6826
9403
12623
10379
10945
-
2012
34
149
418
904
1634
2388
3276
4344
6466
8459
9798
11181
14621
10895
2013
28
129
429
918
1553
2249
3230
4443
5805
8454
9817
12531
14308
17723
2014
28
148
374
897
1684
2244
3501
4511
5933
7183
7894
11979
7602
13250
2015
28
149
414
823
1483
2297
3219
4490
5635
6962
8478
12148
10385
15370
2016
45
162
527
914
1563
2308
3324
4492
6472
7476
8689
10939
7485
16645
2017
37
185
441
953
1660
2414
3398
4821
5876
7173
8345
9968
12765
12445
2018
-
-
-
-
-
-
-
-
-
-
-
-
-
-
2019
28
103
386
899
1458
2208
3369
4508
6355
7734
9351
9147
11394
11403
2020*
38
125
343
864
1514
2311
3204
4609
6020
7589
8685
10474
12242
13537
10724
14504
19800
2021
41
200
359
714
1278
2224
3196
4482
6355
7527
9165
10910
12089
15930
17193
2022
33
169
499
828
1451
2415
3688
5088
7184
7581
12774
17880
Table A15. Mean weight at age of cod (g), data from bottom trawls Barents Sea Ecosystem survey. StoX calculations.
*revised
Year/age
1
2
3
4
5
6
7
8
9
10
11
1985
0.02
0.171
0.576
1.003
2.018
3.386
4.696
6.636
8.245
10.321
14.290
1986
0.02
0.119
0.377
0.997
1.645
3.010
4.488
6.518
4.218
0.000
13.480
1987
0.021
0.065
0.23
0.49
1.390
2.155
3.913
5.438
0.322
12.550
1988
0.024
0.114
0.241
0.492
0.907
2.116
3.269
4.937
3.635
13.640
1989
0.016
0.158
0.374
0.604
0.948
1.581
2.762
4.791
8.835
8.582
1990
0.026
0.217
0.58
1.009
1.436
2.010
2.716
3.995
5.425
8.992
1991
0.018
0.196
0.805
1.364
2.067
2.764
3.532
4.945
7.401
11.645
5.350
1992
0.02
0.136
0.619
1.118
1.994
2.808
3.975
5.376
6.352
8.034
9.500
1993
0.009
0.071
0.415
1.179
1.745
2.675
3.686
5.399
6.280
7.680
9.280
1994
0.013
0.056
0.262
0.796
1.557
2.624
4.181
5.846
6.675
7.966
7.778
1995
0.015
0.054
0.24
0.658
1.364
2.565
4.124
5.326
7.379
9.895
9.738
1996
0.015
0.062
0.232
0.627
1.098
2.094
3.742
5.586
7.866
10.057
10.502
1997
0.013
0.052
0.23
0.638
1.185
1.918
3.433
5.515
8.889
10.408
12.405
1998
0.011
0.052
0.28
0.635
1.183
1.731
2.667
4.362
7.259
10.577
11.657
1999
0.014
0.059
0.231
0.592
1.180
1.964
2.978
4.200
5.980
8.848
9.642
2000
0.016
0.074
0.21
0.558
1.222
2.001
3.064
3.862
5.365
6.471
8.379
2001
0.014
0.106
0.336
0.646
1.319
2.371
3.257
5.078
6.186
10.084
10.558
2002
0.014
0.067
0.238
0.747
1.244
2.199
3.344
4.669
6.554
8.078
9.277
2003
0.013
0.061
0.234
0.597
1.335
2.080
3.207
4.643
6.206
7.649
17.062
2004
0.011
0.059
0.275
0.608
1.177
2.083
2.870
4.411
5.889
7.752
9.310
2005
0.013
0.061
0.246
0.723
1.166
2.068
3.114
3.852
5.877
8.538
14.573
2006
0.013
0.069
0.28
0.669
1.421
2.083
3.009
4.212
5.501
6.881
7.646
2007
0.019
0.073
0.235
0.639
1.351
2.334
3.340
4.923
6.598
9.649
11.132
2008
0.015
0.09
0.335
0.798
1.402
2.482
3.282
5.015
6.863
8.598
7.822
2009
0.013
0.083
0.294
0.704
1.320
2.302
4.089
5.152
6.611
9.391
8.657
2010
0.012
0.064
0.304
0.7
1.300
2.082
3.251
4.951
6.366
8.095
9.757
2011
0.015
0.066
0.246
0.668
1.146
2.050
2.830
4.367
6.592
8.681
9.647
2012
0.013
0.062
0.252
0.609
1.295
1.792
2.664
3.827
5.551
8.373
11.741
2013
0.011
0.065
0.269
0.602
1.212
2.163
2.988
4.103
5.292
7.782
9.842
2014
0.008
0.05
0.246
0.603
1.228
1.804
3.121
3.975
5.015
6.018
7.575
2015
0.01
0.044
0.242
0.602
1.227
1.936
2.849
4.015
4.981
6.630
8.187
2016
0.013
0.053
0.2
0.593
1.051
1.936
2.835
4.240
6.315
7.431
8.541
2017
0.015
0.102
0.292
0.72
1.181
2.024
3.026
4.363
5.817
7.223
8.405
2018
0.012
0.069
0.32
0.688
1.251
2.099
2.890
4.246
5.893
7.356
9.512
2019
0.012
0.048
0.273
0.685
1.165
1.908
3.139
4.384
5.833
7.221
8.788
2020
0.014
0.044
0.153
0.548
1.089
1.729
2.650
4.133
5.633
7.455
8.566
2021
0.014
0.068
0.164
0.462
0.918
1.721
2.696
3.807
5.916
7.314
8.762
2022
0.011
0.077
0.311
0.535
1.061
1.801
2.953
4.079
5.915
8.126
9.399
2023
0.012
0.071
0.316
0.694
1.113
1.782
2.997
4.330
5.537
6.824
9.661
Table A 16. Mean weight at age of cod (kg), combined data from winter survey and Lofoten survey.
4 - Haddock in subareas 1 and 2 (Northeast Arctic)
4.1 - Introductory note
On 30th March 2022 all Russian participation in ICES was suspended. The AFWG report 2023 chapter on haddock was therefore not updated.
In the present report, we have kept the main structure of the NEA haddock chapters in AFWG reports from the last years.
4.2 - Status of the fisheries
4.2.1 - Historical development of the fisheries
Haddock is mainly fished by trawl as bycatch in the fishery for cod. Also, a directed trawl fishery for haddock is conducted. The proportion of the total catches taken by direct fishery varies between years. On average approximately 70% of the catches are taken by trawl. Norway takes about half of the quota with other gear, in particular long line and Danish seine. Danish seine has become more important in the Norwegian fisheries the last 10 years. Some of the longline catches are from a directed fishery, which is restricted by national quotas. In the Norwegian management, the quotas are set separately for trawl and other gears. The fishery is also regulated by a minimum landing size (40 cm), a minimum mesh size in trawls and Danish seine, a maximum bycatch of undersized fish, closure of areas with high density/catches of juveniles and other seasonal and area restrictions.
The exploitation rate of haddock has been variable. The highest fishing mortalities for haddock have occurred at low to intermediate stock levels and historically show little relationship with the exploitation rate of cod, despite haddock being primarily caught as bycatch in the cod fishery. However, the more restrictive quota regulations introduced around 1990 have resulted in a more stable pattern in the exploitation rate.
The exceptionally strong year classes 2005–2006 contributed to the strong increase to all-time high stock levels and high catch levels in the last decade. Their importance in the catches is currently minimal. Currently, the 2017 and 2016 year-classes are dominating the catches.
The highest landings of haddock historically were 322 kt in 1973. Since 1973 the highest catches observed was 316 kt in 2012. The landings in 2018-2021were below 200 kt (Figure 4.1).
Provisional official landings for 2022 are about 177 kt, which is 1% below agreed TAC (178 kt).
In 2006 it was decided to include reported Norwegian landings of haddock from the Norwegian statistical areas 06 and 07 (i.e. between 62°N and Lofoten Islands). These areas were not previously included in the total landings of NEA haddock as input for this stock assessment (ICES CM 2006/ACFM:19; ICES CM 2006/ACFM:25).
Estimates of unreported catches (IUU catches) of haddock have been added to reported landings for the years from 2002 to 2008. Two estimates of IUU catches were available, one Norwegian and one Russian. At the benchmark in 2011 it was decided to base the final assessment on the Norwegian IUU estimates (ICES CM 2011/ACOM:38; Table 4.1).
We continue to include the estimates of IUU catches 2002–2008. The IUU catches are assumed to be negligible for the period 2009–2022 and therefore set to zero.
4.2.3 - Catch advice and TAC for 2023
The catch advice for 2023 was 170 kt and the Joint Norwegian-Russian Fisheries Commission set the TAC in accordance with the HCR. Furthermore, Russia and Norway can transfer the unused part of their own quota, restricted to a maximum of 10% of own quotas from 2022 to 2023.
4.3 - Status of research
4.3.1 - Survey results
Russia provided indices for 1982–2015 and 2017 for the Barents Sea trawl and acoustic survey (TAS) which was carried out in October–December (FLT01, RU-BTr-Q4). The survey was discontinued in 2018.
The Joint Barents Sea winter survey provides two index series used for tuning and recruitment forecast (bottom trawl: FLT02, NoRu-BTr-Q1 and acoustics: FLT04, NoRu-Aco-Q1). The survey area has been extended from 2014 with additional northern areas (N) covered. The extended area is now included in total and standard survey index calculations for haddock (WKDEM 2020) and is done using the StoX software (Johnsen et al. 2019). Overall, this survey tracks both strong and poor year classes well. The indices from the Joint winter survey of cod and haddock in the Barents Sea are provided in the annual survey reports from this survey (e.g., Fall et al. 2023). The spatial survey coverage in 2023 was relatively good, but more restricted compared to 2022, especially in the Northeast.
The Joint Barents Sea ecosystem survey provides indices by age from bottom trawl data ( FLT007, Eco-NoRu-Q3 Btr) used for tuning and recruitment forecast. At the benchmark in 2011 it was decided to include this survey as tuning series. Tuning indices by age from the Joint ecosystem survey is calculated using the BIOFOX programme (Prozorkevich and Gjøsæter 2014). The coverage in 2022 was not synoptic since the eastern Barents Sea was covered more than month later then the western Barents Sea. The problems with the survey were also evident when plotting internal consistency especially for the older ages, which could be explained by migration of older fish during the survey period. Therefore the 2022 indices from this survey were not used in the 2023 assessment. The indices for age 1 and 2 was used in the forecast, since younger fish migrate less and there were no apparent problems detected from the consistency plots for these ages.
The survey indices for ages used in tuning can be found in Table 4.9, and the survey indices used in recruitment forecast can be found in Table 4.16.
4.4 - Data used in the assessment
4.4.1 - Catch-at-age (Table 4.4)
Age and length composition of the landings in 2022 were available from Norway and Russia in Subarea 1 and Division 2.b, and from Norway, Russia, and Germany in Division 2.a. The biological sampling of NEA haddock catches is considered good for the most important ages in the fisheries .
Relevant data of estimated catch-at-age was obtained from InterCatch for the period 2008–2020 and is presented together with historical values from 1950–2007 in Table 4.4. For the 2021 and 2022 catch data allocation, instead of InterCatch, the same algorithm was realized in Excel. Excel was used for comparison with InterCatch in 2008-202 0 , and no differences between InterCatch and Excel allocations were detected.
4.4.2 - Catch-weight-at-age (Table 4.5)
The mean weight-at-age in the catch was obtained as a weighted average of the weight-at-age in the catch from Norway, Russia and Germany.
4.4.3 - Stock-weight-at-age (Table 4.6)
Since 1983 the stock weights-at-age (Table 4.6) are calculated using the average of the weight-at-age estimate from the Joint Barents Sea winter survey and the Russian bottom trawl survey. These averages are assumed to give representative values for the beginning of the year (see stock annex for details). However, the Russian bottom trawl survey has been discontinued and therefor stock weights-at-age were calculated using a correction factor (WKDEM 2020). Since the benchmark in 2006 stock weight at age has been smoothed (ICES 2006, see stock annex for details).
4.4.4 - Maturity-at-age (Table 4.7)
Since the benchmark 2006, smoothed estimates were produced separately for the Russian autumn survey and the Joint winter survey and then combined using arithmetic average. These averages are assumed to give representative values for the beginning of the year. However, the Russian bottom trawl survey has been discontinued and therefore stock weights-at-age were calculated using a correction factor (see WKDEM 2020 and stock annex).
4.4.5 - Natural mortality (Table 4.8)
Natural mortality used in the assessment was 0.2. For ages 3–6 mortality predation by cod is added (see stock annex). For the period from 1984 and onwards actual estimates of predation by cod was used. For the years 1950–1983 the average natural mortality for 1984–202 2 was used (age groups 3–6). Estimated mortality from predation by cod in this year’s assessment is based on the ‘final run’ cod assessment. The proportion of F and M before spawning was set to zero.
4.4.6 - Data for tuning (Table 4.9)
The following survey series are included in the data for tuning, the last age for all surveys is the plus group. Data are lacking (no survey) for FLT01 in 2016, and for FLT007 in 2018 and 2022 (not included due to poor/not synoptic coverage).
Name
Acronym
Place
Season
Age
Year
prior weight
FLT01: Russian bottom trawl
RU-BTr-Q4
Barents Sea
October–December
3–8+
1991–2017
1
FLT02: Joint Barents Sea survey–acoustic
BS-NoRU-Q1(Aco)
Barents Sea
February– March
3–9+
1993–2023
1
FLT04: Joint Barents Sea survey–bottom trawl
BS-NoRu-Q1 (BTr)
Barents Sea
February– March
3–10+
1994–2023
1
FLT007: Joint Russian-Norwegian ecosystem autumn survey in the Barents Sea–bottom trawl
Eco-NoRu-Q3 (Btr)
Barents Sea
August–September
3–9+
2004–2021
1
4.4.7 - Changes in data from last year (Table 4.6–Table 4.7, Table 4.9)
At the benchmark (WKDEM 2020) it was decided that historic values (1950–1993) of stock weight and maturity should not be updated in the following years. Due to the smoothing procedure (see stock annex) the stock weight and maturity at age back to 1994 are updated every year.
Natural mortality includes cod predation for the ages 3–6. The data from 1984 and onwards are updated every year after the update of the cod assessment. The averages used for the historic period (1950–1983) were updated and used in the assessment.
4.5 - Assessment models and settings (Table 4.10)
At the benchmark in 2020 it was decided to continue using the SAM model as the main model.
The SAM configuration was revised during the benchmark in 2020. The main changes to the configuration were to include:
1) age group 3 in the winter survey indices (Fleet 02 and 04),
2) plus group in all survey series (new option in SAM),
3) prediction variance link for the observation variances (new option in SAM, Breivik et al., 2021) 4) correlation structure in observation variance for the surveys ( Berg and Nielsen, 2016).
The configuration, settings and tuning of SAM that were decided on during the benchmark (WKDEM 2020) were used in the current assessment. The configuration file is given in Table 4.10 and in the stock annex.
XSA, with revised settings, and TISVPA are both used as additional models for comparison.
4.6 - Results of the assessment (Table 4.11–Table 4.14 and Figure 4.1–Figure 4.3)
The dominating feature of the assessment is that the stock reached an all-time high level around 2011 due to the strong 2004–2006 year-classes, and since declined (Table 4.11; Figure 4.1)
Fishing mortality increased from 2013 to 2020 (Table 4.12), has been above FMSY = 0.35 since 2018 and reached 0.45 in 2020, but decreased to 0.351 in 2022. The SSB declined from an all-time high in the period 2012-2016 to an intermediate level in 2020 and then stabilized. The estimate of SSB for 2023 is 210 kt which is above MSY Btrigger = 80 kt (Figure 4.1).
The residuals and retrospective patterns are shown in Figure 4.2 and 4.3.
4.7 - Comparison with last year’s assessment (Figure 4.4)
The text table below compares this year’s estimates with last year’s estimates. Compared to last year the current estimates of the total stock (TSB) in 2022 is 6% lower, whereas the spawning stock (SSB) estimate is 9% lower. The Fbar in 2021 is estimated as higher compared to last year’s assessment. Estimates for 2022 for all ages except age 3 and 4 were lower or identical to last year’s assessment. Ratios are calculated on original numbers (not rounded as shown in table)
The Extended Survivors Analysis (XSA) was used to tune the VPA by available index series. As last years, FLR was used for the assessment of haddock (see stock annex), and thus all results concerning XSA are obtained using FLR. The settings used were the same as set in the benchmark in 2015 (WKARCT 2015). At this meeting the comparison confirmed that usage XSA with survivor estimate shrinkage 0.5 gave similar result to the estimates from SAM.
The estimated consumption of NEA haddock by NEA cod is incorporated into the XSA analysis by first constructing a catch number-at-age matrix, adding the numbers of haddock eaten by cod to the catches for the years where such data are available (1984–2022). The summary of XSA stock estimates with shrinkage value 0.5 are presented in Table 4.15. A retrospective estimate for XSA gave same signals as for the main model SAM (Figure 4.5).
4.8.2 - TISVPA (Figure 4.5)
The TISVPA (Triple Instantaneous Separable VPA) model (Vasilyev 2005, 2006) represents fishing mortality coefficients (more precisely – exploitation rates) as a product of three parameters: f(year)*s(age)*g(cohort). The generation‐dependent parameters, which are estimated within the model, are intended to adapt traditional separable representation of fishing mortality to situations when several year classes may have peculiarities in their interaction with fishing fleets caused by different spatial distribution, higher attractiveness of more abundant schools to fishers, or by some other reasons. The TISVPA model was presented at benchmark groups for haddock stock (WKARCT 2015, WKDEM, 2020) and it was decided to apply to NEA haddock using the same data as SAM except that natural mortality values from cannibalism were taken from the SAM runs. All the input data, including catch-at-age, weight-at-age in stock and in catches, maturity-at-age were the same as used in SAM. Generally, the biomass estimates of this model were higher than SAM estimates, which can be explained by different assumptions about catchability of indices. The retrospective pattern for TISVPA shows the same trends as both the SAM and XSA models (Figure 4.5).
4.8.3 - Model comparisons (Figure 4.6)
Results from SAM, XSA and TISVPA are compared in Figure 4.6. Comparison of results of SAM, TISVPA and XSA with previous year settings shows that the models estimate similar trends. The TISVPA model is more flexible for settings than the others and taking into account a possible decrease in survey data consistency, it was attempted to do tuning of surveys not at abundance but to age proportions because of the probable change in effective survey catchability.
4.9 - Predictions, reference points and harvest control rules (Table 4.16–Table 4.21)
4.9.1 - Recruitment (Table 4.16–Table 4.17)
SAM was used to estimate the recruitment at age 3 of the 2020 year-class in 2023. The RCT3 program (R version) was used to estimate the recruiting year classes 2021–2022 in 2024 and 2023 with survey data from the ecosystem survey and winter survey (acoustics and bottom trawl). Input data and results are shown in Tables 4.16 and 4.17, respectively.
The text table below shows the recruitment estimates for the year classes 2004–2022 from assessments and RCT3 forecasts (shaded cells). Overall, there is good agreement with the year-class strength estimates from RCT3 and the assessments (r=0.96), and the estimate the first year the year-class was assessed was on average 89% of the initial RCT3 estimate (year-classes 2005-2020). In the most recent years, it is noticeable that the 2018 year-class was less than 50% of the initial RCT3 estimate, whereas the 2020 year-class was estimated by SAM 66% higher than the initial RCT3 estimate.
Year Class
Year of assessment, base model
2008 XSA
2009 XSA
2010 XSA
2011 XSA
2012 XSA
2013 XSA
2014 XSA
2015 XSA
2015 SAM
2016 SAM
2017 SAM
2018 SAM
2019 SAM
2020 SAM
2021 SAM
2022 SAM
202 3 SAM
2004
665
668
610
765
743
725
698
768
687
930
898
869
879
557
543
546
534
2005
943
975
1029
1193
1301
1317
1303
1415
996
1456
1330
1241
1251
1149
1113
1118
1085
2006
832
1036
811
1057
1187
1264
1267
1366
827
1254
1083
1027
1030
1063
1025
1032
998
2007
202
208
212
284
330
370
384
411
211
355
307
305
308
249
241
242
238
2008
149
101
120
151
155
169
178
89
157
107
109
110
122
117
119
118
2009
303
315
320
345
357
363
230
351
294
291
293
356
340
344
335
2010
188
146
137
146
150
100
133
105
105
106
124
119
120
118
2011
483
513
482
398
298
397
340
329
332
425
411
415
407
2012
124
145
104
78
73
79
70
68
75
72
73
73
2013
394
290
197
235
184
174
177
219
213
215
212
2014
279
198
247
189
146
148
202
194
198
195
2015
422
398
333
336
384
368
370
363
2016
1067
933
930
875
822
831
808
2017
577
629
497
442
449
432
2018
344
294
154
164
161
2019
39
31
38
47
2020
95
89
158
2021
303
372
2022
231
4.9.2 - Prediction data (Table 4.18, Figure 4.7)
The input data for the prediction are presented in Table 4.18.
Stock numbers for 2024–2025 at age 3 are taken from RCT3, and abundance-at-ages 3–13+ in 2023 from the SAM assessment.
The average fishing pattern observed in 2020–2022 scaled to F in 2022 was used for distribution of fishing mortality-at-age for 2023–2025 (Figure 4.7). The proportion of M and F before spawning was set to 0.
Input data to projection of weight at age in the stock, weight at age in the catch, maturity and mortality followed the stock annex (WKDEM, 2020).
4.9.3 - Biomass reference points (Figure 4.1)
Biological and fisheries reference points for NEA haddock were last set following a thorough analysis as part of the WKNEAMP-2 (ICES, 2016) Harvest Control Rule evaluation in 2016. The revised model developed during the 2020 benchmark produced better fits to the data but only a small change in the reconstructed stock (WKDEM, 2020). A brief analysis at WKDEM 2020 indicated that the reference points from the current model are very similar to the previously estimated values. Given the more thorough analysis at WKNEAMP-2 (ICES, 2016), this is taken as indicating that there was no evidence to deviate from the reference points set in 2016.
At the last benchmark (WKDEM 2020) it was proposed to keep Blim = 50 000 t and Bpa = 80 000 t with the rationale that Blim is equal to Bloss, and Bpa = Blim*exp (1.645*σ), where σ = 0.3. This gives a 95% probability of maintaining SSB above Blim taking into account the uncertainty in the assessments and stock dynamics. BMSY trigger was proposed equal Bpa, Btrigger was then selected as a biomass that is encountered with low probability if FMSY is implemented, as recommended by WKFRAME2 (ICES CM 2011/ACOM:33). Values of reference points compared with current stock values are reflected in Figure 4.1.
Biological and fisheries reference points for NEA haddock were last set following a thorough analysis as part of the WKNEAMP-2 (ICES, 2016) Harvest Control Rule evaluation in 2016. The revised model developed during the 2020 benchmark produced better fits to the data but only a small change in the reconstructed stock (ICES WKDEM 2020). A brief analysis at WKDEM 2020 indicated that the reference points from the current model are very similar to the previously estimated values. Given the more thorough analysis at WKNEAMP-2 (ICES, 2016), this is taken as indicating that there was no evidence to deviate from the reference points set in 2016.
There is no standard method of estimating Flim nor Fpa, and ACOM accepted to use geometric mean recruitment (146 million) and Blim as basis for the Flim estimate. Flim is then based on the slope of line from origin at SSB = 0 to the geometric mean recruitment (146 million) and SSB = Blim. The SPR value of this slope give Flim value on SPR curve; Flim = 0.77 (found using Pasoft). Using the same approach as for Bpa; Fpa = Flim *exp(-1.645* σ ) = 0.47.
FMSY = 0.35 has been estimated by long-term stochastic simulations. Values of reference points compared with current stock values are reflected in Figure 4.1.
The estimates of cod’s consumption of haddock were revised following the cod benchmark in early 2021. At the AFWG 2021 meeting, the haddock FMSY was checked with the new updated mortality estimates and found to still be valid and precautionary.
4.9.5 - Harvest control rule
The harvest control rule (HCR) was evaluated by ICES in 2007 (ICES CM 2007/ACFM:16) and found to be in agreement with the precautionary approach. The agreed HCR for haddock with last modifications is as follows (Protocol of the 40th Session of The Joint Norwegian Russian Fisheries Commission (JNRFC), 14 October 2011):
TAC for the next year will be set at level corresponding to FMSY.
The TAC should not be changed by more than +/- 25% compared with the previous year TAC.
If the spawning stock falls below Bpa, the procedure for establishing TAC should be based on a fishing mortality that is linearly reduced from FMSY at Bpa to F = 0 at SSB equal to zero. At SSB-levels below Bpa in any of the operational years (current year and a year ahead) there should be no limitations on the year-to-year variations in TAC.
As mentioned above Flim and Fpa were revised in 2011. The new values of Flim = 0.77 and Fpa = 0.47 are higher than the previous values (0.49 and 0.35, respectively). In the 2012 meeting of the JNRFC the proposals of ICES were accepted, and the current HCR management is based on FMSY instead of Fpa. This corresponds to the goal of the management strategy for this stock and should provide maximum sustainable yield.
In 2014, JNRFC decided that from 2015 onwards, Norway and Russia can transfer to next year or borrow from last year maximum 10% of the country’s quota. At its 45th session in October 2015, the Joint Norwegian-Russian Fisheries Commission (JNRFC) decided that a number of alternative harvest control rules (HCRs) for Northeast Arctic haddock should be evaluated by ICES. This was done by WKNEAMP (ICES 2015/ACOM:60, ICES C. M. 2016/ACOM:47). Six HCRs for NEA haddock including the existing one were tested. At its 46th session in October 2016, the JNRFC decided not to change the HCR.
4.9.6 - Prediction results and catch options for 2024 (Table 4.19–Table 4.20)
The projection shows a decrease in SSB from 210 kt in 2023 to 189 kt in 2024 (Table 4.19). TAC constraint F is used for 2023. The TAC for 2024 is established using the current one-year HCR, in accordance with the management plan. FMSY = 0.35 would give a quota for 2024 of 122 465 kt, this is a 28% decrease from the TAC. Following the harvest control rule, the TAC should not be changed with more than 25% compared to the previous year, therefor the TAC advice for 2024 is a quota of 127 550 tonnes.
Catch options for 2024 are shown in the text table below (weights in tonnes).
Basis
Total catch (2024)
F ages 4−7 (2024)
SSB (2025)
% SSB change *
% TAC change **
% Advice change ***
Advice basis
Management plan
127 550
0.3681
159 292
-16
-25
-25
Other scenarios
MSY approach: FMSY
122 465
0.35
162 753
-14
-28
-28
F = 0
0
0.00
249 327
32
-100
-100
F = F2023
130 057
0.3771
157 591
-17
-24
-24
Fpa
154 413
0.47
141 245
-25
-9
-9
Flim
218 207
0.77
100 344
-47
28
28
* SSB 2025 relative to SSB 2024.
** Catch in 2024 relative to TAC in 2023 ( 170 067 t)
*** Catch value for 2024 relative to advice value for 2023 ( 170 067 t)
Detailed information about expected catches by following the HCR in 2024 and 2025 is given in Table 4.20. The forecast covers all catches. It is then implied that all types of catches are to be counted against this TAC.
4.9.7 - Comments to the assessment and predictions (Figure 4.2-4.4 and Figure 4.8- Figure 4.9)
The one step ahead residuals showed no clear pattern (Figure 4.2). Haddock was benchmarked in 2020 (WKDEM 2020). The motivation for the benchmark was the poor retrospective (text table below). The retrospective biases were greatly improved after the benchmark. The retrospective biases for F, SSB, TSB and R (absolute values) are <8% (Figure 4.3). To conclude, no obvious problems with the 2023 assessment were detected. The results from this year’s assessment agreed well with the results from last year (Figure 4.4).
Retrospective bias (Mohn’s Rho), 5-year peel
R
SSB
F
TSB
AFWG 2018
−3%
24%
−7%
14%
AFWG 2019
−5%
18%
−7%
7%
WKDEM 2020
−2%
3%
−3%
1%
AFWG 2020
−4%
−3%
0%
−5%
AFWG 2021
1%
6%
−7%
3%
JRN_AFWG 2022
-2%
5%
-6%
1%
JRN_AFWG 2023
0%
7%
-6%
3%
According to this year’s assessment, the 2016 year-class is the sixth strongest year class in the time-series back to 1950. The 2017 year-class is above average (average 1950-2023, R3=258 million individuals). The 2018 and 2020 year-classes are weak, and the 2019 year-class is the weakest since the 1987 year-class. The 2021 year-class is predicted to be above average, whereas the 2022 year-class is predicted to be close to average.
Fishing mortality (Fbar4-7) has been above Fmsy in 2018, 2019, 2020 and 2021, meaning that the quotas for 2018-2021 have been set too high because the stock biomass was overestimated. The assessments from 2017 to 2019 on which the TAC advice for 2018-2020 were based, had large positive retrospective biases for TSB and SSB (see text table above), implying that the stock sizes were overestimated. The retrospective bias was reduced after the revision at the 2020 benchmark (WKDEM 2020).
The quota in 2021 was not taken, but Fbar was still larger than Fmsy . One possible reason is that the advice and quota was set too high, due to lower catch weights of ages 3-7 compared to the forecast, e.g. the catch weight at age 5 (2016 year-class) was 16% lower than predicted by AFWG in 2020. The 2016 year-class accounted for more than half of the individuals caught in 2021 ( 54%) and thus the weight of this year-class in the catches had the greatest impact on the yield. As a result, a given catch in tons required more individuals had to be caught, and hence a higher effort from the fishing fleet. In 2022, the difference between the catch weight at age 5 (year-class 2017 and age 6 (year-class 2016), and the predictions from AFWG 2021 was much smaller (5% lower).
The strong 2016 year-class and the 2017 year-class is dominating the catches (73% in biomass). In 2022 99% of the quota was taken, but more of the quota was taken from the 2017-year class than assumed in the predictions (Figure 4.8, 2016-year class: prediction 50%, catches: 42%, 2017-year-class: 26% in prediction vs 31% in catches).
The spawning stock will decline from 2023 to 2024 and is expected to decline in the next years, since the incoming year-classes 2018-2020 are weak. The age composition will change in the coming years as the 2016 and 2017 year-classes are fished out of the stock and the 2021 and 2022 -year-classes start recruited to the fishery (Figure 4.9).
4.10 - References
Berg CW and Nielsen A. 2016. Accounting for correlated observations in an age-based state-space stock assessment model. ICES Journal of Marine Science, 73: 1788–1797.
Breivik ON, Nielsen A and Berg CW 2021. Prediction–variance relation in a state-space fish stock assessment model. ICES Journal of Marine Science, 78, 3650–3657
Fall, J., Wenneck, T. de Lange, Bogstad, B., Fuglebakk, E., Godiksen, J., Høines, Å., Korsbrekke, K., Skage, M. L., Staby, A., Tranang, C. Aa., Windsland, K., Russkikh, A. A., and Kharlin, S. 2023. Fish investigations in the Barents Sea winter 2022. IMR-PINRO Joint Report Series 1-2023, 100 pp.
ICES 2006a. ICES Workshop on Biological Reference Points for North East Arctic Haddock (WKHAD). Svanhovd, Norway, 6-10 March 2006. ICES C.M. 2006/ACFM:19, 102 pp.
ICES 2006b. Report of the Arctic Fisheries Working Group, 19-28 April. 2006. ICES C.M. 2006/ACFM:25, 594 pp.
ICES 2011. Report of the Benchmark Workshop on Roundfish and Pelagic Stocks, Lisbon 24-31 January 2011. ICES C.M. 2011/ACOM:38, 418 pp.
ICES 2015. Report of the first Workshop on Management Plan Evaluation on Northeast Arctic cod and haddock and Barents Sea capelin ( WKNEAMP-1) , , . ICES CM 2015/ACOM:60, 27 pp.
ICES 2016. Report of the second Workshop on Management Plan Evaluation on Northeast Arctic cod and haddock and Barents Sea capelin (WKNEAMP-2) , 25-28 January 2016, Kirkenes, Norway. ICES CM 2016/ACOM:47, 76 pp.
ICES. 2015. Report of the Benchmark Workshop on Arctic Stocks (WKARCT), 26-30 January 2015, ICES Headquarters, Denmark. ICES CM 2015\ACOM:31. 126 pp.
ICES 2020. Report of the Arctic Fisheries Working Group (AFWG). ICES Scientific Reports. 2:52. 577 pp.
Johnsen E, Totland A , Skålevik Å , et al. 2019. StoX: An open source software for marine survey analyses. Methods in Ecology and Evolution 2019; 10: 1523 – 1528.https://doi.org/10.1111/2041-210X.13250
Prozorkevich D and Gjøsæter H 2014. WD_02 cod BESS_assessment. AFWG 2014.
Vasilyev D. 2005 Key aspects of robust fish stock assessment. M: VNIRO Publishing, 2005. 105 p.
Vasilyev D. 2006. Change in catchability caused by year class peculiarities: how stock assessment based on separable cohort models is able to take it into account? (Some illustrations for triple‐separable case of the ISVPA model ‐ TISVPA). ICES CM 2006/O:18. 35 pp
Table 4.1. Northeast Arctic haddock. Total nominal catch (t) by fishing areas.
Year
Subarea 1
Division 2.a
Division 2.b
un-reported2)
Total3)
Norw. stat.areas 06 and 074)
1960
125026
27781
1844
-
154651
6000
1961
165156
25641
2427
-
193224
4000
1962
160561
25125
1723
-
187409
3000
1963
124332
20956
936
-
146224
4000
1964
79262
18784
1112
-
99158
6000
1965
98921
18719
943
-
118583
6000
1966
125009
35143
1626
-
161778
5000
1967
107996
27962
440
-
136398
3000
1968
140970
40031
725
-
181726
3000
1969
89948
40306
566
-
130820
2000
1970
60631
27120
507
-
88258
-
1971
56989
21453
463
-
78905
-
1972
221880
42111
2162
-
266153
-
1973
285644
23506
13077
-
322227
-
1974
159051
47037
15069
-
221157
10000
1975
121692
44337
9729
-
175758
6000
1976
94054
37562
5648
-
137264
2000
1977
72159
28452
9547
-
110158
2000
1978
63965
30478
979
-
95422
2000
1979
63841
39167
615
-
103623
6000
1980
54205
33616
68
-
87889
5098
1981
36834
39864
455
-
77153
4767
1982
17948
29005
2
-
46955
3335
1983
5837
16859
1904
-
24600
3112
1984
2934
16683
1328
-
20945
3803
1985
27982
14340
2730
-
45052
3583
1986
61729
29771
9063
-
100563
4021
1987
97091
41084
16741
-
154916
3194
1988
45060
49564
631
-
95255
3756
1989
29723
28478
317
-
58518
4701
1990
13306
13275
601
-
27182
2912
1991
17985
17801
430
-
36216
3045
1992
30884
28064
974
-
59922
5634
1993
46918
32433
3028
-
82379
5559
1994
76748
50388
8050
-
135186
6311
1995
75860
53460
13128
-
142448
5444
1996
112749
61722
3657
-
178128
5126
1997
78128
73475
2756
-
154359
5987
1998
45640
53936
1054
-
100630
6338
1999
38291
40819
4085
-
83195
5743
2000
25931
39169
3844
-
68944
4536
2001
35072
47245
7323
-
89640
4542
2002
40721
42774
12567
18736/5310
114798/101372
6898
2003
53653
43564
8483
33226/9417
138926/115117
4279
2004
64873
47483
12146
33777/8661
158279/133163
3743
2005
53518
48081
16416
40283/9949
158298/127964
5538
2006
51124
47291
33291
21451/8949
153157/140655
5410
2007
62904
58141
25927
14553/3102
161525/150074
7110
2008
58379
60178
31219
5828/-
155604/149776
6629
2009
57723
66045
76293
0
200061
4498
2010
62604
86279
100318
0
249200
3661
2011
86931
99307
123546
0
309785
4169
2012
90141
96807
128679
0
315627
3869
2013
68416
64810
60520
0
193744
4000
2014
61537
58320
57665
0
177522
3433
2015
75195
61567
57993
0
194756
3902
2016
78714
95140
59561
0
233416
3233
2017
94772
75455
57362
0
227589
2987
2018
80902
58522
51853
0
191276
4437
2019
87446
50967
36989
0
175402
2812
2020
98341
57397
26730
0
182468
3196
2021
109914
5800 6
36823
0
204743
2363
20221)
85887
63415
27604
0
176906
2151
1) Provisional figures
2) Figures based on Norwegian/Russian IUU estimates. From 2009, IUU estimates are made by a Joint Russian-Norwegian analysis group under the Russian-Norwegian Fisheries Commission.
3) In 2002–2008, the Norwegian IUU estimates were used in final assessment.
4) Included in total landings and in landings in region 2.a.
Table 4.2. Northeast Arctic haddock. Total nominal catch (‘000 t) by trawl and other gear for each area.
Subarea 1
Division 2.a
Division 2.b
Unreported2
Year
Trawl
Others
Trawl
Others
Trawl
Others
1967
73.7
34.3
20.5
7.5
0.4
-
-
1968
98.1
42.9
31.4
8.6
0.7
-
-
1969
41.4
47.8
33.2
7.1
1.3
-
-
1970
37.4
23.2
20.6
6.5
0.5
-
-
1971
27.5
29.2
15.1
6.7
0.4
-
-
1972
193.9
27.9
34.5
7.6
2.2
-
-
1973
242.9
42.8
14
9.5
13.1
-
-
1974
133.1
25.9
39.9
7.1
15.1
-
-
1975
103.5
18.2
34.6
9.7
9.7
-
-
1976
77.7
16.4
28.1
9.5
5.6
-
-
1977
57.6
14.6
19.9
8.6
9.5
-
-
1978
53.9
10.1
15.7
14.8
1
-
-
1979
47.8
16
20.3
18.9
0.6
-
-
1980
30.5
23.7
14.8
18.9
0.1
-
-
1981
18.8
17.7
21.6
18.5
0.5
-
-
1982
11.6
11.5
23.9
13.5
-
-
-
1983
3.6
2.2
8.7
8.2
0.2
1.7
-
1984
1.6
1.3
7.6
9.1
0.1
1.2
-
1985
24.4
3.5
6.2
8.1
0.1
2.6
-
1986
51.7
10.1
14
15.8
0.8
8.3
-
1987
79
18.1
23
18.1
3
13.8
-
1988
28.7
16.4
34.3
15.3
0.6
0
-
1989
20
9.7
13.5
15
0.3
0
-
1990
4.4
8.9
5.1
8.2
0.6
0
-
1991
9
8.9
8.9
8.9
0.2
0.2
-
1992
21.3
9.6
11.9
16.1
1
0
-
1993
35.3
11.6
14.5
17.9
3
0
-
1994
58.6
18.2
26.1
24.3
7.9
0.2
-
1995
63.9
12
29.6
23.8
12.1
1
-
1996
98.3
14.4
36.5
25.2
3.4
0.3
-
1997
57.4
20.7
44.9
28.6
2.5
0.3
-
1998
26
19.6
27.1
26.9
0.7
0.3
-
1999
29.4
8.9
19.1
21.8
4
0.1
-
2000
20.1
5.9
18.8
20.4
3.7
0.1
-
2001
28.4
6.7
23.4
23.8
7
0.3
-
2002
30.5
10.2
19.5
23.3
12.5
0.1
18.7/5.3
2003
42.7
10.9
21.9
21.7
8.1
0.4
33.2/9.4
2004
52.4
12.5
27
20.5
11.5
0.6
33.8/8.7
2005
38.5
15
24.9
20.9
13
1.6
40.3/9.9
2006
40.1
11
22
25.3
30.1
3.2
21.5/8.9
2007
51.8
11.1
30.5
27.7
20.4
5.5
14.6/3.1
2008
46.8
11.6
30.9
29.3
24.9
6.3
5.8/-
2009
49
8.8
40.1
25.3
67.1
7.8
0
2010
43.6
19
50
35.7
87
10.4
0
2011
55.8
31.1
61.1
38.9
107.7
14.3
0
2012
58.8
31.3
57.5
39.2
103.2
24.8
0
2013
40.1
28.3
37.7
26.9
52.1
8.1
0
2014
35.2
26.3
32.5
25.8
49
8.6
0
2015
49.1
26.1
34.6
27
48.5
9.4
0
2016
56.4
22.3
62.5
32.5
45.4
14.1
0
2017
65
29.8
50.7
24.7
47.1
10.3
0
2018
51.7
29.2
36.9
21.6
43.2
8.6
0
2019
53.9
33.5
30.4
20.4
31.0
5.9
0
2020
66.7
31.6
35.1
22.3
23.2
3.5
0
2021
81.4
28.5
41.0
17.0
31.0
5.8
0
20221)
63.4
22.5
44.7
18.7
22.1
5.5
0
1) Provisional
2) Figures based on Norwegian/Russian IUU estimates.
Table 4.3 Northeast Arctic haddock. Nominal catch (t) by countries. Subarea 1 and divisions 2.a and 2.b combined. (Data provided by Working Group members).
Year
Faroe Islands
France
GDR (–1990) & Greenland (1992–)
Germany
Norway4
Poland
UK
Russia2
Others
Total3
1960
172
-
-
5597
46263
-
45469
57025
125
154651
1961
285
220
-
6304
60862
-
39650
85345
558
193224
1962
83
409
-
2895
54567
-
37486
91910
58
187408
1963
17
363
-
2554
59955
-
19809
63526
-
146224
1964
-
208
-
1482
38695
-
14653
43870
250
99158
1965
-
226
-
1568
60447
-
14345
41750
242
118578
1966
-
1072
11
2098
82090
-
27723
48710
74
161778
1967
-
1208
3
1705
51954
-
24158
57346
23
136397
1968
-
-
-
1867
64076
-
40129
75654
-
181726
1969
2
-
309
1490
67549
-
37234
24211
25
130820
1970
541
-
656
2119
37716
-
20423
26802
-
88257
1971
81
-
16
896
45715
43
16373
15778
3
78905
1972
137
-
829
1433
46700
1433
17166
196224
2231
266153
1973
1212
3214
22
9534
86767
34
32408
186534
2501
322226
1974
925
3601
454
23409
66164
3045
37663
78548
7348
221157
1975
299
5191
437
15930
55966
1080
28677
65015
3163
175758
1976
536
4459
348
16660
49492
986
16940
42485
5358
137264
1977
213
1510
144
4798
40118
-
10878
52210
287
110158
1978
466
1411
369
1521
39955
1
5766
45895
38
95422
1979
343
1198
10
1948
66849
2
6454
26365
454
103623
1980
497
226
15
1365
66501
-
2948
20706
246
92504
1981
381
414
22
2402
63435
Spain
1682
13400
-
81736
1982
496
53
-
1258
43702
-
827
2900
-
49236
1983
428
-
1
729
22364
139
259
680
-
24600
1984
297
15
4
400
18813
37
276
1103
-
20945
1985
424
21
20
395
21272
77
153
22690
-
45052
1986
893
12
75
1079
52313
22
431
45738
-
100563
1987
464
7
83
3105
72419
59
563
78211
5
154916
1988
1113
116
78
1323
60823
72
435
31293
2
95255
1989
1217
-
26
171
36451
1
590
20062
-
58518
1990
705
-
5
167
20621
-
494
5190
-
27182
1991
1117
-
Greenland
213
22178
-
514
12177
17
36216
1992
1093
151
1719
387
36238
38
596
19699
1
59922
1993
546
1215
880
1165
40978
76
1802
35071
646
82379
1994
2761
678
770
2412
71171
22
4673
51822
877
135186
1995
2833
598
1097
2675
76886
14
3111
54516
718
142448
1996
3743
6
1510
942
94527
669
2275
74239
217
178128
1997
3327
540
1877
972
103407
364
2340
41228
304
154359
1998
1903
241
854
385
75108
257
1229
20559
94
100630
1999
1913
64
437
641
48182
652
694
30520
92
83195
2000
631
178
432
880
42009
502
747
22738
827
68944
2001
1210
324
553
554
49067
1497
1068
34307
1060
89640
2002
1564
297
858
627
52247
1505
1125
37157
682
114798
2003
1959
382
1363
918
56485
1330
1018
41142
1103
138926
2004
2484
103
1680
823
62192
54
1250
54347
1569
158279
2005
2138
333
15
996
60850
963
1899
50012
1262
158298
2006
2390
883
1830
989
69272
703
1164
53313
1162
153157
2007
2307
277
1464
1123
71244
125
1351
66569
2511
161525
2008
2687
311
1659
535
72779
283
971
68792
1759
155604
2009
2820
529
1410
1957
104354
317
1315
85514
1845
200061
2010
3173
764
1970
3539
123384
379
1758
111372
2862
249201
2011
1759
268
2110
1724
158202
502
1379
139912
4763
310619
2012
2055
322
3984
1111
159602
441
833
143886
3393
315627
2013
1886
342
1795
500
99215
439
639
85668
3260
193744
2014
1470
198
1150
340
91306
187
355
78725
3791
177522
2015
2459
145
1047
124
95094
246
450
91864
3327
194756
2016
2460
340
1401
170
108718
200
575
115710
3838
233412
2017
2776
108
1810
170
113132
228
372
106714
2279
227588
2018
2333
183
1317
385
93839
169
453
90486
2111
191276
2019
1515
143
1208
204
93860
280
456
76125
1611
175402
2020
1392
96
910
282
88108
45
320
89030
2286
182468
2021
1722
105
1101
365
100673
13
78
98296
2390
204743
20221)
1831
164
1101
268
89044
99
138
82364
1897
176906
1) Provisional figures., 2) USSR prior to 1991. , 3) Figures based on Norwegian IUU estimates in 2002–2008 (see table 4.1), 4) Included landings in Norwegian statistical areas 06 and 07 (from 1983)
Table 4.6a. Northeast Arctic haddock. Smoothed stock weights-at-age (kg). The data from 1950–1993 is unchanged since AFWG 2019, the data from 1994 and onward have been updated this year.
Year
1
2
3
4
5
6
7
8
9
10
11
12
13+
1950-1979
0.031
0.145
0.354
0.653
1.016
1.427
1.867
2.327
2.771
3.195
3.597
3.597
3.597
1980
0.063
0.262
0.454
0.878
1.159
1.675
2.292
3.134
3.31
3.553
3.792
3.792
3.792
1981
0.051
0.274
0.603
0.805
1.315
1.582
2.118
2.728
3.51
3.679
3.904
3.904
3.904
1982
0.036
0.224
0.631
1.049
1.217
1.782
2.017
2.553
3.14
3.853
4.016
4.016
4.016
1983
0.035
0.164
0.524
1.098
1.558
1.663
2.255
2.448
2.97
3.524
4.165
4.165
4.165
1984
0.028
0.158
0.391
0.926
1.632
2.093
2.121
2.718
2.865
3.363
3.878
3.878
3.878
1985
0.03
0.127
0.379
0.700
1.394
2.195
2.626
2.572
3.158
3.261
3.728
3.728
3.728
1986
0.035
0.136
0.311
0.682
1.069
1.898
2.761
3.138
3.005
3.568
3.632
3.632
3.632
1987
0.042
0.161
0.331
0.569
1.047
1.473
2.411
3.307
3.616
3.412
3.946
3.946
3.946
1988
0.039
0.189
0.383
0.603
0.887
1.452
1.895
2.915
3.822
4.054
3.787
3.787
3.787
1989
0.037
0.175
0.445
0.689
0.936
1.248
1.878
2.317
3.395
4.297
4.449
4.449
4.449
1990
0.031
0.169
0.413
0.789
1.054
1.312
1.635
2.308
2.728
3.844
4.73
4.73
4.73
1991
0.025
0.141
0.402
0.737
1.193
1.458
1.714
2.035
2.732
3.122
4.256
4.256
4.256
1992
0.023
0.114
0.34
0.721
1.119
1.63
1.881
2.127
2.437
3.142
3.491
3.491
3.491
1993
0.025
0.107
0.279
0.616
1.100
1.537
2.08
2.308
2.54
2.831
3.531
3.531
3.531
Table 4.6b Northeast Arctic haddock. Smoothed stock weights-at-age (kg), updated from 1994 and onwards this year.
Year
1
2
3
4
5
6
7
8
9
10
11
12
13
1994
0.025
0.106
0.251
0.504
0.939
1.65
2.162
2.704
2.856
2.822
2.969
3.612
4.168
1995
0.032
0.113
0.262
0.471
0.797
1.314
2.107
2.625
3.156
3.284
3.217
3.168
3.926
1996
0.032
0.141
0.279
0.487
0.746
1.135
1.718
2.573
3.083
3.599
3.707
3.393
3.47
1997
0.034
0.144
0.344
0.517
0.769
1.062
1.494
2.126
3.025
3.518
4.014
3.858
3.71
1998
0.026
0.151
0.344
0.624
0.815
1.099
1.416
1.877
2.538
3.455
3.944
4.168
4.168
1999
0.027
0.12
0.364
0.629
0.972
1.157
1.45
1.776
2.267
2.96
3.875
4.081
4.458
2000
0.025
0.124
0.294
0.659
0.979
1.364
1.521
1.825
2.151
2.659
3.355
4.029
4.384
2001
0.021
0.111
0.306
0.539
1.026
1.364
1.767
1.898
2.198
2.543
3.04
3.533
4.329
2002
0.026
0.101
0.274
0.562
0.851
1.431
1.778
2.195
2.291
2.595
2.912
3.242
3.858
2003
0.026
0.118
0.249
0.504
0.882
1.203
1.848
2.195
2.602
2.686
2.982
3.109
3.549
2004
0.027
0.116
0.288
0.463
0.804
1.242
1.575
2.277
2.614
3.032
3.084
3.168
3.424
2005
0.019
0.121
0.285
0.53
0.741
1.135
1.622
1.972
2.706
3.032
3.432
3.271
3.486
2006
0.019
0.088
0.297
0.53
0.833
1.056
1.503
2.027
2.363
3.134
3.432
3.612
3.581
2007
0.021
0.088
0.224
0.544
0.833
1.18
1.398
1.877
2.424
2.767
3.544
3.612
3.926
2008
0.026
0.101
0.22
0.416
0.857
1.18
1.557
1.765
2.267
2.835
3.157
3.71
3.926
2009
0.027
0.118
0.249
0.416
0.671
1.211
1.548
1.94
2.128
2.659
3.232
3.347
4.029
2010
0.035
0.121
0.291
0.467
0.666
0.96
1.584
1.94
2.339
2.518
3.055
3.408
3.661
2011
0.032
0.155
0.297
0.535
0.741
0.96
1.282
1.983
2.327
2.74
2.898
3.242
3.726
2012
0.037
0.141
0.371
0.548
0.845
1.056
1.275
1.63
2.375
2.726
3.128
3.095
3.549
2013
0.033
0.164
0.341
0.669
0.863
1.195
1.398
1.62
1.986
2.78
3.128
3.317
3.408
2014
0.033
0.147
0.392
0.624
1.04
1.218
1.567
1.765
1.974
2.356
3.172
3.317
3.629
2015
0.033
0.149
0.354
0.706
0.972
1.44
1.594
1.95
2.14
2.344
2.72
3.362
3.629
2016
0.025
0.146
0.361
0.644
1.09
1.356
1.869
1.994
2.351
2.518
2.706
2.911
3.677
2017
0.024
0.114
0.35
0.654
0.999
1.51
1.767
2.301
2.388
2.753
2.898
2.911
3.227
2018
0.024
0.107
0.279
0.639
1.013
1.397
1.942
2.184
2.72
2.794
3.143
3.095
3.212
2019
0.025
0.11
0.265
0.517
0.993
1.414
1.808
2.385
2.602
3.149
3.188
3.332
3.408
2020
0.027
0.116
0.271
0.492
0.815
1.389
1.827
2.229
2.815
3.018
3.56
3.377
3.645
2021
0.019
0.124
0.282
0.5
0.781
1.157
1.797
2.253
2.654
3.254
3.432
3.742
3.693
2022
NA
0.088
0.302
0.526
0.792
1.106
1.529
2.218
2.68
3.076
3.658
3.596
4.046
2023
NA
NA
0.22
0.558
0.827
1.128
1.467
1.908
2.64
3.105
3.481
3.825
3.909
Table 4.7a. Northeast Arctic haddock. Proportion mature at age. The data from 1950-1993 is unchanged since AFWG 2019. Age 1-2 are 0, and ages 11-13+ set to 1 (not shown)
Year
3
4
5
6
7
8
9
10
1950-1979
0.027
0.101
0.311
0.622
0.845
0.944
0.982
0.994
1980
0.026
0.076
0.243
0.649
0.86
0.95
0.984
0.995
1981
0.056
0.104
0.303
0.549
0.857
0.948
0.984
0.995
1982
0.053
0.161
0.332
0.577
0.77
0.947
0.983
0.995
1983
0.057
0.183
0.472
0.665
0.8
0.906
0.983
0.995
1984
0.044
0.196
0.51
0.801
0.862
0.921
0.967
0.995
1985
0.027
0.149
0.522
0.796
0.928
0.953
0.973
0.989
1986
0.021
0.103
0.454
0.758
0.928
0.977
0.984
0.991
1987
0.021
0.076
0.294
0.713
0.918
0.976
0.993
0.994
1988
0.025
0.074
0.24
0.576
0.898
0.975
0.993
0.998
1989
0.032
0.09
0.25
0.534
0.822
0.966
0.993
0.998
1990
0.046
0.127
0.305
0.578
0.798
0.937
0.99
0.997
1991
0.041
0.164
0.358
0.623
0.82
0.925
0.98
0.997
1992
0.03
0.147
0.449
0.704
0.855
0.936
0.976
0.994
1993
0.018
0.113
0.396
0.741
0.878
0.95
0.979
0.992
Table 4.7b. Northeast Arctic haddock. Smoothed proportion mature at age. Data 1994-2022, Age 1-2 set to 0, and ages 11-13+ set to 1 (not shown)
Year
3
4
5
6
7
8
9
10
1994
0.03
0.09
0.275
0.638
0.842
0.943
0.959
0.959
1995
0.031
0.081
0.215
0.505
0.829
0.934
0.976
0.981
1996
0.035
0.085
0.194
0.422
0.726
0.929
0.972
0.99
1997
0.046
0.093
0.203
0.388
0.648
0.864
0.969
0.988
1998
0.046
0.125
0.222
0.405
0.616
0.811
0.933
0.986
1999
0.049
0.126
0.289
0.433
0.63
0.785
0.902
0.966
2000
0.037
0.136
0.292
0.526
0.658
0.799
0.886
0.948
2001
0.039
0.099
0.313
0.526
0.742
0.816
0.893
0.94
2002
0.033
0.106
0.237
0.554
0.745
0.876
0.905
0.944
2003
0.03
0.09
0.251
0.454
0.765
0.876
0.939
0.95
2004
0.036
0.079
0.217
0.472
0.678
0.889
0.94
0.97
2005
0.036
0.097
0.192
0.422
0.695
0.833
0.948
0.97
2006
0.037
0.097
0.229
0.385
0.651
0.844
0.914
0.974
2007
0.026
0.101
0.229
0.444
0.609
0.811
0.922
0.955
2008
0.026
0.068
0.239
0.444
0.672
0.782
0.902
0.959
2009
0.03
0.068
0.166
0.457
0.668
0.826
0.882
0.948
2010
0.037
0.08
0.164
0.339
0.681
0.826
0.911
0.938
2011
0.037
0.098
0.192
0.339
0.559
0.835
0.91
0.954
2012
0.05
0.103
0.234
0.385
0.555
0.742
0.915
0.953
2013
0.045
0.139
0.242
0.451
0.609
0.739
0.858
0.956
2014
0.055
0.125
0.319
0.461
0.675
0.782
0.856
0.922
2015
0.048
0.151
0.289
0.558
0.684
0.829
0.885
0.921
2016
0.049
0.131
0.34
0.522
0.771
0.838
0.913
0.938
2017
0.047
0.134
0.301
0.586
0.742
0.894
0.918
0.955
2018
0.035
0.129
0.307
0.541
0.79
0.875
0.949
0.957
2019
0.032
0.093
0.298
0.547
0.754
0.905
0.939
0.976
2020
0.033
0.086
0.222
0.536
0.76
0.882
0.957
0.969
2021
0.035
0.089
0.208
0.433
0.751
0.886
0.943
0.979
2022
0.038
0.095
0.213
0.409
0.661
0.88
0.946
0.971
2023
0.026
0.105
0.227
0.419
0.637
0.818
0.942
0.973
Table 4.8. Northeast Arctic haddock. Consumption of Haddock by NEA Cod (mln. spec) age 0–6, and total biomass ages 0–6 consumed.
Age
0
1
2
3
4
5
6
Biomass
1984
2226.13
1021.95
15.33
0.09
0.00
0.00
0.00
55.68
1985
2013.22
1368.22
5.08
0.00
0.00
0.00
0.00
53.17
1986
92.25
596.62
223.55
167.55
0.00
0.00
0.00
108.79
1987
0.00
1056.52
0.00
0.00
0.00
0.00
0.00
5.81
1988
0.00
16.71
0.48
8.69
0.00
0.20
0.00
2.50
1989
21.19
220.73
0.00
0.00
0.00
0.00
0.00
9.86
1990
48.44
137.39
34.24
3.32
0.00
0.00
0.00
14.08
1991
0.00
355.55
12.99
0.00
0.00
0.00
0.00
15.68
1992
132.30
1745.90
123.72
0.93
0.00
0.00
0.00
88.19
1993
825.58
1442.59
143.72
32.19
3.11
2.63
0.00
69.40
1994
1346.87
1483.77
73.44
23.88
6.92
0.82
0.01
48.31
1995
181.57
2868.54
167.10
12.37
28.14
27.78
0.32
113.53
1996
358.39
1535.66
154.31
38.20
5.18
2.46
3.18
66.35
1997
0.00
940.21
38.69
26.34
1.70
0.76
0.51
43.68
1998
0.00
1724.31
27.47
1.74
2.56
0.44
0.00
35.73
1999
0.00
1036.23
25.20
0.35
0.00
0.00
0.00
29.44
2000
811.66
1409.01
71.51
2.21
1.15
0.19
0.08
58.21
2001
1049.25
594.35
53.33
4.70
0.07
0.00
0.00
51.31
2002
456.38
2440.14
240.81
39.53
2.28
0.36
0.17
127.16
2003
1142.87
3575.15
214.44
39.30
12.69
1.21
0.00
166.11
2004
5394.22
2865.22
303.83
39.71
9.88
2.46
0.00
198.07
2005
7717.83
6687.34
276.26
55.14
9.29
2.25
0.88
324.85
2006
12797.81
8422.29
375.09
5.49
4.39
1.17
0.48
361.21
2007
1212.36
10191.31
660.13
71.71
3.84
2.20
0.22
378.44
2008
1368.88
969.68
896.66
228.03
43.89
5.64
3.22
293.25
2009
5657.49
1871.32
275.94
262.40
68.85
22.22
1.53
253.38
2010
1988.14
5732.79
180.16
66.60
67.96
61.64
11.49
266.97
2011
2331.46
2639.28
451.51
56.01
74.85
86.03
18.99
278.41
2012
234.60
7143.05
134.50
107.34
15.03
6.71
4.27
219.69
2013
2161.36
1587.29
376.23
31.36
22.13
5.49
4.16
199.40
2014
1173.98
1991.03
139.52
27.17
1.80
0.62
0.00
87.05
2015
4921.63
2560.70
129.58
13.37
43.55
1.43
0.22
176.32
2016
8073.55
2648.78
277.37
22.11
2.40
7.53
1.74
221.40
2017
4604.25
7660.46
228.98
22.74
12.56
6.17
13.48
272.62
2018
2303.31
6919.23
579.58
64.59
6.82
0.59
0.02
272.99
2019
531.00
4445.71
402.63
118.12
8.10
0.31
0.00
207.81
2020
1867.44
496.40
76.62
55.52
70.59
3.67
0.13
85.24
2021
1015.79
300.91
80.75
5.52
4.58
0.83
0.12
25.73
2022
4221.66
2201.10
219.24
8.30
1.26
0.06
0.00
78.77
Average 1984-2022
2058.54
2638.55
197.18
42.63
13.73
6.51
1.67
137.55
Table 4.9. Northeast Arctic haddock. Survey indices for SAM tuning (see section 4.4.6). The last age is a plus group.
Survey
Year\Age
3
4
5
6
7
8
9
10
RU-BTr-Q4
1991
62
9
3
6
18
17
RU-BTr-Q4
1992
346
50
4
6
9
9
RU-BTr-Q4
1993
1985
356
48
8
4
4
RU-BTr-Q4
1994
442
1014
116
15
1
6
RU-BTr-Q4
1995
31
123
370
40
5
4
RU-BTr-Q4
1996
28
49
362
334
29
6
RU-BTr-Q4
1997
32
32
10
27
10
8
RU-BTr-Q4
1998
38
46
8
5
15
5
RU-BTr-Q4
1999
196
39
37
8
3
14
RU-BTr-Q4
2000
60
109
26
11
2
5
RU-BTr-Q4
2001
334
40
65
11
4
4
RU-BTr-Q4
2002
399
450
47
24
4
3
RU-BTr-Q4
2003
221
299
231
34
16
3
RU-BTr-Q4
2004
113
94
107
87
5
6
RU-BTr-Q4
2005
240
86
48
57
24
3
RU-BTr-Q4
2006
113
119
57
26
24
13
RU-BTr-Q4
2007
838
73
137
38
14
15
RU-BTr-Q4
2008
2557
1051
124
111
17
11
RU-BTr-Q4
2009
1647
1704
631
57
32
9
RU-BTr-Q4
2010
299
1697
1589
466
34
17
RU-BTr-Q4
2011
47
268
1087
783
165
13
RU-BTr-Q4
2012
209
49
160
720
480
70
RU-BTr-Q4
2013
61
175
50
104
374
272
RU-BTr-Q4
2014
250
46
175
56
142
416
RU-BTr-Q4
2015
22
199
40
74
28
171
RU-BTr-Q4
2016
-1
-1
-1
-1
-1
-1
RU-BTr-Q4
2017
71
99
9
38
6
27
RU-BTr-Q4
2018
-1
-1
-1
-1
-1
-1
RU-BTr-Q4
2019
-1
-1
-1
-1
-1
-1
RU-BTr-Q4
2020
-1
-1
-1
-1
-1
-1
RU-BTr-Q4
2021
-1
-1
-1
-1
-1
-1
RU-BTr-Q4
2022
-1
-1
-1
-1
-1
-1
BS-NoRU-Q1(Aco)
1994
348.73
626.65
121.38
8.55
0.7
0.33
2.71
BS-NoRU-Q1(Aco)
1995
41.47
121.49
395.37
47.61
2.8
0.05
0.83
BS-NoRU-Q1(Aco)
1996
29.97
22.09
68.65
143.69
5.67
0.93
0.07
BS-NoRU-Q1(Aco)
1997
57.27
22.22
15.47
56.13
62.77
4.68
0.19
BS-NoRU-Q1(Aco)
1998
33.78
58.79
24.2
7.7
14.06
20.69
1.62
BS-NoRU-Q1(Aco)
1999
83.67
21.64
22.1
6.17
1.55
3.88
2.77
BS-NoRU-Q1(Aco)
2000
36.39
75.53
14.01
12.61
1.57
0.53
3.02
BS-NoRU-Q1(Aco)
2001
233.45
40.2
41.38
2.2
1.61
0.15
0.71
BS-NoRU-Q1(Aco)
2002
255.2
201.84
18.47
11.7
1.59
0.29
0.56
BS-NoRU-Q1(Aco)
2003
203.68
184.57
136.04
12.26
6.01
0.26
0.9
BS-NoRU-Q1(Aco)
2004
151.01
101.85
107.82
57.68
7.61
1.15
0.55
BS-NoRU-Q1(Aco)
2005
221.33
115.67
57.43
56.71
12.69
0.38
0.33
BS-NoRU-Q1(Aco)
2006
56.32
123.84
47.37
19.26
13.64
3.23
0.35
BS-NoRU-Q1(Aco)
2007
209.28
46.14
80.57
28.92
10
5.05
2.79
BS-NoRU-Q1(Aco)
2008
812.41
303.04
90.02
74.12
7.41
12.77
2.11
BS-NoRU-Q1(Aco)
2009
883.68
629.98
266.65
38.87
14.57
1.26
1.05
BS-NoRU-Q1(Aco)
2010
128.07
631.03
603.99
166.96
12.07
2.94
2.11
BS-NoRU-Q1(Aco)
2011
54.16
84.23
313.02
292.21
54.91
1.71
1.46
BS-NoRU-Q1(Aco)
2012
191.63
48.84
88.12
310.6
172.52
30.09
1.01
BS-NoRU-Q1(Aco)
2013
67.29
146.77
35.41
53.03
223.77
102.68
14.37
BS-NoRU-Q1(Aco)
2014
334.82
39.12
108.72
23.18
34.77
86.36
38.82
BS-NoRU-Q1(Aco)
2015
24.35
189.4
26.63
46.13
9.22
22.45
31.99
BS-NoRU-Q1(Aco)
2016
71.81
12.08
59.62
12.52
17.28
7.48
33.24
BS-NoRU-Q1(Aco)
2017
81.15
65.05
4.81
34.81
6.24
7.93
17.72
BS-NoRU-Q1(Aco)
2018
171.03
62.74
64.4
6.77
15.57
2.75
14.69
BS-NoRU-Q1(Aco)
2019
507.61
146.22
31.73
21.88
4.72
3.46
4.19
BS-NoRU-Q1(Aco)
2020
286.32
306.38
79.18
22.38
11.59
1.84
6.33
BS-NoRU-Q1(Aco)
2021
50.76
130.37
181.8
19.35
5.44
0.94
1.77
BS-NoRU-Q1(Aco)
2022
11.35
63.4
95.3
101.24
11.79
0.82
1.08
BS-NoRU-Q1(Aco)
2023
76.99
9.02
51.28
53.25
38.07
2.69
0.49
BS-NoRu-Q1 (BTr)
1994
314.533
436.251
46.176
3.54
0.163
0.13
0.2
0.651
BS-NoRu-Q1 (BTr)
1995
54.857
167.104
343.38
29.623
1.441
0.025
0.043
0.404
BS-NoRu-Q1 (BTr)
1996
55.843
31.334
150.768
238.108
16.131
1.15
0
0.069
BS-NoRu-Q1 (BTr)
1997
79.632
39.855
18.255
61.566
88.411
3.277
0.082
0.043
BS-NoRu-Q1 (BTr)
1998
21.681
36.749
11.844
1.294
9.203
7.212
0.648
0.092
BS-NoRu-Q1 (BTr)
1999
56.92
15.874
9.418
2.831
0.807
1.282
0.771
0.034
BS-NoRu-Q1 (BTr)
2000
24.08
35.241
6.789
4.134
0.684
0.083
0.802
0.288
BS-NoRu-Q1 (BTr)
2001
293.996
26.252
22.997
1.634
0.752
0.058
0.06
0.329
BS-NoRu-Q1 (BTr)
2002
312.87
185.453
12.417
8.04
0.846
0.218
0.009
0.325
BS-NoRu-Q1 (BTr)
2003
352.236
174.452
72.708
5.104
1.682
0.119
0.104
0.217
BS-NoRu-Q1 (BTr)
2004
173.132
100.516
77.021
51.281
7.409
0.912
0.133
0.228
BS-NoRu-Q1 (BTr)
2005
317.889
141.058
50.664
61.191
10.082
0.249
0.08
0.009
BS-NoRu-Q1 (BTr)
2006
78.798
130.76
46.048
20.874
16.208
3.184
0.094
0.265
BS-NoRu-Q1 (BTr)
2007
443.266
81.784
84.667
26.279
5.411
2.197
1.376
0.896
BS-NoRu-Q1 (BTr)
2008
1591.031
583.606
53.079
54.732
6.794
10.248
0.23
0.167
BS-NoRu-Q1 (BTr)
2009
1230.426
751.012
368.33
25.414
12.437
0.851
0.09
0.363
BS-NoRu-Q1 (BTr)
2010
102.451
510.449
443.759
139.316
7.988
1.016
0.386
0.574
BS-NoRu-Q1 (BTr)
2011
52.883
123.634
469.482
290.036
65.236
1.416
1.121
0.184
BS-NoRu-Q1 (BTr)
2012
316.077
28.785
74.714
267.945
154.601
24.766
3.115
0.391
BS-NoRu-Q1 (BTr)
2013
57.444
143.984
22.019
33.624
191.145
69.385
6.114
0.076
BS-NoRu-Q1 (BTr)
2014
381.173
32.729
104.397
23.257
50.035
97.536
38.692
2.425
BS-NoRu-Q1 (BTr)
2015
30.615
187.035
43.601
39.44
14.668
18.735
30.744
10.2
BS-NoRu-Q1 (BTr)
2016
163.385
34.342
115.597
22.406
41.948
12.437
32.396
33.161
BS-NoRu-Q1 (BTr)
2017
134.9
105.5
7.553
55.338
9.692
15.6
2.527
23.861
BS-NoRu-Q1 (BTr)
2018
336.307
86.656
65.764
7.771
15.59
3.621
2.564
11.931
BS-NoRu-Q1 (BTr)
2019
1075.552
187.224
49.399
16.996
4.038
2.948
0.736
1.91
BS-NoRu-Q1 (BTr)
2020
424.225
586.985
99.123
22.08
6.057
2.605
1.042
2.827
BS-NoRu-Q1 (BTr)
2021
111.35
176.57
265.49
19.32
3.57
0.68
0.19
0.72
BS-NoRu-Q1 (BTr)
2022
12.226
86.54
121.699
113.566
9.099
0.617
0.113
0.44
BS-NoRu-Q1 (BTr)
2023
82.055
8.058
50.201
49.022
33.313
2.168
0.096
0.318
FLT007: Eco-NoRu-Q3 (Btr)
2004
123.368
70.303
69.118
31.482
2.989
1.721
0.22
FLT007: Eco-NoRu-Q3 (Btr)
2005
324.56
89.531
30.44
32.246
15.035
0.472
1.116
FLT007: Eco-NoRu-Q3 (Btr)
2006
107.467
124.64
41.597
18.98
17.482
7.289
1.384
FLT007: Eco-NoRu-Q3 (Btr)
2007
1282.94
88.498
90.369
19.227
5.881
7.102
3.209
FLT007: Eco-NoRu-Q3 (Btr)
2008
1154.869
405.999
43.133
35.517
4.94
2.514
2.539
FLT007: Eco-NoRu-Q3 (Btr)
2009
650.742
619.088
305.883
21.045
6.549
0.87
0.576
FLT007: Eco-NoRu-Q3 (Btr)
2010
184.001
865.318
666.439
147.72
15.84
2.73
0.589
FLT007: Eco-NoRu-Q3 (Btr)
2011
40.446
73.802
392.93
301.368
37.357
2.972
0.514
FLT007: Eco-NoRu-Q3 (Btr)
2012
92.468
20.348
67.607
214.052
152.03
12.739
2.003
FLT007: Eco-NoRu-Q3 (Btr)
2013
25.779
65.228
19.575
50.846
150.131
76.427
7.561
FLT007: Eco-NoRu-Q3 (Btr)
2014
261.631
40.768
70.161
25.781
60.452
85.771
19.646
FLT007: Eco-NoRu-Q3 (Btr)
2015
42.148
213.636
25.132
37.111
20.577
47.868
42.903
FLT007: Eco-NoRu-Q3 (Btr)
2016
209.303
34.43
184.09
47.965
56.787
40.367
125.907
FLT007: Eco-NoRu-Q3 (Btr)
2017
70.313
70.306
11.47
20.537
3.963
4.025
15.265
FLT007: Eco-NoRu-Q3 (Btr)
2018
-1
-1
-1
-1
-1
-1
-1
FLT007: Eco-NoRu-Q3 (Btr)
2019
896.982
160.736
38.067
15.133
5.303
5.037
11.56
FLT007: Eco-NoRu-Q3 (Btr)
2020
204.059
341.372
58.813
4.918
1.959
0.802
1.483
FLT007: Eco-NoRu-Q3 (Btr)
2021
129.533
345.768
330.627
32.25
5.446
0.885
1.41
FLT007: Eco-NoRu-Q3 (Btr)
2022
-1
-1
-1
-1
-1
-1
-1
Table 4.10 SAM model configuration used. Updated at WKDEM 2020
#Configuration saved: Wed Feb 12 12:57:09 2020
# Where a matrix is specified rows corresponds to fleets and columns to ages.
# Same number indicates same parameter used
# Numbers (integers) starts from zero and must be consecutive
$minAge
# The minimum age class in the assessment
3
$maxAge
# The maximum age class in the assessment
13
$maxAgePlusGroup
# Is last age group considered a plus group for each fleet (1 yes, or 0 no).
1 1 1 1 1
$keyLogFsta
# Coupling of the fishing mortality states (nomally only first row is used).
0 1 2 3 4 5 5 5 5 5 5
-1 -1 -1 -1 -1 -1 -1 -1 -1 -1 -1
-1 -1 -1 -1 -1 -1 -1 -1 -1 -1 -1
-1 -1 -1 -1 -1 -1 -1 -1 -1 -1 -1
-1 -1 -1 -1 -1 -1 -1 -1 -1 -1 -1
$corFlag
# Correlation of fishing mortality across ages (0 independent, 1 compound symmetry, 2 AR(1), 3 separable AR(1).
2
$keyLogFpar
# Coupling of the survey catchability parameters (nomally first row is not used, as that is covered by fishing mortality).
-1 -1 -1 -1 -1 -1 -1 -1 -1 -1 -1
0 1 1 1 1 1 -1 -1 -1 -1 -1
2 3 3 3 3 4 4 -1 -1 -1 -1
5 6 6 6 6 7 7 7 -1 -1 -1
8 9 9 9 9 9 9 -1 -1 -1 -1
$keyQpow
# Density dependent catchability power parameters (if any).
-1 -1 -1 -1 -1 -1 -1 -1 -1 -1 -1
0 0 0 0 0 0 -1 -1 -1 -1 -1
1 1 1 1 1 2 2 -1 -1 -1 -1
3 3 3 3 3 4 4 4 -1 -1 -1
5 5 5 5 5 5 5 -1 -1 -1 -1
$keyVarF
# Coupling of process variance parameters for log(F)-process (nomally only first row is used)
0 1 1 1 1 1 1 1 1 1 1
-1 -1 -1 -1 -1 -1 -1 -1 -1 -1 -1
-1 -1 -1 -1 -1 -1 -1 -1 -1 -1 -1
-1 -1 -1 -1 -1 -1 -1 -1 -1 -1 -1
-1 -1 -1 -1 -1 -1 -1 -1 -1 -1 -1
$keyVarLogN
# Coupling of process variance parameters for log(N)-process
0 1 1 1 1 1 1 1 1 1 1
$keyVarObs
# Coupling of the variance parameters for the observations.
0 1 2 2 2 2 2 2 2 2 2
3 3 3 3 3 3 -1 -1 -1 -1 -1
4 4 4 4 4 4 4 -1 -1 -1 -1
5 5 5 5 5 5 5 5 -1 -1 -1
6 6 6 6 6 6 6 -1 -1 -1 -1
$obsCorStruct
# Covariance structure for each fleet ("ID" independent, "AR" AR(1), or "US" for unstructured). | Possible values are: "ID" "AR" "US"
"ID" "AR" "AR" "AR" "AR"
$keyCorObs
# Coupling of correlation parameters can only be specified if the AR(1) structure is chosen above.
# NA's indicate where correlation parameters can be specified (-1 where they cannot).
#V1 V2 V3 V4 V5 V6 V7 V8 V9 V10
NA NA NA NA NA NA NA NA NA NA
0 1 1 1 2 -1 -1 -1 -1 -1
3 3 3 3 3 4 -1 -1 -1 -1
5 5 5 5 5 6 6 -1 -1 -1
7 7 7 7 7 7 -1 -1 -1 -1
$stockRecruitmentModelCode
# Stock recruitment code (0 for plain random walk, 1 for Ricker, 2 for Beverton–Holt, and 3 piece-wise constant).
0
$noScaledYears
# Number of years where catch scaling is applied.
0
$keyScaledYears
# A vector of the years where catch scaling is applied.
$keyParScaledYA
# A matrix specifying the couplings of scale parameters (nrow = no scaled years, ncols = no ages).
$fbarRange
# lowest and higest age included in Fbar
4 7
$keyBiomassTreat
# To be defined only if a biomass survey is used (0 SSB index, 1 catch index, 2 FSB index, 3 total catch, 4 total landings and 5 TSB index).
-1 -1 -1 -1 -1
$obsLikelihoodFlag
# Option for observational likelihood | Possible values are: "LN" "ALN"
"LN" "LN" "LN" "LN" "LN"
$fixVarToWeight
# If weight attribute is supplied for observations this option sets the treatment (0 relative weight, 1 fix variance to weight).
0
$fracMixF
# The fraction of t(3) distribution used in logF increment distribution
0
$fracMixN
# The fraction of t(3) distribution used in logN increment distribution
0
$fracMixObs
# A vector with same length as number of fleets, where each element is the fraction of t(3) distribution used in the distribution of that fleet
0 0 0 0 0
$constRecBreaks
# This option is only used in combination with stock-recruitment code 3)
$predVarObsLink
# Coupling of parameters used in a mean-variance link for observations.
0 1 2 2 2 2 2 2 2 2 2
3 3 3 3 3 3 -1 -1 -1 -1 -1
4 4 4 4 4 4 4 -1 -1 -1 -1
5 5 5 5 5 5 5 5 -1 -1 -1
6 6 6 6 6 6 6 -1 -1 -1 -1
Table 4.11. Northeast Arctic haddock. SAM model. Estimated recruitment, spawning-stock biomass (SSB), and average fishing mortality (Fbar ages 4.-7).
Year
R(age 3)
Low
High
SSB
Low
High
Fbar(4-7)
Low
High
TSB
Low
High
1950
109623
69719
172368
213220
191156
237830
0.792
0.672
0.934
397004
356438
442186
1951
631600
419651
950595
124921
110924
140684
0.681
0.574
0.808
426981
341432
533963
1952
84773
54716
131341
100892
88188
115426
0.702
0.587
0.839
414536
331663
518118
1953
1185570
788600
1782370
120474
104198
139293
0.531
0.440
0.642
714903
552489
925061
1954
131072
84429
203482
173396
147339
204060
0.430
0.354
0.521
810761
643156
1022044
1955
59015
37632
92549
310699
265693
363330
0.448
0.372
0.539
839986
709844
993988
1956
224093
143883
349018
365196
311618
427984
0.473
0.394
0.569
683432
588380
793838
1957
60604
38656
95014
253014
217173
294769
0.427
0.356
0.512
432917
376615
497637
1958
73937
47720
114558
181479
157787
208730
0.517
0.431
0.622
314741
277314
357219
1959
385837
255412
582864
125376
108965
144258
0.444
0.367
0.538
332385
274589
402346
1960
316609
207861
482251
112820
99557
127849
0.540
0.451
0.646
416093
347620
498055
1961
142992
94247
216948
124521
110996
139694
0.663
0.561
0.784
399847
348322
458994
1962
290838
193209
437798
124755
110917
140319
0.793
0.674
0.932
373918
322982
432887
1963
312452
209219
466621
93953
82727
106701
0.759
0.637
0.903
350254
294071
417171
1964
352527
234648
529623
84272
74117
95818
0.633
0.526
0.761
384525
319428
462887
1965
126418
82446
193844
103006
90021
117864
0.525
0.435
0.634
385699
326833
455168
1966
311649
205173
473380
145159
126569
166479
0.559
0.466
0.670
448964
384402
524368
1967
339662
223233
516817
150924
130293
174822
0.442
0.366
0.534
462635
390044
548737
1968
18632
11581
29976
167460
145218
193109
0.484
0.400
0.586
424534
360952
499316
1969
20419
12678
32884
167225
143902
194328
0.414
0.338
0.506
315395
270631
367564
1970
207491
134384
320370
154939
131625
182383
0.385
0.312
0.475
285433
241116
337894
1971
111175
72211
171164
127393
107531
150922
0.327
0.262
0.407
263185
224203
308944
1972
1070502
702592
1631067
128356
111626
147594
0.657
0.540
0.801
607473
464904
793764
1973
313265
207865
472108
124981
107671
145074
0.537
0.440
0.656
636571
512649
790447
1974
65486
42670
100502
153799
134217
176238
0.502
0.415
0.608
463526
400797
536073
1975
59189
38540
90901
194901
167177
227223
0.496
0.414
0.593
378744
329157
435801
1976
60684
38901
94664
195998
168532
227941
0.719
0.606
0.852
295485
258996
337114
1977
121979
76877
193541
118883
100338
140857
0.736
0.608
0.890
201169
172504
234598
1978
214424
142356
322979
80977
67141
97665
0.626
0.510
0.769
198729
164562
239989
1979
160926
106383
243435
62345
52497
74039
0.582
0.470
0.722
205414
171253
246389
1980
23213
14499
37164
62642
53262
73674
0.474
0.381
0.590
212528
177897
253901
1981
10753
6412
18033
72614
61489
85753
0.435
0.349
0.542
168102
142110
198848
1982
16720
10242
27295
68575
56806
82784
0.381
0.303
0.479
122827
103001
146468
1983
8149
4776
13902
58539
48137
71188
0.348
0.273
0.445
87910
73704
104855
1984
12959
7947
21134
53258
43476
65242
0.314
0.244
0.405
71641
59861
85740
1985
359312
236221
546544
49122
40892
59009
0.397
0.312
0.505
191609
141398
259649
1986
475093
314149
718492
54736
46432
64525
0.536
0.427
0.673
372994
294625
472209
1987
91356
59208
140957
77455
66308
90476
0.630
0.508
0.782
354567
296956
423354
1988
39791
25056
63192
79718
67210
94553
0.512
0.411
0.637
253803
215631
298733
1989
28136
17461
45338
84374
69643
102221
0.372
0.296
0.468
192610
161616
229549
1990
36625
23539
56987
86094
70227
105547
0.211
0.165
0.268
153642
128637
183508
1991
109109
76849
154913
100514
84514
119543
0.239
0.191
0.299
185561
158658
217025
1992
322033
229560
451758
110630
95699
127889
0.296
0.239
0.366
287771
242054
342123
1993
826301
602336
1133542
124712
110048
141329
0.319
0.260
0.391
516687
429018
622272
1994
393766
319529
485252
156442
139995
174822
0.375
0.310
0.453
640827
561985
730730
1995
100598
78995
128108
190422
170029
213262
0.302
0.254
0.359
637221
564547
719251
1996
100245
79110
127026
220324
196959
246461
0.369
0.314
0.433
553666
494787
619551
1997
120223
95102
151980
191369
170872
214324
0.448
0.380
0.529
400900
360744
445527
1998
63423
49360
81492
133091
118110
149971
0.454
0.381
0.541
266552
239365
296826
1999
149058
119876
185343
96283
85445
108497
0.463
0.385
0.558
232836
208217
260366
2000
83495
65831
105898
79739
70662
89982
0.342
0.281
0.417
213699
189394
241123
2001
364169
299709
442494
93068
83120
104206
0.369
0.307
0.444
317315
281258
357995
2002
391892
321807
477240
111070
99298
124238
0.354
0.295
0.425
433151
383747
488916
2003
338236
273815
417813
140482
126288
156272
0.428
0.362
0.505
503391
449690
563505
2004
259668
213462
315874
159092
143041
176944
0.392
0.334
0.461
491520
442065
546507
2005
362149
299324
438161
170323
153202
189358
0.408
0.348
0.478
507710
457400
563553
2006
156383
127361
192018
154878
139215
172302
0.372
0.316
0.439
437455
394265
485375
2007
529730
435759
643965
156349
140853
173550
0.389
0.330
0.460
499998
449165
556584
2008
1082898
900454
1302306
165612
148176
185101
0.320
0.268
0.382
722543
638944
817079
2009
1006157
838256
1207688
188052
168383
210019
0.266
0.223
0.317
979507
864231
1110158
2010
238242
194758
291435
253718
226928
283670
0.250
0.212
0.296
1107953
978842
1254094
2011
118425
94405
148557
365658
326967
408928
0.262
0.224
0.307
1160931
1033094
1304588
2012
338277
277459
412427
480739
426855
541425
0.225
0.192
0.265
1155519
1029885
1296479
2013
119004
95182
148787
527223
466340
596054
0.151
0.126
0.179
990749
882849
1111837
2014
408463
336651
495592
526488
469008
591013
0.156
0.131
0.187
974511
877083
1082763
2015
72818
57371
92425
499967
449971
555517
0.191
0.160
0.228
865793
784065
956039
2016
211215
171518
260100
491826
443504
545413
0.262
0.222
0.310
796459
722086
878493
2017
195172
158817
239849
411777
373750
453673
0.351
0.298
0.414
697005
634732
765387
2018
361715
294755
443888
304028
275111
335985
0.406
0.345
0.477
605919
549120
668592
2019
803698
664905
971462
233785
211128
258874
0.437
0.368
0.519
666438
597228
743667
2020
432773
355823
526363
196925
176888
219231
0.449
0.377
0.535
684255
609425
768272
2021
162387
129606
203461
188827
167976
212267
0.439
0.366
0.526
628726
557559
708976
2022
44865
32747
61469
196492
168994
228465
0.351
0.284
0.434
532782
460835
615961
2023
157204
117650
210057
210340
169939
260346
454403
373476
552864
Table 4.12. Northeast Arctic haddock. SAM model estimated fishing mortality-at-age. SAM model.
Year Age
3
4
5
6
7
8
9
10
11
12
13
1950
0.196
0.478
0.750
0.873
1.069
0.895
0.895
0.895
0.895
0.895
0.895
1951
0.131
0.369
0.614
0.766
0.975
0.881
0.881
0.881
0.881
0.881
0.881
1952
0.125
0.376
0.627
0.784
1.021
0.930
0.930
0.930
0.930
0.930
0.930
1953
0.081
0.277
0.467
0.582
0.798
0.737
0.737
0.737
0.737
0.737
0.737
1954
0.055
0.206
0.357
0.467
0.689
0.650
0.650
0.650
0.650
0.650
0.650
1955
0.051
0.200
0.371
0.505
0.716
0.605
0.605
0.605
0.605
0.605
0.605
1956
0.055
0.210
0.392
0.554
0.738
0.626
0.626
0.626
0.626
0.626
0.626
1957
0.050
0.198
0.369
0.494
0.646
0.550
0.550
0.550
0.550
0.550
0.550
1958
0.061
0.235
0.451
0.601
0.782
0.692
0.692
0.692
0.692
0.692
0.692
1959
0.061
0.228
0.409
0.521
0.619
0.567
0.567
0.567
0.567
0.567
0.567
1960
0.096
0.318
0.538
0.633
0.671
0.615
0.615
0.615
0.615
0.615
0.615
1961
0.127
0.406
0.684
0.782
0.782
0.694
0.694
0.694
0.694
0.694
0.694
1962
0.160
0.501
0.858
0.944
0.867
0.722
0.722
0.722
0.722
0.722
0.722
1963
0.140
0.468
0.808
0.912
0.846
0.682
0.682
0.682
0.682
0.682
0.682
1964
0.098
0.358
0.635
0.771
0.766
0.648
0.648
0.648
0.648
0.648
0.648
1965
0.076
0.292
0.514
0.637
0.657
0.567
0.567
0.567
0.567
0.567
0.567
1966
0.091
0.330
0.565
0.669
0.671
0.556
0.556
0.556
0.556
0.556
0.556
1967
0.072
0.269
0.447
0.516
0.536
0.465
0.465
0.465
0.465
0.465
0.465
1968
0.085
0.300
0.493
0.556
0.589
0.514
0.514
0.514
0.514
0.514
0.514
1969
0.080
0.270
0.431
0.471
0.483
0.417
0.417
0.417
0.417
0.417
0.417
1970
0.083
0.265
0.404
0.429
0.441
0.382
0.382
0.382
0.382
0.382
0.382
1971
0.072
0.234
0.351
0.355
0.366
0.324
0.324
0.324
0.324
0.324
0.324
1972
0.213
0.509
0.765
0.698
0.656
0.546
0.546
0.546
0.546
0.546
0.546
1973
0.219
0.491
0.646
0.532
0.479
0.382
0.382
0.382
0.382
0.382
0.382
1974
0.190
0.430
0.545
0.513
0.521
0.460
0.460
0.460
0.460
0.460
0.460
1975
0.208
0.457
0.546
0.493
0.486
0.417
0.417
0.417
0.417
0.417
0.417
1976
0.321
0.644
0.782
0.721
0.727
0.640
0.640
0.640
0.640
0.640
0.640
1977
0.364
0.713
0.854
0.718
0.657
0.559
0.559
0.559
0.559
0.559
0.559
1978
0.243
0.549
0.731
0.646
0.577
0.505
0.505
0.505
0.505
0.505
0.505
1979
0.168
0.444
0.674
0.654
0.558
0.502
0.502
0.502
0.502
0.502
0.502
1980
0.102
0.318
0.529
0.567
0.483
0.460
0.460
0.460
0.460
0.460
0.460
1981
0.085
0.276
0.476
0.542
0.447
0.430
0.430
0.430
0.430
0.430
0.430
1982
0.074
0.246
0.413
0.478
0.387
0.381
0.381
0.381
0.381
0.381
0.381
1983
0.075
0.245
0.385
0.424
0.340
0.339
0.339
0.339
0.339
0.339
0.339
1984
0.067
0.226
0.347
0.376
0.308
0.292
0.292
0.292
0.292
0.292
0.292
1985
0.075
0.259
0.415
0.484
0.431
0.413
0.413
0.413
0.413
0.413
0.413
1986
0.088
0.315
0.542
0.667
0.619
0.587
0.587
0.587
0.587
0.587
0.587
1987
0.100
0.359
0.647
0.789
0.726
0.659
0.659
0.659
0.659
0.659
0.659
1988
0.072
0.278
0.514
0.660
0.595
0.539
0.539
0.539
0.539
0.539
0.539
1989
0.055
0.219
0.387
0.467
0.414
0.363
0.363
0.363
0.363
0.363
0.363
1990
0.027
0.127
0.214
0.255
0.247
0.231
0.231
0.231
0.231
0.231
0.231
1991
0.030
0.136
0.243
0.291
0.285
0.262
0.262
0.262
0.262
0.262
0.262
1992
0.031
0.148
0.294
0.368
0.373
0.341
0.341
0.341
0.341
0.341
0.341
1993
0.025
0.131
0.295
0.411
0.440
0.400
0.400
0.400
0.400
0.400
0.400
1994
0.023
0.127
0.309
0.481
0.582
0.547
0.547
0.547
0.547
0.547
0.547
1995
0.018
0.101
0.235
0.371
0.500
0.493
0.493
0.493
0.493
0.493
0.493
1996
0.024
0.126
0.290
0.444
0.617
0.624
0.624
0.624
0.624
0.624
0.624
1997
0.032
0.160
0.377
0.538
0.718
0.686
0.686
0.686
0.686
0.686
0.686
1998
0.038
0.180
0.404
0.554
0.678
0.680
0.680
0.680
0.680
0.680
0.680
1999
0.047
0.205
0.434
0.562
0.653
0.627
0.627
0.627
0.627
0.627
0.627
2000
0.033
0.160
0.327
0.414
0.468
0.440
0.440
0.440
0.440
0.440
0.440
2001
0.035
0.165
0.359
0.459
0.493
0.451
0.451
0.451
0.451
0.451
0.451
2002
0.031
0.153
0.324
0.456
0.483
0.424
0.424
0.424
0.424
0.424
0.424
2003
0.037
0.172
0.371
0.536
0.632
0.573
0.573
0.573
0.573
0.573
0.573
2004
0.035
0.161
0.334
0.489
0.583
0.551
0.551
0.551
0.551
0.551
0.551
2005
0.038
0.166
0.339
0.499
0.627
0.606
0.606
0.606
0.606
0.606
0.606
2006
0.037
0.161
0.319
0.448
0.562
0.553
0.553
0.553
0.553
0.553
0.553
2007
0.039
0.161
0.324
0.472
0.599
0.581
0.581
0.581
0.581
0.581
0.581
2008
0.025
0.115
0.234
0.390
0.541
0.536
0.536
0.536
0.536
0.536
0.536
2009
0.020
0.091
0.183
0.314
0.474
0.490
0.490
0.490
0.490
0.490
0.490
2010
0.020
0.087
0.174
0.294
0.447
0.499
0.499
0.499
0.499
0.499
0.499
2011
0.022
0.091
0.190
0.312
0.457
0.500
0.500
0.500
0.500
0.500
0.500
2012
0.021
0.084
0.163
0.271
0.383
0.410
0.410
0.410
0.410
0.410
0.410
2013
0.014
0.062
0.109
0.173
0.257
0.318
0.318
0.318
0.318
0.318
0.318
2014
0.016
0.070
0.122
0.180
0.253
0.353
0.353
0.353
0.353
0.353
0.353
2015
0.022
0.090
0.161
0.224
0.289
0.402
0.402
0.402
0.402
0.402
0.402
2016
0.029
0.116
0.226
0.314
0.392
0.514
0.514
0.514
0.514
0.514
0.514
2017
0.038
0.150
0.307
0.441
0.508
0.592
0.592
0.592
0.592
0.592
0.592
2018
0.037
0.156
0.353
0.527
0.588
0.641
0.641
0.641
0.641
0.641
0.641
2019
0.035
0.156
0.382
0.607
0.603
0.604
0.604
0.604
0.604
0.604
0.604
2020
0.035
0.157
0.398
0.617
0.624
0.598
0.598
0.598
0.598
0.598
0.598
2021
0.034
0.153
0.388
0.597
0.618
0.622
0.622
0.622
0.622
0.622
0.622
2022
0.031
0.137
0.330
0.462
0.474
0.474
0.474
0.474
0.474
0.474
0.474
Table 4.13. Northeast Arctic haddock. SAM model. Estimated stock numbers-at-age.
Year Age
3
4
5
6
7
8
9
10
11
12
13
1950
109623
99515
73946
36861
46641
16609
4900
2693
1380
1454
2052
1951
631600
55863
45199
26869
12660
12380
5398
1921
1001
444
1088
1952
84773
422627
32356
19106
8994
4308
3835
1643
729
354
507
1953
1185570
50064
209430
14435
6404
2655
1333
1060
535
250
306
1954
131072
889554
25847
91806
6993
2344
1091
548
391
200
225
1955
59015
84026
623259
14553
51921
3113
925
454
236
161
168
1956
224093
40838
55764
321772
7224
17672
1442
403
213
112
153
1957
60604
149066
27687
35841
110868
3084
6149
697
168
98
128
1958
73937
40105
92201
15498
20678
40168
1623
2516
348
84
117
1959
385837
51762
26132
40054
7328
7278
14901
718
906
145
86
1960
316609
264126
35758
15636
17097
3472
3648
6190
356
374
107
1961
142992
190773
144816
17679
6966
8027
1593
1508
2803
155
205
1962
290838
85322
91871
59513
6759
2704
3279
658
611
1162
140
1963
312452
174643
37745
26397
17531
2638
1086
1229
272
244
536
1964
352527
198348
75316
12255
7694
5828
1214
440
509
121
344
1965
126418
239839
114736
30289
4177
2797
2268
531
198
218
209
1966
311649
82240
158397
61955
12357
1710
1281
949
268
91
187
1967
339662
199815
43537
72456
24781
4869
792
603
452
131
132
1968
18632
245726
117726
21891
36059
12463
2357
411
314
234
137
1969
20419
12004
141328
55071
10677
15754
5749
1166
198
156
175
1970
207491
12565
7544
70208
25122
5889
8057
3012
644
106
185
1971
111175
133807
7132
4514
33401
12287
3348
4546
1694
371
163
1972
1070502
80551
81578
4518
3097
17569
6743
2010
2775
1028
315
1973
313265
609383
46109
23259
1694
1534
7653
2911
924
1375
612
1974
65486
168837
251149
16511
10675
880
999
4454
1683
545
1217
1975
59189
37029
90428
140453
6825
4965
447
553
2147
818
930
1976
60684
33566
16530
44304
78976
3167
2772
245
327
1149
966
1977
121979
30693
13743
6449
17664
30350
1292
1184
103
145
812
1978
214424
54722
9660
4446
2891
7748
15067
630
563
45
432
1979
160926
116800
23166
3236
2033
1399
4093
7080
337
273
227
1980
23213
102283
58300
8304
1154
1042
713
2155
3484
174
240
1981
10753
16073
63188
26202
3457
552
554
378
1134
1718
214
1982
16720
7005
11187
31651
10536
1724
278
305
215
619
961
1983
8149
11334
4726
6844
13601
5608
984
147
176
125
807
1984
12959
4960
6715
2782
3900
8812
2897
578
81
103
521
1985
359312
8881
2854
3616
1794
2567
5356
1845
368
52
398
1986
475093
276662
5201
1574
1848
994
1468
2791
1026
205
261
1987
91356
249222
155831
2542
646
792
469
676
1207
470
208
1988
39791
70206
135366
46356
1063
231
320
204
299
507
280
1989
28136
26115
49172
70655
12224
545
95
152
98
144
365
1990
36625
20735
17302
26218
32801
5514
350
58
87
56
277
1991
109109
24790
13634
14134
20183
20285
3159
246
39
57
205
1992
322033
82805
15932
10079
10383
12604
12643
1898
162
26
158
1993
826301
221025
56917
10585
5914
6226
7641
7271
1055
99
107
1994
393766
572759
152794
31377
4664
3146
3737
4744
4308
596
115
1995
100598
224101
428082
77772
14595
2088
1430
1856
2184
2128
339
1996
100245
61795
167529
246266
32037
7266
1079
709
929
1093
1253
1997
120223
55556
38088
95697
103026
13997
2526
490
312
411
1083
1998
63423
80159
35203
18059
36783
38928
5244
995
208
131
698
1999
149058
48420
47439
17478
8872
15850
13861
1922
412
92
380
2000
83495
118561
30873
21467
6897
4301
6600
5451
816
188
226
2001
364169
69036
93286
16779
10213
3519
2579
3523
2683
439
234
2002
391892
294294
51864
47700
9142
5508
1893
1444
1932
1409
354
2003
338236
257652
193472
34354
24646
4595
3471
1218
827
1092
999
2004
259668
170475
164074
111001
16400
10905
2145
1647
610
391
1064
2005
362149
170200
94356
109327
50823
6652
5559
1139
733
306
782
2006
156383
215933
108515
52020
44900
20854
3216
2821
554
345
529
2007
529730
120423
164703
61199
26744
19335
8222
1748
1474
283
439
2008
1082898
452799
97021
102901
21815
14087
7194
3317
885
714
353
2009
1006157
704569
372586
62189
40083
10345
5338
3155
1462
484
582
2010
238242
668207
593168
231950
32390
15223
4822
2730
1609
780
624
2011
118425
191334
545119
421278
122220
14345
6229
2135
1342
827
802
2012
338277
73590
137008
392916
265836
54954
6207
2591
1040
696
922
2013
119004
198814
58125
94933
272212
127779
23887
3195
1416
591
966
2014
408463
73709
145482
50016
87912
146010
62030
10947
1881
886
984
2015
72818
283525
65858
92635
40753
69890
74091
25930
5400
1025
1026
2016
211215
49652
167859
46340
61953
33696
49712
38248
12937
2595
1008
2017
195172
175360
34021
110016
28306
36698
18879
22005
18099
5665
1499
2018
361715
135419
124971
24834
43862
14742
17957
8956
9322
8556
3162
2019
803698
238352
87983
62961
16612
17572
6986
7674
3716
3910
4306
2020
432773
513996
157212
45875
22832
8832
7199
3475
3278
1773
3409
2021
162387
269777
347368
70355
19576
8636
4129
2977
1687
1538
2308
2022
44865
143622
190956
177748
32764
7624
3506
1791
1228
772
1652
2023
157204
28014
107132
112780
88935
17075
3594
1770
908
624
1227
Table 4.14. Northeast Arctic haddock. SAM model. Natural mortality estimated age 3-6 from 0.20 + consumption from cod, ages 7-13+ natural mortality set to 0.2
+
Year
3
4
5
6
7
8
9
10
11
12
13
1950
0.345
0.255
0.241
0.239
0.200
0.200
0.200
0.200
0.200
0.200
0.200
1951
0.345
0.255
0.241
0.239
0.200
0.200
0.200
0.200
0.200
0.200
0.200
1952
0.345
0.255
0.241
0.239
0.200
0.200
0.200
0.200
0.200
0.200
0.200
1953
0.345
0.255
0.241
0.239
0.200
0.200
0.200
0.200
0.200
0.200
0.200
1954
0.345
0.255
0.241
0.239
0.200
0.200
0.200
0.200
0.200
0.200
0.200
1955
0.345
0.255
0.241
0.239
0.200
0.200
0.200
0.200
0.200
0.200
0.200
1956
0.345
0.255
0.241
0.239
0.200
0.200
0.200
0.200
0.200
0.200
0.200
1957
0.345
0.255
0.241
0.239
0.200
0.200
0.200
0.200
0.200
0.200
0.200
1958
0.345
0.255
0.241
0.239
0.200
0.200
0.200
0.200
0.200
0.200
0.200
1959
0.345
0.255
0.241
0.239
0.200
0.200
0.200
0.200
0.200
0.200
0.200
1960
0.345
0.255
0.241
0.239
0.200
0.200
0.200
0.200
0.200
0.200
0.200
1961
0.345
0.255
0.241
0.239
0.200
0.200
0.200
0.200
0.200
0.200
0.200
1962
0.345
0.255
0.241
0.239
0.200
0.200
0.200
0.200
0.200
0.200
0.200
1963
0.345
0.255
0.241
0.239
0.200
0.200
0.200
0.200
0.200
0.200
0.200
1964
0.345
0.255
0.241
0.239
0.200
0.200
0.200
0.200
0.200
0.200
0.200
1965
0.345
0.255
0.241
0.239
0.200
0.200
0.200
0.200
0.200
0.200
0.200
1966
0.345
0.255
0.241
0.239
0.200
0.200
0.200
0.200
0.200
0.200
0.200
1967
0.345
0.255
0.241
0.239
0.200
0.200
0.200
0.200
0.200
0.200
0.200
1968
0.345
0.255
0.241
0.239
0.200
0.200
0.200
0.200
0.200
0.200
0.200
1969
0.345
0.255
0.241
0.239
0.200
0.200
0.200
0.200
0.200
0.200
0.200
1970
0.345
0.255
0.241
0.239
0.200
0.200
0.200
0.200
0.200
0.200
0.200
1971
0.345
0.255
0.241
0.239
0.200
0.200
0.200
0.200
0.200
0.200
0.200
1972
0.345
0.255
0.241
0.239
0.200
0.200
0.200
0.200
0.200
0.200
0.200
1973
0.345
0.255
0.241
0.239
0.200
0.200
0.200
0.200
0.200
0.200
0.200
1974
0.345
0.255
0.241
0.239
0.200
0.200
0.200
0.200
0.200
0.200
0.200
1975
0.345
0.255
0.241
0.239
0.200
0.200
0.200
0.200
0.200
0.200
0.200
1976
0.345
0.255
0.241
0.239
0.200
0.200
0.200
0.200
0.200
0.200
0.200
1977
0.345
0.255
0.241
0.239
0.200
0.200
0.200
0.200
0.200
0.200
0.200
1978
0.345
0.255
0.241
0.239
0.200
0.200
0.200
0.200
0.200
0.200
0.200
1979
0.345
0.255
0.241
0.239
0.200
0.200
0.200
0.200
0.200
0.200
0.200
1980
0.345
0.255
0.241
0.239
0.200
0.200
0.200
0.200
0.200
0.200
0.200
1981
0.345
0.255
0.241
0.239
0.200
0.200
0.200
0.200
0.200
0.200
0.200
1982
0.345
0.255
0.241
0.239
0.200
0.200
0.200
0.200
0.200
0.200
0.200
1983
0.345
0.255
0.241
0.239
0.200
0.200
0.200
0.200
0.200
0.200
0.200
1984
0.215
0.220
0.214
0.200
0.200
0.200
0.200
0.200
0.200
0.200
0.200
1985
0.209
0.200
0.200
0.200
0.200
0.200
0.200
0.200
0.200
0.200
0.200
1986
0.638
0.262
0.200
0.210
0.200
0.200
0.200
0.200
0.200
0.200
0.200
1987
0.200
0.206
0.417
0.200
0.200
0.200
0.200
0.200
0.200
0.200
0.200
1988
0.380
0.200
0.200
0.388
0.200
0.200
0.200
0.200
0.200
0.200
0.200
1989
0.200
0.200
0.200
0.231
0.200
0.200
0.200
0.200
0.200
0.200
0.200
1990
0.330
0.200
0.200
0.200
0.200
0.200
0.200
0.200
0.200
0.200
0.200
1991
0.202
0.215
0.200
0.200
0.200
0.200
0.200
0.200
0.200
0.200
0.200
1992
0.215
0.204
0.203
0.200
0.200
0.200
0.200
0.200
0.200
0.200
0.200
1993
0.252
0.247
0.274
0.259
0.200
0.200
0.200
0.200
0.200
0.200
0.200
1994
0.288
0.213
0.292
0.224
0.200
0.200
0.200
0.200
0.200
0.200
0.200
1995
0.379
0.340
0.315
0.291
0.200
0.200
0.200
0.200
0.200
0.200
0.200
1996
0.722
0.320
0.249
0.280
0.200
0.200
0.200
0.200
0.200
0.200
0.200
1997
0.502
0.266
0.256
0.280
0.200
0.200
0.200
0.200
0.200
0.200
0.200
1998
0.231
0.291
0.267
0.200
0.200
0.200
0.200
0.200
0.200
0.200
0.200
1999
0.200
0.207
0.274
0.262
0.200
0.200
0.200
0.200
0.200
0.200
0.200
2000
0.214
0.200
0.215
0.244
0.200
0.200
0.200
0.200
0.200
0.200
0.200
2001
0.210
0.200
0.225
0.200
0.200
0.200
0.200
0.200
0.200
0.200
0.200
2002
0.323
0.212
0.200
0.203
0.200
0.200
0.200
0.200
0.200
0.200
0.200
2003
0.417
0.249
0.206
0.200
0.200
0.200
0.200
0.200
0.200
0.200
0.200
2004
0.414
0.300
0.200
0.225
0.200
0.200
0.200
0.200
0.200
0.200
0.200
2005
0.397
0.302
0.230
0.268
0.200
0.200
0.200
0.200
0.200
0.200
0.200
2006
0.223
0.214
0.274
0.211
0.200
0.200
0.200
0.200
0.200
0.200
0.200
2007
0.296
0.200
0.236
0.321
0.200
0.200
0.200
0.200
0.200
0.200
0.200
2008
0.373
0.276
0.263
0.335
0.200
0.200
0.200
0.200
0.200
0.200
0.200
2009
0.405
0.247
0.281
0.254
0.200
0.200
0.200
0.200
0.200
0.200
0.200
2010
0.358
0.248
0.271
0.283
0.200
0.200
0.200
0.200
0.200
0.200
0.200
2011
0.528
0.467
0.307
0.225
0.200
0.200
0.200
0.200
0.200
0.200
0.200
2012
0.595
0.312
0.203
0.200
0.200
0.200
0.200
0.200
0.200
0.200
0.200
2013
0.458
0.338
0.246
0.200
0.200
0.200
0.200
0.200
0.200
0.200
0.200
2014
0.283
0.206
0.218
0.200
0.200
0.200
0.200
0.200
0.200
0.200
0.200
2015
0.342
0.398
0.209
0.200
0.200
0.200
0.200
0.200
0.200
0.200
0.200
2016
0.305
0.200
0.244
0.227
0.200
0.200
0.200
0.200
0.200
0.200
0.200
2017
0.340
0.296
0.231
0.409
0.200
0.200
0.200
0.200
0.200
0.200
0.200
2018
0.430
0.265
0.266
0.200
0.200
0.200
0.200
0.200
0.200
0.200
0.200
2019
0.371
0.255
0.217
0.278
0.200
0.200
0.200
0.200
0.200
0.200
0.200
2020
0.366
0.355
0.271
0.213
0.200
0.200
0.200
0.200
0.200
0.200
0.200
2021
0.224
0.215
0.227
0.200
0.200
0.200
0.200
0.200
0.200
0.200
0.200
2022
0.434
0.201
0.200
0.210
0.200
0.200
0.200
0.200
0.200
0.200
0.200
Table 4.15. Northeast Arctic haddock. Summary XSA (p-shrinkage not applied, F shrinkage= 0.5). FLR Thu Jun 01 17:00:23 2023
YEAR
RECR_a3
TOTBIO
TOTSPB
LANDINGS
YIELDSSB
SOPCOFAC
FBAR 4–7
1950
82358
242532
134570
132125
0.9818
1.5897
0.8312
1951
668654
355818
101096
120077
1.1878
1.2272
0.6238
1952
76856
235382
57487
127660
2.2207
1.7404
0.7245
1953
1274412
511708
82542
123920
1.5013
1.4279
0.516
1954
152568
537772
117340
156788
1.3362
1.474
0.3805
1955
68638
485566
178791
202286
1.1314
1.536
0.5117
1956
208621
474931
243678
213924
0.8779
1.2623
0.4332
1957
66162
326310
186283
123583
0.6634
1.2455
0.4328
1958
87032
276967
156973
112672
0.7178
1.1252
0.519
1959
398300
364900
133304
88211
0.6617
0.9405
0.3672
1960
289536
401027
114646
154651
1.3489
1.0411
0.4842
1961
130728
391342
129987
193224
1.4865
0.9942
0.6365
1962
290785
346439
118893
187408
1.5763
1.0518
0.8005
1963
340884
310688
82659
146224
1.769
1.1458
0.8648
1964
398106
301821
63852
99158
1.5529
1.3572
0.6525
1965
124286
357905
95458
118578
1.2422
1.1507
0.4935
1966
293747
387627
127564
161778
1.2682
1.1621
0.5835
1967
362150
467845
154565
136397
0.8825
0.9984
0.415
1968
23934
421264
169508
181726
1.0721
0.9976
0.5032
1969
21428
342515
184144
130820
0.7104
0.882
0.3972
1970
202340
286651
156116
88257
0.5653
0.9762
0.358
1971
122446
345537
168580
78905
0.4681
0.7638
0.2465
1972
1251170
619134
123021
266153
2.1635
1.0883
0.6922
1973
341754
603399
114691
322226
2.8095
1.1656
0.5365
1974
69192
603583
200749
221157
1.1017
0.8946
0.4322
1975
60153
493085
256310
175758
0.6857
0.8957
0.427
1976
66858
307383
206727
137264
0.664
1.12
0.571
1977
134320
228964
141815
110158
0.7768
1.09
0.684
1978
213354
255968
130588
95422
0.7307
0.9219
0.5115
1979
175982
318219
129532
103623
0.8
0.7684
0.552
1980
34745
343110
133215
87889
0.6598
0.7568
0.398
1981
13415
292881
148243
77153
0.5204
0.7174
0.4012
1982
17379
211908
127246
46955
0.369
0.7224
0.3093
1983
9564
104361
71477
24600
0.3442
1.0373
0.2715
1984
13434
83502
64118
20945
0.3267
1.0547
0.2498
1985
288300
182799
62012
45052
0.7265
0.9761
0.32
1986
528864
343499
62303
100563
1.6141
1.0484
0.4388
1987
109761
333919
75055
154916
2.064
0.992
0.5958
1988
54833
260035
78422
95255
1.2146
0.9955
0.499
1989
26591
212726
91989
58518
0.6361
0.9774
0.3892
1990
36926
170796
95307
27182
0.2852
1.0159
0.1562
1991
104297
195376
110524
36216
0.3277
1.0374
0.2082
1992
207580
269187
125750
59922
0.4765
0.9797
0.2838
1993
661753
442178
130414
82379
0.6317
1.0031
0.359
1994
292144
544170
148802
135186
0.9085
1.0056
0.425
1995
97778
540469
164106
142448
0.868
1.0247
0.3828
1996
102089
473273
189927
178128
0.9379
1.0175
0.4235
1997
115475
350171
167002
154359
0.9243
1.0519
0.4862
1998
58292
250224
126742
100630
0.794
1.0113
0.4235
1999
230833
253282
95021
83195
0.8755
1.021
0.4212
2000
89100
251156
87595
68944
0.7871
1.026
0.2802
2001
365921
358557
113453
89640
0.7901
0.9903
0.2795
2002
342184
445166
132555
114798
0.866
1.011
0.3175
2003
223322
475695
155730
138926
0.8921
1.019
0.4302
2004
224464
456645
162309
158279
0.9752
1.0192
0.382
2005
346167
471225
172007
158298
0.9203
1.0029
0.493
2006
155997
415409
146117
153157
1.0482
0.9938
0.4088
2007
666658
497187
142876
161525
1.1305
0.9916
0.4282
2008
1338413
736952
149223
155604
1.0428
0.9928
0.3948
2009
1454803
1079714
173982
200061
1.1499
1.0019
0.357
2010
525518
1259213
241741
249200
1.0309
0.9994
0.2968
2011
244116
1283336
351185
309785
0.8821
0.9978
0.319
2012
383756
1160965
431556
315627
0.7314
0.9994
0.266
2013
150464
988307
477516
193744
0.4057
0.9967
0.1335
2014
378223
989466
521615
177522
0.3403
0.9968
0.1115
2015
100899
926753
532292
194756
0.3659
0.9953
0.1588
2016
254252
833858
500288
233183
0.4661
1.0006
0.2262
2017
175193
704814
413802
227588
0.55
0.994
0.3555
2018
337402
574493
297367
191276
0.6432
0.9943
0.4328
2019
780289
619341
217111
175402
0.8079
0.9963
0.511
2020
408527
644060
177067
182468
1.0305
0.9962
0.557
2021
210752
595739
169237
204743
1.2098
0.9981
0.5058
2022
61285
513996
175534
176906
1.0078
0.998
0.379
Table 4.16. Northeast Arctic haddock. Input data for recruitment prediction (RCT3)- recruits as 3 year-olds. Recr: recruitment estimate from SAM 2023 NT1: Norwegian Russian winter bottom trawl survey age 1 NT2: Norwegian Russian winter bottom trawl survey age. NAK1: Norwegian Russian winter acoustic survey age 1 NAK2: Norwegian Russian winter acoustic survey age 2. ECO1: Ecosystem survey age 1. ECO2: Ecosystem survey age 2. The Russian survey (RT) was discontinued in 2017 and has not been used for recruitment forecast since.
Year class
Recr.
NT1
NT2
NAK1
NAK2
EC01
ECO2
1990
826301
NA
NA
NA
NA
NA
NA
1991
393766
NA
NA
NA
NA
NA
NA
1992
100598
NA
224.785
NA
187.96
NA
NA
1993
100245
604.198
199.523
887.82
88.59
NA
NA
1994
120223
1429.036
265.083
1198.18
94.52
NA
NA
1995
63423
300.778
90.806
132.6
26.51
NA
NA
1996
149058
1117.83
196.698
508.87
150.99
NA
NA
1997
83495
248.274
83.201
210.96
30.11
NA
NA
1998
364169
1207.984
437.224
653.4
404.77
NA
NA
1999
391892
832.297
446.843
1063.01
266.12
NA
NA
2000
338236
1230.979
475.308
753.01
267.9
NA
NA
2001
259668
1700.188
471.677
1315.15
362.35
NA
NA
2002
362149
3327.315
706.61
2743.74
466.54
NA
268.462
2003
156383
700.861
386.388
528.97
143.98
188.987
114.244
2004
529730
4473.159
1310.216
2276.46
624.78
603.787
929.118
2005
1082898
4944.605
1684.829
2091.11
953.5
2270.189
1818.927
2006
1006157
3731.194
2042.009
2015.71
1753.54
988.391
1291.864
2007
238242
853.093
317.051
778.39
209.05
322.015
143.819
2008
118425
562.606
79.895
443.93
86.03
134.833
65.087
2009
338277
1634.823
353.866
1559.42
288.27
274.353
113.561
2010
119004
676.315
137.384
428.46
94.54
105.263
41.529
2011
408463
1866.965
490.28
1583.44
407.16
591.096
222.994
2012
72818
344.585
123.954
292.71
109.92
155.943
75.054
2013
211215
1281.405
342.024
1838.71
246.59
264.813
145.248
2014
195172
1133.967
561.956
1593.12
107.18
319.963
144.86
2015
361715
2299.365
770
1276
331.42
793.772
189.253
2016
803698
5065.427
1675.638
3343.93
810.16
935.791
NA
2017
432773
3823.293
1125.267
2925.9
687.8
NA
585.3
2018
162387
1898.2
267.785
1544.96
260.72
379.389
57.781
2019
44865
110.624
24.99
272.94
15.69
26.825
35.878
2020
157204
405.82
110.312
431.68
70.15
107.622
106.849
2021
NA
1662.107
583.238
1797.09
511.05
691.821
NA
2022
NA
1337.385
NA
1032.67
NA
NA
NA
Table 4.17. Northeast Arctic haddock Analysis by RCT3 ver3.1 - R translation. Data for 6 surveys over 32 year classes : 1990 – 2021 Regression type = C, Tapered time weighting applied, power = 3 over 20 years, Survey weighting not applied, Final estimates shrunk towards mean, Estimates with S.E.'S greater than that of mean included, Minimum S.E. for any survey taken as 0.2, Minimum of 3 points used for regression, Forecast/Hindcast variance correction used.
yearclass
:2020
index
slope
intercept
se
rsquare
n
indices
prediction
se.pred
WAP.weights
NT1
0.8625
6.178
0.3367
0.8847
20
6.008
11.36
0.4008
0.20097
NT2
0.7666
7.845
0.3159
0.8973
20
4.712
11.46
0.3733
0.23174
NAK1
1.1983
3.912
0.5191
0.7635
20
6.053
11.17
0.6241
0.0829
NAK2
0.8199
7.923
0.3494
0.8772
20
4.265
11.42
0.4138
0.18854
EC01
0.9149
7.099
0.4026
0.8543
16
4.688
11.39
0.4825
0.13868
ECO2
0.9
7.798
0.4553
0.7987
17
4.679
12.01
0.5267
0.11639
yearclass
:2021
index
slope
intercept
se
rsquare
n
indices
prediction
se.pred
WAP.weights
NT1
0.8282
6.461
0.3572
0.864
20
7.416
12.6
0.4088
0.22589
NT2
0.7431
8.017
0.3276
0.883
20
6.37
12.75
0.3769
0.26565
NAK1
1.14
4.36
0.5227
0.748
20
7.494
12.9
0.6046
0.10327
NAK2
0.7968
8.089
0.3681
0.8567
20
6.238
13.06
0.4309
0.20326
EC01
0.8883
7.293
0.4182
0.8344
17
6.541
13.1
0.5
0.15098
ECO2
NA
NA
NA
NA
NA
NA
NA
NA
NA
yearclass
:2022
index
slope
intercept
se
rsquare
n
indices
prediction
se.pred
WAP.weights
NT1
0.8122
6.566
0.3581
0.865
19
7.199
12.41
0.4135
0.5843
NT2
NA
NA
NA
NA
NA
NA
NA
NA
NA
NAK1
1.1179
4.494
0.5162
0.7551
19
6.941
12.25
0.5955
0.2817
NAK2
NA
NA
NA
NA
NA
NA
NA
NA
NA
EC01
NA
NA
NA
NA
NA
NA
NA
NA
NA
ECO2
NA
NA
NA
NA
NA
NA
NA
NA
NA
WAP
logWAP
int.se
2020 YC
98498
11.5
0.1797
2021 YC
371852
12.83
0.1943
2022YC
230976
12.35
0.3161
Table 4.18. Northeast Arctic haddock. Prediction with management option table: Input data (based on SAM estimates and forecast estimates according to stock annex).
2023
Age
N
M
Mat
PF
PM
SWt
Sel
CWt
3
157204
0.341
0.026
0
0
0.22
0.028
0.641
4
28014
0.257
0.105
0
0
0.558
0.127
0.975
5
107132
0.233
0.227
0
0
0.827
0.316
1.182
6
112780
0.208
0.419
0
0
1.128
0.475
1.383
7
88935
0.2
0.637
0
0
1.467
0.486
1.654
8
17075
0.2
0.818
0
0
1.908
0.48
1.927
9
3594
0.2
0.942
0
0
2.64
0.48
2.273
10
1770
0.2
0.973
0
0
3.105
0.48
2.704
11
908
0.2
1
0
0
3.481
0.48
2.901
12
624
0.2
1
0
0
3.825
0.48
3.144
13
1227
0.2
1
0
0
3.909
0.48
3.641
2024
Age
N
M
Mat
PF
PM
SWt
Sel
CWt
3
371852
0.341
0.033
0
0
0.318
0.028
0.75
4
.
0.257
0.068
0
0
0.416
0.127
0.822
5
.
0.233
0.247
0
0
0.876
0.316
1.227
6
.
0.208
0.44
0
0
1.173
0.475
1.424
7
.
0.2
0.644
0
0
1.485
0.486
1.665
8
.
0.2
0.801
0
0
1.836
0.48
1.929
9
.
0.2
0.907
0
0
2.303
0.48
2.176
10
.
0.2
0.971
0
0
3.061
0.48
2.546
11
.
0.2
1
0
0
3.512
0.48
2.882
12
.
0.2
1
0
0
3.661
0.48
3.078
13
.
0.2
1
0
0
4.133
0.48
3.533
2025
Age
N
M
Mat
PF
PM
SWt
Sel
CWt
3
230976
0.341
0.032
0
0
0.304
0.028
0.733
4
.
0.257
0.089
0
0
0.5
0.127
0.912
5
.
0.233
0.164
0
0
0.666
0.316
1.035
6
.
0.208
0.469
0
0
1.234
0.475
1.48
7
.
0.2
0.665
0
0
1.539
0.486
1.697
8
.
0.2
0.806
0
0
1.856
0.48
1.939
9
.
0.2
0.896
0
0
2.22
0.48
2.178
10
.
0.2
0.951
0
0
2.7
0.48
2.47
11
.
0.2
1
0
0
3.481
0.48
2.748
12
.
0.2
1
0
0
3.693
0.48
3.065
13
.
0.2
1
0
0
3.977
0.48
3.48
Table 4.19. Northeast Arctic haddock. Prediction with management option table for 2023-2025 (TAC constraint applied for intermediate year) MFDP R version. Run22 data from file fhcr_fmgmt.xls. Input units are thousands and kg - output in tonnes
year
Biomass
SSB
FMult
FBar
Landings
2023
454405
210343
1.0745
0.3771
170067
year
Biomass
SSB
FMult
FBar
Landings
2024
444781
189420
0
0
0
0.1
0.0351
14648
0.2
0.0702
28704
0.3
0.1053
42193
0.4
0.1404
55141
0.5
0.1755
67573
0.6
0.2106
79510
0.7
0.2457
90976
0.8
0.2808
101991
0.9
0.3159
112576
1
0.351
122749
1.1
0.3861
132529
1.2
0.4212
141933
1.3
0.4563
150977
1.4
0.4914
159678
1.5
0.5265
168051
1.6
0.5616
176110
1.7
0.5967
183869
1.8
0.6318
191341
1.9
0.6669
198539
2
0.702
205475
Table 4.20. Northeast Arctic haddock. Prediction single option table for 2023-2025 based on HCR MFDP R version Run22 data from file fhcr_fmgmt.xls Fbar age range: 4-7. Input units are thousands and kg - output in tonnes
Year:
2023
F multiplier:
1.0745
Fbar:
0.3771
age
CatchN
CatchYield
F
SSB (Jan)
StockBiomass (Jan)
StockN (Jan)
3
3951
2533
0.0301
899
34585
157204
4
3160
3081
0.1365
1641
15632
28014
5
27694
32734
0.3395
20112
88598
107132
6
41060
56786
0.5104
53303
127216
112780
7
33073
54703
0.5222
83108
130468
88935
8
6289
12119
0.5157
26650
32579
17075
9
1324
3009
0.5157
8938
9488.2
3594
10
652
1763
0.5157
5347
5495.9
1770
11
334
970
0.5157
3161
3160.7
908
12
230
723
0.5157
2387
2386.8
624
13
452
1646
0.5157
4796
4796.3
1227
TOTAL
118220
170067
210343
454405
519263
Year:
2024
F multiplier:
1.0486
Fbar:
0.3681
age
CatchN
CatchYield
F
SSB (Jan)
StockBiomass (Jan)
StockN (Jan)
3
9124
6843
0.0294
3902
118249
371852
4
11960
9831
0.1332
3068
45123
108468
5
4786
5873
0.3314
4090
16558
18902
6
21589
30743
0.4981
31191
70888
60433
7
20067
33411
0.5096
52585
81654
54986
8
15612
30116
0.5033
63524
79306
43195
9
3017
6565
0.5033
17435
19223
8346.8
10
635
1617
0.5033
5222
5377.7
1756.9
11
313
901
0.5033
3039
3038.7
865.23
12
160
494
0.5033
1625
1625
443.86
13
327
1155
0.5033
3740
3739.6
904.83
TOTAL
87591
127550
189420
444781
670153
Year:
2025
F multiplier:
0.9972
Fbar:
0.35
age
CatchN
CatchYield
F
SSB (Jan)
StockBiomass (Jan)
StockN (Jan)
3
5393
3953
0.0279
2247
70217
230976
4
27005
24629
0.1266
11426
128379
256758
5
17812
18435
0.3151
8020
48902
73427
6
3692
5464
0.4736
6221
13265
10750
7
10467
17762
0.4846
30527
45905
29828
8
9397
18222
0.4786
40456
50193
27044
9
7429
16180
0.4786
42525
47461
21379
10
1436
3546
0.4786
10607
11154
4131.1
11
302
830
0.4786
3027
3027
869.53
12
149
456
0.4786
1581
1581
428.23
13
232
807
0.4786
2655
2655
667.51
TOTAL
83313
110283
159292
422739
656258
Figure 4.1 Northeast Arctic haddock landings (top left 1950-2022), fishing mortality (top right 1950-2022), recruitment (bottom left 1950-2023), and total stock biomass for ages 3+ (TSB) and spawning-stock biomass (SSB) (bottom right 1950–2023). The reference points in the SSB and TSB plot refers to the spawning stock biomass. Fishing mortality and total and spawning stock biomass are given with point wise 95% confidence intervals (shaded areas), recruitment is given with upper 95% confidence interval (bar).
Figure 4.2. Northeast Arctic haddock; one step ahead residuals for the final SAM run 2023. Blue circles indicate positive residuals (observations larger than predicted) and red circles indicate negative residuals.
Figure 4.3. Northeast Arctic haddock. 5 year retrospective plots of SSB (top left), fishing mortality (top right), recruitment (bottom left), catches (bottom middle) and TSB (bottom right) for years 2000–2022 (SAM with 95% confidence intervals).
Figure 4.4. Results of assessment of NEA haddock. Fbar(4-7), TSB, recruits and SSB from AFWG 2021 (grey), JRN-AFWG 2022(orange) and this year’s (2023) assessment (blue) from 2001 and onwards. The last black circles on the lines for AFWG 2021 and JRN-AFWG 2022 are forecasts for 2022 and 2023.
Figure 4.5. Northeast Arctic haddock. Retrospective plots of SSB, fishing mortality and recruitment for assessment years 1950–2022 ( left - XSA without P shrinkage, F shrinkage= 0.5 ) and right - for assessment years 1990–2022 from the TSVPA model.
Figure 4.6. Comparison of results of assessment of NEA haddock. Recruits, biomass, spawning biomass and F in 1990–2022 by different models: median SAM estimates, XSA with setting mentioned at section 4.9 and TISVPA with settings established in WKDEM 2020.
Figure 4.7 Standard selection pattern model (red) used for short-term forecasts at the current meeting.
Figure 4.8 Catch composition in 2022 compared to predictions in 2020, 2021 and 2022 (intermediate year). Higher catches, both in individuals (upper left) and biomass (upper right) of 5-year haddock (2017 year-class) than predicted. The weight in the catch (weca) was lower than predicted for ages 3-7 and higher than predicted for ages 8-13+.
Figure 4.9. Age structure from assessment (2009-2023) and prediction (2024-2025).
8 - Northeast Arctic Greenland halibut (Subareas 1 and 2)
8.1 - Status of the fisheries
8.1.1 - Landings prior to 2023 (Tables 8.1–8.8, Figures 8.1–8.3)
Nominal landings by country for subareas 1 and 2 combined are presented in Table 8.1. Tables 8.2 to 8.4 give the landings for Subarea 1 and divisions 2.a and 2.b separately, and landings separated by gear type are presented in Table 8.5. For most countries, the landings listed in the tables are similar to those officially reported to ICES. Some of the values in the tables vary slightly from the official statistics and represent those presented to the Working Group by the members. Catch per unit effort is presented in Table 8.6 and total catch from 1935 to now in Table 8.7 and Figure 8.1.
The preliminary estimate of the total landings for 2022 is 26 997 t. This is 1 434 t less than the landings in 2021 and 7903 t more than the ICES advised maximum catch for 2022 (19094 t). The catches from most countries remained stable, compared to 2021. Combined landings exceeded the quotas set by the Joint Russian-Norwegian Fisheries Commission for 2022 by 1997 t (total TAC 25 000 t). Catches in the report include all landings in ICES 1 and 2, and thus include catches in EU waters in the southern part of ICES 2.
Some fishing for Greenland halibut has taken place in the northern part of Division 4.a during the past 20–30 years, varying between a few tonnes and up to 1668 t in 1995 and 2577 in 1999. From 2005 to 2011 this catch was mostly below 200 t, taken mostly by Norway, France, and the UK. Preliminary numbers show 892 t in 2022, an increase from 144 t the year before mainly due to that the Norwegian trawl fleets having access to British waters which they did not have in 2021 (Table 8.8, Figures 8.2 and 8.3). Although there is a continuous distribution of this species from the southern part of Division 2a along the continental slope towards the Shetland area, the stock structure is unclear in this area and these landings have therefore not been added to the total from subareas 1 and 2. Recent mark-recapture and genetic investigations indicate that the stock might have a more south and westward distribution than the current ICES definition of the stock boundaries (Albert and Vollen, 2015; Westgaard et al., 2016).
8.1.2 - ICES advice applicable to 2021–2023
The roll over advice from ICES for 2021 was as follows:
ICES advises that when the precautionary approach is applied, catches in 2020 should be no more than 23 000 tonnes. This corresponds to a harvest rate of ≈0.036. All catches are assumed to be landed.
Last advice:
ICES advises that when the precautionary approach is applied, catches in the year 2022 should be no more than 19 094 tonnes and catches in the year 2023 should be no more than 18 494 tonnes.
8.1.3 - Additional considerations
A benchmark and data workshop process led to an agreed ICES analytic assessment in 2023. The JRN-AFWG approved the use of this assessment method to generate advice for 2024. Since the assessment is now out of sync with the Norwegian slope survey, that is conducted every other year, this assessment will provide advice for 2024 only. After that we will revert to a two-year schedule.
A benchmark meeting was held in February 2023 with associated data workshop in November 2022. The assessment is described in the ICES stock annex, and in the benchmark report (ICES 2023).
8.1.4 - Management
The 38th JRNFC’s (Joint Norwegian-Russian Fisheries Commissions) session in 2009 decided to cancel the ban against targeted Greenland halibut fishery and established the TAC at 15 000 t for the next three years (2010–2012). The 40th JRNFC Session in 2011 decided to increase the TAC for 2012 up to 18 000 t, and at the 42nd JRNFC Session in 2012, the TAC for 2013 was increased to 19 000 t. The 43rd and 44th sessions kept the same TAC for 2014 and 2015. For 2016 and 2017 TAC was set to 22 and 24 thousand tonnes, respectively. The TAC for 2018 was 27 thousand tonnes and the same for 2019, 2020 and 2021. The TAC for 2022 and 2023 was 25 thousand tonnes.
The TAC for Greenland halibut set by JNRFC applies to catches in ICES areas 1, 2a and 2b, except the Jan Mayen EEZ and the part of the UK EEZ which is north of 62°N.
In 2022 no catches were takin in the Jan Mayen area (within ICES Subarea 2), where Greenland halibut fisheries are not regulated by TAC.
Norway previously had a quota for Greenland halibut in the EU EEZ which could be fished in ICES areas 2a and 6. Thus this TAC was given partly within and partly outside the stock boundary. This area is now in UK EEZ and there was no agreement for quota to Norway in this area for 2021. Norway and UK agreed on 600 t quota to Norway in area 2a, 4, 5b, 6 in 2022, with only longline fisheries allowed in area 6. TAC in the UK part of area 2a allocated to Norway was 700 tonnes in 2023. There is no ICES separate advice for the fishery in this area.
The TAC sat by EU for 2020 applied to “Union waters of 2a and 4; Union and international waters of 5b and 6” were allocated to Norway with the footnote “To be taken in Union waters of 2a and 6. In 6, this quantity may only be fished with longlines (GHL/*2A6-C).” Additionally, EU had sat another TAC in “International waters of 1 and 2(GHL/1/2INT)” and a minor quota in “Norwegian waters of 1 and 2 (GHL/1N2AB.)”, both with the footnote “Exclusively for bycatches 2 .
EU has sat a TAC of 629 t for 2021 to be taken in Union waters of 2a and 6. In 6, this quantity may only be fished with longlines. EU has sat 1800 t TAC in international waters of ICES 1 and 2, exclusively for bycatches. No directed fisheries are permitted under this 3 .
EU has sat a TAC of 2571 t for 2022 in area6; United Kingdom and Union waters of 4; United Kingdom waters of 2a and United Kingdom and international waters of 5b (GHL/2A-C46) 3 .
For the Greenland halibut stock in area 1 and 2, the EU/UK TAC in the part of area 2a that is within UK EEZ is of most interest. Further investigations need to be conducted to reveal historical catches in this area.
Further information on regulations is found in the Stock Annex.
8.1.5 - Expected landings in 2023
Catches in 2022 were 26 997 t, which exceeded the TAC sat by JRNFC and the official advice. The total Greenland halibut landings in the Barents Sea and adjacent waters (ICES Subarea 1 and divisions 2a and 2b) in 2023 may thus be higher than the JRNFC TAC of 25 000 t. Discards are not regarded as a problem.
Survey indices from the Russian autumn survey (Figures 8.4–8.6), the Norwegian slope survey (Figures 8.4–8.5 and 8.7) and the Joint Norwegian-Russian Ecosystem survey (A5216) (Figures 8.8–8.9). Length distributions from these surveys are presented in Tables 8.9–8.12.
The Russian bottom-trawl surveys in October-December (ICES acronym: G5348) are important since they usually cover large parts of the total known distribution area of the Greenland halibut within 100–900 m depth. A working document with a revision of the Russian index was provided to the 2021 meeting (Russkikh et al. 2021, WD12). Revised and recalculated length distributions were implemented in the 2023 assessment. Length distributions by year for this survey are given in Table 8.9. The biomass indices for this survey increased steeply from 2005 to 2011, decreased until 2015 after which the biomass level flattened out (Figures 8.4 and 8.5).
Total biomass indices from the Norwegian autumn slope survey ( G1165 ) showed an upward trend in biomass estimates between 1994 and 2003, then a downward trend until 2008 until it increased again in 2009 but levelled out again in 2011, 2013, and 2015 (Figures 8.4–8.5, and 8.7). Since then, there has been a downward trend until 2020 when the index was at its lowest since the start of the survey. In 2021 there was an increase in the index, but it is still among the lowest estimates in the time series. The length distributions from this survey (Figure 8.10, Tables 8.10 and 8.11) show modes that can be followed through the years and indicate new recruitment to the adult stock in 2007. Since then, no such large recruit events are apparent in the length distributions, and since 2009 abundance of fish in adult lengths has been declining as well. This survey was conducted every year during 1994–2009 and biennially since then.
The Joint ecosystem Survey in autumn (A5216) covers a large part of the Barents Sea down to 500 m and concerning Greenland halibut it can be regarded to be in the areas where mainly juveniles and immature fish are found. Three indices for Greenland halibut are based on the Joint Ecosystem Survey in the Barents Sea, one for fish between 10-17 cm, denoted Eco_SI_1, (Figure 8.8), one for fish between 17-27 cm, denoted Eco_SI_2 (Figure 8.8) and on for fish between 28 and 65 cm, denoted EcoS (Figure 8.9). The juvenile indices (Eco_SI_1 and Eco_Si_2), indicates a highly variable recruitment success with years between good year classes. The EcoS index for both females and males showed an increasing trend until 2007, followed by a mainly decreasing trend since then.
The joint winter survey in the Barents Sea ( A6996 ) has been run from 1986 to the present (jointly with Russia since 2000, except 2006 and 2007). The survey mainly covers depths of 100–500 m and does not cover the deeper slope areas. Spatially, the survey focuses on the central Barents Sea, and west of Svalbard for some years. The northward coverage is limited by sea ice in some years. It is conducted in February and can thus give information on the stock at a different time of the year, as the other surveys are run in autumn. The biomass index has shown an increasing trend since 2004 with large variations in recent years. From the winter survey, only length distributions are used in the assessment model (Table 8.12).
Norwegian slope survey in spring (G5678) is a trawl acoustic survey conducted in 2009, 2012 and biennially since then, along the continental slope in Norwegian EEZ from 62–74°N (subareas 1 and 2). Only length distributions used in the assessment.
The CPUE series (Table 8.6) for the stock was subject to the 2015 benchmark and associated data workshops (see reports from WKBUT 2013, DCWKNGHD 2014 and IBPHALI 2015, and working documents by Bakanev (WD14 WKBUT 2013) and Nedreaas (WD 2 DCWKNGHD 2014). An alternative CPUE series for the Russian fisheries for the years 2004–2015 was presented at the 2016 meeting (Mikhaylov, WD14 AFWG 2016). It shows some discrepancies compared to the previous CPUE series used for the Russian fisheries for the same years. In the CPUE series values before 1992, when the partial moratorium was implemented, are not comparable with values after 1992 due to reduced effort leading to increased catchability. See the Stock Annex for further comments. The CPUE series are not currently used in the assessment.
8.2.3 - Age readings
Based on the scientific understanding that the species is slower growing and more vulnerable than the previous age readings suggest, the Norwegian age reading methods were changed in 2006. The new Norwegian age readings are not comparable with older data or the Russian age readings.
The report from Workshop on Age Reading of Greenland Halibut (WKARGH) 14–17 February 2011 (ICES CM 2011/ACOM:41) described and evaluated several age reading methods for Greenland halibut.
The different methods can be classified into two groups: A) Those that produce age–length relationships that broadly compare with the traditional methods described by the joint NAFO-ICES workshop in 1996 ( ICES CM 1997 /G:1); and B) Several recently developed techniques that show much higher longevity and approximately half the growth rate from 40–50 cm onwards compared to the traditional method.
A second workshop on age reading of Greenland halibut (WKARGH2) was conducted in August 2016 and worked on further validation on new age reading methods. The workshop recommended that two of the new methods can be used to provide age estimations for stock assessments. Further, recognizing some bias and low precision in methods, the WKARGH2 suggested that an aging error matrix or growth curve with error be provided for use in future stock assessments (WKARGH2 report, ICES 2016).
WKARGH2 recommends regular inter-lab calibration exercises to improve precision (i.e. exchange of digital images between readers for each method and between methods).
AFWG suggests that Russian and Norwegian scientists and age readers meet to work out issues of disagreements on Greenland halibut aging.
8.3 - Data used in the assessment
At the 2023 benchmark all input data were scrutinised and revised (Windsland et al. 2023, WD 2 ICES WKBNORTH), with the exception of the Russian slope survey that was revised by Russkikh et al. (ICES 2021, AFWG WD12), and in preparation for the 2023 JRN AFWG.
In the assessment, the catch data are split into five aggregated fleets by gear and countries. Longline/gillnet fleets include landings from gillnet, longline, and handline. Trawl fleets include landings from bottom trawl, purse-seine (very minor catches, can be bycatch or misreporting) and Danish seine. Catch in tonnes and length distributions per quarter per fleet and sex from 1992–2020 are used in the assessment. Fleets are split between Norwegian catches, Russian catches, and catches from 3rd countries. Selectivities are allowed to vary by sex to account for sexual dimorphism influencing vulnerability to fishing. Catches are aggregated into following fleets:
Russian, trawl and minor gears
Russian, gillnet and longline
Norwegian, trawl and minor gears
Norwegian, gillnet and longline
3rd countries
No survey covers the whole stock distribution area. The model uses length distributions and biomass indices from three surveys. From these surveys the following indices go into the current assessment:
EggaN_S– based on the Norwegian slope survey.
Eco_SI_1 and Eco_SI_2 - juvenile indicies based on 10-17 cm and 18-27 cm fish in the Joint Ecosystem survey.
EcoS_SI - an index for fish 28-65 cm, based on data from the Joint Ecosystem survey.
RussianS_SI - Russian bottom-trawl survey in the Barents Sea in autumn.
In addition, length distributions from the Norwegian Slope Survey South and the Joint Winter Survey are used in the assessment.
Age data from the Norwegian slope survey was used in the tuning. The age data was provided using the frozen whole right otolith method recommended by WKARGH2 (ICES 2017).
No CPUE indices are used in the tuning.
8.4 - Methods used in the assessment (Table 8.13)
A new assessment method with a length and age-based GADGET model was benchmarked in 2023. The assessment is further described in the Stock Annex.
At the meeting the revision of the Russian Slope Survey was implemented in the assessment. This required recalculation of reference points that are given in table 8.13.
Advice for the stock has been given biennially. Due to the assessment being out of sync with the Norwegian slope survey, that is conducted every other year, this assessment will provide advice for 2024 only. After that we will revert to a two-year schedule.
8.4.1 - Model settings
Model used: Gadget3 (Lentin et al. 2022)
Start year 1980.
One year time-step.
Single area model, with variable distributions handled through fleet selectivity (“fleets as areas” approach)
Two sexes, split into mature and immature stock components
Logistic maturity estimated for each sex
1 cm length classes and 1-year age classes
Lengths: females; immature 1-100 cm, mature 1-120 cm - males; immature 1-65 cm, mature 1-90 cm
Age: immature 1-25+, mature 3-25+
Von Bertanlanffy growth estimated separately for males and females, with Linf for males fixed to 68 cm. Length at age one fixed.
Natural mortality set to 0.12 for females and 0.16 for males
Initial size of recruits fixed at 14 cm (model has proved unable to estimate this)
Recruitment modelled as annual numbers, no relationship with SSB (estimated directly), assumed equal recruitment of male and female
Initial population follows a simplifying assumption of constant recruitment, M and F, giving an exponential decay by age. A fixed maturity ogive is used to split immature and mature proportions. Standard deviations of lengths at age is externally fixed.
Fisheries and surveys are modelled with fixed catch in tonnes per fleet, and sex-specific selectivity estimated using length distribution data and sex-at-length data.
Five aggregated commercial fleets (as described above), each with sex-specific logistic selectivity
Three surveys used for indices (EcoS, EggaN and RussianS), with logistic selectivity (but with a min:max length range to avoid bias in indices on fish suspected to be poorly selected)
Only length distributions used from Winter and EggaS surveys
More detailed model description, as well as outputs and diagnostics are shown in ICES stock annex and in Vihtakari et al. 2023 (WD 17, WKBNORTH) .
8.5 - Results of the assessment (Figure 8.11-8.14)
Model results, retrospective pattern, jitter, and short-term projections are shown in Figures 8.11-8.14. Reference point and catch scenarios are shown in table 8.13 and 8.14. The stock biomass is presented for the total 45+ cm (minimum legal landing size) population and the spawning stock (Figure 8.11). Biomass peaks around 2013–2014 and shows a clear downward trend since then. This trend is broadly in line with all three tuning series (Figures 8.4,8.7 and 8.9). SSB was above BPA in 2022 but is expected to go below it in 2023. The harvest rate has been steadily increasing since 2009 and is now above HRPA and HRMSY . The retrospective analysis for model biomass has negative Mohn’s rho values (Figure 8.12). The retrospective patterns by year got lumped following the availability of survey data, with the Norwegian slope survey run every other year and missing years in the Russian autumn survey. As a result of this pattern, it is recommended that the assessment be run every other year rather than annually. There is a retrospective trend to increase the stock estimate over time. Peaks in recruitment were most likely exaggerated in the assessment model used before the benchmark, while in the present model they are probably underestimated. Large uncertainties in the age reading probably smooths out the peaks, distributing the recruitment over multiple years. The recruitment peak in the latest years is based on little data and is unreliable. Even though the assessment most likely smooths out the recruitment, the modelled peaks show reasonably good agreement to the data from the juvenile survey indices. This stock is dominated by sporadic recruitment events, and the model does a reasonable job of capturing this.
8.5.1 - Biological reference points
Estimates of trends and biomass levels in stock dynamics are stable in the revised assessment. Therefore, the suggested reference points are for ICES category 1 stock (ICES, 2021).
The HRTARGET is set to HRMSY which equals 0.139. As recommended at the recent Benchmark (ICES 2023), this value was calculated during the present meeting following the revision of the Russian survey index (Russkikh et al. WD12, AFWG 2021). The fishable biomass is taken to be the 45+ cm biomass. The BTRIGGER in the ICES Advice Rule is set to be BPA, which equals 46747 t. BMSY has not been calculated.
8.5.2 - Exploratory assessments; surplus production models and TSVPA.
Results of the assessment of the Barents Sea Greenland halibut stock based on a Bayesian surplus production model was provided by Bakanev in 2013, (WKBUT WD 14). Different sets of abundance indices were used for tuning the model. The analysis of model run results has shown that K is estimated within the range of 810 to 1139 kt, BMSY of 405 to 570 kt and MSY of 23 to 47 kt. However, the model was sensitive to the choice of prior on K. Taking into consideration a high probability of the stock size being at the level, which was quite a bit above BMSY, the risk of the biomass being below this optimal one was very small in 2002–2012 (<1%). The risk analysis of the stock size in the prediction years (2013–2020) under the catch of 0 to 30 kt indicated that the probability of the stock size being under the threshold levels (BMSY, BLIM ) was also minor (less than 1%). It was concluded that further work was needed on the historical CPUE series. Based on scrutiny of the CPUE series it was recommended to examine runs with the surplus production model for the period 1964-1991 and 1964-2005, in addition to runs for the whole 1964–2013 period. Fisheries CPUE series were considered less reliable to reflect stock dynamics than survey indices in the period after regulations of the fishery were introduced in 1992. The Bayesian surplus model was not updated for presentation at the current meeting.
A production model was presented at the 2016 meeting (Mikhaylov, 2016, WD 14), although this model has not been reviewed at a benchmark, nor were biomass trends presented at this meeting. The model has been proposed as a possible method for the estimation of long-term reference points. An update was presented at the 2019 meeting (Mikhaylov 2019, AFWG 2019 WD21). In the current version, the MSY would be around 34 kt, the BMSY around 500 kt and FMSY on the level 0.069. It should be noted that these values are not directly transferable to a different model with different biomass levels and in any case a long-term average. The WD concluded that, in general, the stock can withstand the fishing pressure in 2016 and the fishing regime was approaching optimum, indicating that the results of the exploratory surplus production model were in general alignment with the assessment.
FMSY is not appropriate to this stock given the recent extended run of poor recruitment, and such values have not been evaluated for precautionarity. In a plenary, it was concluded that it would be useful for further development of the production model to conduct separate exploratory runs for CPUE split into before and after 1992 and run with CPUE only before 1992 and survey data after 1992. This production model was not updated for presentation at the current meeting.
At the 2018 meeting, AFWG results from SPiCT production model were presented (AFWG report 2018). In the run that is presented in this report, all available data up to 2016 were used. For run with default, priors applied K = 995 421 t and deterministic reference points were BMSY = 419 955 t, F = 0.07 and MSY = 29 742 t. Stochastic reference points for this run were in a similar range. Run with default priors deactivated gives similar MSY estimates but otherwise, rather different estimates; K = 2 504 006 t, BMSY = 609 410 t, F = 0.05 and MSY = 28 097 t. Further utilization of this approach demands closer scrutiny of model settings in relation to diagnostics. The SPiCT model can be a flexible tool to examine the production model approach to Greenland halibut, however, concerns highlighted below still apply.
In principle, a production model could be used in conjunction with the GADGET assessment model to extend the simulations back in time and provide better estimates for BLIM . However, the inability of production models to follow variable recruitment, and especially runs of above or below average recruitment, limits their ability to advise on this stock. In the benchmark report (IBPHALI 2015) Table 3.3 gives CPUE series and survey estimates that can be helpful for this task.
A working document (Bulatov et al. 2023, WD1 JNR-AFWG 2023) presents a comparison of two types of models: several different formulations of production models for Greenland halibut and age-structured TSVPA mode alongside a production model (the “combi” model) tuned to an index constructed from the TSVPA results. Tuning data for production model included catch in tonnes, Norwegian CPUE, Russian Survey and Winter survey indices. The biomass models showed FMSY (in a biomass model context) of around 0.05 to 0.07 and Bmsy of 437-620 kt, giving long term MSY yields of between 32.3kt and 37.47kt. A TSVPA model was constructed, and the overall trend (with FMSY at age 9 at 0.14, and MSY yield of between 28.2kt and 31.5kt) was presented. A biomass model tuned to TSVPA as a relative index of abundance gave a FMSY (again in production model context) of 0.15 and long term MSY yield of 28.4kt. The use of TISVPA results allowed us to build a recruitment model (Beverton-Holt and “hockey stick” models) that predicts an approximately constant replenishment level (25 million at age 5), which justifies the assumptions accepted in new version of GADGET. However, given difficulties in the tuning indices noted below, the group does not feel that reliance can be placed on the absolute level of these results.
The group notes that there are two key problems in tuning data used in this WD, one is that the CPUE has an artificial step-change (increase) after the reduction in effort due to the partial moratorium in 1992 and will thus likely drive the hypothetical artificial fast rise in population from that point. The other is that the winter survey has had a trend to expand coverage area over time, and therefore the increasing trend in the swept area index is, at least partially, driven by this rather than any stock trends. Therefore, neither the full time series of CPUE nor the simple winter survey estimate should be used for model tuning. Furthermore, the new age reading methods imply considerably slower growth rate and increased longevity, compared to the traditional method used for age data in the TSVPA model (ICES WKARGH 2011, ICES WKARGH2 2016), and the old age readings should not be used in model tuning. It is also questionable if a biomass model is able to track the trends of this stock (where the population seems to be driven by variability in recruitment success).
In terms of trends, the TSVPA and the “Combi” biomass model tuned to a TSVPA-derived index were broadly similar to each other and to the new Gadget model. Key differences were that the TSVPA rose more steeply than Gadget after the 1992 low point, and the Combi model more steeply again. It seems likely that this could be explained by the use of CPUE tuning data (with its artificial rise post 1992) in the Combi and TSVPA models. The other key point of difference is that the Gadget model shows a downturn starting in c. 2012, while the other models only turn down in 2021. One possible reason for this is that the Gadget model uses Ecosystem and Norwegian slope survey indices alongside the Russian index, while the models presented here use the Winter Survey (which has an artificial increasing trend due to increasing coverage).
The group felt that the TSVPA model was worth continuing developing, with a potential use as an auxiliary model (as for NEA cod and haddock), although its accuracy would continue to be hampered by the limited age reading on this species with new age reading methods. Using different tuning series and the more modern age reading method should result in a TSVPA model which could be used as an auxiliary model and could then be compared with the Gadget assessment. Effort should also be placed into continuing the age reading work, as an improved age data series would benefit both Gadget and age-based models such as TSVPA.
8.6 - Comments to the assessment
An overview of model exploration before, and at, the benchmark is given in the benchmark report (Vihtakari et al. WD 17, ICES 2023). At the JRN-AFWG in 2023 the assessment was updated by adding the revised Russian survey index.
Between the end of the physical benchmark meeting and completion of the final model the following adjustments were made: Recalculation of data weighting, and flat top selectivity applied to all fleets. In addition the Russian survey was revised as noted previously.
Within the fisheries in the Barents Sea and associated slope, fish tend to move to the slope as they mature. This means that fisheries on the shelf tend to fewer of the large mature fish. The Barents Sea Greenland halibut Gadget model was designed to be a “fleets as areas model”, where fleet selectivity would take care of the issue of the larger fish moving out of the areas covered by some fleets and surveys. However, the dome shaped selectivity required for this was problematic. The model employing the dome shaped selectivity was unstable, with a large pattern in the jitter analysis indicating that the model was unable to converge to a single solution. The reasons for this are unclear, but it was clear that the dome-shaped selectivity model cannot be used at present as the basis for advice. The model presented here therefore uses exponential (“flat topped”, “S-shaped”) selectivity curves for all fleets and surveys. The ecosystem survey index is expected to be affected by this issue, and the survey index has been computed over a range of sizes (28-65cm) to avoid this and ensure that the movement of fish does not cause undue bias. It is clear in the data, that the trawl fleets catch fewer large fish than the other gears (which are more concentrated along the slope) and there is therefore a slight mismatch here between model and data. The fits to the length distributions are otherwise good for these fleets, and the issue of dome shaped selectivity is therefore a research recommendation for future improvements in the model.
According to jitter analysis the model trends can be considered stable (figure 8.13)
8.6.1 - Future work
Efforts to improve stock assessment in the future should include:
Experimenting with changing the likelihood component weights may further improve the model stability
Gather age data over more years.
Further examine consequences of using of dome-shaped versus logistic selectivity in the Gadget model.
Examine further Norwegian and joint Norwegian/Russian survey indices using VAST (mixed models) or similar statistical analysis.
Develop a harvest control rule.
Review stock structure for Greenland halibut in the North Atlantic, reflecting the results from an ongoing international project (NORSUTAIN).
References
Albert, O.T. and Vollen, T., 2015. A major nursery area around the Svalbard archipelago provides recruits for the stocks in both Greenland halibut management areas in the Northeast Atlantic. ICES Journal of Marine Science: Journal du Conseil, 72(3): 872-879.
Bakanev, S 2013. Assessment of the Barents Sea Greenland halibut stock using the stochastic version of the production model. WD14, Report of the Benchmark Workshop on Greenland Halibut Stocks (WKBUT), 26–29 November 2013, Copenhagen, Denmark. ICES CM 2013/ ACOM:44 367 pp.
Bulatov, O.A., Russkikh, A. A., Mikhaylov, A.I., Vasilyev, D. A, 2023. The estimation of reference points of Greenland halibut stock in the Barents Sea based on production and cohort models. WD, JNR-AFWG 2023
ICES. 2011. Report of the Workshop on Age Reading of Greenland Halibut (WKARGH), 14-17 February 2011, Vigo, Spain. ICES CM 2011/ACOM:41. 39 pp.
ICES 2013. Report of the Benchmark Workshop on Greenland Halibut Stocks (WKBUT), 26-29 November 2013, Copenhagen, Denmark. ICES CM 2013/ACOM:44
ICES 2014. Report of the Data Compilation Workshop on Northeast Arctic Greenland Halibut and Assessment Methods (DCWKNGHD), 10–12 November 2014, Murmansk, Russia. ICES CM 2014/ACOM:65.58pp.
ICES 2015. Report of the Inter Benchmark Process on Greenland Halibut in ICES areas I and II (IBPHALI). By Correspondence, August 2015. ICES CM 2015/ACOM:54, 41 pp
ICES 2016. Report of the Workshop on age reading of Greenland halibut 2 (WKARGH2), 22-26 August, Reykjavik, Iceland. ICES CM 2016/SSGIEOM:16. 36 pp.
ICES. 2021. Advice on fishing opportunities. In Report of the ICES Advisory Committee. 2021.
ICES. 2023. Benchmark workshop on Greenland halibut and redfish stocks (WKBNORTH). ICES Scientific Reports. 5:33. 408 pp. https://doi.org/10.17895/ices.pub.22304638
Lentin J., Elvarsson B.Þ., and Butler W. 2022. gadget3: Globally-Applicable Area Disaggregated General Ecosystem Toolbox V3. https://gadget-framework.github.io/gadget3/, https://github.com/gadget-framework/gadget3/.
Mikhaylov, A. 2016. Long-term HCR-parameters estimation for Greenland halibut based on production model. Working paper no 14. in: Report of the Arctic Fisheries Working Group (AFWG), Dates 19-25 April 2016, ICES HQ, Copenhagen, Denmark. ICES CM 2016/ACOM:06. 621 pp.
Nedreaas, K. 2014. Review of historic commercial catch-per-unit-of-effort (cpue) series previously used in stock evaluation of Greenland halibut ( Reinhardtius hippoglossoides ) in ICES Subareas I and II. Are such cpue series appropriate to use in future Greenland halibut stock assessments? Working document no 2. in: Report of the Data Compilation Workshop on Northeast Arctic Greenland Halibut and Assessment Methods (DCWKNGHD), 10–12 November 2014, Murmansk, Russia. ICES CM 2014/ACOM:65. 56 pp.
Russkikh A.A., Kovalev Yu A., Tchetyrkin A.A. Revision of Russian survey indices used for Greenland halibut stock assessment. WD12, AFWG 2021
Vihtakari, M., Butler, W., Howell, D., Hallfredsson, E.H., Windsland, K.,Elvarsson, B., 2023. Assessment model for the Northeast Atlantic Greenland halibut stock (ghl.27.1-2). WD 17, ICES WKBNORTH.
Westgaard, J.-I., Saha, A., Kent, M.P., Hansen, H.H., Knutsen, H., Hauser, L., Cadrin, S.X., Albert, O.T. and Johansen, T., 2016. Genetic population structure in Greenland halibut ( Reinhardtius hippoglossoides ) and its relevance to fishery management. Canadian Journal of Fisheries and Aquatic Sciences.
Windsland, K., Vihtakari, M., Hallfredsson, E. H., Howell, D. 2023. Data revision for the Northeast Atlantic Greenland halibut stock (ghl.27.1-2). WD2, ICES WKBNORTH 2023
8.7 - Tables and figures
Table 8.1. Greenland halibut in subareas 1 and 2. Nominal Catch (t) by countries (Subarea 1, divisions 2a, and 2b combined) as officially reported to ICES.
Year
Denmark
Estonia
Faroe Islands
France
Fed. Rep. Germany
Greenland
Iceland
Ireland
Latvia
Lithuania
Norway
Poland
Portugal
Russia
Spain
GB
UK (Engl. & Wales)
UK (Scot land)
Total
1984
0
0
0
138
2165
0
0
0
0
0
4376
0
0
15181
0
0
23
0
21883
1985
0
0
0
239
4000
0
0
0
0
0
5464
0
0
10237
0
0
5
0
19945
1986
0
0
42
13
2718
0
0
0
0
0
7890
0
0
12200
0
0
10
2
22875
1987
0
0
0
13
2024
0
0
0
0
0
7261
0
0
9733
0
0
61
20
19112
1988
0
0
186
67
744
0
0
0
0
0
9076
0
0
9430
0
0
82
2
19587
1989
0
0
67
31
600
0
0
0
0
0
10622
0
0
8812
0
0
6
0
20138
1990
0
0
163
49
954
0
0
0
0
0
17243
0
0
4764
0
0
10
0
23183
1991
11
2564
314
119
101
0
0
0
0
0
27587
0
0
2490
132
0
0
2
33320
1992
0
0
16
111
13
13
0
0
0
0
7667
0
31
718
23
0
10
0
8602
1993
2
0
61
80
22
8
56
0
0
30
10380
0
43
1235
0
0
16
0
11933
1994
4
0
18
55
296
3
15
5
0
4
8428
0
36
283
1
0
76
2
9226
1995
0
0
12
174
35
12
25
2
0
0
9368
0
84
794
1106
0
115
7
11734
1996
0
0
2
219
81
123
70
0
0
0
11623
0
79
1576
200
0
317
57
14347
1997
0
0
27
253
56
0
62
2
0
0
7661
12
50
1038
157
0
67
25
9410
1998
0
0
57
67
34
0
23
2
0
0
8435
31
99
2659
259
0
182
45
11893
1999
0
0
94
0
34
38
7
2
0
0
15004
8
49
3823
319
0
94
45
19517
2000
0
0
0
45
15
0
16
1
0
0
9083
3
37
4568
375
0
111
43
14297
2001
0
0
0
122
58
0
9
1
0
0
10896
2
35
4694
418
0
100
30
16365
2002
0
219
0
7
42
22
4
6
0
0
7143
5
14
5584
178
0
41
28
13293
2003
0
0
459
2
18
14
0
1
0
0
8216
5
19
4384
230
0
41
58
13447
2004
0
0
0
0
9
0
9
0
0
0
13939
1
50
4662
186
0
43
0
18899
2005
0
170
0
32
8
0
0
0
0
0
13011
0
23
4883
660
0
29
18
18834
2006
0
0
204
44
7
0
7
0
0
196
11119
201
24
6055
2
12
0
0
17871
2007
0
0
203
39
6
198
15
0
0
0
8230
200
50
6484
10
17
0
0
15452
2008
0
0
663
40
4
0
28
0
0
0
7393
200
46
5294
112
26
0
0
13806
2009
0
0
422
16
19
16
15
1
0
0
8446
203
237
3335
202
67
0
0
12979
2010
0
0
272
102
14
15
15
0
0
0
770
2
11
6888
188
25
0
0
8302
2011
0
0
538
46
80
4
7
0
0
234
8270
169
21
7053
144
39
0
0
16605
2012
0
0
563
39
38
12
13
0
0
0
9331
21
1
10041
185
33
0
0
20277
2013
0
0
783
167
48
22
106
0
0
0
10403
29
7
10310
11
91
0
0
21977
2014
0
0
887
268
33
24
86
0
0
0
11232
17
0
10061
22
210
0
0
22840
2015
0
0
721
228
30
16
98
0
0
0
10874
13
0
12953
23
113
0
0
25069
2016
2
353
1076
226
8
17
75
0
0
0
12932
26
17
10576
27
54
0
0
25389
2017
0
523
993
175
21
25
10
0
3
72
13741
25
10
10714
36
82
0
0
26430
2018
2
574
400
148
50
19
24
0
0
204
14874
25
4
12072
59
132
0
0
28587
2019
0
587
350
103
44
21
8
0
0
347
14845
122
7
12198
86
74
0
0
28792
2020
1
579
512
37
70
47
19
0
0
260
14532
96
8
12266
96
43
0
0
28566
2021*
1
382
756
138
88
14
40
0
96
160
14008
15
46
12394
125
177
0
0
28440
2022*
0
253
1055
85
94
48
27
0
75
136
13140
0
60
11746
164
114
0
0
26997
* Provisional figures.
Table 8.2. Greenland halibut in subareas 1 and 2. Nominal catch (t) by countries in Subarea 1 as officially reported to ICES.
Year
Estonia
Faroe Islands
Fed. Rep. Germany
France
Greenland
Iceland
Ireland
Latvia
Lithuania
Norway
Poland
Portugal
Russia
Spain
GB
UK (England & Wales)
UK (Scot land)
Total
1984
0
0
0
0
0
0
0
0
0
593
0
0
81
0
0
17
0
691
1985
0
0
0
0
0
0
0
0
0
602
0
0
122
0
0
1
0
725
1986
0
0
1
0
0
0
0
0
0
557
0
0
615
0
0
5
1
1179
1987
0
0
2
0
0
0
0
0
0
984
0
0
259
0
0
10
0
1255
1988
0
9
4
0
0
0
0
0
0
978
0
0
420
0
0
7
0
1418
1989
0
0
0
0
0
0
0
0
0
2039
0
0
482
0
0
0
0
2521
1990
0
7
0
0
0
0
0
0
0
1304
0
0
321
0
0
0
0
1632
1991
164
0
0
0
0
0
0
0
0
2029
0
0
522
0
0
0
0
2715
1992
0
0
0
0
0
0
0
0
0
2349
0
0
467
0
0
0
0
2816
1993
0
32
0
0
0
56
0
0
0
1754
0
0
867
0
0
0
0
2709
1994
0
17
217
0
0
15
0
0
0
1165
0
0
175
0
0
0
0
1589
1995
0
12
0
0
0
25
0
0
0
1352
0
0
270
84
0
0
0
1743
1996
0
2
0
0
0
70
0
0
0
911
0
0
198
0
0
0
0
1181
1997
0
15
0
0
0
62
0
0
0
610
0
0
170
0
0
0
0
857
1998
0
47
0
0
0
23
0
0
0
859
0
0
491
0
0
2
0
1422
1999
0
91
0
0
13
7
0
0
0
1101
0
0
1203
0
0
0
0
2415
2000
0
0
0
0
0
16
0
0
0
1021
0
0
1169
0
0
0
0
2206
2001
0
0
0
0
0
9
0
0
0
925
0
0
951
0
0
2
0
1887
2002
0
0
3
0
0
0
0
0
0
834
0
0
1167
0
0
0
0
2004
2003
0
48
0
0
2
0
1
0
0
962
1
0
735
0
0
0.3
0
1749
2004
0
0
0
0
0
0.3
0
0
0
866
0
0
633
0
0
3
0
1502
2005
0
0
0
1
0
0
0
0
0
572
0
0
595
0
0
3
0
1171
2006
0
17
1
0
0
1
0
0
0
575
0
0
626
0
2
0
0
1222
2007
0
18
0
1
198
3
0
0
0
514
0
3
438
0
4
0
0
1179
2008
0
13
0
1
0
5
0
0
0
599
0
0
390
0
0
0
0
1008
2009
0
33
0
0
16
5
0
0
0
734
0
0
483
0
0
0
0
1271
2010
0
15
0
0
0
15
0
0
0
659
0
0
708
0
0
0
0
1397
2011
0
63
0
0
0
6
0
0
0
867
0
0
782
0
0
0
0
1718
2012
0
8
4
0
0
7
0
0
0
921
0
0
1368
0
7
0
0
2315
2013
0
39
0
8
0
100
0
0
0
1055
4
0
1442
1
7
0
0
2656
2014
0
143
8
10
19
38
0
0
0
1270
6
0
1261
0
13
0
0
2768
2015
0
107
13
5
14
47
0
0
0
1424
5
0
1681
7
10
0
0
3313
2016
353
87
2
2
3
38
0
0
0
1265
12
0
1172
0
20
0
0
2954
2017
519
133
4
4
2
8
0
3
72
1389
9
0
1124
3
21
0
0
3291
2018
574
103
9
15
1
20
0
0
198
1008
4
0
894
1
96
0
0
2923
2019
587
116
27
9
5
5
0
0
347
939
119
0
32
15
49
0
0
2250
2020
579
123
36
2
14
18
0
0
257
1388
96
0
787
36
2
0
0
3338
2021*
382
207
17
1
10
35
0
96
160
1617
9
14
713
25
1
0
0
3287
2022*
253
120
21
24
5
0
0
75
136
1151
0
5
494
18
0
0
0
2302
* Provisional figures.
Table 8.3. Greenland halibut in subareas 1 and 2. Nominal catch (t) by countries in Division 2a as officially reported to ICES.
Year
Estonia
Faroe Islands
Fed. Rep. Germ.
France
Greenland
Ireland
Iceland
Lithuania
Norway
Poland
Portugal
Russia
Spain
GB
UK (Engl. & Wales)
UK (Scot-land)
Total
1984
0
0
265
138
0
0
0
0
3703
0
0
5459
0
0
1
0
9566
1985
0
0
254
239
0
0
0
0
4791
0
0
6894
0
0
2
0
12180
1986
0
6
97
13
0
0
0
0
6389
0
0
5553
0
0
5
1
12064
1987
0
0
75
13
0
0
0
0
5705
0
0
4739
0
0
44
10
10586
1988
0
177
150
67
0
0
0
0
7859
0
0
4002
0
0
56
2
12313
1989
0
67
104
31
0
0
0
0
8050
0
0
4964
0
0
6
0
13222
1990
0
133
12
49
0
0
0
0
8233
0
0
1246
0
0
1
0
9674
1991
1400
314
21
119
0
0
0
0
11189
0
0
305
0
0
0
1
13349
1992
0
16
1
108
13
0
0
0
3586
0
15
58
0
0
1
0
3798
1993
0
29
14
78
8
0
0
0
7977
0
17
210
0
0
2
0
8335
1994
0
0
33
47
3
4
0
0
6382
0
26
67
0
0
14
0
6576
1995
0
0
30
174
12
2
0
0
6354
0
60
227
0
0
83
2
6944
1996
0
0
34
219
123
0
0
0
9508
0
55
466
4
0
278
57
10744
1997
0
0
23
253
0
0
0
0
5702
0
41
334
1
0
21
25
6400
1998
0
0
16
67
0
1
0
0
6661
0
80
530
5
0
74
41
7475
1999
0
0
20
0
25
2
0
0
13064
0
33
734
1
0
63
45
13987
2000
0
0
10
43
0
0
0
0
7536
0
18
690
1
0
65
43
8406
2001
0
0
49
122
0
1
9
0
8740
0
13
726
5
0
56
30
9751
2002
0
0
9
7
22
0
4
0
5877
0
3
849
0
0
12
28
6811
2003
0
390
5
2
12
0
0
0
6713
0
10
1762
14
0
5
58
8971
2004
0
0
4
0
0
0
9
0
11704
0
24
810
4
0
1
0
12556
2005
0
0
3
31
0
0
0
0
11216
0
11
1406
0
0
5
18
12690
2006
0
175
0
37
0
0
6
0
8897
0
5
950
0
8
0
0
10078
2007
0
162
1
36
0
0
12
0
6761
0
2
489
0
9
0
0
7472
2008
0
646
3
37
0
0
23
0
5566
0
1
1170
3
16
0
0
7465
2009
0
379
0
13
0
0
10
0
6456
0
9
1531
0
60
0
0
8458
2010
0
255
0
102
15
0
0
0
6426
0
0
4757
0
21
0
0
11576
2011
0
467
0
45
4
0
1
0
6637
0
0
3643
0
3
0
0
10800
2012
0
553
0
37
12
0
6
0
7934
0
0
3878
0
13
0
0
12433
2013
0
739
0
149
22
0
6
0
8215
0
2
4143
0
75
0
0
13351
2014
0
741
0
255
1
0
48
0
8640
0
0
4800
0
184
0
0
14669
2015
0
613
1
220
2
0
51
0
8166
0
0
3691
0
79
0
0
12823
2016
0
985
6
215
14
0
37
0
10073
6
6
1797
0
18
0
0
13157
2017
0
841
0
160
20
0
2
0
10122
0
6
1852
0
16
0
0
13019
2018
0
296
1
104
9
0
4
1
11226
1
4
695
0
6
0
0
12347
2019
0
232
15
94
16
0
3
0
12122
3
7
2754
3
11
0
0
15260
2020
0
384
20
33
28
0
1
0
11437
0
7
2691
0
2
0
0
14603
2021*
0
529
20
123
4
0
5
0
9647
0
5
842
5
109
0
0
11289
2022*
0
888
10
26
14
0
27
0
9753
0
11
740
1
25
0
0
11495
* Provisional figures.
Table 8.4. Greenland halibut in subareas 1 and 2. Nominal catch (t) by countries in Division 2b as officially reported to ICES.
Year
Denmark
Estonia
Faroe Islands
Fed. rep. Germ.
France
Greenland
Ireland
Latvia
Lithuania
Norway
Poland
Portugal
Russia
Spain
GB
UK (Engl. & Wales)
UK (Scot land)
Total
1984
0
0
0
1900
0
0
0
0
0
80
0
0
9641
0
0
5
0
11626
1985
0
0
0
3746
0
0
0
0
0
71
0
0
3221
0
0
2
0
7040
1986
0
0
36
2620
0
0
0
0
0
944
0
0
6032
0
0
0
0
9632
1987
0
0
0
1947
0
0
0
0
0
572
0
0
4735
0
0
7
10
7271
1988
0
0
0
590
0
0
0
0
0
239
0
0
5008
0
0
19
0
5856
1989
0
0
0
496
0
0
0
0
0
533
0
0
3366
0
0
0
0
4395
1990
0
0
23
942
0
0
0
0
0
7706
0
0
3197
0
0
9
0
11877
1991
11
1000
0
80
0
0
0
0
0
14369
0
0
1663
132
0
0
1
17256
1992
0
0
0
12
3
0
0
0
0
1732
0
16
193
23
0
9
0
1988
1993
2
0
0
8
2
0
0
0
30
649
0
26
158
0
0
14
0
889
1994
4
0
1
46
8
0
1
0
4
881
0
10
41
1
0
62
2
1061
1995
0
0
0
5
0
0
0
0
0
1662
0
24
297
1022
0
32
5
3047
1996
0
0
0
47
0
0
0
0
0
1204
0
24
912
196
0
39
0
2422
1997
0
0
12
33
0
0
2
0
0
1349
12
9
534
156
0
46
0
2153
1998
0
0
10
18
0
0
1
0
0
915
31
19
1638
254
0
106
4
2996
1999
0
0
3
14
0
0
0
0
0
839
8
16
1886
318
0
31
0
3115
2000
0
0
0
5
2
0
1
0
0
526
3
19
2709
374
0
46
0
3685
2001
0
0
0
9
0
0
0
0
0
1231
2
22
3017
413
0
42
0
4736
2002
0
219
0
30
0
0
6
0
0
432
5
11
3568
178
0
29
0
4478
2003
0
0
21
13
0
0
0
0
0
541
4
9
1887
216
0
35
0
2726
2004
0
0
0
5
0
0
0
0
0
1369
1
26
3219
182
0
39
0
4841
2005
0
170
0
5
0
0
0
0
0
1223
0
12
2882
660
0
21
0
4973
2006
0
0
12
6
7
0
0
0
196
1647
201
19
4479
2
2
0
0
6571
2007
0
0
23
5
2
0
0
0
0
955
200
45
5557
10
4
0
0
6801
2008
0
0
4
1
2
0
0
0
0
1228
200
45
3734
109
10
0
0
5333
2009
0
0
10
19
3
0
1
0
0
1256
203
228
1321
202
7
0
0
3250
2010
0
0
2
14
0
0
0
0
0
615
2
11
1423
188
4
0
0
2259
2011
0
0
8
80
1
0
0
0
234
766
169
21
2628
144
36
0
0
4087
2012
0
0
2
34
2
0
0
0
0
476
21
1
4795
185
13
0
0
5529
2013
0
0
5
48
10
0
0
0
0
1133
25
5
4725
10
9
0
0
5970
2014
0
0
3
25
3
4
0
0
0
1321
11
0
4000
22
13
0
0
5402
2015
0
0
1
16
3
0
0
0
0
1284
8
0
7581
16
24
0
0
8933
2016
2
0
4
0
9
0
0
0
0
1594
8
11
7608
27
16
0
0
9279
2017
0
4
19
17
11
3
0
0
0
2230
16
4
7737
33
45
0
0
10119
2018
2
0
1
40
29
9
0
0
5
2477
20
0
10483
58
30
0
0
13154
2019
0
0
2
2
0
0
0
0
0
1784
0
0
8512
68
14
0
0
10382
2020
1
0
5
14
2
5
0
0
3
1708
0
1
8788
60
39
0
0
10626
2021*
1
0
19
51
13
0
0
0
0
2744
5
27
10839
106
57
0
0
13862
2022*
0
0
47
63
35
28
0
0
0
2236
0
44
10512
145
89
0
0
13199
* Provisional figures.
Table 8.5. Greenland halibut in subareas 1 and 2. Landings by gear (tonnes). Approximate figures, the total may differ slightly from Table 8.1.
Year
Gillnet
Longline
Trawl
Danish seine
Other
1980
1189
336
11759
-
-
1981
730
459
13829
-
-
1982
748
679
15362
-
-
1983
1648
1388
19111
-
-
1984
1200
1453
19230
-
-
1985
1668
750
17527
-
-
1986
1677
497
20701
-
-
1987
2239
588
16285
-
-
1988
2815
838
15934
-
-
1989
1342
197
18599
-
-
1990
1372
1491
20325
-
-
1991
1904
4552
26864
-
-
1992
1679
1787
5787
-
-
1993
1497
2493
7889
-
-
1994
1403
2392
5353
-
-
1995
1500
4034
5494
-
-
1996
1480
4616
7977
-
-
1997
998
3378
5198
-
-
1998
1327
7395
6664
-
-
1999
2565
6804
10177
-
-
2000
1707
5029
7700
-
-
2001
2041
6303
7968
-
-
2002
1737
5309
6115
-
-
2003
2046
5483
6049
-
-
2004
2290
7135
8778
599
-
2005
1842
7539
9420
447
-
2006
1503
6146
10042
205
-
2007
997
4503
9618
119
-
2008
901
3575
9285
9
8
2009
1409
4952
6583
34
18
2010
1449
5427
8165
170
10
2011
1583
5039
9351
239
15
2012
1929
5602
12130
413
5
2013
2398
5805
13791
176
0
2014
2647
6166
13673
183
0
2015
2508
6287
15445
489
18
2016
2646
7290
14333
650
304
2017
2677
7221
15774
679
29
2018
3021
6542
17367
842
20
2019
3323
7028
17046
1119
0
2020
2976
6989
17675
1044
28
2021*
2930
7385
17203
866
50
2022*
2996
6391
16605
989
16
* Provisional figures.
Table 8.6. Greenland halibut in subareas 1 and 2. Catch per unit effort and total effort.
Year
USSR catch/hour trawling (t)
Norway10 catch/hour trawling (t)
Average CPUE
Total effort (in '000 hrs trawling)5
CPUE 7+6
GDR7 (catch/day tonnage (kg)
RT1
PST2
A8
B9
A3
B4
1965
0.80
-
-
-
0.80
-
-
-
-
1966
0.77
-
-
-
0.77
-
-
-
-
1967
0.70
-
-
-
0.70
-
-
-
-
1968
0.65
-
-
-
0.65
-
-
-
-
1969
0.53
-
-
-
0.53
-
-
-
-
1970
0.53
-
-
-
0.53
-
169
0.50
-
1971
0.46
-
-
-
0.46
-
172
0.43
-
1972
0.37
-
-
-
0.37
-
116
0.33
-
1973
0.37
-
0.34
-
0.36
-
83
0.36
-
1974
0.40
-
0.36
-
0.38
-
100
0.36
-
1975
0.39
0.51
0.38
-
0.39
0.45
99
0.37
-
1976
0.40
0.56
0.33
-
0.37
0.45
100
0.34
-
1977
0.27
0.41
0.33
-
0.30
0.37
96
0.26
-
1978
0.21
0.32
0.21
-
0.21
0.27
123
0.17
-
1979
0.23
0.35
0.28
-
0.26
0.32
67
0.19
-
1980
0.24
0.33
0.32
-
0.28
0.33
47
0.25
-
1981
0.30
0.36
0.36
-
0.33
0.36
42
0.28
-
1982
0.26
0.45
0.41
-
0.34
0.43
39
0.37
-
1983
0.26
0.40
0.35
-
0.31
0.38
58
0.32
-
1984
0.27
0.41
0.32
-
0.30
0.37
59
0.30
-
1985
0.28
0.52
0.37
-
0.33
0.45
44
0.37
-
1986
0.23
0.42
0.37
-
0.30
0.40
57
0.32
-
1987
0.25
0.50
0.35
-
0.30
0.43
44
0.35
-
1988
0.20
0.30
0.31
-
0.26
0.31
63
0.26
4.26
1989
0.20
0.30
0.26
-
0.23
0.28
73
0.19
2.95
1990
-
0.20
0.27
-
-
0.24
95
0.16
1.66
1991
-
-
0.24
-
-
-
134
0.18
-
1992
-
-
0.46
0.72
-
-
20
0.29
-
1993
-
-
0.79
1.22
-
-
15
0.65
-
1994
-
-
0.77
1.27
-
-
11
0.70
-
1995
-
-
1.03
1.48
-
-
-
-
-
1996
-
-
1.45
1.82
-
-
-
-
-
1997
0.71
-
1.23
1.60
-
-
-
-
-
1998
0.71
-
0.98
1.35
-
-
-
-
-
1999
0.84
-
0.82
1.77
-
-
-
-
-
2000
0.94
-
1.38
1.92
-
-
-
-
-
2001
0.82
11
-
1.18
1.57
-
-
-
-
-
2002
0.85
-
1.07
1.82
-
-
-
-
-
2003
0.97
12
-
0.86
2.45
-
-
-
-
-
2004
0.63
13
-
1.16
1.79
-
-
-
-
-
2005
0.61
12
-
1.30
2.29
-
-
-
-
-
2006
0.57
12
-
0.96
2.09
-
-
-
-
-
2007
0.64
12
-
-
-
-
-
-
-
-
2008
0.48
12
-
-
-
-
-
-
-
-
2009
0.77
13
-
-
-
-
-
-
-
-
2010
1.57
12
-
-
-
-
-
-
-
2011
2.32
12
2012
2.06
12
2013
2.25
12
2014
2.52
12
1 Side trawlers, 800–1000 hp. From 1983 onwards, stern trawlers (SRTM), 1000 hp. From 1997 based on research fishing.
2 Stern trawlers, up to 2000 HP.
3 Arithmetic average of CPUE from USSR RT (or SRTM trawlers) and Norwegian trawlers.
4 Arithmetic average of CPUE from USSR PST and Norwegian trawlers.
5 For the years 1981–1990, based on average CPUE type B. For 1991–1993, based on the Norwegian CPUE, type A.
6 Total catch (t) of seven years and older fish divided by total effort.
7 For the years 1988–1989, frost-trawlers 995 BRT (FAO Code 095). For 1990, factory trawlers S IV, 1943 BRT (FAO Code 090).
10 From 1992 based on research fishing. 1992–1993: two weeks in May/June and October; 1994–1995: 10 days in May/June
11 Based on fishery from April-October only, a period with relatively low CPUE. In previous years fishery was carried out throughout the whole year.
12 Based on fishery from October-December only, a period with relatively high CPUE.
13 Based on fishery from October-November only.
Table 8.7. Greenland halibut in subareas 1 and 2. Catch history back to 1935.
Year
Norway
Russia
Others
Total
Year
Norway
Russia
Others
Total
1935
1534
n/a
-
1534
1979
2843
10311
4088
17242
1936
830
n/a
-
830
1980
3157
7670
2457
13284
1937
616
n/a
-
616
1981
4201
9276
1541
15018
1938
329
n/a
-
329
1982
3206
12394
1189
16789
1939
459
n/a
-
459
1983
4883
15152
2112
22147
1940
846
n/a
-
846
1984
4376
15181
2326
21883
1941
1663
n/a
-
1663
1985
5464
10237
4244
19945
1942
955
n/a
-
955
1986
7890
12200
2785
22875
1943
824
n/a
-
824
1987
7261
9733
2118
19112
1944
678
n/a
-
678
1988
9076
9430
1081
19587
1945
1148
n/a
-
1148
1989
10622
8812
704
20138
1946
1337
25
-
1362
1990
17243
4764
1176
23183
1947
1409
28
-
1437
1991
27587
2490
3243
33320
1948
1877
110
-
1987
1992
7667
718
217
8602
1949
198
177
-
375
1993
10380
1235
318
11933
1950
1853
221
-
2074
1994
8428
283
515
9226
1951
2438
423
-
2861
1995
9368
794
1572
11734
1952
2576
377
-
2953
1996
11623
1576
1148
14347
1953
2208
393
-
2601
1997
7661
1038
711
9410
1954
3674
416
-
4090
1998
8435
2659
799
11893
1955
3010
290
-
3300
1999
15004
3823
690
19517
1956
3493
446
-
3939
2000
9083
4568
646
14297
1957
4130
505
-
4635
2001
10896
4694
775
16365
1958
2931
1261
-
4192
2002
7143
5584
566
13293
1959
4307
3632
-
7939
2003
8216
4384
847
13447
1960
6662
4299
-
10961
2004
13939
4662
298
18899
1961
7977
3836
-
11813
2005
13011
4883
940
18834
1962
11600
1760
-
13360
2006
11119
6055
697
17871
1963
11300
3240
-
14540
2007
8230
6484
738
15452
1964
14200
26191
-
40391
2008
7393
5294
1119
13806
1965
18000
16682
-
34682
2009
8446
3335
1198
12979
1966
16434
9768
119
26321
2010
770
6888
644
8302
1967
17528
5737
1002
24267
2011
8270
7053
1282
16605
1968
22514
3397
257
26168
2012
9331
10041
905
20277
1969
14856
19760
9173
43789
2013
10403
10310
1264
21977
1970
15871
35578
38035
89484
2014
11232
10061
1547
22840
1971
9466
54339
15229
79034
2015
10874
12953
1242
25069
1972
15983
16193
10872
43048
2016
12932
10576
1881
25389
1973
13989
8561
7349
29899
2017
13741
10714
1975
26430
1974
8791
16958
11972
37721
2018
14874
12072
1641
28587
1975
4858
20372
12914
38144
2019
14845
12198
1749
28792
1976
6005
16580
13469
36054
2020
14532
12266
1768
28566
1977
4217
15045
9613
28875
2021*
14008
12394
2038
28440
1978
4082
14651
5884
24617
2022*
13140
11746
2111
26997
* Provisional figures.
Table 8.8. Greenland halibut in ICES Division 4.a (North Sea). Nominal catch (t) by countries as officially reported to ICES. Not included in the assessment.
Year
Denmark
Faroe Islands
France
Germany
Greenland
Ireland
Norway
Russia
GB
UK England & Wales
UK Scotland
Netherlands
Total
1973
0
0
0
4
0
0
9
8
0
28
0
0
49
1974
0
0
0
2
0
0
2
0
0
30
0
0
34
1975
0
0
0
1
0
0
4
0
0
12
0
0
17
1976
0
0
0
1
0
0
2
0
0
18
0
0
21
1977
0
0
0
2
0
0
2
0
0
8
0
0
12
1978
0
0
2
30
0
0
0
0
0
1
0
0
33
1979
0
0
2
16
0
0
2
0
0
1
0
0
21
1980
0
177
0
34
0
0
5
0
0
0
0
0
216
1981
0
0
0
0
0
0
7
0
0
0
0
0
7
1982
0
0
2
26
0
0
17
0
0
0
0
0
45
1983
0
0
1
64
0
0
89
0
0
0
0
0
154
1984
0
0
3
50
0
0
32
0
0
0
0
0
85
1985
0
1
2
49
0
0
12
0
0
0
0
0
64
1986
0
0
30
2
0
0
34
0
0
0
0
0
66
1987
0
28
16
1
0
0
35
0
0
0
0
0
80
1988
0
71
62
3
0
0
19
0
0
1
0
0
156
1989
0
21
14
1
0
0
197
0
0
5
0
0
238
1990
0
10
30
3
0
0
29
0
0
4
0
0
76
1991
0
48
291
1
0
0
216
0
0
2
0
0
558
1992
1
15
416
3
0
0
626
0
0
+
1
0
1062
1993
1
0
78
1
0
0
858
0
0
10
+
0
948
1994
+
103
84
4
0
0
724
0
0
6
0
0
921
1995
+
706
165
2
0
0
460
0
0
52
283
0
1668
1996
+
0
249
1
0
0
1496
0
0
105
159
0
514
1997
+
0
316
3
0
0
873
0
0
1
162
0
1355
1998
+
0
71
10
0
10
804
0
0
35
435
0
1365
1999
+
0
1
0
18
2157
0
0
43
358
0
2577
2000
+
41
10
0
19
498
0
0
67
192
0
827
2001
+
43
0
0
10
470
0
0
122
202
0
847
2002
+
8
+
0
2
200
0
0
10
246
0
466
2003
0
0
1
+
+
+
453
0
0
+
122
0
576
2004
0
0
0
0
0
0
413
0
0
90
0
0
503
2005
0
0
2
0
0
0
58
0
0
4
0
0
64
2006
0
0
3
0
0
0
90
0
0
0
7
0
100
2007
0
1
0
0
0
0
133
0
0
1
6
0
141
2008
0
0
0
0
0
0
14
0
0
0
22
0
36
2009
0
9
22
0
0
0
5
0
0
0
129
0
165
2010
+
1
38
0
0
0
10
0
0
0
49
0
98
2011
0
1
39
0
0
0
94
0
0
0
44
0
178
2012
0
0
14
0
0
0
788
0
0
0
43
0
845
2013
0
0
25
0
0
0
122
0
0
0
174
0
321
2014
0
2
27
0
0
0
723
0
0
104
0
856
2015
0
0
34
1
0
0
1151
0
0
0
127
0
1313
2016
0
0
31
0
0
0
983
0
0
0
120
0
1134
2017
0
0
20
0
0
0
753
0
0
0
73
0
846
2018
0
0
15
0
0
0
472
0
42
0
0
0
529
2019
0
0
21
0
0
0
241
0
14
0
0
1
276
2020
0
0
10
0
0
0
663
0
45
0
0
1
719
2021*
0
4
19
0
0
0
0
0
121
0
0
0
144
2022*
0
207
13
0
0
0
522
0
150
0
0
0
892
* Provisional figures.
Table 8.9. Abundance indices of different length groups in Russian autumn survey.
Year/Length (cm)
≤30
31–35
36–40
41–45
46–50
51–55
56–60
61–65
66–70
71–75
76–80
>80
Total
1984
955
2194
4608
8790
7770
6128
2847
1624
1594
1168
687
350
38713
1985
5399
1779
4704
6840
7312
4746
2608
1226
1187
999
540
248
37587
1986
1845
2856
6312
7298
7883
7083
3376
1309
1272
1038
550
214
41034
1987
1279
2303
3941
4324
3512
1940
901
510
380
185
191
31
19496
1988
1125
1394
2859
2140
1498
1433
383
236
233
102
121
77
11599
1989
354
1418
4987
6506
4255
2500
890
402
654
266
41
45
22318
1990
176
1296
3720
3979
3686
3107
1257
325
253
194
72
43
18107
1991
280
693
2851
5405
3764
2454
969
611
168
112
61
50
17417
1992
16
464
6630
15337
13600
10643
6080
2163
1562
675
212
83
57464
1993
0
52
928
5159
9231
6067
2419
1287
1070
534
333
153
27231
1994
101
50
449
4694
7153
6005
2997
1151
690
324
81
43
23736
1995
0
12
383
7525
13851
6180
2043
1188
655
458
190
32
32516
1996
0
0
579
12804
30605
20922
7610
2188
1225
666
161
83
76844
1997
69
53
609
5486
16005
12008
4504
1177
1008
533
150
52
41653
1998
22
92
1081
5036
18596
17089
7215
2334
903
478
104
67
53018
1999
206
82
595
3634
15099
16481
8084
3083
1809
505
240
84
49902
2000
749
550
1727
6027
16638
18489
10558
3857
2341
1057
330
125
62448
2001
376
976
3734
9210
20824
22882
11509
4814
2794
1440
625
369
79553
2002
229
895
3555
6656
9427
6074
3009
1485
815
247
75
30
32494
2003
36
839
3012
5565
8993
6294
3113
2978
3212
787
366
207
35403
2004
218
991
5279
8597
12754
12071
8664
5533
4509
1973
818
711
62117
2005
43
1156
3431
7326
8938
8308
6104
3988
2797
1063
318
543
44013
2006
73
966
11173
25138
26005
20288
11027
5174
3739
1979
730
559
106850
2007
387
1781
9683
15010
15387
13046
8410
4516
2547
1036
380
187
72369
2008
245
1548
7657
16345
21733
23003
21343
9291
8299
4279
2180
1122
117045
2009
20
1699
17514
31415
29067
25527
18885
7433
4089
2780
903
798
140130
2010
110
1923
24818
48545
44198
31754
20806
8970
7018
4280
1517
1536
195474
2011
198
629
11519
41842
53112
50416
38685
19082
8917
7173
3188
1561
236322
2012
4
211
5765
34616
42618
34595
25428
11845
5323
3755
1924
1162
167248
2013
-
-
-
-
-
-
-
-
-
-
-
-
-
2014
9
762
6150
25687
38692
29358
18332
7111
3787
1887
694
495
132964
2015
37
689
7523
25534
35328
27096
14453
7570
3146
1289
522
231
123416
2016
-
-
-
-
-
-
-
-
-
-
-
-
-
2017
4
523
4388
11781
24279
30347
19697
8133
4282
1790
687
430
106339
2018
-
-
-
-
-
-
-
-
-
-
-
-
-
2019
101
1196
10530
25051
28518
23866
15836
7728
3476
2037
843
559
119742
Table 8.10. Abundance indices of different length groups in Norwegian autumn slope survey (in thousands).
Year
<30
30-34
35-39
40-44
45-49
50-54
55-59
60-64
65-69
70-74
75-80
>80
SUM
1996
2
29
1018
10753
20084
11301
3816
1535
1005
401
136
59
50139
1997
2
80
1421
10690
19311
10802
3807
1837
1052
484
184
95
49766
1998
9
74
957
5762
14474
12655
5262
2241
1306
521
192
114
43568
1999
3
57
550
4629
13893
15236
6684
3356
2305
922
393
176
48203
2000
9
169
1121
4495
9538
11646
5816
2590
1347
590
220
111
37651
2001
30
355
1955
5980
11835
12829
6680
3084
1863
694
317
131
45753
2002
48
449
1897
5234
9620
11161
6319
2987
1571
636
239
126
40286
2003
48
748
3515
6958
10931
13029
8279
4769
2547
928
469
222
52444
2004
27
1014
3674
5504
8941
11044
6255
4019
2176
968
402
232
44256
2005
118
2128
5859
8307
8145
6792
4108
2866
1724
670
294
199
41210
2006
36
1214
5140
7416
8448
8047
5092
3315
2022
809
370
253
42163
2007
185
4034
18450
16416
10410
6954
4086
2026
1125
414
163
110
64372
2008
505
6041
12820
11714
7884
5978
3023
1743
1110
440
149
176
51585
2009
54
2645
13634
16937
11488
8487
4864
2456
1841
714
284
211
63615
2011
0
377
5536
14368
13765
10668
5352
1793
1612
881
440
330
55123
2013
4
134
2420
11053
12859
7408
3880
1389
688
357
213
115
40520
2015
9
774
3982
13688
15619
9195
4165
1859
867
440
194
151
50943
2017
19
342
2259
6006
9796
8924
5035
1841
832
259
132
125
35571
2019
0
677
4192
8117
9053
5738
3064
1215
570
222
73
84
33005
2021
109
1645
4635
10264
12302
9064
4643
2445
917
275
112
32
46442
Table 8.11. Abundance indices of females of different length groups in Norwegian autumn slope survey (in thousands).
Year
<30
30-34
35-39
40-44
45-49
50-54
55-59
60-64
65-69
70-74
75-80
>80
SUM
1996
0
12
337
2154
4284
2889
1918
1340
933
394
136
59
14456
1997
1
42
657
2052
3711
2902
1897
1643
1008
484
182
95
14672
1998
4
26
353
1036
2784
3983
2861
2047
1279
518
192
114
15198
1999
1
11
207
880
2367
4214
3510
2996
2235
906
385
176
17889
2000
5
64
435
1083
1377
2012
2428
2109
1292
589
220
111
11726
2001
17
159
758
1407
1648
1905
2556
2595
1838
694
317
131
14026
2002
34
207
733
1243
1297
1749
2297
2352
1528
632
239
126
12439
2003
33
345
1649
2009
1670
2340
3434
4121
2493
925
469
222
19710
2004
11
445
1534
1550
1436
2113
3029
3675
2145
950
401
232
17519
2005
40
737
1910
1925
1254
1341
2093
2576
1703
668
294
199
14740
2006
19
542
2096
2163
1789
1587
2158
2890
1971
801
369
249
16634
2007
110
2111
8639
6230
2667
1620
1897
1735
1106
405
163
107
26790
2008
278
3159
5536
3703
2137
1456
1463
1577
1095
440
149
175
21167
2009
28
1047
5255
5506
3126
2227
2198
2063
1752
704
268
201
24374
2011
0
149
1623
2757
2367
1578
1063
1354
1553
875
440
330
14088
2013
0
35
492
1632
2023
1421
1004
1035
679
354
213
115
9003
2015
5
308
1385
1954
2623
2502
1694
1374
854
440
194
151
13484
2017
16
169
864
1435
1863
1725
1908
1270
820
259
132
125
10588
2019
0
321
1714
2004
1867
1530
1379
952
531
222
73
84
10678
2021
42
852
1775
1793
2203
1798
2152
2066
880
275
112
32
13980
Table 8.12. Abundance indices (numbers in thousands) from bottom-trawl surveys in the Barents Sea standard area winter (Mehl et al., WD4 AFWG 2019).
Length group (cm)
Biomass(tonnes)
Year
≤14
15–19
20–24
25–29
30–34
35–39
40–44
45–49
50–54
55–59
60–64
65–69
70–74
75–79
≥80
Total
1994
0
0
21
76
148
1117
3139
4740
3615
1941
889
541
21
0
0
16248
19228
1995
298
0
0
0
90
129
2877
7182
5739
2027
1622
839
489
86
0
21378
27459
1996
4121
0
0
0
62
124
1214
4086
4634
1871
1112
638
337
74
12
18285
20256
19971
0
68
0
0
55
163
949
4313
5629
2912
1609
643
300
65
21
16727
24214
19981
68
220
945
578
481
487
1088
4016
6591
3076
1798
707
326
93
44
20518
27248
1999
43
84
241
436
566
269
784
1701
3097
1669
1094
491
89
75
0
10639
14681
2000
140
184
344
836
1722
3857
2253
1560
2144
1714
1191
615
249
76
0
16885
17246
2001
68
49
147
179
737
1525
3716
3271
2302
2010
1088
529
160
50
39
15870
18224
2002
271
0
70
34
382
1015
1916
3803
3250
2279
1138
976
242
159
114
15649
21198
2003
51
0
74
19
304
715
1842
3008
4765
2235
714
561
245
146
0
14679
19635
2004
106
104
15
0
319
1253
1229
1717
2277
1227
798
298
148
94
26
9611
11872
2005
263
70
159
1139
2235
2621
4206
3782
3847
2037
917
585
336
118
0
22315
22293
20062
0
72
94
414
1968
5149
4613
5743
4283
2132
891
449
258
34
18
26118
25579
20071
0
18
146
1869
1418
3114
5710
5947
4287
2205
963
658
391
80
89
26895
28006
2008
0
0
0
243
1708
5974
4654
6136
5198
3403
827
638
174
82
50
29087
30153
2009
55
0
0
26
1044
4327
8133
4551
4084
2266
996
627
442
253
154
26958
28919
2010
0
0
0
99
678
3648
5729
6560
4897
2467
1064
552
229
128
41
26092
25979
2011
51
0
0
0
216
4396
5864
5498
5237
3698
699
936
327
252
97
27271
31552
20123
77
0
0
0
51
1145
4524
5366
4517
2774
1147
195
73
0
48
19917
22656
2013
0
0
0
0
0
511
5368
4868
5374
3687
1944
939
348
131
154
23324
31748
2014
0
0
46
92
156
368
2271
5587
5903
3555
2251
1369
154
260
79
22091
31112
2015
367
0
61
0
284
1612
3187
6452
7249
6752
3350
1936
587
334
0
32171
46828
2016
205
0
124
511
950
1953
3486
4539
5479
5613
1999
1973
646
98
80
27656
35831
20174
52
0
0
78
592
1328
1885
3850
4852
4550
1721
1455
317
190
23
20893
29756
2018
0
0
62
0
383
1333
2049
3445
4258
3573
1904
1366
736
196
20
19325
28688
2019
0
0
0
375
272
1671
3285
4034
5177
4265
3570
2526
1328
535
137
27175
45912
20203
80
91
2464
442
790
2272
4391
5136
4929
4613
3278
1803
894
384
250
29599
43631
20213
0
154
927
927
2370
2976
3869
4265
3516
2991
2378
1649
670
682
238
27612
37090
20223
0
0
822
2165
3696
1831
3365
5322
5672
3621
2230
1543
799
432
135
31633
39548
20233
0
0
59
746
6480
8816
5302
5792
7284
351
2065
1369
1001
57
338
43260
47623
1 Indices raised to also represent the Russian EEZ
2 Not complete coverage in southeast due to restrictions, strata 7 area set to default and strata 13 as in 2005
3 Indices not raised to also represent uncovered parts of the Russian EEZ.
4 Indices raised to also represent uncovered parts of the Russian EEZ
Table 8.13. Reference points, values, and their technical basis for NEA G. halibut.
Framework
Reference point
Value
Technical basis
MSY approach
MSY
19142 t
Maximum sustainable yield
HR MSY
0.139
HR (>=45cm) leading to MSY
Precautionary approach
B lim
33391 t
Lowest modelled mature female substock biomass
B pa
46747 t
Blim x 1.4
B trigger
46747 t
B pa
HR lim
0.165
HR (>=45cm) leading to P(SSB<B lim )=0.5
HR pa
0.145
HR(>=45cm), when ICES AR is applied, leading to P(SSB > Blim) = 0.05
Table 8.14. Greenland halibut in ICES subareas 1 and 2 (Northeast Arctic). Annual catch scenarios for 2024. All weights are in tonnes. Harvest rate (HR) for >= 45 cm fish, spawning stock biomass (SSB) in the beginning of 2025.
Basis
Total catch (2024)
HR(2024)
SSB(2025)
% Biomass change *
% TAC change **
% Advice change ***
ICES advice basis
MSY approach: HRmsy x SSB2024/Btrigger
15560
0.134
46054
+1.5
-37.8
-15.9
Other scenarios
MSY approach ex. 2019 recruitment spike
14012
0.129
43282
-1.2
-44.0
-24.2
HR=0
0
0
53142
+14.6
-100
-100
Catch s.q.
26997
0.233
40844
-11.1
+8.0
+46.0
* SSB 2025 relative to 2024.
** Advice value for 2024 relative to the TAC value in 2023 (25000 tonnes).
*** Advice value for 2024 relative to the advice value for 2023 (18494 tonnes
Figure 8.1. NEA Greenland halibut landings. Historical landings (Nedreaas and Smirnov 2003 and AFWG).
Figure 8.2. Spatial distribution of Greenland halibut catches in 2022 according to Norwegian electronic logbooks, in all registered fisheries including bycatch (A), and catches where G. halibut make more than 50% of the total catches (B).
Figure 8.3. Spatial distribution of catches where Greenland halibut make more than 50% of the total catches, according to Norwegian electronic logbooks from 2022. Bubble area is proportional to the size of single catches expressed in metric tonnes. The panels show longline (A), gillnet (B) and trawl (C) catches.
Figure 8.4. NEA Greenland halibut. Total biomass estimates from Russian autumn survey and the Norwegian slope survey. Note that the Norwegian survey is run every other year since 2009. Uncertain estimate for 2013 from the Russian survey. Russian data from 1992 and onwards are revised in 2021 (Russkikh WD12). No Russian data for 2016, 2018 and 2020.
Figure 8.5. NEA Greenland halibut. Swept−area estimate of the female biomass based on the data from the Norwegian slope survey in August (every other year since 2009) and the Russian trawl survey in October−December (compared to previous reports, . Russian data from 1992 and onwards are revised in 2021 (Russkikh WD12)). Uncertain estimate for 2013 from the Russian survey.
Figure 8.6. Russian autumn survey; Greenland halibut abundance by sex (Russkikh and Smirnov, WD16 AFWG 2016). Russian data from 1992 and onwards are revised in 2021 (Russkikh WD12). In this figure the 1992, 1996, 2002, 2017 and 2019 indices were not raised to also represent uncovered parts of the standard survey area.
Figure 8.7. Estimated Greenland halibut abundance (upper panel) and biomass (lower panel), by sex, from the Norwegian autumn slope survey.
Figure 8.8. Total juvenile biomass indices Eco_SI_1 (10-17cm) and Eco_SI_2(18-27cm) (sex distribution is assumed 50/50 in the juvenile area) for Greenland halibut based on the Barents Sea Ecosystem Survey (A5216) (2014 not included due to poor survey coverage in the juvenile area) and the juvenile survey 1996−2002 (for area see Hallfredsson and Vollen, WD20 AFWG 2015).
Figure 8.9. EcoS biomass index by sex for Greenland halibut in the Barents Sea Ecosystem Survey (A5216)
Figure 8.10. Length frequency distribution estimates for the entire area covered by the Norwegian Slope survey during autumn. Note biennial surveys after 2009.
Figure 8.11. From top left to bottom right: Catch (1000 tonnes), recruitment estimate (in millions) for 1 year olds, harvest rate and Spawning stock biomass (SSB) and total stock biomass (TSB) for Greenland halibut as estimated by the GADGET model. Note that the recruitment spike in 2019 is uncertain.
Figure 8.12 Retrospective analysis using model biomass for each sub-stock and total biomass. Colors are scaled to the number of years removed.
Figure 8. 13. Jitter results for the model. Negative log-likelihood scores of jitter runs are shown on the left together with standard deviation and CV (in percentage). Total biomass, harvest rate and recruitment are on top of each other on the right. Colour indicates the run number and is standardized across all panels.
Figure 8. 14. Internal harvest rates (HR for female SSB) of short-term projection scenarios. Harvest rates are influenced by B TRIGGER .
1 Greenland halibut (Reinhardtius hippoglossoides) in subareas 1 and 2 (Northeast Arctic); ghl.27.1-2.