Barents Sea Capelin
A bilateral Norwegian-Russian assessment working group met by correspondence 10-13 October 2022 to assess and give quota advice for the Barents Sea capelin stock.
Participants
- Bjarte Bogstad (Norway, Chair of meeting)
- Anatoly Chetyrkin (Russia)
- Harald Gjøsæter (Norway)
- Daniel Howell (Norway)
- Sondre Nedreås Hølleland (Norway)
- Stine Karlson (Norway)
- Yury Kovalev (Russia)
- Hector Pena (Norway)
- Dmitry Prozorkevich (Russia)
- Georg Skaret (Norway)
Regulation of the Barents Sea Capelin Fishery
Since 1979, the Barents Sea capelin fishery has been regulated by a bilateral fishery management agreement between Russia (former USSR) and Norway. A TAC has been set separately for the winter fishery and for the autumn fishery. From 1999, no autumn fishery has taken place, except for a small Russian experimental fishery in some years and small by-catch in the northern shrimp fishery. A minimum landing size of 11 cm has been in force since 1979. Scientific advice is to carry out capelin fishery only on mature fish during the period from January to April.
TAC and Catch Statistics (Table 10.1-10.2)
The Joint Russian-Norwegian Fishery Commission set a zero TAC for 2021 and a TAC of 70 000 tonnes for 2022. For both years, the quotas were in accordance with the ICES advice. The international historical catch by country and season in the years 1965–2022 is given in Table 10.1. The Norwegian catch in 2022 was 42 597 tonnes which was 647 tonnes above the national TAC. Russian catches were 22 646 tonnes which was 5 404 tonnes below the national TAC.
The age-length distribution of Norwegian and Russian catches in 2022 are summarized in Table 10.2a-b. The capelin sampling from the Barents Sea in 2022 is summarised below:
| Investigation | No. of trawl hauls | Length measurements | Aged individuals |
|---|---|---|---|
| Sampling from fishing vessels in winter-spring 2022 (Norway) | 23 | 2256 | 673 |
| Sampling from fishing vessels in winter-spring 2022 (Russia) | 43 | 13310 | 500 |
| Winter capelin survey 2022 (Norway) | 25 | 2383 | 978 |
| Joint Winter survey 2022 (Norway) | 292 | 10859 | 1059 |
| Joint Winter survey 2022 (Russia) | 97 | 5759 | 200 |
| BESS 2022 (Norway) (included in estimation) | 141 | 10640 | 4013 |
| BESS 2022 (Russia) | 0 | 0 | 0 |
Stock assessment
Acoustic stock size estimates in 2022 (Table 10.3, Figure 10.1, 10.2 and 10.3 )
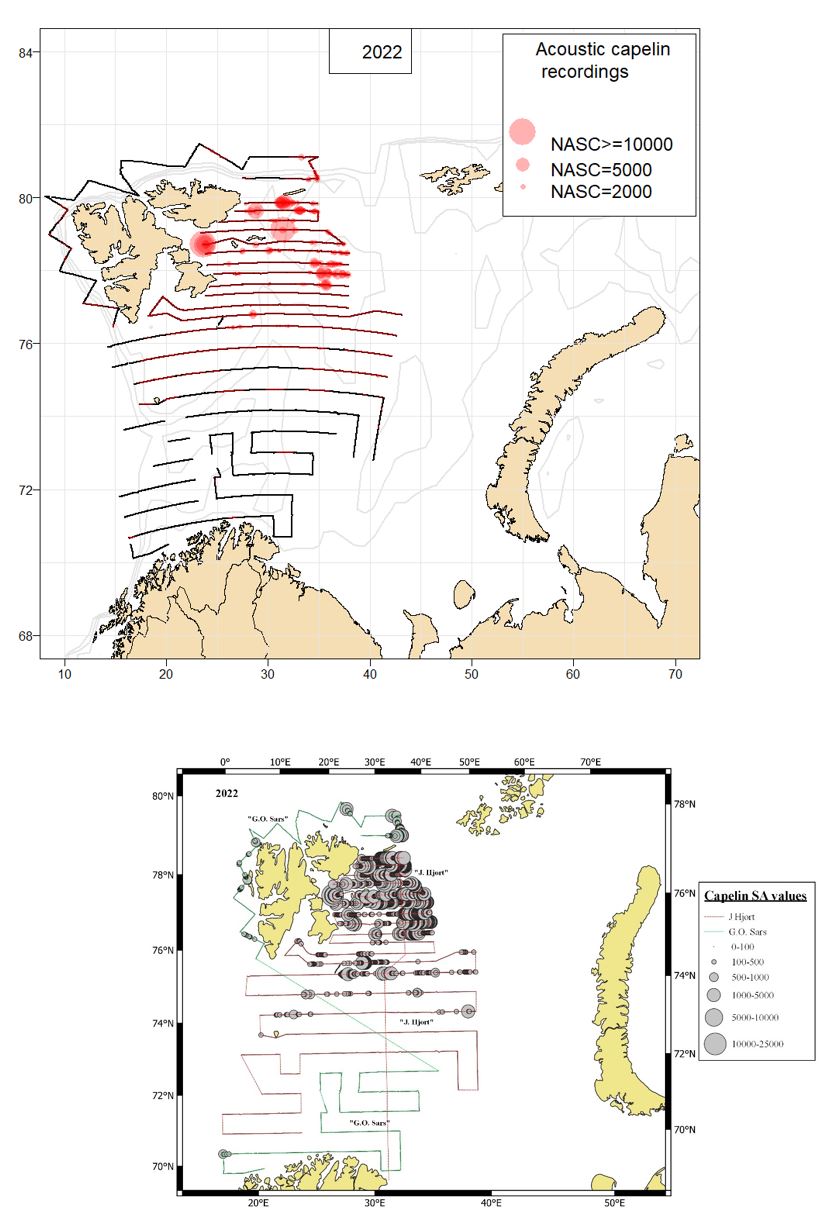
The geographical survey coverage of the Barents Sea capelin stock during the Barents Sea autumn Ecosystem Survey (BESS) in 2022 was incomplete (Fig 10.1), as the Russian Exclusive Economic Zone (EEZ) was not covered due to technical problems with the research vessel.
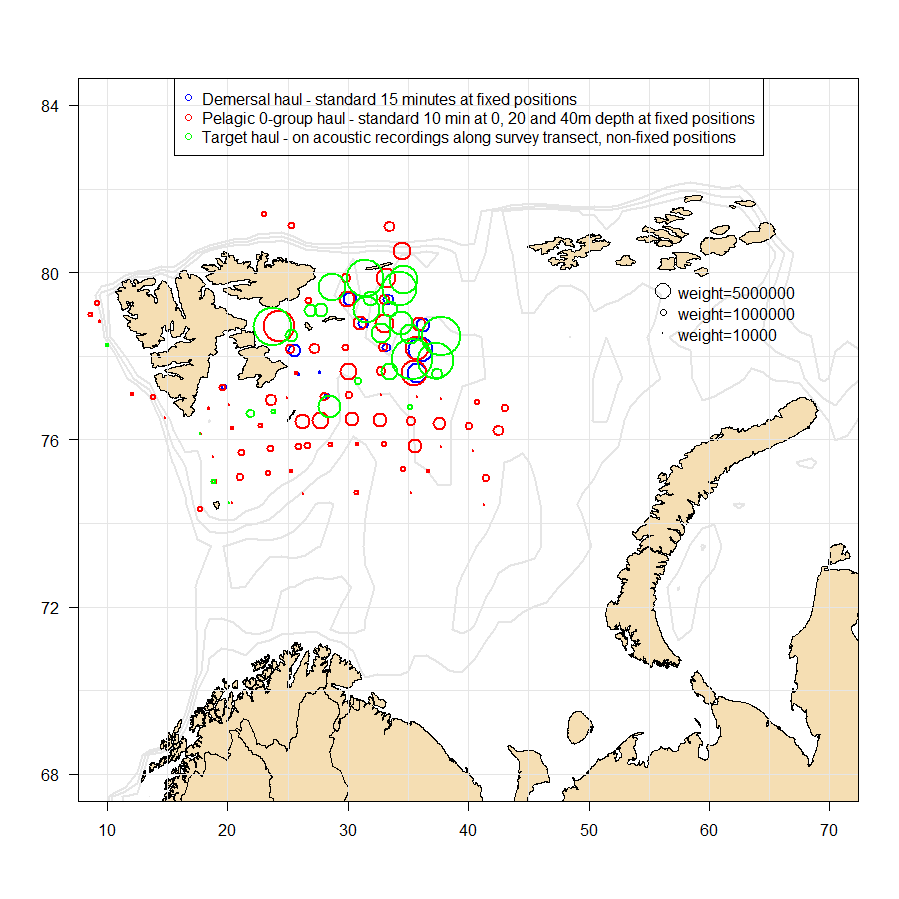
The geographical distribution of capelin in 2022 is shown in Fig 10.1, and the position and weighting of the trawl stations is shown in Fig. 10.2.
During the redfish survey west of Svalbard in early August 2022, large capelin was caught with the Gloria trawl in three trawl hauls (likely caught on the way up to the surface as trawling was done below about 200m depth). In these and adjacent areas high acoustic values were recorded in the upper 20-50 meters. Scrutiny of the echograms and trawl data from this survey and comparison with the trawl hauls and scrutiny done on the RV 'GO Sars' during the BESS survey west of Svalbard a few weeks later did, however, strongly indicate that the high acoustic recordings were of 0-group fish and not capelin. Consequently, no data from this survey were included in the stock estimate.
As decided during the 2016 assessment meeting, the capelin abundance was estimated using the software StoX (Johnsen et al. 2019), applying standard settings.
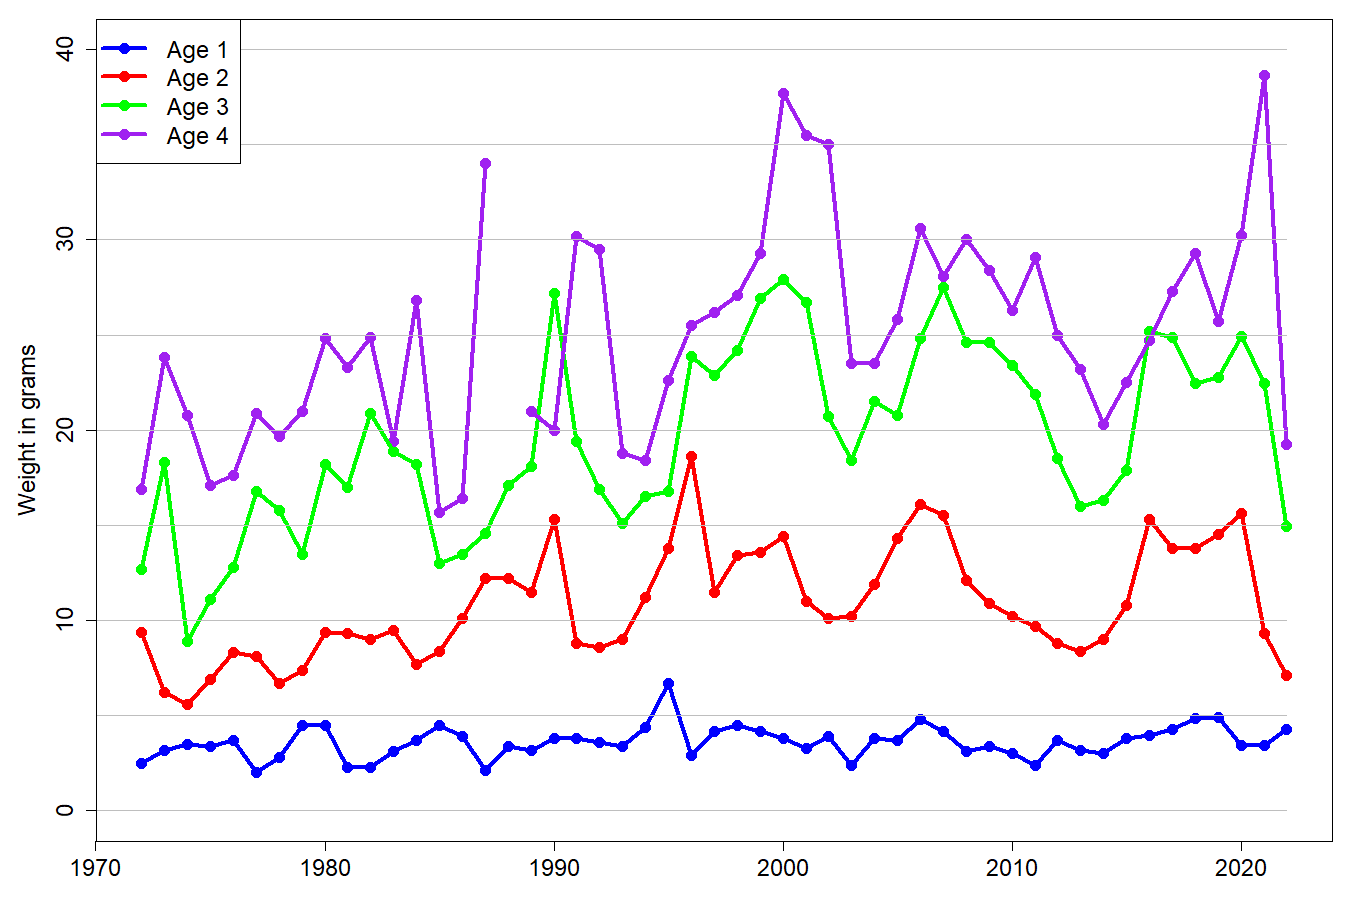
The stock estimate from the area covered by the 2022 survey was 2.174 million tonnes (Table 10.3). About 38% (0.817 million tonnes) of the estimated stock biomass consisted of maturing fish (>14.0 cm). The mean weight at age in the 2022 survey was the lowest since 1975 for age 2 and since 1987 for age 3 (Fig. 10.3).
A fixed sampling variance expressed as Coefficient of Variation (CV) of 0.2 per age group has been applied as input for the stock forecast in the capelin assessment and was also used this year (Tjelmeland 2002; Gjøsæter et al. 2002). The survey design and estimation software now allow for estimation of a direct CV by age group, and for the 2022 survey these were estimated:
for age group 1: 0.27; for age group 2: 0.20; and for age group 3: 0.20.
Relative sampling error based only on acoustic recordings (Nautical Area Scattering Coefficient (NASC; m2nmi-2)) was estimated to 18.2%. Detailed information about previous CV estimates can be found in AFWG WD5, 2018. Future implementation of direct survey CV in the assessment is discussed under future work (10.4.6).
Stock assessment in 2022 (Table 10.4-10.6, Figure 10.4-10.12)
All projections described below were based on a maturation and predation model with parameters estimated by the model Bifrost and data on predicted cod abundance and size at age in 2023 from the 2022 Bilateral Norwegian-Russian Assessment Group (Anon. 2022).
The methodology is described in the 2009 WKSHORT report (ICES 2009) and the WKARCT 2015 report (ICES 2015a). The natural mortality M for the months October to December is drawn among a set of M-values estimated for different years based on historical data. The same set of M-values was used in 2022 as in 2021 (ICES 2011).
Due to incomplete survey coverage, two approaches were explored as alternatives to standard stock projection:
- Compensation of maturing biomass using proportion of maturing capelin in the uncovered area in previous similar years
- Stock projection 1.5 years ahead from the 2021 estimate
A similar situation occurred in 2014, when a large proportion of the traditional distribution area of capelin in the Norwegian EEZ was covered by ice and could not be surveyed. Then the working group applied approach 2, while ADGCAP that year preferred approach 1 which then became the basis for the advice (ICES 2015b). WKARCT (ICES 2015a) recommended that a pre-agreed procedure for adjusting for surveys with incomplete should be developed, but that has not been done.
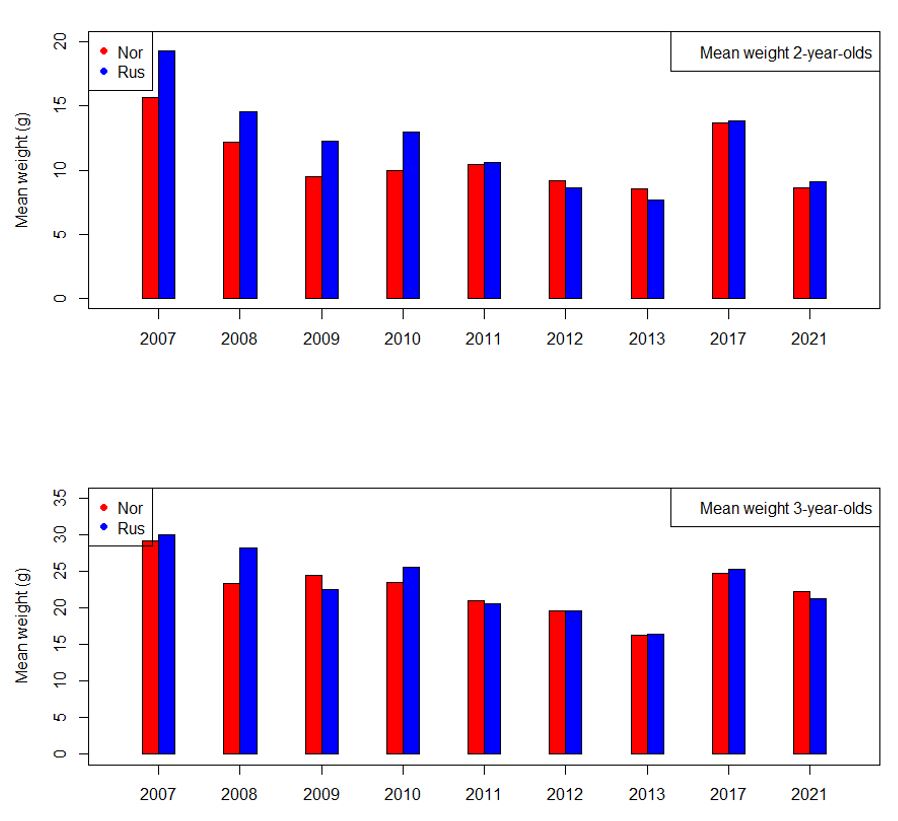
Before going into these two approaches, we investigated mean weight at age in NEEZ and REEZ for the years with high biomass of maturing capelin (Fig. 10.4; see below for background to the selection of years). Weight at age 2 in REEZ is higher than in NEEZ in the years 2007-2010, but there is no systematic difference in later years. For age 3 there were no systematic differences in weight at age. We concluded that the length distribution at age in NEEZ in 2022 could be taken to represent also the length distribution at age in REEZ in 2022.
For both approaches 1 and 2, probabilistic projections of the maturing stock to the time of spawning on 1 April 2023 were made using the R-Bifrost implementation which in 2021 was shown to give the same results as the Captool approach previously used. Some runs were also carried out in Captool this year and the results were the same as the results from R-Bifrost. 50 000 simulations were run.
1: Adjustment using proportion maturing capelin biomass in uncovered area in previous similar years
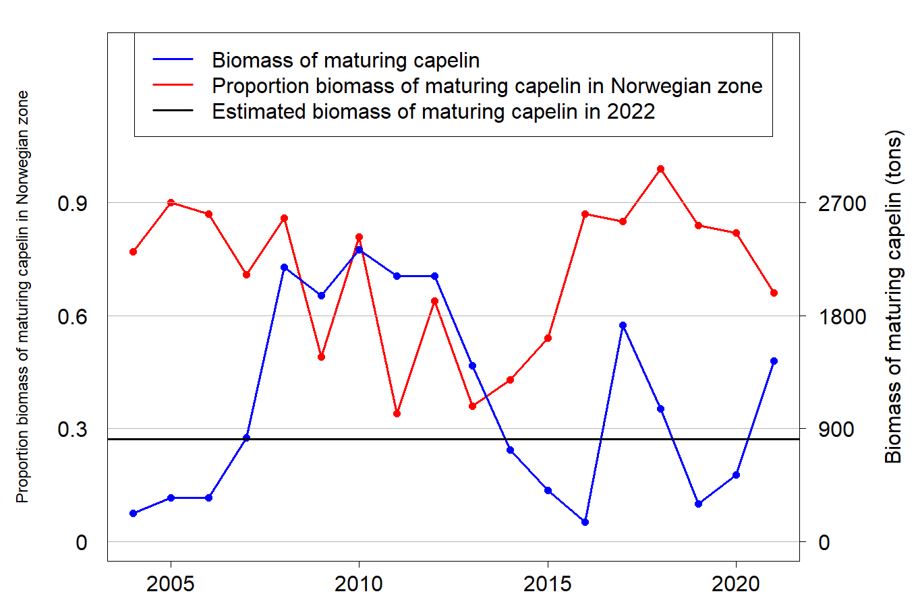
The approach taken here was to scale the biomass of maturing fish estimated from the survey. The scaling was based on the proportion of maturing capelin in the covered area in previous years with good survey coverage and high biomass of maturing capelin. Fig. 10.5 shows the proportion of maturing biomass in NEEZ for the years 2004-2021 for which StoX estimates are available, as well as the biomass of maturing capelin in those years. The years 2014 and 2018 were excluded due to incomplete survey coverage (partly ice covered survey area in 2014, and incomplete coverage in the SE Barents Sea in 2018). 2016 was also excluded since the survey results from that year contradict with the results from both the years before and after (Skaret et al. 2018). If we also exclude years with lower biomass of maturing capelin than what was measured in 2022 in the Norwegian EEZ (straight line in Fig 10.5), the following years are relevant to draw from: 2007-2013, 2017 and 2021. If we further select only years where the proportion of age 3 fish was high in the maturing stock, only the years 2009-2013 were selected. Table 10.4 shows the proportion of age 3 fish for the years 2007-2013, 2017 and 2021, and clearly the years 2007, 2008, 2017 and 2021 has a much lower proportion of age 3 fish than the years 2009-2013. We investigated both selection of years: 2007-2013, 2017 and 2021 as well as 2009-2013.
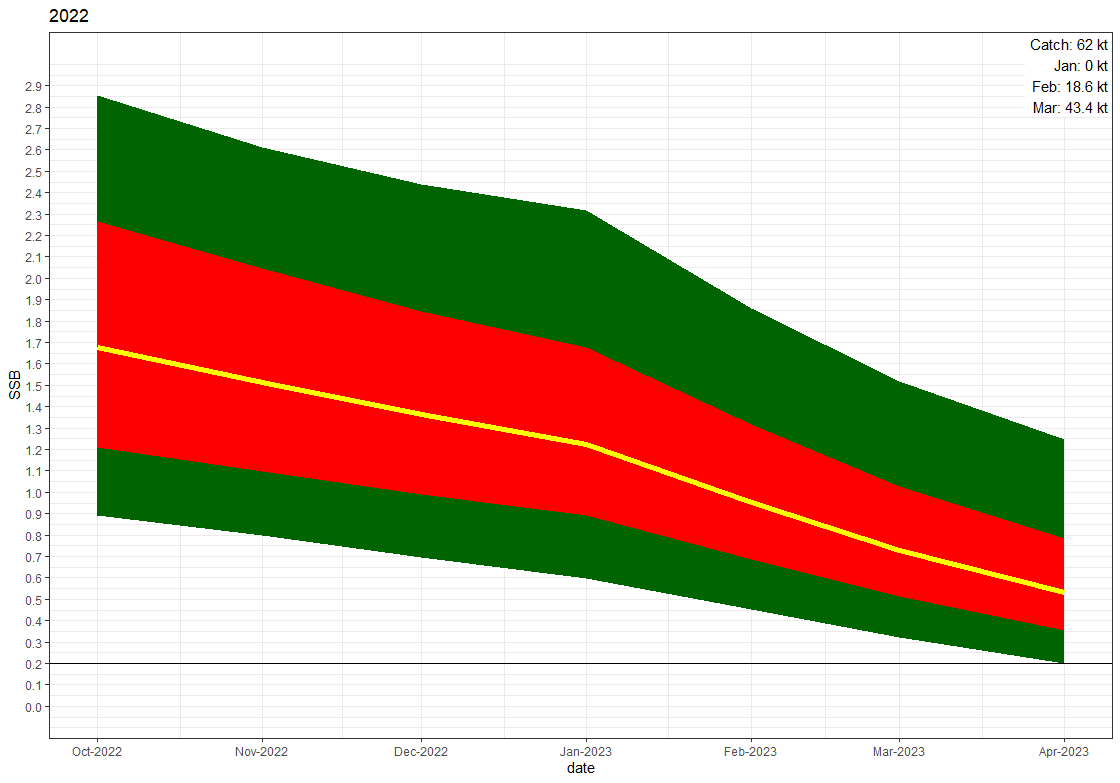
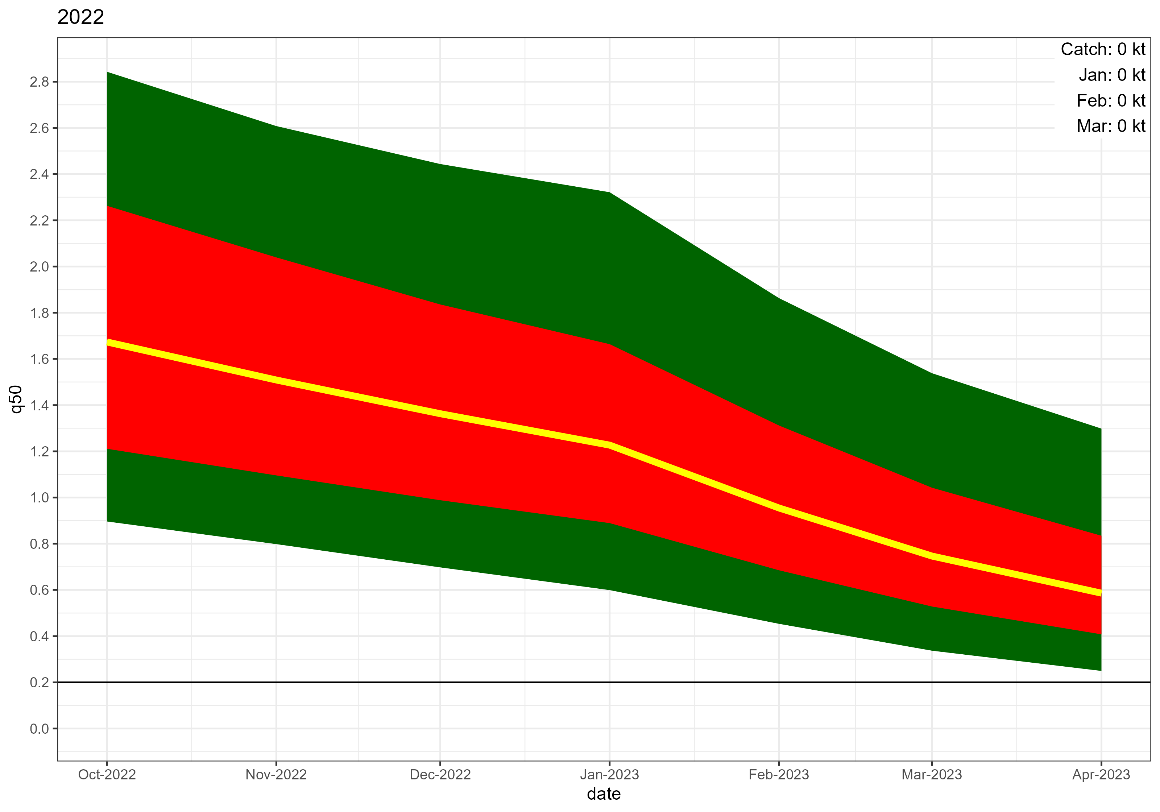
The scaling factor was drawn randomly among the relevant years. This approach gave median biomasses at October 1 2022 of 1.68 million tonnes when selecting only 2009-2013 and 1.26 million tonnes when selecting the years 2007-2013, 2017 and 2021. The first approach resulted in a catch advice of 62 thousand tons, while the second resulted in an advice of 21 thousand tons.
2: Predicting 1.5 years ahead from the 2021 estimate
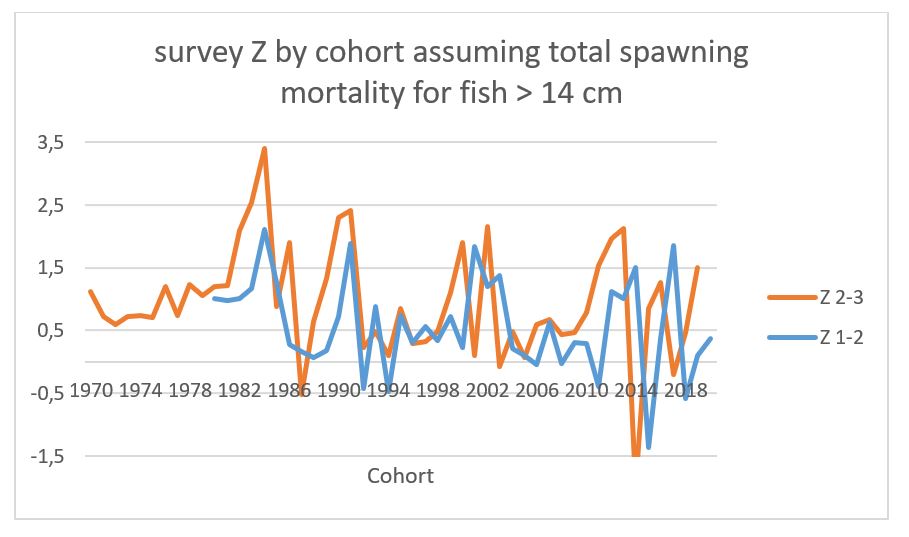
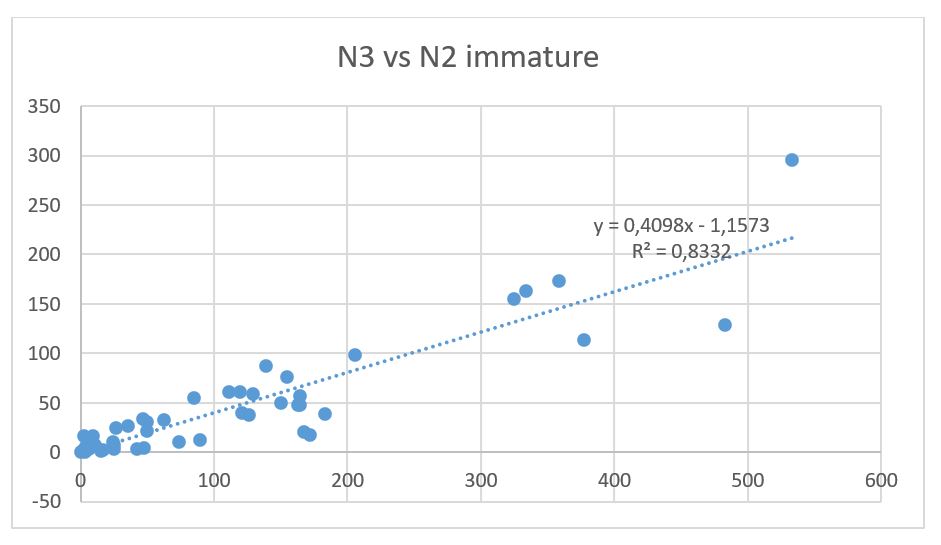
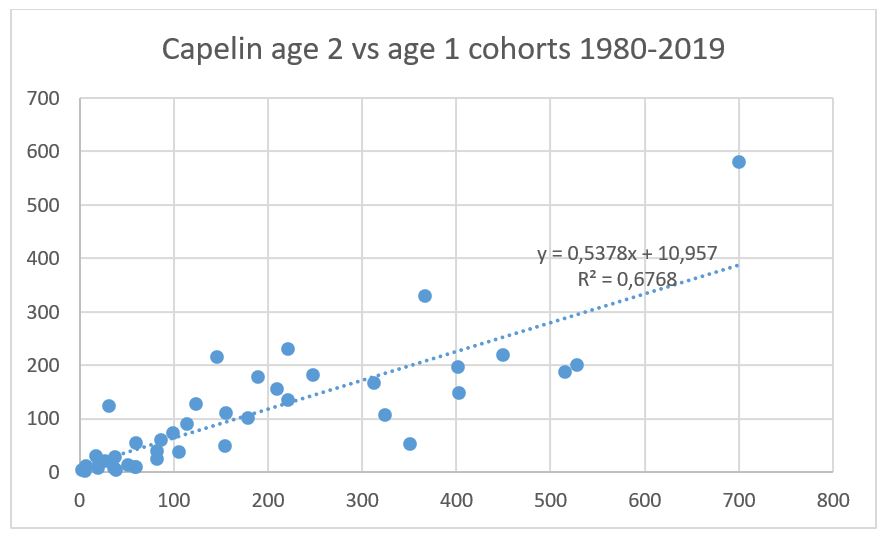
Fig 10.7 shows the natural mortality estimated from survey mortality from age 1-2 and 2-3, assuming total spawning mortality for capelin >14 cm. The mortality from age 1 to 2 of the 2020 year class is quite plausible, while the mortality for age 2 to 3 for the 2019 year class is unusually high. In view of the incomplete survey coverage, we investigated upscaling the abundance of capelin at age 3 in 2022 based on a regression between age 3 and immature age 2 fish for all cohorts in the time series. This regression is shown in Fig 10.7. Using this regression and inserting the observed value of 259.7 billion immature fish in 2021, the predicted value of this cohort is 105.2 billion, compared to the survey estimate of 57.7 billion. A similar regression between age 1 and age 2 estimates (only cohorts 1980-2019 due to incomplete survey coverage of age 1 fish in the 1970s) is shown in Fig 10.8 and gives 129.73 billion age 2 fish in 2022 which is very close to the observed value of 135.79. This supports the decision of not applying any scaling to the abundance of age 2 fish in 2022.
Uncertainty in the prediction of age 3 from immature age 2 fish was calculated as the standard deviation of the regression residuals, and indicated a CV of 0.222. Thus we implemented the abundance of the 2019 year class at 1 October 2022 as 105.2±23.4 billion individuals, (corresponding formula: 105.2*RiskNormal(0.2)*RiskNormal(0.222)) instead of 57.7*RiskNormal(0.2) as the survey estimate indicates. This approach (run 3) gave a catch advice of 31 kt.
Summary and discussion of results
A summary of the results of the runs mentioned above are shown in the text table below. The table also includes, for illustrative purposes, a 1.5 year prediction run with scaling of abundance at age 3 in 2022 and no additional uncertainty as well as a run with no scaling or adjustment at all.
| Basis | Total catch (2023) | Median biomass of maturing capelin on 1 October 2022 | Median of SSB on 1 April 2023, no catch | 5% percentile of SSB on 1 April 2023, no catch |
|---|---|---|---|---|
| Compensation for incomplete survey coverage based on proportion maturing capelin in the covered area drawn from the 5 years 2009-2013, years with high biomass of maturing capelin and high proportion of age 3 fish in the maturing stock | 62 000 | 1 628 000 | 586 000 | 250 000 |
| Compensation for incomplete survey coverage based on proportion maturing capelin in the covered area drawn from 9 years (2007-2013, 2017, 2021) instead of 5 years, i.e. including years with high biomass of maturing capelin but various proportions of age 3 fish in the maturing stock | 21 000 | 1 260 000 | 455 000 | 215 000 |
| Predicting from 2021 survey with added uncertainty | 31 000 | 1 350 000 | 464 000 | 225 000 |
| Predicting from 2021 survey without added uncertainty | 72 000 | 1 380 000 | 471 000 | 256 000 |
| No compensation for incomplete area coverage (survey estimate from Norwegian zone only used) | 0 | 833 000 | 278 000 | 148 000 |
The approach using historical distribution of maturing capelin as compensation for incomplete survey coverage and only the years 2009-2013 was found to be the most appropriate as basis for the assessment and advice. In 2014, a large part of the core capelin area was covered with ice, and the distribution in comparable years with complete survey coverage was used to compensate for the incomplete coverage. The approach chosen here is consistent with the 2014 compensation approach.
The compensations based on 5 and 9 historical years correspond to on average of 53% and 64%, respectively, of the stock biomass of maturing capelin being in the surveyed area in 2022. The results of the 1.5 year prediction as applied here imply that a 60% proportion of the maturing stock biomass is in the area covered by the survey.
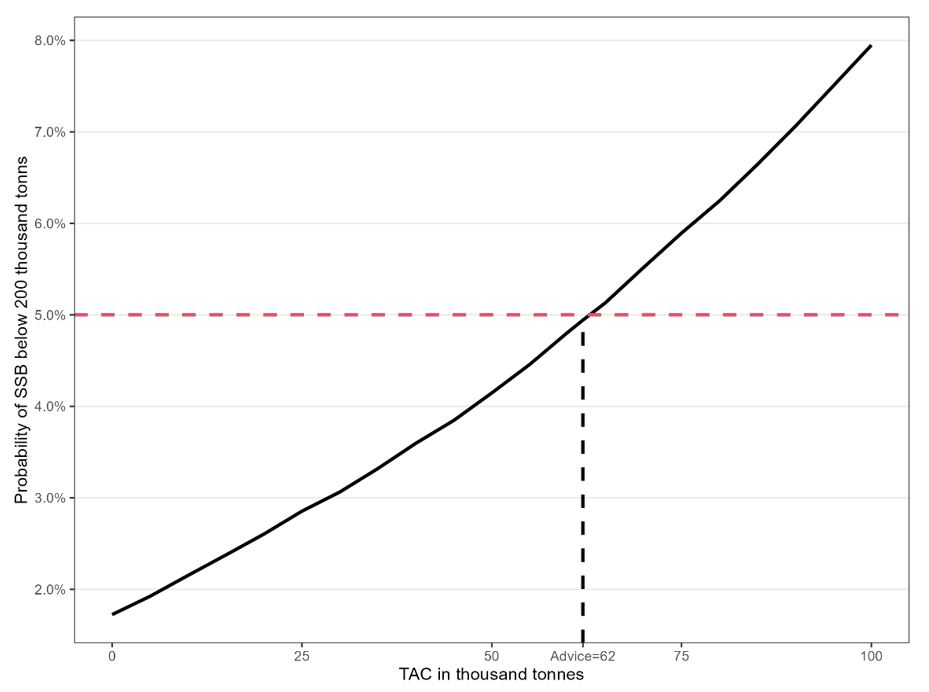
The development of biomass of maturing capelin from 1 October 2022 to 1 April 2023 based on the area correction method using the years 2009-2013, is shown with no catch and a catch of 62 kt in Fig 10.9. The risk of SSB being below 200 000 tonnes by 1 April 2023 as a function of catch is shown in Fig 10.10.
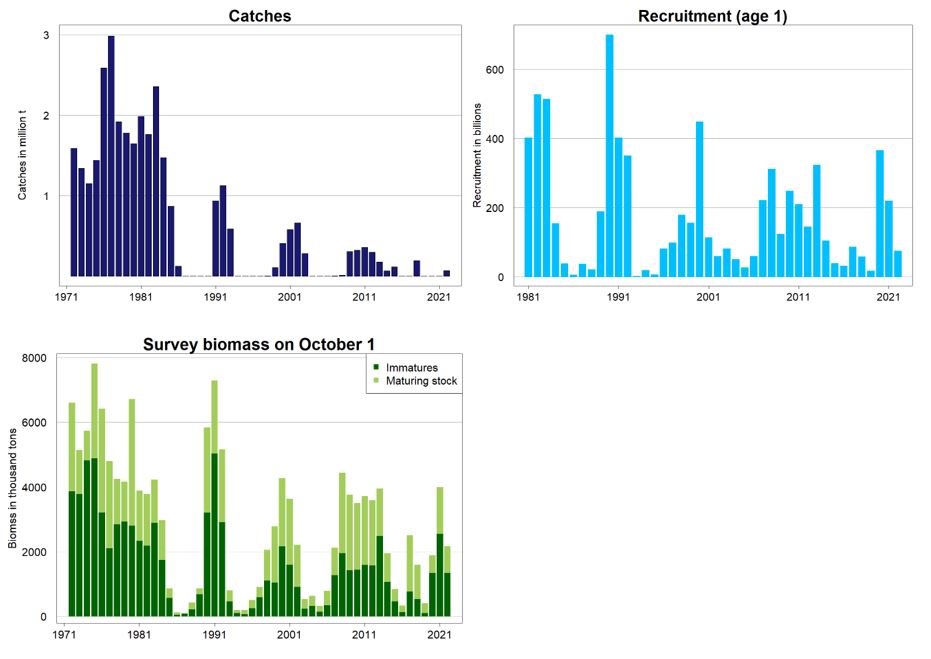
Stock abundance estimates by age group and total biomass for the historical period are shown in Table 10.6. Other data which describe the stock development are shown in Table 10.7. Information about spawning surveys going back to the 1980s are given in Gjøsæter and Prozorkevitch (WD05, 2020). Summary plots are given in Figure 10.11.
Additional information for the assessment
Historically, similar stock status and abundance of age groups (especially age 2) as in 2022 were observed only in 1973, 1975, 1978 and 1979. In these years, average mortality from age 2 to age 3 was about 58%, compared to about 82% in 2022. But using these years as analogues seems incorrect, because in recent years there have been significant changes both in the environment in the Barents Sea and the biology of key species, primarily cod and capelin.
As an alternative, the working group considered calculations by the Capstock model (Gjøsæter, 1998). This model resembles a VPA type of model but based on annual stock size estimates. The model keeps track of the stock history, giving estimates of stock abundance and production through the year as well as of fishing and natural mortality (including postspawning). This model gives 135 billion individuals at age 3 in 2022 when using average capelin mortality for the last 2 years. However, since this approach has not been used before, it was decided to include it only as additional information.
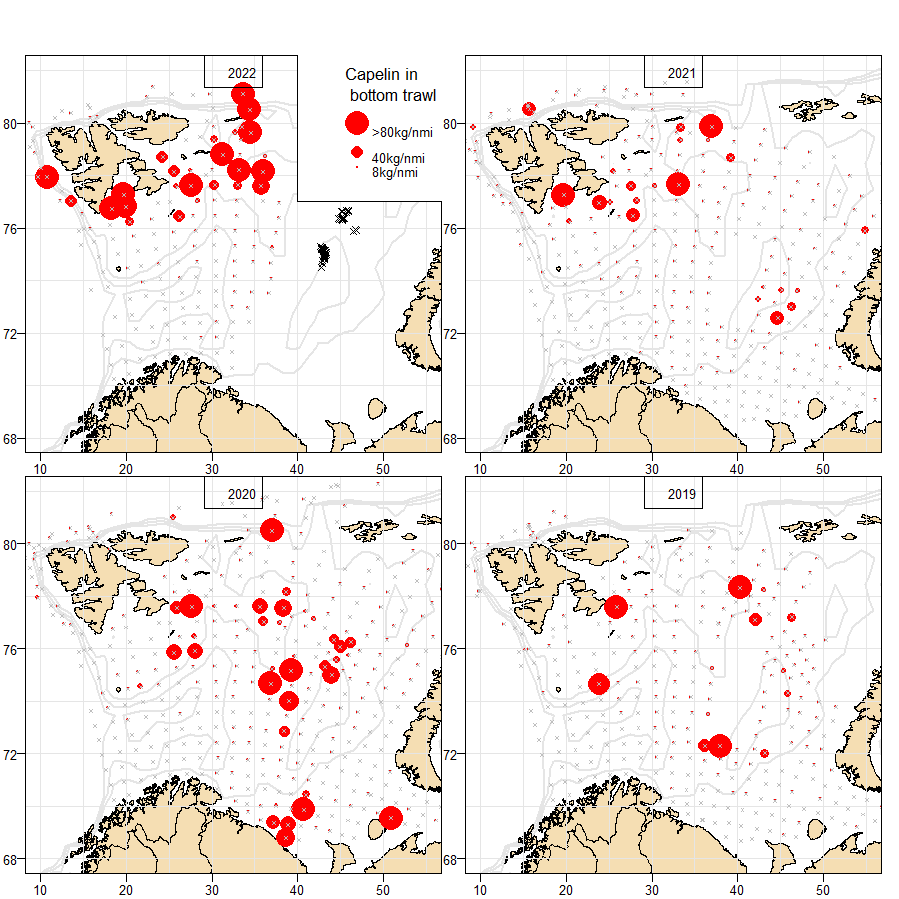
The distribution of capelin taken as bycatch in the Russian shrimp fishery in 2022, as well as the distribution of capelin in bottom trawl catches in BESS in 2019-2022, is shown in Fig 10.12. It was noted that in 2022 there was bycatch of maturing capelin in the shrimp fishery close to the boundary between international waters (Loophole) and REEZ, which is unusual. This may indicate that the distribution of mature capelin in REEZ stretches farther south than usual.
Recruitment
The 0-group series was recalculated by WGIBAR in 2022. Table 10.5 shows the number of fish in the various year classes from surveys at age 0-2. A 0-group estimate was not available for 2022.
The 1-group abundance in 2022 in the area covered by the survey was 75.5 billion which is about half the long-term average (Table 10.5). The most recent evaluation of the spawning stock and recruitment time series was made by Gjøsæter et al. (2016).
Future recruitment conditions: High abundance of young herring (mainly age groups 1 and 2) has been suggested to be a necessary but not a single factor causing recruitment failure in the capelin stock (Hjermann et al., 2010; Gjøsæter et al. 2016). In 2022, high abundances of 0-group herring were observed during BESS.
Comments to the assessment
Ecological considerations
The number of young herring in the Barents Sea can be an important factor that affects the capelin recruitment. It is not currently taken into account in the assessment model. The benchmark for capelin stocks in the Barents Sea (ICES 2015a) noted the need for further study of this effect as well as better monitoring of the young herring abundance.
The amount of other food than capelin for cod and other predators may also have changed in recent years. This may also indirectly have affected the predation pressure on capelin. A more detailed discussion of interactions between capelin and other species is given in the 2016-2022 ICES WGIBAR reports.
Further work on survey and assessment methodology
Spawning survey
On 27 February–13 March 2022, IMR carried out a trawl-acoustic monitoring and stock estimation of spawning capelin (Skaret et al. 2022). The survey is the fourth in a series to evaluate whether such a monitoring can be used in the assessment to improve the advice. The initiative and funding come from the Norwegian industry, and the idea in the long term is that monitoring closer to when fishery and spawning happens, can reduce uncertainty in stock advice. Monitoring during spawning has been attempted before, last time in 2007–2009, and has proven to be methodologically challenging due to unpredictable timing and location of the spawning migration.
The survey was carried out using two fishing vessels ‘Vendla’ and ‘Eros’. A stratified design using zig-zag transects with randomized starting points was used and the effort was allocated based on historical and recent information about capelin distribution. The fishery sonar was used actively during the whole survey to estimate size distribution of capelin schools, migration speed and direction. In addition, target strength measurements were carried out using submersible TS-probes on both vessels. The coverage of the capelin spawning migration was successful and the estimate of ca. 427 000 tonnes with a CV of 0.42 was within the expected range from the predictions made in the autumn 2021.
Despite the methodological challenges due to timing and distribution of capelin as well as acoustic target strength, the survey results from all four test years have fallen within the uncertainty range of the autumn prediction. This consistency is promising for the use of the survey in an advisory process. An evaluation of the four-year series will be carried out as part of the ICES benchmark for this stock which is planned for November 2022.
Assessment model
In the present capelin assessment model, the only species interaction in the Barents Sea taken explicitly into account is predation by cod on mature capelin. The model does not take into account possible changes in capelin stock dynamics (e.g. maturation), the current state of the environment and stock status of other fish species and mammals in the Barents Sea. The ICES working group of Integrated Assessment of the Barents Sea (WGIBAR) has addressed some of these issues.
Consumption of pre-spawning capelin by mature cod in the winter-spring season and autumn season is still not included in the assessment model. It may have a significant impact on capelin SSB calculations.
Gjøsæter et al. (2015) calculated what the quota advice and spawning stock would have been in the period 1991—2013, given the present assessment model and updated knowledge about the cod stock. They exchanged the cod abundance from prognoses which was originally used in the capelin assessment, with updated cod abundance estimates from the cod assessment model run later in time. When rerunning the capelin assessment model, they showed that considerably smaller annual capelin quotas would have been advised with the updated cod abundance estimates. Following this work, a retrospective analysis of the capelin assessment as well as of the assessment performance should be included annually. This is a feature which so far has been missing from the capelin assessment.
There is ongoing work to address specific points related to modelling for the benchmark meeting in November 2022. These include implementation of survey CV in the capelin assessment model, incorporating the assessment model in Template Model Builder (R-package), validating both the cod consumption part of the model, and the capelin maturation part and updating consumption parameters to reflect recent state in the Barents Sea. As mentioned above, the Excel based platform (Captool) used for running simulations for half-year stock predictions has already been implemented in R. Historical CVs of SSB estimates will be calculated back to 2004.
Reference points
A Blim (SSBlim) management approach has been suggested for this stock (Gjøsæter et al., 2002). In 2002, the JRNFC agreed to adopt a management strategy based on the rule that, with 95% probability, at least 200 000 tonnes of capelin should be allowed to spawn. Consequently, 200 000 tonnes was used as a Blim. Alternative harvest control rules of 80, 85 and 90% probability of SSB > Blim were suggested by JNRFC and evaluated by ICES (ICES 2016). ICES considers these rules not to be precautionary. At its 2016 meeting, JNRFC decided not to change the adopted management strategy.
References
Anon. 2022. Report of the Joint Russian-Norwegian Working Group on Arctic Fisheries (JRN-AFWG) 2022. IMR-PINRO report series 6-2022, 213 pp.
Gjøsæter, H. 1998. The population biology and exploitation of capelin (Mallotus villosus) in the Barents Sea. February 1998, Sarsia 83:453-496 DOI: 10.1080/00364827.1998.10420445
Gjøsæter, H., B. Bogstad, and S. Tjelmeland. 2002. Assessment methodology for Barents Sea capelin, Mallotus villosus (Müller). ICES Journal of Marine Science 59 :1086-1095.
Gjøsæter, H., B. Bogstad, S. Tjelmeland, and S. Subbey. 2015. A retrospective evaluation of the Barents Sea capelin management advice. Marine Biology Research 11 :135-143.
Gjøsæter, H., Hallfredsson, E. H., Mikkelsen, N., Bogstad, B., and Pedersen, T. 2016. Predation on early life stages is decisive for year class strength in the Barents Sea capelin ( Mallotus villosus ) stock. ICES Journal of Marine Science 73(2):182-195. doi: 10.1093/icesjms/fsv177
| Year | Winter-Spring | Summer-Autumn | Total | |||||
|---|---|---|---|---|---|---|---|---|
| Norway | Russia | Others | Total | Norway | Russia | Total | ||
| 1965 | 217 | 7 | 0 | 224 | 0 | 0 | 0 | 224 |
| 1966 | 380 | 9 | 0 | 389 | 0 | 0 | 0 | 389 |
| 1967 | 403 | 6 | 0 | 409 | 0 | 0 | 0 | 409 |
| 1968 | 460 | 15 | 0 | 475 | 62 | 0 | 62 | 537 |
| 1969 | 436 | 1 | 0 | 437 | 243 | 0 | 243 | 680 |
| 1970 | 955 | 8 | 0 | 963 | 346 | 5 | 351 | 1314 |
| 1971 | 1300 | 14 | 0 | 1314 | 71 | 7 | 78 | 1392 |
| 1972 | 1208 | 24 | 0 | 1232 | 347 | 13 | 360 | 1591 |
| 1973 | 1078 | 34 | 0 | 1112 | 213 | 12 | 225 | 1337 |
| 1974 | 749 | 63 | 0 | 812 | 237 | 99 | 336 | 1148 |
| 1975 | 559 | 301 | 43 | 903 | 407 | 131 | 538 | 1441 |
| 1976 | 1252 | 228 | 0 | 1480 | 739 | 368 | 1107 | 2587 |
| 1977 | 1441 | 317 | 2 | 1760 | 722 | 504 | 1226 | 2986 |
| 1978 | 784 | 429 | 25 | 1238 | 360 | 318 | 678 | 1916 |
| 1979 | 539 | 342 | 5 | 886 | 570 | 326 | 896 | 1782 |
| 1980 | 539 | 253 | 9 | 801 | 459 | 388 | 847 | 1648 |
| 1981 | 784 | 429 | 28 | 1241 | 454 | 292 | 746 | 1986 |
| 1982 | 568 | 260 | 5 | 833 | 591 | 336 | 927 | 1760 |
| 1983 | 751 | 373 | 36 | 1160 | 758 | 439 | 1197 | 2357 |
| 1984 | 330 | 257 | 42 | 629 | 481 | 368 | 849 | 1477 |
| 1985 | 340 | 234 | 17 | 591 | 113 | 164 | 277 | 868 |
| 1986 | 72 | 51 | 0 | 123 | 0 | 0 | 0 | 123 |
| 1987-1990 | 0 | 0 | 0 | 0 | 0 | 0 | 0 | 0 |
| 1991 | 528 | 159 | 20 | 707 | 31 | 195 | 226 | 933 |
| 1992 | 620 | 247 | 24 | 891 | 73 | 159 | 232 | 1123 |
| 1993 | 402 | 170 | 14 | 586 | 0 | 0 | 0 | 586 |
| 1994-1996 | 0 | 0 | 0 | 0 | 0 | 0 | 0 | 0 |
| 1997 | 0 | 0 | 0 | 0 | 0 | 1 | 1 | 1 |
| 1998 | 0 | 2 | 0 | 2 | 0 | 1 | 1 | 3 |
| 1999 | 50 | 33 | 0 | 83 | 0 | 22 | 22 | 105 |
| 2000 | 279 | 94 | 8 | 381 | 0 | 29 | 29 | 410 |
| 2001 | 376 | 180 | 8 | 564 | 0 | 14 | 14 | 578 |
| 2002 | 398 | 228 | 17 | 643 | 0 | 16 | 16 | 659 |
| 2003 | 180 | 93 | 9 | 282 | 0 | 0 | 0 | 282 |
| 2004 | 0 | 0 | 0 | 0 | 0 | 0 | 0 | 0 |
| 2005 | 1 | 0 | 0 | 1 | 0 | 0 | 0 | 1 |
| 2006 | 0 | 0 | 0 | 0 | 0 | 0 | 0 | 0 |
| 2007 | 2 | 2 | 0 | 4 | 0 | 0 | 0 | 4 |
| 2008 | 5 | 5 | 0 | 10 | 0 | 2 | 0 | 12 |
| 2009 | 233 | 73 | 0 | 306 | 0 | 1 | 1 | 307 |
| 2010 | 246 | 77 | 0 | 323 | 0 | 0 | 0 | 323 |
| 2011 | 273 | 87 | 0 | 360 | 0 | 0 | 0 | 360 |
| 2012 | 228 | 68 | 0 | 296 | 0 | 0 | 0 | 296 |
| 2013 | 116 | 60 | 0 | 177 | 0 | 0 | 0 | 177 |
| 2014 | 40 | 26 | 0 | 66 | 0 | 0 | 0 | 66 |
| 2015 | 71 | 44 | 0 | 115 | 0 | 0 | 0 | 115 |
| 2016-2017 | 0 | 0 | 0 | 0 | 0 | 0 | 0 | 0 |
| 2018 | 129 | 66 | 0 | 195 | 0 | 0 | 0 | 195 |
| 2019-2021 | 0 | 0 | 0 | 0 | 0 | 0 | 0 | 0 |
| 2022 | 42 | 23 | 0 | 65 | 0 | 0 | 0 | 65 |
| Length (cm) | Age 3 | Age 4 | Age 5 | Age 6 | Sum | % |
|---|---|---|---|---|---|---|
| 12.5 | 12.143 | 0 | 0 | 0 | 12.143 | 0.5 |
| 13.0 | 18.768 | 0 | 0 | 0 | 18.768 | 0.8 |
| 13.5 | 153.387 | 8.718 | 0 | 0 | 162.105 | 6.9 |
| 14.0 | 152.613 | 31.794 | 0 | 0 | 184.407 | 7.8 |
| 14.5 | 248.012 | 19.987 | 0 | 0 | 267.999 | 11.4 |
| 15.0 | 365.148 | 29.998 | 3.871 | 0 | 399.017 | 17.0 |
| 15.5 | 257.369 | 30.209 | 8.728 | 0 | 296.306 | 12.6 |
| 16.0 | 293.49 | 53.235 | 0 | 3.809 | 350.534 | 14.9 |
| 16.5 | 261.853 | 29.155 | 0 | 3.577 | 294.585 | 12.5 |
| 17.0 | 100.867 | 16.288 | 0 | 0 | 117.155 | 5.0 |
| 17.5 | 142.664 | 20.152 | 10.545 | 1.908 | 175.269 | 7.5 |
| 18.0 | 38.014 | 6.709 | 0 | 4.471 | 49.194 | 2.1 |
| 18.5 | 21.594 | 0 | 0 | 0 | 21.594 | 0.9 |
| 19.0 | 0 | 0 | 0 | 0 | 0 | 0.0 |
| 19.5 | 0 | 0.707 | 0 | 0 | 0.707 | 0.0 |
| Sum | 2065.922 | 246.952 | 23.144 | 13.765 | 2349.783 | |
| % | 87.9 | 10.5 | 1.0 | 0.6 | 100.0 |
| Length (cm) | Age 2 | Age 3 | Age 4 | Age 5 | N 106 |
|---|---|---|---|---|---|
| % | % | % | % | ||
| 10 | 50 | 50 | 0 | 0 | 5.2 |
| 11 | 0 | 100 | 0 | 0 | 5.2 |
| 12 | 0 | 100 | 0 | 0 | 23.6 |
| 13 | 0 | 98 | 2 | 0 | 128.4 |
| 14 | 0 | 100 | 0 | 0 | 319.6 |
| 15 | 0 | 90.1 | 9.9 | 0 | 317.0 |
| 16 | 0 | 82.2 | 16.8 | 0.9 | 280.3 |
| 17 | 0 | 80.4 | 17.9 | 1.8 | 146.7 |
| 18 | 0 | 65.4 | 34.6 | 0 | 68.1 |
| 19 | 0 | 100 | 0 | 0 | 13.1 |
| 20 | 0 | 0 | 100 | 0 | 2.6 |
| sum | 1309.8 |
| Age/year class | ||||||||
|---|---|---|---|---|---|---|---|---|
| Length (cm) | 1 | 2 | 3 | 4 | 5 | Sum (109) | Biomass (103 t) | Mean weight (g) |
| 2021 | 2020 | 2019 | 2018 | 2017 | ||||
| 7.0-7.5 | 0.275 | 0 | 0 | 0 | 0 | 0.275 | 0.347 | 1.26 |
| 7.5-8.0 | 0.448 | 0 | 0 | 0 | 0 | 0.448 | 0.982 | 2.19 |
| 8.0-8.5 | 1.851 | 0 | 0 | 0 | 0 | 1.851 | 4.324 | 2.34 |
| 8.5-9.0 | 3.240 | 0 | 0 | 0 | 0 | 3.240 | 9.512 | 2.94 |
| 9.0-9.5 | 11.849 | 0.367 | 0 | 0 | 0 | 12.216 | 41.061 | 3.36 |
| 9.5-10.0 | 16.198 | 0.643 | 0 | 0 | 0 | 16.841 | 64.576 | 3.83 |
| 10.0-10.5 | 18.004 | 3.259 | 0.234 | 0 | 0 | 21.498 | 92.273 | 4.29 |
| 10.5-11.0 | 15.478 | 22.005 | 0.997 | 0 | 0 | 38.481 | 191.589 | 4.98 |
| 11.0-11.5 | 4.450 | 28.864 | 1.244 | 0 | 0 | 34.558 | 193.871 | 5.61 |
| 11.5-12.0 | 2.061 | 28.342 | 2.699 | 0 | 0 | 33.102 | 211.645 | 6.39 |
| 12.0-12.5 | 1.194 | 20.241 | 4.766 | 0 | 0 | 26.201 | 190.108 | 7.26 |
| 12.5-13.0 | 0.270 | 11.627 | 3.362 | 0.016 | 0 | 15.275 | 128.200 | 8.39 |
| 13.0-13.5 | 0.141 | 8.034 | 4.325 | 0.081 | 0 | 12.581 | 122.333 | 9.72 |
| 13.5-14.0 | 0 | 4.171 | 5.232 | 0.068 | 0 | 9.470 | 105.374 | 11.13 |
| 14.0-14.5 | 0 | 2.936 | 5.955 | 0.040 | 0 | 8.932 | 114.229 | 12.79 |
| 14.5-15.0 | 0 | 1.788 | 5.060 | 0.046 | 0 | 6.894 | 101.479 | 14.72 |
| 15.0-15.5 | 0 | 1.294 | 5.544 | 0.262 | 0 | 7.100 | 119.397 | 16.82 |
| 15.5-16.0 | 0 | 0.832 | 5.340 | 0.184 | 0 | 6.356 | 122.091 | 19.21 |
| 16.0-16.5 | 0 | 0.933 | 5.625 | 0.447 | 0 | 7.006 | 148.635 | 21.22 |
| 16.5-17.0 | 0 | 0.290 | 3.518 | 0.005 | 0 | 3.814 | 91.257 | 23.93 |
| 17.0-17.5 | 0 | 0.079 | 1.988 | 0.077 | 0 | 2.143 | 59.219 | 27.63 |
| 17.5-18.0 | 0 | 0.078 | 1.019 | 0.025 | 0.008 | 1.129 | 34.809 | 30.82 |
| 18.0-18.5 | 0 | 0.004 | 0.679 | 0 | 0 | 0.683 | 22.707 | 33.24 |
| 18.5-19.0 | 0 | 0 | 0.103 | 0 | 0 | 0.103 | 3.620 | 35.2 |
| 19.0-19.5 | 0 | 0 | 0.001 | 0 | 0 | 0.001 | 0.033 | 39 |
| TSN(109) | 75.460 | 135.787 | 57.692 | 1.250 | 0.008 | 270.197 | ||
| TSB(103 t) | 324.674 | 964.078 | 860.680 | 24.052 | 0.188 | 2173.671 | ||
| Mean length (cm) | 9.85 | 11.69 | 14.22 | 15.32 | 17.5 | |||
| Mean weight (g) | 4.3 | 7.1 | 14.92 | 19.25 | 24 | 8.04 | ||
| MSN(109) | 0 | 12.405 | 40.064 | 1.153 | 0.008 | 53.630 | ||
| MSB (103 t) | 0 | 133.063 | 662.616 | 21.613 | 0.188 | 817.480 | ||
| Year | Biomass maturing age 1 | Biomass maturing age 2 | Biomass maturing age 3 | Biomass maturing age 4 | Biomass maturing age 5 | Proportion biomass age 3 to total maturing biomass |
|---|---|---|---|---|---|---|
| 2007 | 28.44 | 710.28 | 101.15 | 3.82 | 0.00 | 0.12 |
| 2008 | 1.30 | 1804.10 | 610.70 | 51.40 | 0.00 | 0.25 |
| 2009 | 0.91 | 809.00 | 1505.70 | 7.20 | 0.00 | 0.65 |
| 2010 | 0.28 | 610.68 | 1415.75 | 25.03 | 0.23 | 0.69 |
| 2011 | 0.01 | 697.25 | 1183.82 | 233.74 | 0.00 | 0.56 |
| 2012 | 3.30 | 397.44 | 1540.95 | 56.74 | 0.00 | 0.77 |
| 2013 | 3.00 | 523.06 | 785.33 | 159.60 | 0.12 | 0.53 |
| 2017 | 26.23 | 1267.63 | 417.63 | 11.60 | 0.00 | 0.24 |
| 2021 | 0.93 | 1287.85 | 147.96 | 1.22 | 0.00 | 0.10 |
| Year class | Larval abundance (1012) |
0-group swept area numbers (109 ind.) |
Acoustic estimate (109 ind.) | Mortality survey (1-2) | |
|---|---|---|---|---|---|
| 0 (Y) | 0+(Y) | 1(Y+1) | 2(Y+2) | % | |
| 1980 | - | 740 | 402.6 | 147.6 | 63 |
| 1981 | 9.7 | 477 | 528.3 | 200.2 | 62 |
| 1982 | 9.9 | 600 | 514.9 | 186.5 | 64 |
| 1983 | 9.9 | 340 | 154.8 | 48.3 | 69 |
| 1984 | 8.2 | 275 | 38.7 | 4.7 | 88 |
| 1985 | 8.6 | 64 | 6.0 | 1.7 | 72 |
| 1986 | 0.0 | 42 | 37.6 | 28.7 | 24 |
| 1987 | 0.3 | 4 | 21.0 | 17.7 | 16 |
| 1988 | 0.3 | 65 | 189.2 | 177.6 | 6 |
| 1989 | 7.3 | 862 | 700.4 | 580.2 | 17 |
| 1990 | 13.0 | 116 | 402.1 | 196.3 | 51 |
| 1991 | 3.0 | 169 | 351.3 | 53.4 | 85 |
| 1992 | 7.3 | 2 | 2.2 | 3.4 | -- |
| 1993 | 3.3 | 1 | 19.8 | 8.1 | 59 |
| 1994 | 0.1 | 14 | 7.1 | 11.5 | -- |
| 1995 | 0.0 | 3 | 81.9 | 39.1 | 52 |
| 1996 | 2.4 | 137 | 98.9 | 72.6 | 27 |
| 1997 | 6.9 | 189 | 179.0 | 101.5 | 43 |
| 1998 | 14.1 | 113 | 156.0 | 110.6 | 29 |
| 1999 | 36.5 | 288 | 449.2 | 218.7 | 51 |
| 2000 | 19.1 | 141 | 113.6 | 90.8 | 20 |
| 2001 | 10.7 | 90 | 59.7 | 9.6 | 84 |
| 2002 | 22.4 | 67 | 82.4 | 24.8 | 70 |
| 2003 | 11.9 | 341 | 51.2 | 13.0 | 75 |
| 2004 | 2.5 | 54 | 26.9 | 21.7 | 19 |
| 2005 | 8.8 | 148 | 60.1 | 54.7 | 9 |
| 2006 | 17.1 | 516 | 221.7 | 231.4 | -- |
| 2007 | - | 480 | 313.0 | 166.4 | 46 |
| 2008 | - | 995 | 124.0 | 127.6 | -- |
| 2009 | - | 673 | 248.2 | 181.1 | 27 |
| 2010 | - | 319 | 209.6 | 156.4 | 25 |
| 2011 | - | 594 | 145.9 | 216.2 | - |
| 2012 | - | 989 | 324.5 | 106.6 | 67 |
| 2013 | - | 316 | 105.1 | 40.5 | 62 |
| 2014 | - | 164 | 39.5 | 8.1 | 79 |
| 2015 | - | 457 | 31.6 | 123.7 | - |
| 2016 | - | 779 | 86.4 | 59.6 | 31 |
| 2017 | - | 214 | 58.6 | 7.0 | 88 |
| 2018 | - | 680 | 17.5 | 31.1 | - |
| 2019 | - | 1465 | 366.4 | 330.0 | 10 |
| 2020 | - | 1077 | 220.9 | 135.8 | 39 |
| 2021 | - | 325 | 75.5 | ||
| 2022 | |||||
| Average | 9.0 | 372 | 174.4 | 106.0 | |
| Year | Stock in numbers (109) | Biomass (103 tonnes) | ||||||
|---|---|---|---|---|---|---|---|---|
| Age 1 | Age 2 | Age 3 | Age 4 | Age 5 | Total | Total | MSB | |
| 1973 | 528 | 375 | 40 | 17 | 0 | 961 | 5144 | 1350 |
| 1974 | 305 | 547 | 173 | 3 | 0 | 1029 | 5733 | 907 |
| 1975 | 190 | 348 | 296 | 86 | 0 | 921 | 7806 | 2916 |
| 1976 | 211 | 233 | 163 | 77 | 12 | 696 | 6417 | 3200 |
| 1977 | 360 | 175 | 99 | 40 | 7 | 681 | 4796 | 2676 |
| 1978 | 84 | 392 | 76 | 9 | 1 | 561 | 4247 | 1402 |
| 1979 | 12 | 333 | 114 | 5 | 0 | 464 | 4162 | 1227 |
| 1980 | 270 | 196 | 155 | 33 | 0 | 654 | 6715 | 3913 |
| 1981 | 403 | 195 | 48 | 14 | 0 | 660 | 3895 | 1551 |
| 1982 | 528 | 148 | 57 | 2 | 0 | 735 | 3779 | 1591 |
| 1983 | 515 | 200 | 38 | 0 | 0 | 754 | 4230 | 1329 |
| 1984 | 155 | 187 | 48 | 3 | 0 | 393 | 2964 | 1208 |
| 1985 | 39 | 48 | 21 | 1 | 0 | 109 | 860 | 285 |
| 1986 | 6 | 5 | 3 | 0 | 0 | 14 | 120 | 65 |
| 1987 | 38 | 2 | 0 | 0 | 0 | 39 | 101 | 17 |
| 1988 | 21 | 29 | 0 | 0 | 0 | 50 | 428 | 200 |
| 1989 | 189 | 18 | 3 | 0 | 0 | 209 | 864 | 175 |
| 1990 | 700 | 178 | 16 | 0 | 0 | 894 | 5831 | 2617 |
| 1991 | 402 | 580 | 33 | 1 | 0 | 1016 | 7287 | 2248 |
| 1992 | 351 | 196 | 129 | 1 | 0 | 678 | 5150 | 2228 |
| 1993 | 2 | 53 | 17 | 2 | 2 | 75 | 796 | 330 |
| 1994 | 20 | 3 | 4 | 0 | 0 | 28 | 200 | 94 |
| 1995 | 7 | 8 | 2 | 0 | 0 | 17 | 193 | 118 |
| 1996 | 82 | 12 | 2 | 0 | 0 | 96 | 503 | 248 |
| 1997 | 99 | 39 | 2 | 0 | 0 | 140 | 911 | 312 |
| 1998 | 179 | 73 | 11 | 1 | 0 | 263 | 2056 | 931 |
| 1999 | 156 | 101 | 27 | 1 | 0 | 285 | 2776 | 1718 |
| 2000 | 449 | 111 | 34 | 1 | 0 | 595 | 4273 | 2099 |
| 2001 | 114 | 219 | 31 | 1 | 0 | 364 | 3630 | 2019 |
| 2002 | 60 | 91 | 50 | 1 | 0 | 201 | 2210 | 1290 |
| 2003 | 82 | 10 | 11 | 1 | 0 | 104 | 533 | 280 |
| 2004 | 51 | 25 | 6 | 1 | 0 | 82 | 628 | 294 |
| 2005 | 27 | 13 | 2 | 0 | 0 | 42 | 324 | 174 |
| 2006 | 60 | 22 | 6 | 0 | 0 | 88 | 787 | 437 |
| 2007 | 222 | 55 | 4 | 0 | 0 | 280 | 1882 | 844 |
| 2008 | 313 | 231 | 25 | 2 | 0 | 571 | 4427 | 2468 |
| 2009 | 124 | 166 | 61 | 0 | 0 | 352 | 3756 | 2323 |
| 2010 | 248 | 128 | 61 | 1 | 0 | 438 | 3500 | 2051 |
| 2011 | 209 | 181 | 55 | 8 | 0 | 454 | 3707 | 2115 |
| 2012 | 146 | 156 | 88 | 2 | 0 | 392 | 3586 | 1997 |
| 2013 | 324 | 216 | 59 | 7 | 0 | 610 | 3956 | 1471 |
| 2014 | 105 | 107 | 39 | 2 | 0 | 253 | 1949 | 873 |
| 2015 | 40 | 40 | 13 | 1 | 0 | 94 | 842 | 375 |
| 2016 | 32 | 8 | 3 | 0 | 0 | 43 | 328 | 181 |
| 2017 | 86 | 124 | 17 | 0 | 0 | 227 | 2506 | 1723 |
| 2018 | 59 | 60 | 21 | 0 | 0 | 140 | 1597 | 1056 |
| 2019 | 17 | 9 | 7 | 1 | 0 | 35 | 411 | 302 |
| 2020 | 366 | 31 | 4 | 1 | 0 | 403 | 1884 | 533 |
| 2021 | 221 | 330 | 7 | 0 | 0 | 558 | 3998 | 1438 |
| 2022 | 75 | 136 | 58 | 1 | 0 | 270 | 2174 | 817 |
| Year | Estimated stock by autumn acoustic survey (103 t) 1 October | SSB, assessment model, April 1 year+1 (103 t) | Recruitment Age 1, survey assessment 1 October 109 sp. | Young herring biomass age 1+2 (103 t) source: WGIBAR 2022 | Herring 0-group swept area index (109 ind.p) source: WGIBAR 2022 | Capelin landing (103 t) | |
|---|---|---|---|---|---|---|---|
| TSB | MSB | ||||||
| 1972 | 6600 | 2727 | 152 | 2 | 1591 | ||
| 1973 | 5144 | 1350 | 33 | 529 | 2 | 1337 | |
| 1974 | 5733 | 907 | * | 305 | 48 | 1148 | |
| 1975 | 7806 | 2916 | * | 190 | 74 | 1441 | |
| 1976 | 6417 | 3200 | 253 | 211 | 39 | 2587 | |
| 1977 | 4796 | 2676 | 22 | 360 | 46 | 2986 | |
| 1978 | 4247 | 1402 | * | 84 | 52 | 1916 | |
| 1979 | 4162 | 1227 | * | 12 | 39 | 1782 | |
| 1980 | 6715 | 3913 | * | 270 | 66 | 0 | 1648 |
| 1981 | 3895 | 1551 | 316 | 403 | 47 | 0 | 1986 |
| 1982 | 3779 | 1591 | 106 | 528 | 9 | 3 | 1760 |
| 1983 | 4230 | 1329 | 100 | 515 | 12 | 195 | 2357 |
| 1984 | 2964 | 1208 | 109 | 155 | 1467 | 27 | 1477 |
| 1985 | 860 | 285 | * | 39 | 2638 | 20 | 868 |
| 1986 | 120 | 65 | * | 6 | 191 | 0 | 123 |
| 1987 | 101 | 17 | 34 | 38 | 288 | 0 | 0 |
| 1988 | 428 | 200 | * | 21 | 77 | 61 | 0 |
| 1989 | 864 | 175 | 84 | 189 | 277 | 18 | 0 |
| 1990 | 5831 | 2617 | 92 | 700 | 434 | 15 | 0 |
| 1991 | 7287 | 2248 | 643 | 402 | 929 | 268 | 933 |
| 1992 | 5150 | 2228 | 302 | 351 | 1329 | 84 | 1123 |
| 1993 | 796 | 330 | 293 | 2 | 2432 | 291 | 586 |
| 1994 | 200 | 94 | 139 | 20 | 1887 | 104 | 0 |
| 1995 | 193 | 118 | 60 | 7 | 647 | 11 | 0 |
| 1996 | 503 | 248 | 60 | 82 | 238 | 550 | 0 |
| 1997 | 909 | 312 | 85 | 99 | 537 | 463 | 1 |
| 1998 | 2056 | 932 | 94 | 179 | 560 | 476 | 3 |
| 1999 | 2775 | 1718 | 382 | 156 | 1616 | 36 | 105 |
| 2000 | 4273 | 2098 | 599 | 449 | 2109 | 470 | 410 |
| 2001 | 3630 | 2019 | 626 | 114 | 1233 | 10 | 578 |
| 2002 | 2210 | 1291 | 496 | 60 | 428 | 152 | 659 |
| 2003 | 533 | 280 | 427 | 82 | 1794 | 178 | 282 |
| 2004 | 628 | 294 | 94 | 51 | 3790 | 774 | 0 |
| 2005 | 324 | 174 | 122 | 27 | 2191 | 126 | 1 |
| 2006 | 787 | 437 | 72 | 60 | 2115 | 295 | 0 |
| 2007 | 2119 | 844 | 189 | 222 | 876 | 144 | 4 |
| 2008 | 4428 | 2468 | 330 | 313 | 958 | 201 | 12 |
| 2009 | 3765 | 2323 | 517 | 124 | 440 | 104 | 307 |
| 2010 | 3500 | 2051 | 504 | 248 | 605 | 117 | 323 |
| 2011 | 3707 | 2115 | 487 | 209 | 816 | 83 | 360 |
| 2012 | 3586 | 1997 | 504 | 146 | 445 | 177 | 296 |
| 2013 | 3956 | 1471 | 479 | 324 | 492 | 289 | 177 |
| 2014 | 1949 | 873 | 504 | 105 | 673 | 136 | 66 |
| 2015 | 842 | 375 | 82 | 40 | 963 | 83 | 115 |
| 2016 | 328 | 181 | 37 | 32 | 498 | 79 | 0 |
| 2017 | 2506 | 1723 | 462 | 124 | 1106 | 154 | 0 |
| 2018 | 1597 | 1056 | 317 | 59 | 2034 | 55 | 195 |
| 2019 | 411 | 302 | 85 | 17 | 389 | 50 | 0 |
| 2020 | 1884 | 533 | 154 | 366 | 359 | 12 | 0 |
| 2021 | 3998 | 1438 | 420 | 221 | 152 | 209 | 0 |
| 2022 | 2174 | 817 | 75 | 65 | |||