Stock Name: Northeast Arctic Greenland halibut (ICES areas 1 and 2)
Advice on fishing opportunities
The Joint Russian-Norwegian Arctic Fisheries Working Group (JRN-AFWG) advises that when the MSY approach is applied, catches in 2024 should be no more than 15 560 tonnes.
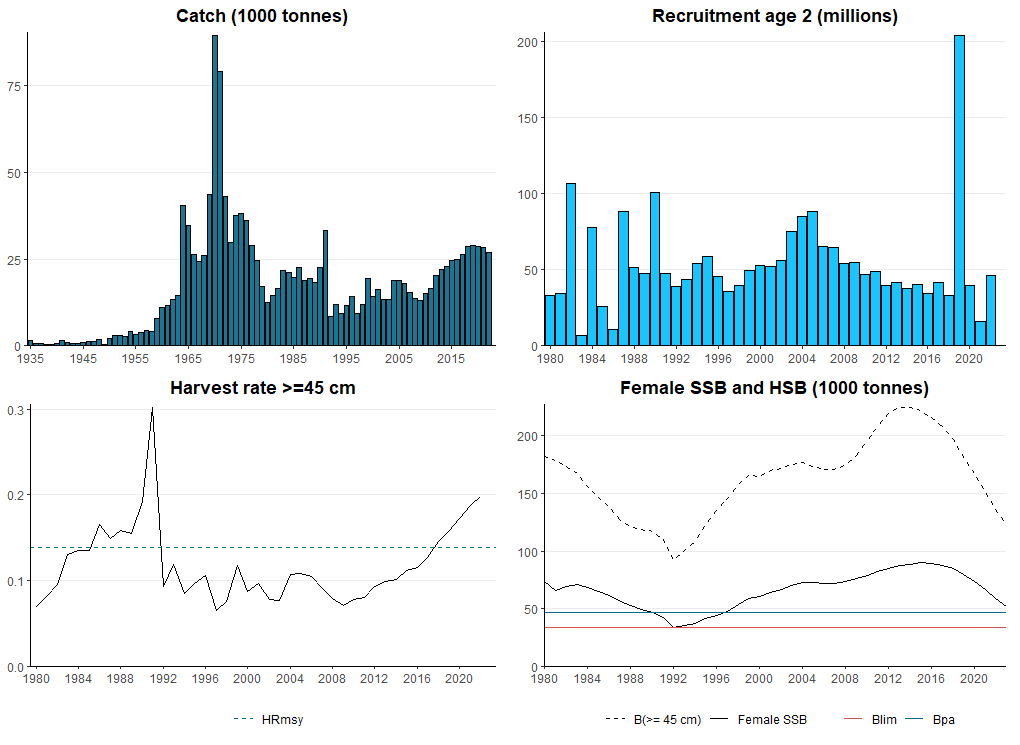
Stock development over time
The female spawning stock biomass is sligthly above Bpa, above Blim, and declining. Total harvestable biomass (≥45 cm) is in a rapid decline. Harvest rate is increasing and is now above HRMSY.
Catch scenarios
| Variable | Value | Notes |
|---|---|---|
| Harvest rate ≥ 45 cm (2023) | 0.220 | Based on expected catch in 2023 |
| Biomass ≥ 45 cm (2024) | 115 970 | Beginning of 2024 |
| Female SSB (2024) | 45 379 | Beginning of 2024 |
| Recruitment age 1 (2023-2024) | 50 928 | Average 1990-2017. Does not influence short-term forecast |
| Expected catch (2023) | 26 998 | Based on status quo catch in 202 3 tonnes |
| Basis | Total catch (2024) | HR (2024) | Female SSB (2025) | % Female SSB change * | % TAC change ** | % Advice change *** |
|---|---|---|---|---|---|---|
| Advice basis | ||||||
| MSY approach: HR MSY x SSB2024/B trigger | 15 560 | 0.134 | 46 054 | 1.5 | -37.8 | -15.9 |
| Other scenarios | ||||||
| MSY approach ex. 2019 recruitment spike | 14 012 | 0.129 | 43 282 | -1.2 | -44.0 | -24.2 |
| HR=0 | 0 | 0 | 53 142 | 14.6 | -100.0 | -100.0 |
| Catch s.q. | 26 997 | 0.233 | 40 844 | -11.1 | 8.0 | 46.0 |
* Female SSB 2025 relative to 2024. Note that the comparisons are within each scenario.
** Advice for 2024 relative to the TAC in 2023 (25 000 tonnes).
*** Advice for 202 4 relative to the advice for 202 3 (18 494 tonnes).
The advice for 2024 is lower than the advice for 2023 mainly due to recent below average recruitment and high fishing pressure resulting in decreasing stock size.
Basis of the advice
| Advice basis | MSY approach |
| Management plan | There is no agreed precautionary management plan for Greenland halibut in this area |
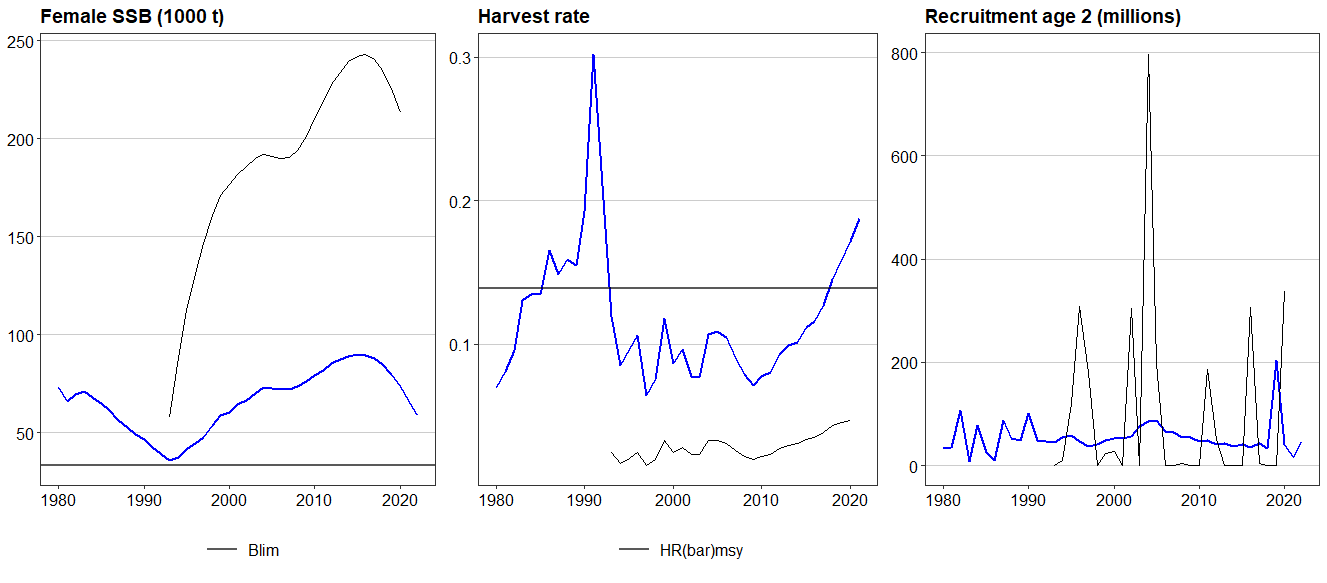
Quality of the assessment
There was an ICES benchmark between the 2021 and 2023 assessment. The new assessment (including age data) results in considerably lower biomass levels and higher HR, but the trends and catch advice are similar. This revision suggests that the stock is more impacted by the current level of catch above advice than was previously believed. In the previous assessment the biomass trends were considered reliable, but the absolute level of biomass was considered highly uncertain. Although the inclusion of age data is likely to have improved the estimation of absolute biomass, this should still be considered uncertain.
Peaks in recruitment were most likely exaggerated in the previous assessment model, while in the present model they are probably underestimated. There is evidence for a good recruitment event in 2019. However, the magnitude of this recruitment spike is currently poorly constrained by the data and should be considered uncertain.
Issues relevant for the advice
Due to the temporary suspension of Russian scientists from ICES, this assessment was conducted by a Joint Russian-Norwegian Arctic Fisheries Working Group (JRN-AFWG) consisting of scientists from VNIRO (Russia) and IMR (Norway) (Howell et al., 2023).
This advice has been conducted outside ICES and should not be considered as ICES advice. However, the assessment has been produced following the methodology agreed at the ICES benchmark in 2023 (ICES, 2023).
The fishery has a history of both quotas being set at levels above those provided in scientific advice and catches being above the quota; this is not precautionary.
Greenland halibut is a long-lived species which requires low fishing pressure – and the stock is currently declining .
The Greenland halibut advice is for one year to bring the timing back in line with the slope survey, which is conducted biennially, after this the two-year advice cycle will be resumed.
Reference points
| Framework | Reference point | Value | Technical basis | Source |
|---|---|---|---|---|
| MSY approach | MSY | 19 142 tonnes | Maximum sustainable yield (long term) | Howell et al., 2023 |
| HRMSY | 0.139 | HR (≥45cm) leading to MSY | ||
| Precautionary approach | Blim | 33 391 tonnes | Lowest modelled female SSB | |
| Bpa | 46 747 tonnes | Blim x 1.4 (female SSB) | ||
| Btrigger | 46 747 tonnes | Bpa (female SSB) | ||
| HRlim | 0.165 | HR (≥45cm) leading to P(female SSB<B lim ) = 0.5 | ||
| HRpa | 0.145 | HR(≥45cm), when ICES AR is applied, leading to P(female SSB < Blim ) = 0.05 |
Basis of the assessment
| ICES stock data category | 1. |
|---|---|
| Assessment type | Age–length-structured (Gadget model). |
| Input data | Trends in biomass for five survey indices from three surveys: the Norwegian slope survey (G1165), the Russian autumn bottom trawl survey at the slope (G5348), and three survey indices from the Ecosystem survey (10-17cm, 18-27cm and 28-65cm). Length distributions from these three surveys and from the Joint winter survey (A6996) and the Norwegian slope survey in spring (G5678); catch-in-tonnes from five aggregated commercial fleets (Russian, trawl and minor gears; Russian, gillnet and longline; Norwegian, trawl and minor gears; Norwegian, gillnet and longline; 3 rd countries); age and maturity-at-length data from the Norwegian slope survey (G1165). |
| Discards and bycatch | Not included, considered negligible. |
| Other information | Last assessment update from ICES benchmark in February 2023 (ICES, 2023) used by JRN-AFWG 2023. |
| Working group | Joint Russian-Norwegian Arctic Fisheries W orking Group (JRN-AFWG). |
History of the advice, catch, and management
| Year | ICES advice | Predicted catch corresponding to advice | Agreed TAC – Norway/JNRFC | TAC to Norway–UK/EU zone^ in ICES subareas 2 and 6 combined ^^ | ICES catches |
|---|---|---|---|---|---|
| 1987 | Precautionary TAC | - | - | 19112 | |
| 1988 | No decrease in SSB | 19000 | - | 19587 | |
| 1989 | F = F(87); TAC | 21000 | - | 20138 | |
| 1990 | F = F(8 9 ); TAC | 15000 | - | 23183 | |
| 1991 | F at Fmed; TAC; improved expl. pattern | 9000 | - | 33320 | |
| 1992 | 2 Rebuild SSB(1991) | 6000 | 7000* | 8602 | |
| 1993 | TAC | 7000 | 7000* | 11933 | |
| 1994 | F<0.1 | <12000 | 11000* | 9226 | |
| 1995 | No fishing | 0 | 2500** | 11734 | |
| 1996 | No fishing | 0 | 2500** | 14347 | |
| 1997 | No fishing | 0 | 2500** | 9410 | |
| 1998 | No fishing | 0 | 2500** | 11893 | |
| 1999 | No fishing | 0 | 2500** | 19517 | |
| 2000 | No fishing | 0 | 2500** | 14297 | |
| 2001 | Reduce catch to rebuild stock | <11000 | 2500** | 16365 | |
| 2002 | Reduce F substantially | <11000 | 2500** | 13293 | |
| 2003 | Reduce catch to increase stock | <13000 | 2500** | 13447 | |
| 2004 | Do not exceed recent low catches | <13000 | 2500** | 18899 | |
| 2005 | Do not exceed recent low catches | <13000 | 2500** | 18834 | |
| 2006 | Do not exceed recent low catches | <13000 | 2500** | 17871 | |
| 2007 | Reduce catch to increase stock | <13000 | 2500** | 15452 | |
| 2008 | Reduce catch to increase stock | <13000 | 2500** | 13806 | |
| 2009 | Same advice as previous year | <13000 | 2500** | 12979 | |
| 2010 | Same advice as previous year | <13000 | 15000*** | 350 | 8302 |
| 2011 | Same advice as previous year | <13000 | 15000*** | 350 | 16605 |
| 2012 | No increase in catches | <15000 | 18000*** | 350 | 20277 |
| 2013 | No increase in catches | <15000 | 18000*** | 824 | 21977 |
| 2014 | No new advice, same as for 2013 | <15000 | 18000*** | 1000 | 22840 |
| 2015 | Same as for 2014 | <15000 | 18000*** | 1000 | 25069 |
| 2016 | Precautionary approach | <19000 | 22000*** | 1100 | 25389 |
| 2017 | Same advice as previous year | <19800 | 24000*** | 1100 | 26430 |
| 2018 | Precautionary approach | <23000 | 27000*** | 1100 | 28587 |
| 2019 | Same advice as previous year | <23000 | 27000*** | 1250 | 28792 |
| 2020 | Precautionary approach | <23000 | 27000*** | 1250 | 28566 |
| 2021 | Same advice as previous year | <23000 | 27000*** | 0 | 28440 |
| 2022 | Precautionary approach | ≤ 19094 | 25000*** | 600 | 26997 |
| 2023 | Precautionary approach | ≤ 18494 | 25000*** | 700 | |
| 2024 | MSY approach ^^^ | ≤ 15560 |
* Set by Norwegian authorities.
** Set by Norwegian authorities for the non-trawl fishery; allowable bycatch in the trawl fishery is additional to this.
*** Set by the Joint Norwegian-Russian Fisheries Commission (JNRFC).
^ UK after 2020
^^ Part of this TAC is taken in the assessment area.
^^^ In 2023 assessment and advice was carried out by the Joint Russian-Norwegian working group on Arctic Fisheries (JRN-AFWG) which compiled catches for 2022 and gave advice for 2024.
History of catch and landings
| Year | Denmark | Estonia | Faroe Islands | France | Germany | Greenland | Iceland | Ireland | Latvia | Lithuania | Norway | Poland | Portugal | Russia | Spain | UK | Total |
|---|---|---|---|---|---|---|---|---|---|---|---|---|---|---|---|---|---|
| 1984 | 0 | 0 | 0 | 138 | 2165 | 0 | 0 | 0 | 0 | 0 | 4376 | 0 | 0 | 15181 | 0 | 23 | 21883 |
| 1985 | 0 | 0 | 0 | 239 | 4000 | 0 | 0 | 0 | 0 | 0 | 5464 | 0 | 0 | 10237 | 0 | 5 | 19945 |
| 1986 | 0 | 0 | 42 | 13 | 2718 | 0 | 0 | 0 | 0 | 0 | 7890 | 0 | 0 | 12200 | 0 | 12 | 22875 |
| 1987 | 0 | 0 | 0 | 13 | 2024 | 0 | 0 | 0 | 0 | 0 | 7261 | 0 | 0 | 9733 | 0 | 81 | 19112 |
| 1988 | 0 | 0 | 186 | 67 | 744 | 0 | 0 | 0 | 0 | 0 | 9076 | 0 | 0 | 9430 | 0 | 84 | 19587 |
| 1989 | 0 | 0 | 67 | 31 | 600 | 0 | 0 | 0 | 0 | 0 | 10622 | 0 | 0 | 8812 | 0 | 6 | 20138 |
| 1990 | 0 | 0 | 163 | 49 | 954 | 0 | 0 | 0 | 0 | 0 | 17243 | 0 | 0 | 4764 | 0 | 10 | 23183 |
| 1991 | 11 | 2564 | 314 | 119 | 101 | 0 | 0 | 0 | 0 | 0 | 27587 | 0 | 0 | 2490 | 132 | 2 | 33320 |
| 1992 | 0 | 0 | 16 | 111 | 13 | 13 | 0 | 0 | 0 | 0 | 7667 | 0 | 31 | 718 | 23 | 10 | 8602 |
| 1993 | 2 | 0 | 61 | 80 | 22 | 8 | 56 | 0 | 0 | 30 | 10380 | 0 | 43 | 1235 | 0 | 16 | 11933 |
| 1994 | 4 | 0 | 18 | 55 | 296 | 3 | 15 | 5 | 0 | 4 | 8428 | 0 | 36 | 283 | 1 | 78 | 9226 |
| 1995 | 0 | 0 | 12 | 174 | 35 | 12 | 25 | 2 | 0 | 0 | 9368 | 0 | 84 | 794 | 1106 | 122 | 11734 |
| 1996 | 0 | 0 | 2 | 219 | 81 | 123 | 70 | 0 | 0 | 0 | 11623 | 0 | 79 | 1576 | 200 | 374 | 14347 |
| 1997 | 0 | 0 | 27 | 253 | 56 | 0 | 62 | 2 | 0 | 0 | 7661 | 12 | 50 | 1038 | 157 | 92 | 9410 |
| 1998 | 0 | 0 | 57 | 67 | 34 | 0 | 23 | 2 | 0 | 0 | 8435 | 31 | 99 | 2659 | 259 | 227 | 11893 |
| 1999 | 0 | 0 | 94 | 0 | 34 | 38 | 7 | 2 | 0 | 0 | 15004 | 8 | 49 | 3823 | 319 | 139 | 19517 |
| 2000 | 0 | 0 | 0 | 45 | 15 | 0 | 16 | 1 | 0 | 0 | 9083 | 3 | 37 | 4568 | 375 | 154 | 14297 |
| 2001 | 0 | 0 | 0 | 122 | 58 | 0 | 9 | 1 | 0 | 0 | 10896 | 2 | 35 | 4694 | 418 | 130 | 16365 |
| 2002 | 0 | 219 | 0 | 7 | 42 | 22 | 4 | 6 | 0 | 0 | 7143 | 5 | 14 | 5584 | 178 | 69 | 13293 |
| 2003 | 0 | 0 | 459 | 2 | 18 | 14 | 0 | 1 | 0 | 0 | 8216 | 5 | 19 | 4384 | 230 | 99 | 13447 |
| 2004 | 0 | 0 | 0 | 0 | 9 | 0 | 9 | 0 | 0 | 0 | 13939 | 1 | 50 | 4662 | 186 | 43 | 18899 |
| 2005 | 0 | 170 | 0 | 32 | 8 | 0 | 0 | 0 | 0 | 0 | 13011 | 0 | 23 | 4883 | 660 | 47 | 18834 |
| 2006 | 0 | 0 | 204 | 44 | 7 | 0 | 7 | 0 | 0 | 196 | 11119 | 201 | 24 | 6055 | 2 | 12 | 17871 |
| 2007 | 0 | 0 | 203 | 39 | 6 | 198 | 15 | 0 | 0 | 0 | 8230 | 200 | 50 | 6484 | 10 | 17 | 15452 |
| 2008 | 0 | 0 | 663 | 40 | 4 | 0 | 28 | 0 | 0 | 0 | 7393 | 200 | 46 | 5294 | 112 | 26 | 13806 |
| 2009 | 0 | 0 | 422 | 16 | 19 | 16 | 15 | 1 | 0 | 0 | 8446 | 203 | 237 | 3335 | 202 | 67 | 12979 |
| 2010 | 0 | 0 | 272 | 102 | 14 | 15 | 15 | 0 | 0 | 0 | 770 | 2 | 11 | 6888 | 188 | 25 | 8302 |
| 2011 | 0 | 0 | 538 | 46 | 80 | 4 | 7 | 0 | 0 | 234 | 8270 | 169 | 21 | 7053 | 144 | 39 | 16605 |
| 2012 | 0 | 0 | 563 | 39 | 38 | 12 | 13 | 0 | 0 | 0 | 9331 | 21 | 1 | 10041 | 185 | 33 | 20277 |
| 2013 | 0 | 0 | 783 | 167 | 48 | 22 | 106 | 0 | 0 | 0 | 10403 | 29 | 7 | 10310 | 11 | 91 | 21977 |
| 2014 | 0 | 0 | 887 | 268 | 33 | 24 | 86 | 0 | 0 | 0 | 11232 | 17 | 0 | 10061 | 22 | 210 | 22840 |
| 2015 | 0 | 0 | 721 | 228 | 30 | 16 | 98 | 0 | 0 | 0 | 10874 | 13 | 0 | 12953 | 23 | 113 | 25069 |
| 2016 | 2 | 353 | 1076 | 226 | 8 | 17 | 75 | 0 | 0 | 0 | 12932 | 26 | 17 | 10576 | 27 | 54 | 25389 |
| 2017 | 0 | 523 | 993 | 175 | 21 | 25 | 10 | 0 | 3 | 72 | 13741 | 25 | 10 | 10714 | 36 | 82 | 26430 |
| 2018 | 2 | 574 | 400 | 148 | 50 | 19 | 24 | 0 | 0 | 204 | 14874 | 25 | 4 | 12072 | 59 | 132 | 28587 |
| 2019 | 0 | 587 | 350 | 103 | 44 | 21 | 8 | 0 | 0 | 347 | 14845 | 122 | 7 | 12198 | 86 | 74 | 28792 |
| 2020 | 1 | 579 | 512 | 37 | 70 | 47 | 19 | 0 | 0 | 260 | 14532 | 96 | 8 | 12266 | 96 | 43 | 28566 |
| 2021 | 1 | 382 | 756 | 138 | 88 | 14 | 40 | 0 | 96 | 160 | 14008 | 15 | 46 | 12394 | 125 | 177 | 28440 |
| 2022* | 0 | 253 | 1055 | 85 | 94 | 48 | 27 | 0 | 75 | 136 | 13140 | 0 | 60 | 11746 | 164 | 114 | 26997 |
*Provisional figures.
Summary of the assessment
| Year | Recruitment (age 2) | Female SSB | Total Biomass | Biomass ( ≥45 cm ) | Catches | Harvest rate |
|---|---|---|---|---|---|---|
| Thousands | Tonnes | |||||
| 1980 | 33174 | 73170 | 220981 | 181796 | 12655 | 0.070 |
| 1981 | 34503 | 65655 | 217738 | 178563 | 14466 | 0.081 |
| 1982 | 106502 | 69517 | 213525 | 173776 | 16580 | 0.095 |
| 1983 | 6949 | 70809 | 207467 | 167291 | 21773 | 0.130 |
| 1984 | 77582 | 68086 | 197564 | 156330 | 21047 | 0.135 |
| 1985 | 26066 | 64679 | 189247 | 146627 | 19768 | 0.135 |
| 1986 | 10574 | 61248 | 182387 | 137757 | 22768 | 0.165 |
| 1987 | 88075 | 55995 | 173540 | 126210 | 18744 | 0.149 |
| 1988 | 51569 | 52502 | 169723 | 121542 | 19322 | 0.159 |
| 1989 | 47586 | 48823 | 166389 | 118591 | 18352 | 0.155 |
| 1990 | 100647 | 46374 | 165870 | 117172 | 22555 | 0.192 |
| 1991 | 47861 | 42255 | 162749 | 110325 | 33318 | 0.302 |
| 1992 | 38788 | 33391 | 150062 | 91896 | 8603 | 0.094 |
| 1993 | 43924 | 35742 | 162661 | 100195 | 11932 | 0.119 |
| 1994 | 54266 | 37418 | 172100 | 108567 | 9226 | 0.085 |
| 1995 | 58792 | 41108 | 184287 | 121926 | 11734 | 0.096 |
| 1996 | 45754 | 44393 | 193735 | 135182 | 14347 | 0.106 |
| 1997 | 35962 | 47478 | 199914 | 145687 | 9410 | 0.065 |
| 1998 | 39999 | 53363 | 210132 | 158025 | 11893 | 0.075 |
| 1999 | 49363 | 58678 | 216955 | 165340 | 19517 | 0.118 |
| 2000 | 52648 | 60291 | 215514 | 164692 | 14297 | 0.087 |
| 2001 | 51887 | 64141 | 218870 | 169567 | 16365 | 0.097 |
| 2002 | 56021 | 66519 | 220046 | 171637 | 13293 | 0.077 |
| 2003 | 74955 | 69992 | 224730 | 174848 | 13446 | 0.077 |
| 2004 | 84718 | 72954 | 230346 | 176571 | 18899 | 0.107 |
| 2005 | 88078 | 72708 | 232233 | 173122 | 18834 | 0.109 |
| 2006 | 65148 | 72076 | 235773 | 170790 | 17871 | 0.105 |
| 2007 | 64334 | 71920 | 241567 | 170590 | 15453 | 0.091 |
| 2008 | 53810 | 73262 | 250343 | 174408 | 13792 | 0.079 |
| 2009 | 54759 | 75823 | 260794 | 182825 | 12991 | 0.071 |
| 2010 | 46942 | 78980 | 271488 | 195636 | 15299 | 0.078 |
| 2011 | 49075 | 81917 | 278904 | 208394 | 16684 | 0.080 |
| 2012 | 39800 | 85095 | 283502 | 219252 | 20288 | 0.093 |
| 2013 | 41745 | 87218 | 282950 | 224230 | 21164 | 0.099 |
| 2014 | 37664 | 88688 | 278874 | 224648 | 22790 | 0.101 |
| 2015 | 40472 | 89658 | 272755 | 222186 | 24748 | 0.111 |
| 2016 | 34412 | 89310 | 263299 | 215866 | 24933 | 0.116 |
| 2017 | 41795 | 87870 | 252630 | 207762 | 26379 | 0.127 |
| 2018 | 33000 | 84841 | 239640 | 196756 | 2858 8 | 0.145 |
| 2019 | 203650 | 79673 | 227113 | 182369 | 28844 | 0.158 |
| 2020 | 39757 | 73337 | 216885 | 166990 | 28705 | 0.172 |
| 2021 | 16048 | 66288 | 208581 | 151381 | 28443 | 0.188 |
| 2022 | 46353 | 58745 | 201555 | 135955 | 26998 | 0.199 |
| 2023 | 51872 | 200050 | 122949 | |||
References
Howell et al. 2023. Report of the Joint Russian-Norwegian Working Group on Arctic Fisheries (JRN-AFWG) 2023. IMR-PINRO no.7-2023.
ICES. 2023. Benchmark workshop on Greenland halibut and redfish stocks (WKBNORTH). ICES Scientific Reports. 5:33. https://doi.org/10.17895/ices.pub.22304638