REDUS-prosjektet (2016-2020) har vært et strategisk prosjekt på Havforskningsinstituttet som har hatt som mål å kvantifisere og redusere usikkerheten i datarike og aldersstrukturerte bestandsestimater (f.eks. torsk, sild, hyse, lodde). Arbeidet har vært organisert i fire tematiske arbeidspakker: Fiskeriavhengige (fangst) undersøkelser og bestandsvurderingsmodellering (WP1), Fiskeriuavhengige (vitenskapelige) tokt (WP2), Evaluering og testing av langtidsforvaltningsstrategier (WP3), og Kommunisering av usikkerhet, spredning av prosjektresultater og oppbygging av kompetanse (WP4). Norsk Regnesentral (NR) ble innleid som en strategisk partner i statistisk modellering og analyse og har bidratt hovedsakelig til WP1 og WP2, men syntes at forskningen var så interessant at de også bidro med interne (NR) midler for å utvikle det statistiske vitenskapelige grunnlaget for en del av metodene.
For Fiskeriavhengige (fangst) undersøkelser og bestandsvurderingsmodellering (WP1) var en av hovedresultatene bedre bestandsvurderingsmodeller. Dette ble oppnådd både ved å videreutvikle og implementere bestandsmodellen XSAM i WGWIDE sin bestandsvurdering av norsk vårgytende sild, og ved å bruke XSAM som en tilleggsmodell for nordøstarktisk torsk i AFWG. Gjennom samarbeid med DTU Aqua, har mye av funksjonaliteten til XSAM blitt implementert i SAM-koden, noe som har gjort det mulig å bruke strukturer fra begge modellene. Begrensningene i initialbetingelsene i bestandsvurderingsmodeller ble utforsket, f.eks. modellering med gjennomsnitt istedenfor modalverdi i SAM og inkludering av prosessfeil i fangstligningen i SAM. Et annet hovedresultat i WP1 var utviklingen og innføringen av sannsynlighetsbasert prøvetaking av fangster av pelagisk fisk, det såkalte «fangstprøvelotteriet», som gradvis har blitt utvidet fra å dekke kun sildefisket til å bli standard fangstprøvetaking for alle de pelagiske fiskeriene f.o.m. 2021. For å kunne estimere fangst i antall-per-alder basert på data fra fangstprøvelotteriet, har det blitt utviklet designbaserte estimatorer som har blitt inkludert i en R-pakke. I tillegg ble den modellbaserte estimatoren for fangst i antall-per-alder (ECA) som er standard for de store bunnfiskfiskeriene i Norge, videreutviklet som en R-pakke (R-ECA) og bygd inn i StoX.
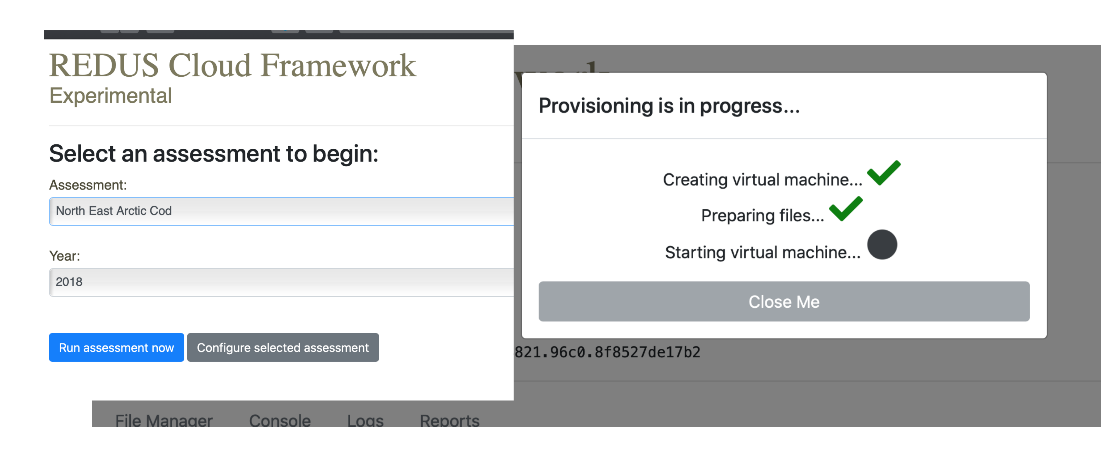
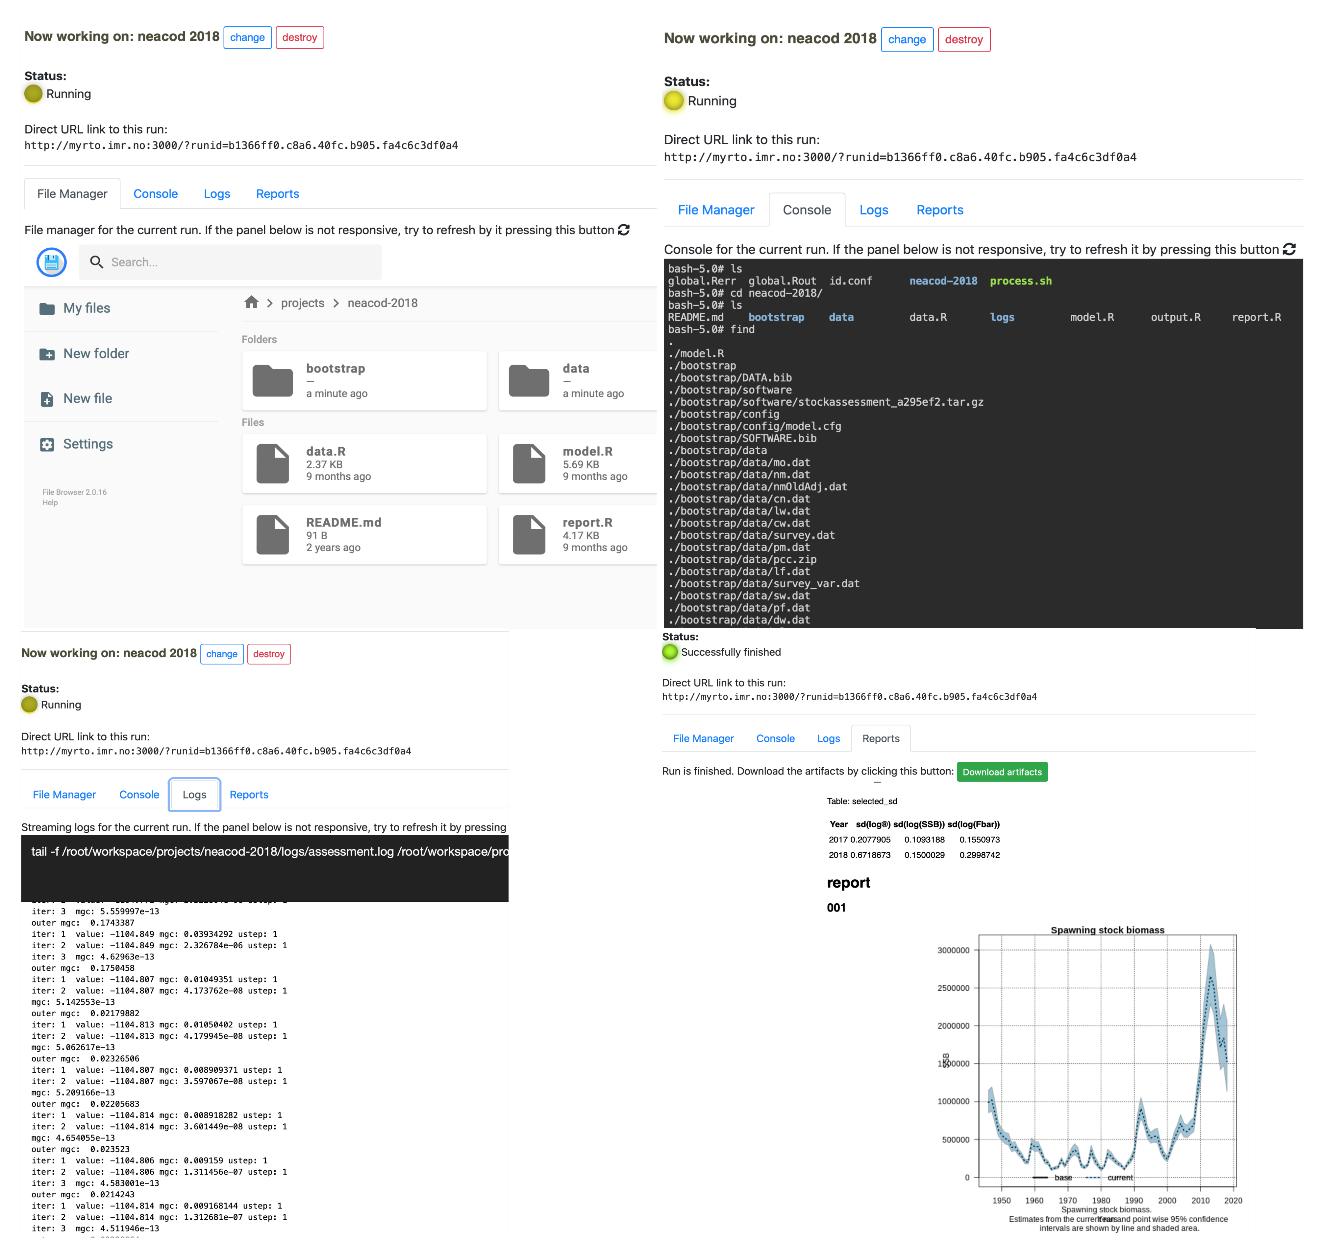
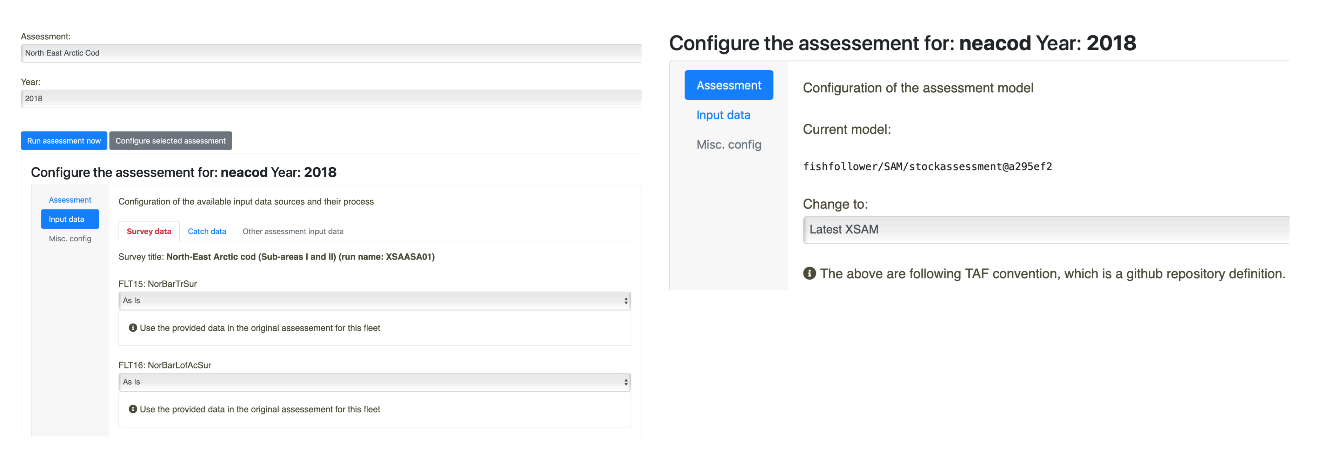
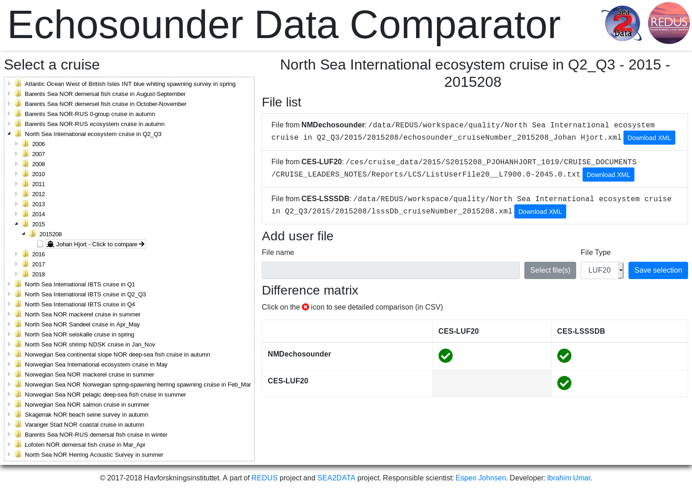
I WP2 Fiskeriuavhengige (vitenskapelige) tokt var hovedmålsetningene å undersøke toktvarians og å identifisere, kvantifisere og tilpasse systematisk prøvetakingsfeil (bias) i fisheriuavhengige toktindekser. Nærmere bestemt så evaluerte WP2 bruken av sonar som metode for å kvantifisere biomassen i vannsøylen, men konkluderte med at på det nåværende tidspunkt så vil bruk av sonar ikke tilføre signifikant informasjon om fiskebiomassen sammenlignet med det som oppnås på tokt kun basert på ekkolodd. Sonar er imidlertid verdifull i overvåkingen av fordelingen av fiskestimer, vandring og adferd. For tokt har WP2 bidratt med bedre metoder for toktdesign, spesielt metoder for zig-zag toktdesign for akustiske tokt som signifikant øker tokteffektiviteten ved å kutte ut transportetapper mellom segmentene. Videre har WP2 utviklet metoder for å simulere tokt, basert på NORWECOM modellen, som kan bli brukt for å teste toktstrategier in silico. En annen viktig leveranse har vært organisering og kvalitetskontroll av tokttidsserier gjennom implementering av StoX-programvaren på tvers av tokt og besatandsvurderinger, noe som også var medvirkende til at det virtuelle REDUS-rammeverket kunne settes opp. REDUS-rammeverket muliggjør kjøring av hele bestandsvurderingsprosessen gjennom et brukergrensesnitt og er fullt ut forenlig med ICES TAF og internasjonale databaser. Rammeverket ble utviklet for torsk og sild, men er klar til å brukes også på andre bestander. Standardisering av redskapsfunksjonalitet på tråltokt har også blitt gjennomført, noe som sikrer at HI sine vitenskapelige tråler nå tråler på en mer konsistent måte, og at trålingen testes og logges for alle vitenskapelige tokt. Metoder ble utviklet for å kombinere ekkoloddata og swept-area data til kombinerte toktestimater, med spesielt fokus på korreksjon for den akustiske dødsonen. En ny modellbasert tilnærming ble utviklet for å korrigere tokttidsserier for variabel dekning på grunn av dårlig vær, tidsbegrensning etc. Biologisk prøvetaking på tokt ble også analysert for IBTS-toktet i Nordsjøen og viste at prøvetaking av én fisk per 5-cm lengdegruppe per hal er tilstrekkelig for å oppnå god nok presisjon i alderslengde-nøkkelen. Resultatene viste at prøvetakingen kan reduseres med minst 50 % uten merkbar tap av presisjon.
For WP3 Evaluering og testing av langtidsforvaltningsstrategier var hovedmålene å identifisere og videreutvikle erstatninger for de eksisterende HI-verktøyene for evaluering av forvaltningsstrategier, PROST og HCS. Dette var spesielt med tanke på 1) å vurdere høstingsregler for bruk i taktisk forvaltning, men også 2) å lage verktøy for å støtte forskning rettet mot økosystembasert fiskeriforvaltning. Hovedresultatet var utviklingen av et fleksibel verktøy for evaluering av forvaltningsstrategier (MSE) som kan kommunisere med eksisterende «operating» modeller. En modell basert på A4A/FLR ble utviklet og brukt på Nordsjøbestander med et HI-fokus på sei. Parallelt med dette arbeidet ble MSE-verktøy utviklet for økosystembasert forvaltning gjennom arbeid i ICES-arbeidsgruppen WKIRISH og gjennom videreutvikling av moduler inkludert i Atlantis rammeverket, testet med NoBa Atlantis i Barentshavet (fokus på torsk) og Norskehavet (fokus på sild). Det ble skrevet et review om hvordan økosystemmodeller fram til dags dato har blitt brukt i MSE arbeid, dette gir en god oversikt over hvordan dette arbeidet kan videreføres, for å støtte mer bruk av økosystem-/flerbestandsmodeller i evaluering av forvaltningsstrategier.
WP 4 Kommunisering av usikkerhet, spredning av prosjektresultater og oppbygging av kompetanse bidro både som en brobygger mellom REDUS-prosjektet og de bestandsansvarlige forskerne på HI, i tillegg til å informere stakeholders og forvaltere om fremgangen i prosjektet og anmode om deres innspill og råd i styringen av prosjektet. En akseptert standard for bestandsutregning og råd: «Håndbok for akseptert standard» ble utviklet for datarike bestandsvurderinger og har blitt implementert som en påbudt prosedyre og er nå lagt inn i HIs Kvalitetsportal. En annen hovedleveranse var en bestandsmetadatabase som inneholder informasjon om alle bestandene som HI gir råd på. Databasen revideres og oppdateres med jevne mellomrom, mens bestandsrådene oppdateres kontinuerlig. Formidling fra prosjektet ble oppnådd gjennom en temasesjon på ICES sin årlige vitenskapskonferanse i 2017 (Ft. Lauderdale, USA), tre populærvitenskapelige artikler, årlige åpne møter med fiskerinæringen, og ikke minst, et åpent avslutningsseminar, et webinar, i desember 2020. Selv om REDUS har vært et internt HI-prosjekt, har samarbeid med internasjonale partnere (NOAA, DTU Aqua og ICES (TAF utviklingsteam)) vært en viktig del av prosjektet. Disse ble alle invitert til prosjektets oppstartsmøte i 2016 og ble videre invitert til å komme med innspill gjennom hele prosjektperioden. Fem NOAA-forskere hadde gjesteforskningsopphold ved HI i perioder på fra to uker til to måneder. Tilsvarende besøkte en HI-forsker NOAA i to måneder. Enda et forskningsopphold var planlagt høsten 2020, men ble kansellert pga. COVID-19 pandemien. Opplæring av HI-forskere har blitt gjennomført gjennom en rekke kurs gjennom hele prosjektperioden.
Kontinuerlig utvikling av metoder for overvåking og bestandsvurdering er et av kjerneområdene til HI, og selv om REDUS-prosjektet nå er avsluttet, vil aktiviteter fortsette i andre prosjekt og gjennom andre initiativ. Prosjektet har identifisert aktiviteter og forskningsspørsmål som vi anbefaler at blir fokus i fremtidige prosjekt. Spesielt:
Utvikle et standardisert rammeverk for simulering av fangst per alder/lengde for å teste effekten av prøvetakingsdesign og prøvetakingsinnsats
Bedre internasjonal koordinering av fangstprøvetaking
Innføre sannsynlighetsbasert prøvetaking av alle fiskeri med påbudt elektronisk fangstrapportering (ERS)
For state-spaced bestandsmodeller: modellvarianter som kommer fra datadrevne metoder bør bli utviklet for automatisk eller semi-automatisk modellseleksjon
Vektingen av datakilder i nåværende bestandsvurderingsmodeller bør bli analysert for bedre å forstå implikasjoner og muligens frembringe informerte forslag for alternative måter å vekte data på
Fortsette rutinene for tokttidsserier som har blitt etablert gjennom Sea2Data og REDUS. Det anbefales at StoX og tokttidsseriestrukturen til NMD bør tillate strukturer som gjør det lettere å kjøre romlig-temporale toktestimeringsmodeller
Lage rutiner som garanterer full gjennomsiktighet og reproduserbarhet av alle data som eksporteres til ICES (f.eks. DATRAS, ICES acoustics)
Utvide toktestimeringsmodellen i StoX til også å muliggjøre estimering av kombinerte swept-area og akustiske estimat
Evaluering av usikkerhet i akustisk kategorisering i akustiske tokt og utvikling av metoder for å beregne usikkerhet
Fortsette utviklingen av metodene som trengs for å fremskaffe det vitenskapelige grunnlaget for økosystembasert fiskeriforvaltning
Fortsette samarbeidet mellom økosystem- og flerbestandsarbeid i utviklingen av et simulert datasett fra Atlantis som kan brukes for å evaluere og sammenligne flerbestandsmodeller
Oppdatere årlig «Håndboken for akseptert standard» for bestandsvurdering samt utvide den til å omfatte datafattige bestandsvurderingsmetoder og bestandsvurderinger av skalldyr og sjøpattedyr
Implementere REDUS-rammeverket for flere bestander, samt i internasjonale bestandsvurderingsarbeidsgrupper
Inkludere muligheter for å ta med lengdedata i SAM. Vi foreslår å utvide SAM slik at lengdedata kan brukes samtidig med aldersdata. SAM kan da benyttes for bestander med lite (eller ingen) aldersdata
Summary
The REDUS project (2016-2020) has been a strategic project at the Institute of Marine Research (IMR) aimed at quantifying and reducing the uncertainty in data-rich and age-structured stock assessments (e.g., cod, herring, haddock, capelin). Work was organized in four topical work-packages: Fisheries-dependent (catch) surveys and assessment modeling (WP1), Fishery-independent (scientific) surveys (WP2), Evaluating and testing of long-term management strategies (WP3), and Communication of uncertainty, dissemination of project results and capacity building (WP4). The Norwegian Computing Center (NR) was contracted in as a strategic partner in statistical modeling and analysis, contributing mainly to WP1 and WP2, but found the research of fundamental interest therefore also allocating internal (NR) funding to develop the statistical science base of several of the methods.
For Fisheries-dependent (catch) surveys and assessment modeling (WP1) one of the main outcomes were improved stock assessment models, both by further developing and implementing the XSAM assessment model in the WGWIDE assessment of the Norwegian Spring Spawning (NSS) herring, but also as an auxiliary model for the North East Arctic (NEA) cod in the AFWG. Through collaboration with DTU Aqua, XSAM functionality has also been implemented in the SAM codebase, making it possible to utilize structures from both models. Several studies were carried out exploring the limitations of the initial conditions in stock assessment model, e.g. modelling with mean instead of mode in SAM, and inclusion of process error in catch equation in SAM. Another major outcome of WP1 was the development and implementation of probabilistic sampling of pelagic fish catches, the ‘catch sampling lottery’, which has been expanded gradually from covering the herring fishery to being the standard catch sampling for all of the pelagic fishing fleets from 2021. To estimate catch in numbers-at-age based on data from the catch sampling lottery, design-based estimators were developed and included in an R-package. Also, the model-based estimator for catch in number at age (ECA) that is used as the standard for the major demersal fisheries in Norway was further developed as an R-package (R-ECA) and implemented in StoX.
In WP2 Fishery-independent (scientific) surveys, the main objectives were to address the survey variance and to identify, quantify, and adjust for systematic sampling errors (bias) in the fishery independent survey indices. Specifically, WP2 evaluated the use of sonars as a method for quantifying the biomass in the water column, concluding that at present using sonar does not add significant information on the biomass compared to echosounder only surveys. However, sonar still has a value in monitoring fish school distribution, migration and behaviour. For surveys, WP2 provided improved survey design tools, in particular methods for zig-zag survey design for acoustic surveys that significantly improve survey efficiency by cutting out transport legs between segments. Also, WP2 developed tools for simulating surveys, based on the NORWECOM model that can be used for testing survey strategies in silico. Organizing and quality control of survey time-series through implementing the StoX software across surveys and assessments was another important delivery, and instrumental to setting up the REDUS virtual framework. The REDUS framework allows running the entire stock assessment process through one computer interface, fully compatible with ICES TAF and international databases. The framework is developed for cod and herring, but is ready to be applied to other stocks. Standardization of gear performance for trawl surveys was also carried out, ensuring that the IMR survey trawls now perform more consistently, and that their performance is tested and logged for all research surveys. Methods were also developed for combining echo-sounder data and swept-area data into combined survey estimates, in particular focusing on correcting for the acoustic dead zone. A novel model-based approach was developed to correct survey time series affected by variable survey coverage due to poor weather conditions, time limitations and more. Biological sampling during surveys was also analyzed for the IBTS survey in the North Sea showing that sampling one fish per 5-cm length group per haul is sufficient to attain sufficient precision in the age-length key, thus showing that sampling could be reduced by at least 50% without appreciable loss in precision.
For WP3 Evaluating and testing of long-term management strategies the main aims were to identify and develop replacements for the existing IMR Management Strategy Evaluation (MSE) tools (PROST and HCS), specifically to 1) evaluate HCRs for use in tactical management, but also 2) provide tools to support research into Ecosystem-Based Fisheries Management (EBFM). The key outcome was the development of a flexible MSE tool that can communicate with existing operating models. A model based on A4A/FLR was developed and applied for North Sea stocks with IMR focus on saithe. In parallel, MSE tools were developed for ecosystem-based management through work in the ICES WKIRISH, and through further development of modules included in the Atlantis framework, tested with NoBa Atlantis in the Barents Sea (focus on cod) and the Norwegian Sea (focus on herring). A review was written on how ecosystem models until present have been used in MSE work. The review gives a good overview over how this work can be continued, to support an extended use of ecosystem and multispecies models when evaluating management strategies.
WP 4 Communication of uncertainty, dissemination of project results and capacity building served both as a bridge between the REDUS project and all IMR stock assessment scientists, as well as informing stakeholders and managers about the progress in the project and solicit their input and advice for steering the project. A Best Practice Guide for Stock Assessment was developed for data-rich stock assessments and has been implemented as a mandatory procedure, embedded in the IMR Quality Control System. Another major delivery was a stock assessment meta-database containing information on each stock that IMR gives advice on. The database is revised and updated on a yearly basis, while links to the most recent stock advice are updated continuously. Project outreach was achieved through a theme session at the ICES Annual Science Conference in 2017 (Ft. Lauderdale, USA), three op-ed articles, yearly public meetings with the fishing industry, and a final open webinar in December 2020. Although an internal project, REDUS identified key international partners: NOAA, DTU Aqua and ICES (TAF development team) who were invited to the project kick-off meeting in 2016, as well as giving input throughout the project period. Visiting scientist were invited, and five NOAA scientists visited the IMR as guest scientists for periods lasting from two weeks to two months. Reciprocally, one IMR scientist visited NOAA for a two-month period, and one more was planned in the fall of 2020, but was cancelled due to the COVID-19 pandemic. Training of IMR scientists has been carried out through several courses throughout the project period.
Continued development of the methods for monitoring and stock assessment is at the core of IMR activities, and although the REDUS project has come to an end, activities will continue in other projects and initiatives. There are also activities and research questions that have been identified that we recommend become the focus of future projects and initiatives. In particular:
Develop standardized framework for simulating catch at age/length to test effect of sampling design and sampling effort
Improved international coordination of catch sampling programs
Implement probabilistic sampling for all fisheries with mandatory electronic catch reporting (ERS)
For state-spaced assessment models: the model variants that result from data driven methods should be developed for automatic or semi-automatic model selection
Data source weighting schemes in current stock assessment models should be analyzed to better understand their implications and possibly provide informed proposals for alternative data weighting approaches
Continue the survey time series routines established in Sea2Data and REDUS, and it is recommended that StoX and the survey time series structure at NMD should enable structures that facilitates the running of spatio-temporal survey estimation models
Make routines to ensure a full transparency and reproducibility of all data exported to ICES (e.g. DATRAS, ICES acoustic)
Expand the survey estimation models in StoX to enable the estimation of combined swept-area and acoustic estimates
Evaluation of uncertainty in acoustic categorization in acoustic surveys and development of methods to estimate the uncertainty.
Continue to develop the tools that will be required to provide the scientific underpinning for Ecosystem-Based Fisheries management
Continue the collaboration between ecosystem and multispecies work for the development of a simulated data set from Atlantis which can be used for evaluating and comparing multispecies models
Annually update the Best Practice Guide for stock assessment and expand it to encompass data-limited assessments, and assessments of shellfish and marine mammals
Implement the REDUS framework for more stocks, and in international assessment working groups.
Include possibilities to include length data in SAM. We suggest to expand SAM such that length data can be used simultaneously as using age data. SAM can then be used for stocks with no (or little) age data.
1 - Background and aims of REDUS
Reliable assessments of fish stock are a fundamental pillar of sustainable fisheries management and hence instrumental in achieving the aims of the UN Sustainable Development Goal (SDG) 14 “Life below water”. Stock assessments consist of many steps and data inputs, all of which have uncertainties associated with them. Each of these uncertainties will on their own and in conjunction with the others affect the overall uncertainty of the estimated and projected stock size, and hence the uncertainty surrounding the catch and management advice. To address these fundamental scientific challenges, develop better tools and methods along the whole assessment value-chain, and to increase the skills and competency of its own staff the Institute of Marine Research (IMR) initiated the five-year (2016-2020) strategic research project “Reduced Uncertainty in Stock Assessment” (REDUS) aimed at quantifying and reducing the uncertainty at each step in the stock assessment process. Improving quantitative skills and methods for both sampling, modelling and analysis were at the core, together with contributing to the seamless data-pathways spearheaded by the Sea-to-Data project with which REDUS worked very closely.
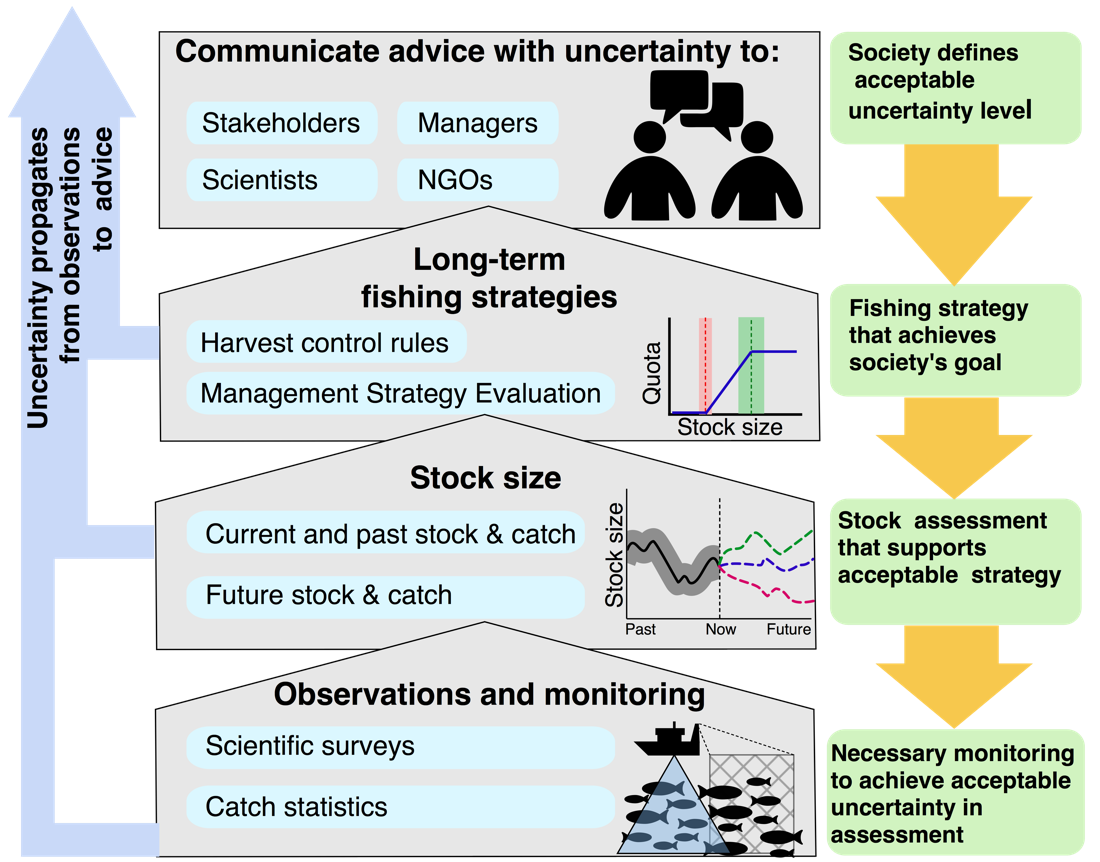
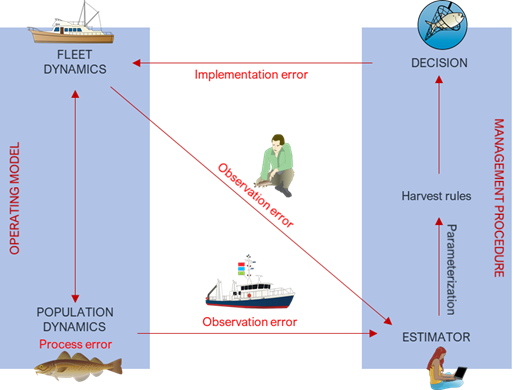
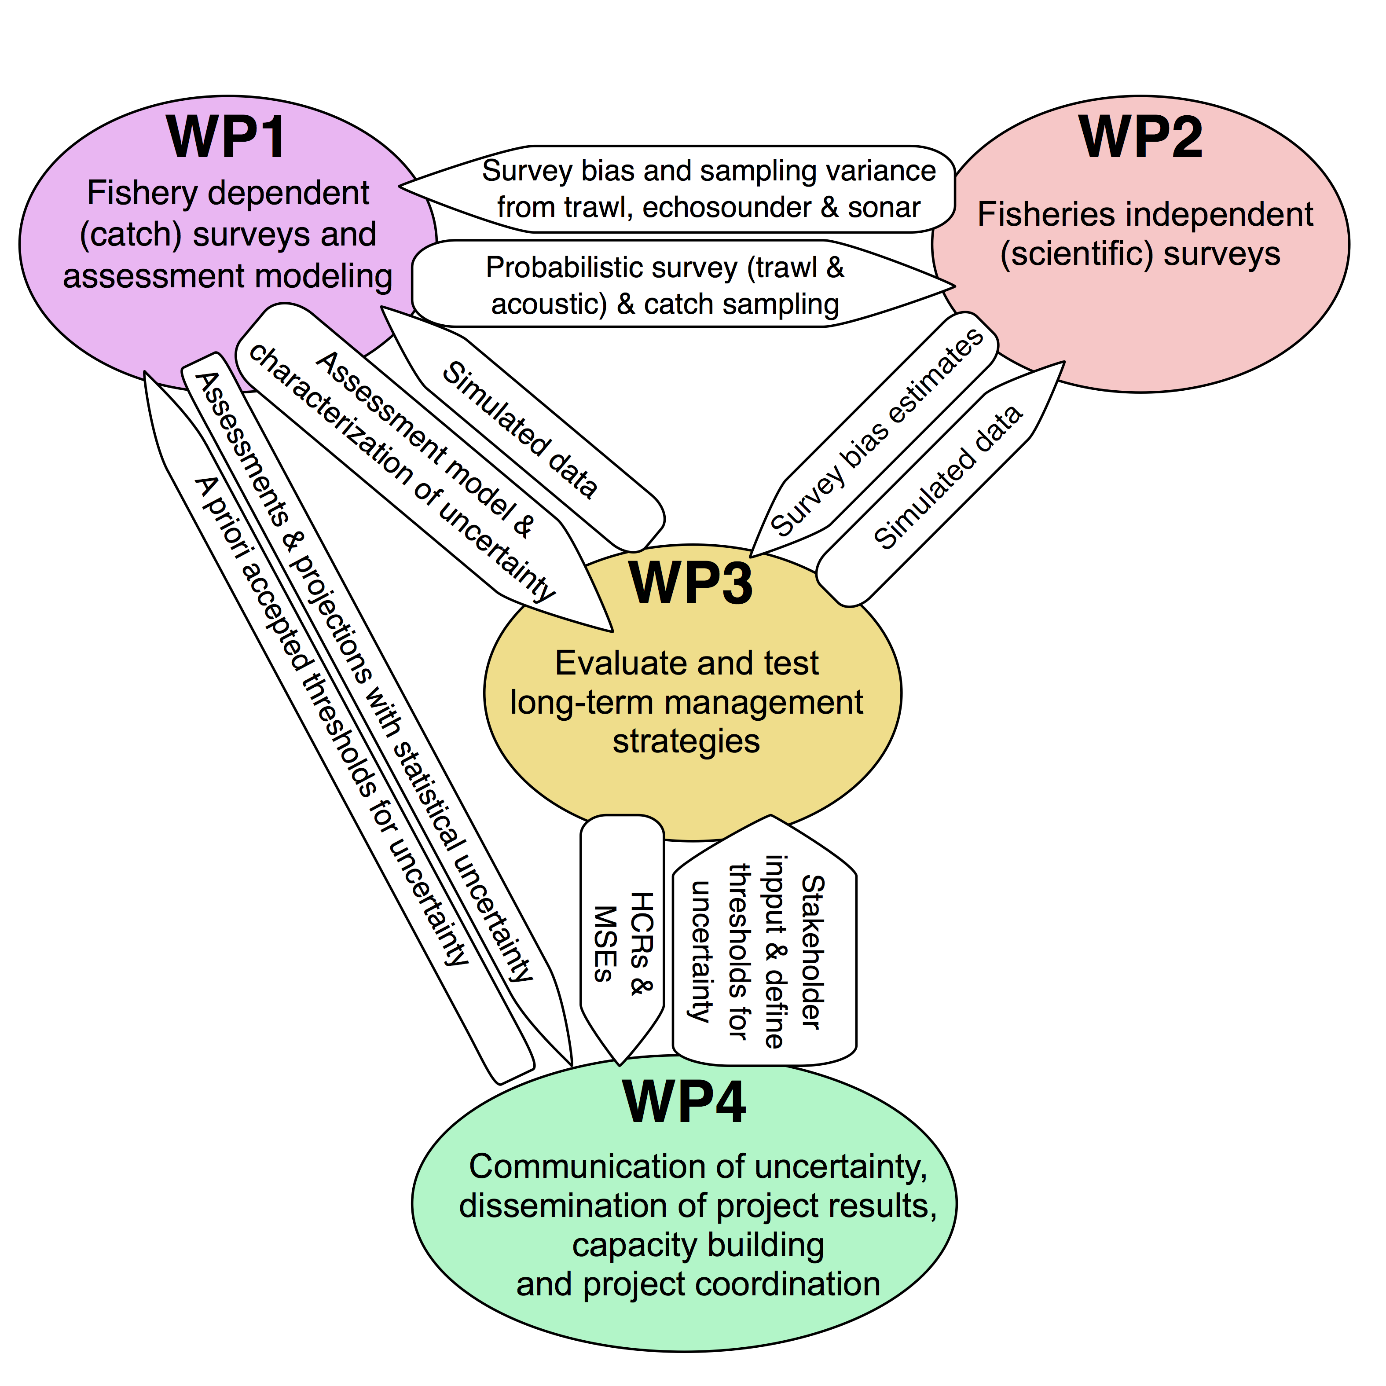
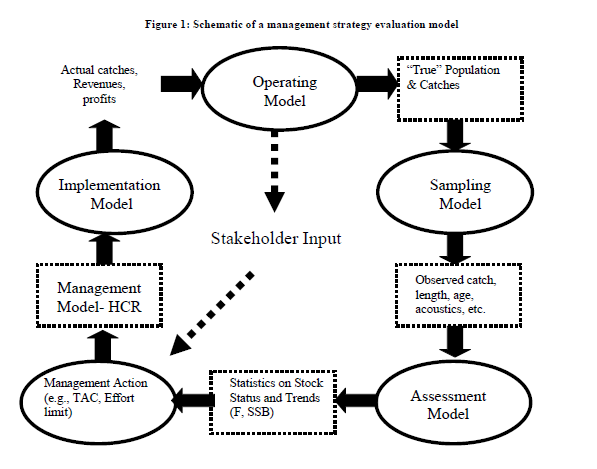
The overall aim of REDUS has been: Achieving reduced uncertainty in stock assessment and advice for our most important fish stocks. The objectives of REDUS were further specified to: Develop and implement the ability to quantify and communicate the trade-offs and risks caused by varying levels of uncertainty of stock assessment and management advice from: i) observations, ii) stock assessment modeling, iii) management strategy evaluation (including harvest control rules), and iv) real-world implementation in practical fisheries management, and are illustrated as a conceptual model in Figure 1.
By quantifying uncertainty at each step in the assessment process, as well as the cumulative uncertainty, one can identify the greatest source of the overall uncertainty and focus research and development efforts where the gain is highest (reducing uncertainty the most). Conversely, by providing an uncertainty estimate with the final advice managers and decision-makers can set acceptable levels for uncertainty, that scientists can use to design and develop management strategies, harvest control rules, assessment methods, and ultimately monitoring schemes necessary to achieve the acceptable uncertainty levels. This can further be used to identify the resources needed (personnel, survey time etc.) to achieve this, which can be fed back to managers as the realistic cost of reducing uncertainties. Overall, this will create a greater transparency in the whole analytical assessment process, clarifying expectations from the recipients of advice as well as clarifying what the recipients can expect from the scientific advice.
Although uncertainties are an inherent part of all fisheries stock assessments, the focus of the REDUS project has been data-rich and age-structured stock assessments, typically those carried out for the largest stocks representing the highest value for Norwegian fisheries. The North East Arctic (NEA) cod and Norwegian Spring Spawning (NSS) herring were chosen as target species for development of the REDUS tools and methods, but with the clear ambition that the tools and methods should be directly applicable to all analytical fisheries stock assessments that IMR carries out.
Figure 2.1: REDUS project objectives. Conceptual model of uncertainties at the different steps in a fisheries stock assessment process, which shows how uncertainties propagate (left blue arrow) and how management according to uncertainty can be used to identify the fishing strategies, stock assessment methods, and monitoring necessary to achieve the acceptable uncertainty level.
1.1 - Project structure
The REDUS project was led by Erik Olsen, reporting continuously and directly to the “Marine Processes” research program at the IMR. A steering group consisting of research director Geir Huse, heads of research Frode Vikebø, Arill Slotte and Rolf Korneliussen from the IMR, and a fisheries industry representative from “Fiskebåtredernes forbund” (2016-2018: Dankert Skagen, 2018-2020: Gjert Dingsør) had yearly meetings to evaluate the progress and advice on project development.
To achieve the aim and objectives the REDUS project was organized in four work-packages (WP) each co-led by two senior scientists:
WP1Fisheries-dependent (catch) surveys and assessment modeling. Co-chairs: Jon Helge Vølstad and Knut Korsbrekke
WP2Fishery-independent (scientific) surveys. Co-chairs: Nils Olav Handegard and Espen Johnsen
WP3Evaluating and testing of long-term management strategies. Co-chairs: Daniel Howell and Cecilie Hansen
WP4Communication of uncertainty, dissemination of project results and capacity building. Co-chairs: Erik Olsen and Guldborg Søvik
Separate tasks, milestones and deliverables were developed for each of the WPs (see the REDUS Science Plan, Appendix 2). There were strong interlinkages between the WPs requiring continuous collaboration and coordination (see Appendix 2, Figure 12.1: REDUS project structure).
1.2 - Collaborators
Development of stock assessment methods is based on collaboration between scientists from different institutions and countries. Therefore, several international partners were invited to take part in various stages of the project. Also, to strengthen the capacity for statistical modeling expertise the Norwegian Computing Center (NR) was hired to collaborate on the science and development of methods and advice.
2 - WP1 Fisheries-dependent (catch) surveys and assessment modeling
2.1 - Aims
Analytical stock assessments in ICES are based on data from fisheries-independent as well as fisheries-dependent sampling surveys, with inherent uncertainty due to sampling errors and various sources of bias. Historically, yearly point estimates of abundance-indices and catch in numbers by age-class have been used as input-data to VPA type of models. The uncertainty in estimated catch at age has generally been ignored and errors in input data have been assigned solely to abundance indices in various methods for tuning the VPA (e.g., Shepherd 1999). Gudmundsson (1994), Quinn and Deriso (1999), Aanes et al. (2007), Gudmundsson and Gunnlaugsson (2012), and Nielsen and Berg (2014) (and references therein) provide alternative statistical assessment models that can provide measures of uncertainty in estimated stock-parameters. Building on these models, the REDUS project has developed stock assessment methods that actively use estimates of precision in input data on catch at age and survey indices at age. The aim is more efficient use of data and improved estimates of uncertainty in stock parameters. These approaches are being developed in collaboration with the Norwegian Computing Center and are implemented in the XSAM framework (Aanes 2016a) that currently is in use for stock assessment of Norwegian spring spawning herring (ICES 2020). In XSAM it is also possible to include external observation covariance structures, and this feature has recently been included in the official version of SAM. To account for spatial variability in demographic rates and population variables Thorson (2015) has developed a delay difference model that helps explain large portions of parameter variance and hence reduce model uncertainty. In collaboration with the Norwegian Computing Center, we have focused on the further development and parameterization of statistical assessment models that can integrate data with varying accuracy (bias and precision) from multiple sources.
Time series derived from combining biological sampling from commercial fisheries with official surveys and scientific abundance surveys are critical to stock assessments and quota advice. Such long-term monitoring is costly, and it is therefore crucial to employ cost-effective survey designs and efficient estimators to minimize errors. In WP1 we aimed to develop analysis tools for catch sampling surveys and to develop survey designs that minimize bias and improve precision for a given survey effort. In collaboration with the Norwegian Computing Center the aim was to implement the ECA (“Estimating Catch at Age”) (Hirst et al. 2012) model as an R-package (R-ECA) that runs within StoX for analysis of catch sampling data from commercial fisheries. The aim was also to expand the R-ECA library to also include design-based estimators (Lumley 2010) that would support the estimation of catch-at-age and catch-at-length for the four design classes of catch sampling programs described in the ICES Expert Group on Practical Implementation of Statistically Sound Catch Sampling Programs (WKPICS) (ICES 2014).
We also aimed to develop cost-effective probabilistic survey designs for biological catch sampling. These survey designs based on statistical survey sampling theory were developed with the aid from simulation studies, and then tested through pilot studies in one or more case studies. This is one key component of the process to optimize future catch sampling and reduce uncertainty in stock assessments, and a direct link to WP2.
One case study to improve accuracy of catch-at-age estimates was to develop and test probabilistic at-sea catch sampling for the Norwegian Spring Spawning (NSS) herring. The aim was to develop cost-effective catch sampling that minimize or eliminate coverage errors and reduce sampling errors in estimates of catch-at-age. This study was developed in close collaboration with the Directorate of Fisheries, the Norwegian Fishermen’s Sales Organization for Pelagic Fish (Norges Sildesalgslag), and the pelagic fishing industry in Norway.
2.2 - Tasks and milestones
2.2.1 - Tasks
T1.1 Further development and full implementation of a stock assessment model that uses the covariance-matrix in input files from fisheries-independent and fisheries-dependent surveys.
T1.2 Full implementation of R-ECA with all survey design modules
T1.3 Establish and implement probability-based survey design for estimating catch-at-age
T1.4 Establish methods to handle data-gaps due to poor sampling spatial coverage (e.g., no access to Russian EEZ) (This task was completed in WP2)
2.2.2 - Milestones
M1.1 2017. Next generation statistical assessment model(s) (XSAM), and framework for quantifying the propagation of errors from input data to stock assessment outputs. Accepted as standard assessment model for herring in WGWIDE, following 2016 Benchmark evaluation.
M1.2 2017. Developed probabilistic survey design for catch sampling (NSS herring) and tested the design in pilot survey.
M1.3 2018. Design-based estimators in R-ECA.
M1.4 2019. User-friendly version of R-ECA implemented in the StoX framework.
M1.5 2018. Catch sampling for NSS herring test implementation
M1.6 2019. Catch sampling expanded to include blue whiting (from 1 Jan 2019), sprat, Norway pout and mackerel (from 1 Jan 2020), and capelin, sandeels, and argentines (from 1 Jan 2021).
M1.7 2020. Successful test data-call for ICES RDBES.
2.3 - Deliverables
Develop and implement next generation statistical assessment models that can account for uncertainty in input data from fisheries-dependent and fisheries-independent surveys ( D1.1)
State space models (SSMs) generally include a model for the hidden states, a process model, and observation models that link noisy observational data to the process. This class of models have become accepted as the most appropriate for fish stock assessments, as they provide a consistent and transparent approach to linking a population model for the fish stock and a data model that links observations, such as catch data and survey indices, to unobserved quantities in the population model. Several variants of this model structure exist in the literature. The quality (including levels of uncertainty) of results obtained from SSMs, however, is dependent on process and process error descriptions. The process error description also includes the description of errors associated with data (e.g., catch in number at age, and fisheries-independent survey indices of abundances at age). WP1 has delivered on two major areas: (i) a novel approach to including dynamical process models in SSM frameworks, and (ii) improved methodology in modeling process and observation errors in the state-of-the art software in stock assessment.
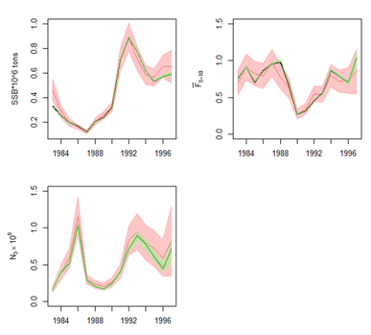
Figure 3.1: Example stock assessment outputs (spawning stock biomass, instantaneous fishing mortality F, and number of fish from XSAM with confidence bands that reflect uncertainty in input data from fisheries-independent and fisheries-dependent surveys.
Reducing uncertainty through improved dynamic process models in SSM framework-the XSAM modeling framework
In the classical work by Gudmundsson (1994), flexibility in process description was afforded by allowing e.g. fishing mortality to be modeled as a structural time-series model, that allows selectivity and effort in a separable model to change over time. The time-series models were represented by random walks. In WP1 the following was implemented:
Random walk models were replaced with autoregressive models, which allowed for more flexibility e.g., allowing simplifications such that the model for fishing mortality can be modelled as a separable model, a separable model with noise, or a separable model with noise where the effort is modelled as a time-series model.
The observation models are defined to reflect well-established theory and functional relationships that link observations to the processes, but also include flexible formulations of observation error to allow for realistic error structures as well as allowing utilizing prior information about sampling errors. Usually, within this class of models, observation models include simplified (parameterized) representations of the observation errors, that are built on the assumption that the errors are independent and identically distributed (iid) for each input dataset. This assumption ignores the fact that most observation data are underpinned by multivariate processes that result in data correlations e.g., between age groups of population indices.
The improved modeling framework is documented in Aanes (2016a, b and c) and has been implemented on an open-access modeling platform (TMB), as the XSAM model. More recently, many features from the XSAM framework have been implemented into the SAM model implemented in R using the R-library Template Model Builder (TMB, Kristensen et al. 2016).
The efficacy of the XSAM modeling framework has been evaluated by application to e.g., assessment of the NSS herring. Results obtained show that utilization of prior knowledge about sampling errors lead to reduction in uncertainty, and improved inference (ICES 2016a, ICES 2016b) , and the model was adopted as the assessment model used for providing management advice (ICES 2016b, ICES 2020). It has also formed the basis for estimating reference points (ICES 2018a) and management strategy evaluation (ICES 2018b) for this stock.
Improving methodology in the state-of-the-art stock assessment modeling framework- The SAM model
Using a generic approach to state-space models for stock assessment, we suggested two modifications to improve accuracy in results obtained from the stock assessment model SAM and similar models. The first suggestion is to interpret the ``process error'' in these models as stochastic variation in natural mortality, and therefore include it in the data model. The second suggestion is to consider the observed catch as unbiased estimates of the true catch and modify the observation error accordingly. We have demonstrated the efficacy of these modifications using empirical data from 14 different fish stocks. Our results indicate that the modifications lead to improved fit to data and prediction performance, as well as reduced prediction bias (Aldrin et al. 2019, Aldrin et al. 2020).
R-ECA in StoX framework (D1.2)
Through REDUS, the Norwegian computing center has developed a new version of the Bayesian software-framework for catch at age estimation, ECA. The new version has been generalized for adaptability and has been packaged as an R-package (Reca). An interface for this R-package has been developed in StoX through the Sea2Data project, and REDUS has been working with operationalizing this solution: educating users, gathering requirements for further development and controlling quality of implementations.
Internationalization (D1.2)
Complete descriptions of estimation uncertainty require careful collaboration with international partners sampling the same stocks. Operational use of uncertainty descriptions also requires reporting through both IMR systems and ICES systems. The activity in REDUS that relates to fisheries-dependent data have therefore also spent significant effort in contributing to the development of estimation support systems in ICES, in particular the ongoing development of the RDBES (Regional Database and Estimation System). In addition to participating in the development of harmonized data models, testing of key estimation strategies with ICES solutions has been carried out. That includes using the Reca package with RDBES data models and using pilot data from the catch-lottery with RDBES data models and with design-based estimators. This activity was not planned initially but integrated in order to secure long term return of the investments in estimation software. In 2020 a milestone in the RDBES development was reached as the first test data-call was issued for selected stocks. Successful data submissions include data from the Norwegian catch-lottery sampling.
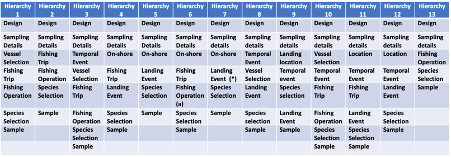
Figure 3.2: Survey design specifications for multi-stage catch sampling for the ICES Regional Database and Estimation system (RDBES). The catch sampling lottery is specified in hierarchy 13, with catch operation (haul) as primary sampling unit (PSU).
Design based estimation (D1.2)
At the outset of the project, it was planned to extend the R-ECA package to contain modules for design-based estimation, in addition to the Bayesian estimation framework. Consideration of software maintainability motivated a reevaluation of this plan, and a separate package for design-based estimation was specified. This package is specifically tailored to multi-stage sampling designs and is well suited for the probabilistic surveys (catch lottery), as well as other sampling designs supported by the RDBES. Development of this package has not been finalized, but key features necessary for design-based estimation has been well tested and documented and are available for advanced users. It has not yet been integrated into the StoX framework.
ECA_TMB model development (D1.2)
A new version of ECA ̶ mimicking the original one ̶ was developed and coded in template model builder. This model development was initiated due to the inability of the original ECA to estimate catch numbers (at age or length) for species where age information (in the commercial catch data) was scarce or non-existent. The newly developed model, the ECA_TMB, fills in the gap and enables estimation of catch number-at-age or length even when age data is rare or absent. Additionally, ECA_TMB has auxiliary features that facilitate model validation and checking. Initial model testing revealed similar estimates of catch number-at-age between ECA_TMB and the original ECA model based on the example of haddock in 2018.
An R-package for simulating fisheries based on the R-ECA model (D1.2)
In collaboration with the Norwegian Computing Center, we developed a framework (written in R) to simulate a whole fishery (i.e., fish given by their age, length, and weight for each haul within each boat, season, region and gear), based on data input to R-ECA (i.e., sales notes and biological sampling data retrieved from a variety of catch sampling process) and output from the fitted R-ECA. This framework will enable testing various catch sampling strategies and design-and-model-based estimates of catch-at-age (ECA) and the associated bias and precision.
Develop a probabilistic biological catch sampling survey for the Norwegian herring fishery (D3.1)
During the REDUS project a new catch sampling regime for pelagic fisheries was developed, based on probabilistic sampling and the use of the electronic logbook system for sample acquisition. The system was first implemented for the herring fishery (from 1 January 2018), and has gradually been extended. From 1 January the following fisheries will be sampled using the new system “the catch sampling lottery”: herring, blue whiting, sprat, mackerel, horse mackerel, Norway pout, capelin, sandeel and argentine.
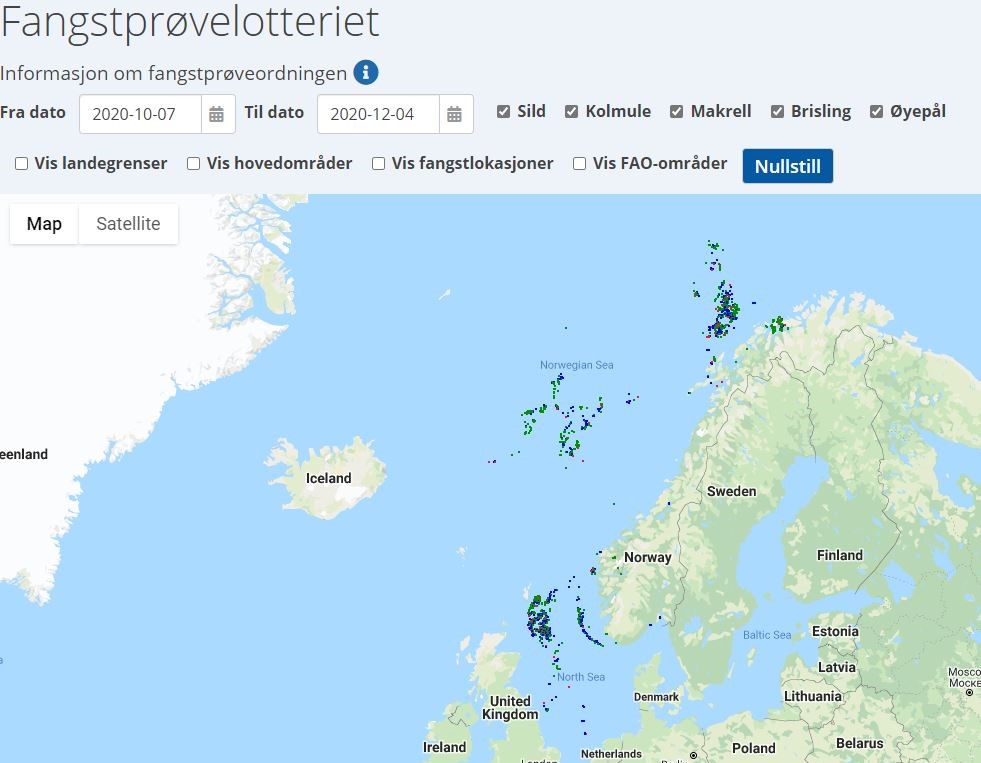
Figure 3.3: Pelagic fisheries catch operations and locations of samples selected in the catch sampling lottery. Red dots indicate catches where samples were taken (lottery = yes), and green dots indicate catch operations that were entered into the lottery, but not selected (lottery = no).
The main reason for making the catch sample lottery was to get a sounder sampling regime for herring from a statistical point of view. This is achieved by letting all catch operations go into a “lottery”, where it is randomly selected whether we want the fisher to take a sample (~15 kg frozen herring) from that haul or not. Secondly, by sampling at sea and not at delivery port will give a better quality of the sampled fish.
In Norway, the logbook messages (ERS) from the vessel first goes to the logbook provider company, which routes it to the Directorate of Fisheries (FDIR). Acknowledgement messages go the same way back to the vessel. The logbook software has now been modified such that three new types of messages have been introduced, and for these IMR and not FDIR is the destination. This means that IMR can reply immediately on these messages and “order” a sample to be taken from the catch. The three new message types are unofficial, such that the vessel does not risk being sanctioned if they report any wrong details about the catch. Until now it has also been voluntary for the fishing fleet to participate in the catch sampling lottery and take samples from the catch. Around 200 vessels above 15 m length are obliged to use ERS and participate in either of the fisheries mentioned above. The three new message types have different purposes and together they will provide the basis for the sampling: 1) A message (HIA) is sent when the vessel departures for a new trip. This message states the target species, and if the target species coincides with one of the lottery-species the vessel is asked to participate in the lottery for this species for this trip; 2) for each haul, the vessel immediately sends a message (HIF) stating the catch composition. The catch in kg of the target species is input in an automatic computer-draw, which replies to the vessel’s logbook, and either order a sample from this haul or not; 3) when the vessel is about to land their catch to a landing facility, they also send a message (HIL) to IMR which states where the actual sample can be found and later transported to IMR for analysis.
The lottery at IMR is implemented in a short software-script written in R, and runs on an R-apache server (http://rapache.net/). IMR receives all messages from the ERS traffic from FDIR, and each message (and reply) related to a single catch operation reported through ERS is routed to the R-script by SSH commands. Each time an ERS message (of any kind) comes in it is sent to the R-script which starts and runs automatically in batch-mode. Answer, if necessary, are sent back to FDIR, and further on within a few seconds. The lottery has the following input parameters:
Estimated total catch for the actual species this year. We have used the Norwegian quota as a proxy for total annual landing. So, if the landing exceeds the quota, we will select more samples than intended, and vice versa if the annual catch is less than the quota.
The drawing is like tossing a coin but where the possibility of head or tail is not 50/50. We use the “sample” function in base R (https://www.rdocumentation.org/packages/base/versions/3.6.0/topics/sample) for this, which give a YES answer with probability = inclusion.prob , and a NO answer = 1 – inclusion.prob .
This probability is used in the drawing, and this is further used in the estimation procedure following a classical Hurwiz-Hansen estimator.
Based on these three parameters we calculate the inclusion probability and selection probability for all hauls being selected for sampling
Catch in kg of the actual haul, as estimated by the captain at the time of catch (from the HIF). This is the only parameter that is varying from catch to catch
Number of samples we want for this species this year. The sample size is constrained by the capacity to analyse the samples in the laboratory. We set the sample sizes based on the number of samples that were analysed for age the last years for this species and add some extra samples to compensate for non-response due to loss of samples or lack of participation by the fishermen.
The probability of selecting a catch sample for each fishing operation in the fishery is set to be proportional to its fraction of the predicted annual landing (using annul quota as a proxy). In this lottery system it does not matter much if the total catch is taken by few large, or many small hauls – the number of samples ordered will be stable (if total catch = quota). At IMR we have built a database-system around the lottery, in order to keep track of what samples we have ordered, the status of the samples, and to integrate the sampling with our other data systems for biological data. A design-based estimator of catch at age for the catch sampling lottery is implemented.
3 - WP2 Fishery-independent (scientific) surveys
3.1 - Aims
The overall goal of WP 2 was to address the survey variance and to identify, quantify, and adjust for systematic sampling errors (bias) in the fishery independent survey indices. The importance and magnitude of the various sources of error differed between swept-area and acoustic-trawl surveys, and may also differ by species, fish size, and in time and space. The aim was to also build a general simulation framework and data and estimation processing pipeline (REDUS framework) and to assess the effects of the various sources of errors on the stock assessment result.
The first step is to use the StoX software and add error structures to the data to simulate the different sources of uncertainty. The data simulation will form the basis for data analysis and in situ experiments. The aim is to utilize the simulation as a basis for new available observation methodologies to identify and correct for bias in the assessment results. To test the framework, we will use the NEA cod and NSS herring case studies.
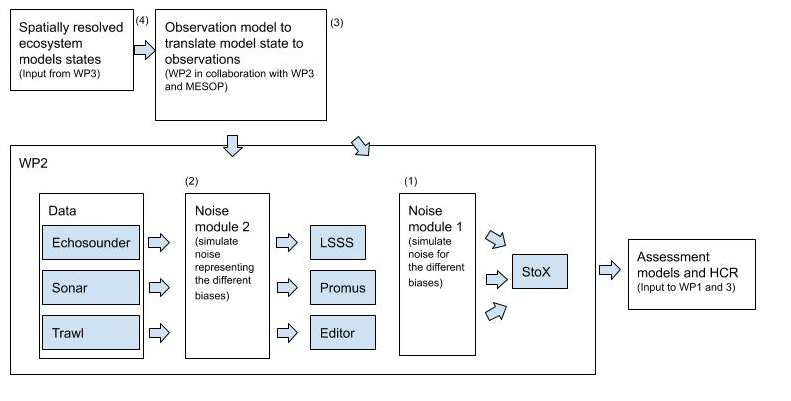
A final step will be to develop an observation model that is linked to the spatially resolved ecosystem models Atlantis, NORWECOM or others. This will enable us to simulate data from models that can be used as operating models, and further enable us to test how the error structures in survey estimates affect long term management.
3.2 - Tasks and milestones
T2.1-2 Organizing survey time series and the link to the REDUS framework
Understanding biases in fisheries independent surveys are key for understanding impact on the assessment. To efficiently do this, this task developed the REDUS framework to be able to re-run survey time series and test different biases on the survey estimate, and to pipe this further into the assessment models. The processing pipeline depends on the survey time series available at the data center and uses these as the baseline for the bias investigations (see the REDUS framework chapter for details).
The Sea2Ddata project has established infrastructure to keep versions of data and processing steps for survey time series, and the task in REDUS associated with this effort has been to facilitate implementation of these methods on a range of survey time series.
T2.3 Build an observation model to translate model states from spatially resolved ecosystem models to acoustic and trawl station observations.
In order to simulate observations, this task used an existing ecosystem model to simulate spatially explicit distributions of NSS herring and mackerel. This included a module to translate model domain into simulated observations.
T2.4 Conduct in situ experiments associated to the NSS herring surveys and use sonar data to assess vertical distribution and the effect on sampling variance of the increased sampling volume, including validation of the methodology using, e.g., AUVs with vertically aligned echo sounders that covers the overlap between the zones.
A field data campaign was set up to collect data from herring in the Norwegian Sea. Several instruments were used to estimate the vertical distribution of herring, and, among other questions, whether sonar could be used to assess the vertical distribution of herring.
T2.5 Automatically allocate acoustic backscatter to species and use that to test the consistency and potential bias caused by variable allocations.
This task uses different acoustic “interpretation” masks and run them through the REDUS framework. The consistency of the survey time series is monitored and used as a quality check. The spawning survey on NSS herring and the Sand eel surveys were used as test cases.
T2.6 Develop and implement alternative probabilistic methods for selecting trawl stations in acoustic surveys e.g. for trawling “on registration”.
This task was planned, but since there was a reluctance to change routines in important surveys to avoid breaking the time series, we did not pursue this task any further, but rather focused on survey designs, c.f. task 2.8.
T2.7 Develop methods to combine echo sounder data and swept-area data into combined survey estimates.
The bottom trawl catches fish above the head line, and the amount of fish being herded down to the trawl varies. This task analyzed the acoustic data from the Barents Sea and combined it with the bottom trawl estimate for the winter survey.
T2.8 Further development of estimators for transect based surveys
Acoustic surveys are typically run as parallel transects, where each transect is treated as an independent random sample. Equidistant parallel tracks typically result in a lower variance than true random transects. However, the parallel track requires do not utilize the ship time spent between tracks. A zig-zag survey design will make better use of ship time, but the random transect assumption is violated. The task is to develop a method that can reliably estimate the variance when the tracks are connected in each end.
Ideally a survey is planned, a strata system is set up, and the survey is conducted according to the plan. However, there are several cases where the survey coverage may be hampered. This may be due to bad weather, permits, instrument failures, or other effects. The task was to develop and test models to fill lacking coverage.
On board sampling is an important part of any fishery independent survey and demands a structured design and data recording system to produce unbiased ages separated abundance indices. The task was to evaluate the age–length keys (ALK) used to obtain the age distribution in the North Sea International Bottom Trawl Surveys (IBTS) and test for different sets of subsampling strategies of otoliths collection.
3.3 - Deliverables
3.3.1 - Organizing survey time series and the link to the REDUS framework
Organizing data and data processing steps for survey estimation is important to assure quality, improve efficiency, and ensure transparency of data and analyses. REDUS has contributed to this by reviewing and revising the data structure for data on our internal servers as well as adapting software and data storage systems.
3.3.1.1 - Data organization & folder structure
REDUS has contributed to the organization of data at IMR by reviewing and auditing the current data structures, particularly focusing on acoustic data. Software has been developed to quality assure the current data storage, and a proposal for a revised structure has been developed. This is essential for automating data processing and for using the REDUS framework. The work has contributed to an updated procedure on data organization (https://kvalitet.hi.no/docs/pub/dok05903.htm). The responsibility for continuing this task has been adopted by the instrument section for running data and a new project has been set up to continue this work for historical data.
3.3.1.2 - STS + StoX
Survey estimates are generated through the StoX software (Johnsen et al. 2019) and the StoX description files and input data are stored at the Norwegian Marine Data center. A pipeline of data processing from data collection to data publication developed through the Sea2Data project has been used for several survey time series. For the cases where we have full support at the NMD data systems, we have published the data online at the Norwegian Marine Data Centre, e.g. (https://www.nmdc.no/). Some survey estimates are not yet published online since the input data lack versioning, but the survey estimates are developed and will be published as soon as this is in place at our data center.
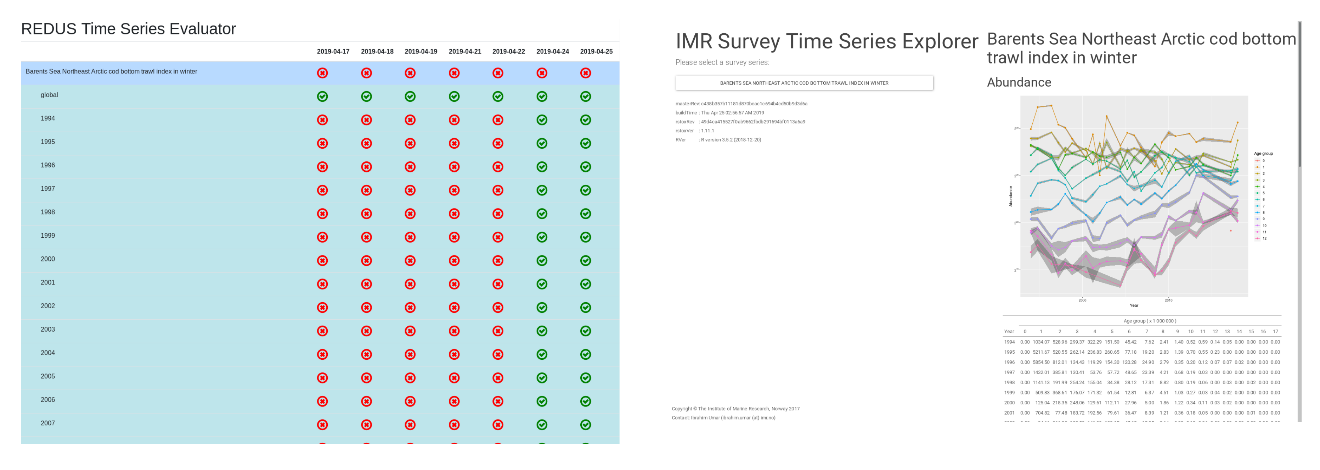
The stock overview table 4.1 gives an overview of the stocks that IMR provide advice. This task has developed a list of survey estimates that are linked to the stock list, and the list will be used and prioritized and used for working up further series using the approach used in REDUS.
Table 4.1: The list of stocks that are published online (https://www.nmdc.no/) or awaits versioning of echo sounder data.
Survey time series name
Years
Barents Sea Northeast Arctic haddock bottom trawl index in winter
1994-2019
Barents Sea Northeast Arctic cod bottom trawl index in winter
1994-2019
Barents Sea Northeast Arctic haddock bottom trawl index in autumn
2004-2017
Barents Sea Northeast Arctic cod bottom trawl index in autumn
2004-2017
North Sea Skagerrak Northern Shrimp Bottom Trawl Index
1984-2019
Barents Sea Northeast Arctic cod acoustic index in winter*
2018
Barents Sea Northeast Arctic haddock acoustic index in winter*
2018
* Awaits versioning of echo sounder data
StoX has included several new functionalities to accommodate for the survey estimation methods used for the REDUS target species. This implementation enables all survey time series of cod and haddock to be estimated in the newest version of StoX, however, there is also a future need to implement the work presented in T4.3.5 to compensate for variable survey coverage. When this implementation is in place it should also be possible to include other estimation models using e.g. GAM or GLM models.
3.3.2 - Simulated survey data
Simulated data can be used to test different survey strategies. Working with real data is more realistic than simulated data, but the cost prevents us for testing different strategies. Testing a specific hypothesis is also not possible in retrospect if it requires a specific data collection strategy. Simulations may also be useful for testing different strategies when establishing a new survey. It should be noted, however, that this is not a replacement for building in experiments in ongoing surveys, but rather as an additional tool.
For simulations we used the NORWECOM ecosystem model that provide spatially explicit fish distributions (Skogen et al. 1995), and we used the StoX survey estimation tool (Johnsen et al. 2019) that is used as the standard survey estimation program. The main task was to generate an “observation model” that linked the ecosystem model and the survey estimation program, as well as simulating different in silico survey strategies (Holmin et al. 2020).
Three surveys were used as case studies, and the in silico surveys were manipulated in timing, coverage and ship direction. The model contains the true abundance, and the estimates from the simulated observations were compared to the model's true abundance. The results showed the vulnerability to timing and survey direction when surveying migrating stocks and provides a framework for testing new surveys in silico prior to performing the actual surveys.
Figure 4.1: Examples of simulated surveys. The surveys are simluated on different times of the year and used to test different strategies. The figure is reprinted from Holmin et al. (2020; their figure 2). (CC-BY4.0), see the paper for more details.
3.3.3 - In situ experiments and sonar
Biases in survey estimates are challenging since auxiliary information is typically needed. For acoustic trawl surveys, these biases include surface blind zones, fish avoidance, target strength and classifying acoustic backscatter from the echosounders, among others. See Løland et al. (2007) for an overview. For demersal surveys, similar biases exist, including the trawl blind zones and standardization of the trawl operation. REDUS has contributed to this through a dedicated survey and by participating on several fisheries independent surveys providing input to the stock assessment procedures. The topics addressed has been the use of fisheries and scientific sonars as a tool to address biases in acoustic trawl surveys, the use of the deep vision system for acoustic classification and the effect of trawl standardization.
3.3.3.1 - Fisheries sonar and scientific sonar
To overcome the limited sampling volume, avoidance and surface blind zones causing biases in echosounder estimates, sonars has been proposed as a method to move forward. Several different sonar configurations exist, and REDUS has tested both fisheries sonar and scientific multi beam sonar.
Where echosounders have a well-defined data processing pipeline, the use of sonars in fisheries acoustics is less developed. Identifying schools by hand is time consuming process and the first step was to establish an automated method for identifying schools in fisheries sonar (Vatnehol et al. 2018). The method utilizes the full angle, range and time domain (Figure 4.2), and efficiently isolates individual schools. Data from the REDUS survey and standard fisheries acoustics survey on Norwegian Spring Spawning herring have been worked up.
Figure 4.2: Illustration of interpreted data from a test case plotted in time (travelled distance), range and bearing dimension. Z-axis shows the range between the data pixel and the vessel. From Vatnehol et al 2018, their Fig 3 . CC-BY 4.0.
After the schools have been identified, there are different approaches for integrating the backscatter. One challenge is that, due to a non-uniform vertical distribution, the fish are not randomly distributed within the sonar beam. The effect of violating this assumption corresponds to a bias adjustment of κ , where 1/ κ range from 0.2-0.98 and 0-0.55 for a range of simulated vertical distributions and vertical distributions representative for a typical acoustic trawl survey, respectively. If the vertical distribution remains stationary in time and space, the bias will be constant and not necessarily pose a problem for an assessment, but if it varies, the simulations can be performed to assess the effect.
A similar approach is taken for the scientific sonars (Simrad MS70). Data processing software have been developed and data from several surveys have been analyzed. The processing algorithms are documented, and a draft paper has been developed (Korneliussen et al. in prep.).
A full comparison between echosounders, fisheries sonars and scientific sonars have been prepared. All data have been worked up and the data from the individual sensors are interfaced with StoX for index calculation. A draft paper on the comparisons between the different instruments has been developed (Holmin et al. in prep.).
3.3.3.2 - Gear performance specifications
Standardization and calibration of sampling tools is an important part of scientific surveys, and REDUS has supported the ongoing IMR work to review and produce updated trawl manuals and gear performance specifications. It has also been established routines for pre-survey sea-trial setups to ensure that all trawls used during a survey fulfill the performance specifications. A haul-quality inspection software is ready to be fully implemented. The trawl manuals are available in the HI-Kvalitetsportalen:
3.3.4 - Methods to combine echo sounder data and swept-area data into combined survey estimates.
3.3.4.1 - Dead zone correction
In the stock assessment of haddock and cod in the Barents Sea, the acoustic and swept area indices are currently considered as two independent tuning series. However, the vertical distribution of these species will affect both the catch rates of the demersal trawl and the fraction of the acoustic density that is hidden in the acoustic dead zone near the seabed. Thus, a combined estimate may reflect the true change in density and will be less affected by any change in vertical distribution. Ono et al. (2017) showed that vertical distribution of cod and haddock was highly variable. Higher water temperature resulted in decreasing catch and fish density in the acoustic dead zone (ADZ), while increasing sun altitude increased the catch and fish density in the ADZ. The catch and density of haddock in the ADZ also increased at the lowest sun altitude level. Generally, the density of cod and haddock changed more rapidly in the ADZ than in the catch (from bottom to the effective fishing height) indicating the importance of modelling fish density in the ADZ. Finally, the uncorrelated variability in the annual residual variance of cod and haddock further strengthen the conclusion that species vertical distribution changes frequently and that there are probably many other unobserved environmental variables that affect them independently.
3.3.4.2 - D2.1 Build a time series module in StoX to estimate the whole time series based on manipulated/simulated data including the noise module.
Survey estimates from annual acoustic-trawl and swept area surveys are important components in the stock assessment of a wide range of species. Traditionally, such estimates are given as point estimates in assessment models used in ICES, whereas later developments in stock assessment have facilitated the use of precision of the estimates. The survey estimation software StoX and associated R package Rstox uses bootstrapping of trawl stations and acoustic transects to estimate precision. This precision estimate does not, however, include uncertainty in critical parameters such as target strength relationships for acoustic-trawl surveys and sweep width for swept area surveys. The StoX/Rstox framework facilitates modifying parameters or input data to manipulate existing survey estimates. Holmin et al. (2018) demonstrated the sensitivity of survey time series estimates to changes of parameters and input data for the Norwegian-Russian winter survey of cod in the Barents Sea, and the Norwegian lesser sandeel acoustic-trawl survey in the North Sea. Changing the parameters used in the frequency dependent target strength affect trends in the time series of sandeel abundance. Furthermore, the survey time series of cod was affected by changes in the parameters of the length dependent catchability.
3.3.5 - Estimators for transect based surveys
3.3.5.1 - Method to correct for variable survey coverage
In many surveys the full survey area may not be covered due to poor weather conditions, time limitations and more. Previously, gaps in the coverage have been manually corrected without a statistical sound approach for important surveys. Here, a general spatio-temporal abundance index model was developed and tested for North East Arctic cod in the Barents Sea. It is shown that the model can be used to predict abundance indices by length and compensate for varying survey coverage, and that the prediction can be used to construct standardized time series of abundance indices when areas are not fully covered (Breivik et al. accepted by ICES Journal of Marine Science).
3.3.5.2 - Zig-zag survey design
A zigzag survey design for continuous transect sampling with equal coverage probability will improve the cost efficiency and scientific outcome in many marine surveys. Harbitz (2019) has developed a randomized zigzag sampling design for straight line and curved transects that guarantees equal coverage probability, i.e., each point in the study area has the same probability of being sampled. The basic idea is to fit automatically either the smallest rectangle, or the smallest circular sector enclosing the actual area. A comparison of a randomized parallel, straight line zigzag, and curved zigzag is done on several strata for the sandeel surveys in the North Sea and shows that the new zigzag design is far more efficient. In Rstox (Holmin 2019), the rectangular enclosure zigzag sampler is implemented (Harbitz 2019), and the curved enclosure zigzag sampler (Harbitz 2019) will be implemented. The Rstox surveyPlanner function is used in several of IMR and ICES acoustic surveys.
3.3.5.3 - The IBTS survey case
ALK estimators for calculating the indices of abundance-at-age were evaluated, with and without the assumption of constant age–length structures over relatively large areas. The ALK estimators give similar point estimates of abundance-at-age and yield similar performance with respect to precision. And it is shown that measuring one fish per 5-cm-length group per trawl haul is sufficient and the total number of fish subsampled for age from trawl surveys could be reduced by at least half (50%) without appreciable loss in precision (Jourdain et al. 2020).
Additional deliverables:
Survey design improvements of mackerel swept area survey
Survey design improvements of HERAS survey
Survey design improvements of Ecosystem survey in the Barents Sea
Established routines to estimate relative standard errors of survey estimates when using StoX – to be used as input in X-SAM.
4 - WP3 Evaluate and test long-term management strategies
4.1 - Aims
The key aim of WP3 was to identify and develop replacements for the existing IMR Management Strategy Evaluation (MSE) tools (PROST and HCS). Norway has been at the forefront of developing and implementing Harvest Control Rules (HCRs) in fisheries management. In many ways, the existing tools were very advanced (e.g., the ability to include density dependence in stock development). But there is now a need for the next generation of tools that would allow for improved realism and flexibility in the simulations such as explicitly including assessment models (AMs). This increased flexibility would allow the tool development/improvement in the other WPs to be incorporated into MSEs. The primary focus of WP3 was thus to develop MSE tools that can better handle random errors (observation errors and process noise) and test for structural errors (e.g., model formulation).
Wherever possible, the aim was tailored to integrate with ongoing research and advice within IMR and beyond by examining the existing tools, evaluating them against the IMR requirements, and developing them to meet our needs in single-species advice and wider research contexts.
In particular, WP3 was tasked with developing the tools that can evaluate HCRs in multispecies and ecosystem contexts. The outcomes of WP3 were therefore aimed at improving our ability not only 1) to evaluate HCRs for use in tactical management but also 2) to provide tools to support research into Ecosystem-Based Fisheries Management (EBFM). With multiple ecosystem models (Gadget and Atlantis) as operating models (OMs) of MSEs, IMR is now in a position closer to carrying out the assessment work as part of EBFM.
4.2 - Tasks and milestones
The tasks and milestones for WP3 revolve around developing and testing single species and ecosystem MSE tools. These tasks have been largely completed as intended. A4A/FLR (Assessment for All/Fisheries Library in R) and FLBEIA (Bio-Economic Impact Assessment using FLR)–two tools widely used in the ICES community–have been tested, and code has been developed using single species Norwegian examples, which can be used as a basis for other stocks. The codes of both tools have been further extended to allow external OMs such as Gadget.
In some cases, the species and/or region focus changed as REDUS coordinated with other ongoing work elsewhere. In collaboration with the EU SC05 project: “Multispecies Fisheries Assessment for NAFO”, a multispecies MSE framework (A4A/FLR-Gadget), which allows risk assessment that accounts for trophic interactions, has been developed. Using this framework, multispecies HCRs were designed and tested.
Observational bias was not evaluated as intended (see M3.5 below). Instead, focus has been placed more on structural bias (e.g., lack of density dependent growth or variable food supply).
4.2.1 - Tasks
T3.1Review existing model tools, decide upon which is best suited for our area and purpose, including both single-species and ecosystem models.
Completed with a write-up for A4A/FLR. Both A4A/FLR and FLBEIA have strengths and weaknesses. Both are viable tools for future MSE work in Norway but more demanding than previous tools . Another possible tool, DLMtool/MSEtool (developed by Thomas Carruthers and Adrian Hordyk, www.datalimitedtoolkit.org), was not considered in this project but would potentially meet our needs.
T3.2 Build flexible MSE tool which works with key operating assessment models and ecosystem models, and which takes uncertainty into account
Completed. Both A4A/FLR and FLBEIA are connected to Gadget. A tool was developed and under testing for Atlantis.
T3.3 Use the MSE tool to test: T3.3.1 The importance of uncertainty on stock assessment and on ecosystem level, T3.3.2 The impact of uncertainty on the catches, the single stocks and on the ecosystem and T3.3.3 Evaluate the HCRs considering the findings in T3.3.1 and T3.3.2
T3.3.1 Completed for stock assessment in MSEs for North Sea saithe (ICES 2019a), multispecies Flemish Cap (Perez-Rodríguez et al., in preparation), and a control artificial stock (Kelly 2019). Also, uncertainty in ecosystem processes through multispecies HCRs in the Flemish Cap was tested. Uncertainties in Norwegian spring-spawning (NSS) herring and Northeast Arctic (NEA) cod HCRs are under testing with Norwegian–Barents Sea (NoBa) Atlantis.
T3.3.2 Completed for the same stocks and models as above.
T3.3.3 Completed for saithe HCRs and artificial stock HCRs looking at recruitment variability and uncertainty. The work on evaluating HCRs for NEA cod and NSS herring is ongoing.
4.2.2 - Milestones
M3.1 Decision on which tool to use/build in collaboration with the other WPs - implement observation model in MSE.
Completed. Both A4A/FLR and FLBEIA are viable tools, depending on what degree of flexibility is needed. Incorporating the tool development/improvement made in the other WPs such as STOX and ECA was limited, but an observation model has been explicitly developed as part of an A4A/FLR framework, which has been tested with North Sea saithe as a case study.
M3.2 Implement a flexible extendable MSE tool which works with key operating and assessment models, and which takes uncertainty into account.
Completed. Both A4A/FLE and FLBEIA can now work with Gadget as an OM and SAM/XSAM as an AM.
M3.3 Incorporate a multispecies operating model.
Completed for both A4A/FLR and FLBEIA using Gadget (but only for single species management). Under testing (academically) using NoBa as OM.
M3.4 Case study assessing the effect of uncertainty on the performance of the fishery using the two target species (NSS herring and cod).
Under testing for both species with NoBa Atlantis. As an alternative, a case study using an artificial stock in single species MSE has been completed.
M3.5 Case study: Comparing bias to random noise: Identify impact on fisheries and possible differences between the two case studies
Not completed as planned. Alternatively, this task has been replaced with examining the interaction of noise and structural changes in recruitment under different HCRs, which is ongoing.
4.3 - Deliverables
Development of MSE frameworks
D3.1 Flexible MSE tool which ‘talks’ to the existing models (both single-species and ecosystem) at the institute.
The key deliverable from WP3 was the production of a flexible MSE tool which can communicate with the exiting OMs at the institute, and this has been achieved. Both A4A/FLR and FLBEIA give the degree of flexibility required. A4A/FLR (github.com/flr/mse) is a set of core functions for building MSEs, which gives great flexibility but imposes a high workload on creating the code. By contrast, FLBEIA (github.com/flr/FLBEIA) is more structured with better documentation, making development of a new case less labor-intensive. Furthermore, FLBEIA can account for detailed fleet dynamics and relevant economic properties but is less flexible in expanding the code to incorporate more ecological reality. Either of these tools is suitable for use in future MSEs in Norwegian waters but may require a specialist supporting stock assessors in performing an MSE.
In collaboration with the developers (Ernesto Jardim and Iago Mosqueira for A4A/FLR; Dorleta Garcia and Sonia Sánchez for FLBEIA), code has been written to connect to an external Gadget model as an OM for both tools (available on Github; A4A/FLR: github.com/dgoto2/flr-gadget and FLBEIA: github.com/REDUS-IMR/FLBEIA) via a custom R package, GadgetR (github.com/REDUS-IMR/gadget). This extension has been tested for A4A/FLR through the work on multispecies HCRs for the Flemish Cap (Perez-Rodríguez et al. in prep.). In principle, this code can be adopted to connect other OMs. The FLBEIA-Gadget connection was not tested in this project.
During the REDUS project, an ICES MSE workshop was held to set the HCRs for four North Sea stocks (WKNSMSE, ICES 2019a), with IMR focusing on saithe (Goto et al. in review). To take advantage of this opportunity, WP3 collaborated with Jennifer Devine (a stock assessor for saithe) to develop and test an A4A/FLR framework (Fig. 5.1) in a practical context. Through this exercise (in collaboration primarily with Simon Fischer and José De Oliveira at Cefas), we have developed code for a single species full MSE (with observation and assessment/SAM models) that accounts for process, observation, and implementation uncertainties (the code is available on ICES Transparent Assessment Framework (TAF) Github: github.com/ices-taf). The code also can serve as a template for future MSEs for other stocks, thereby reducing the workload. Furthermore, using this framework, we have developed a method to diagnose the robustness of HCRs to persistent assessment bias (known as “retrospective pattern”) as part of an ICES workshop, WKFORBIAS (ICES 2020a); this method, if deemed necessary, also can design more precautionary HCRs to minimize overharvest risk when bias becomes too severe (Goto et al. in review).
Figure 5.1: Management strategy evaluation (MSE) framework developed for North Sea demersal fish stocks (FLR/a4a, redrawn from https://github.com/ejardim). Images are from the IAN Symbols, courtesy of the Integration and Application Network, University of Maryland Center for Environmental Science (ian.umces.edu/symbols/).
The MSE module of NoBa Atlantis has been further developed to match the management regimes in Norwegian waters. This capability is currently being tested on NEA cod.
D3.2 Technical report on the MSE tool.
A technical report on one of the MSE tools evaluated in this project, A4A/FLR, has been completed. This report needs to be expanded to include FLBEIA.
D3.3 Peer-reviewed paper: Reducing sources of uncertainty - impact on the performance of the fisheries. Submit to tier 2 fisheries journal
There have been several publications that relate to examining the effects of structural bias on HCRs. Sparholt et al. (2020) investigated the effect of ignoring density dependence in computing Fmsy. Goto et al. (in revision), using a multispecies OM that accounts for ecosystem processes (STOCOBAR, developed by Anatoly Filin at PINRO), evaluated the influence of climate-driven variability in capelin production on the performance of stability constraint in the NEA cod HCR. Another work investigates how observational uncertainty interacts with recruitment variability and how this relates to different classes of HCRs (Kelly 2019).
D3.4 Incorporate the new assessment model developed during WP1 into the MSE tool.
The codes of both A4A/FLR and FLBEIA have been updated to incorporate SAM as an AM (available on Github; A4A/FLR: github.com/dgoto2/flr-gadget and FLBEIA: github.com/REDUS-IMR/FLBEIA). XSAM–now merged with SAM–is now thus connected to both tools. The capabilities of XSAM were not evaluated through MSE simulations, however.
Evaluating tools for ecosystem-based management
To ensure that the progress made in REDUS is integrated into the ICES advice and science process, WP3 has participated in several ICES working group meetings/workshops. In addition to WKNSMSE and WKFORBIAS, the key meetings we have participated in are as follows: WKRPChange (co-chair, reference points under changing environmental conditions), WKMSE2 and WGMSE3 (writing new ICES guidelines for MSEs, ICES 2019b and ICES 2020b), WKIRISH5 & WKIRISH6 (co-chair, developing the Feco concept to link ecosystem models into ICES advice), WGGRAFY (changing weight under changing environmental conditions), WGSAM (using Atlantis outputs as tuning data for testing the skill of multispecies models), WGINOR (ecosystem overviews in the Norwegian Sea), and WGMETHODS (stock assessment methods).
WP3 also has participated in the Centre for International Experts review for Atlantic menhaden (taking account of predator food requirements in setting fishing targets for a forage fish). Other work was planned but postponed due to Covid-19, including most notably participation in a workshop to be held in the US on how to use multispecies models in the stock advice process.
Several publications have come out of the work conducted with scientists in the Irish Sea as part of WKIRISHs. These papers focus on the feasibility of incorporating ecosystem model information directly into current ICES quota advice via adjustments to Ftarget within precautionary limits.
Another group of expected publications (Perez-Rodríguez et al. in prep.) deals with 1) the use of MSE frameworks to assess the importance of accounting for trophic interactions when designing HCRs for stocks with strong ecological interactions and 2) the consequences of wrong assumptions on natural mortality in single species stock assessment models.
Additionally, there have been several papers that relate to the use of ecosystem models in fisheries management: evaluating the calibrating the marine ecosystem models such as Atlantis (Pethybridge et al. 2019), a review of MSE in ecosystem models (Perryman et al., in review), and indicator evaluation (Hansen et al. in review). One synthesis paper co-authored by Perryman, H.A. (in prep.) is expected to be submitted fall 2021.
D3.5 Peer-reviewed paper: Exploring bias in the Norwegian Spring Spawning Herring and Northeast arctic cod: How does bias impact the performance of two different fisheries? Submit to tier 2 fisheries journal
Ongoing. HCR simulations are currently being run, and two papers (Perryman et al. in prep.) are expected to be submitted early 2021.
D3.6 Peer-reviewed paper: Towards ecosystem-based management in the Barents and Norwegian Sea: The effect of determining HCRs on isolated stocks compared to the ecosystem approach. Submit to tier 2 fisheries journal.
Not completed as planned. Alternatively, there have been papers on the effect of ignoring density dependence across all ICES stocks with Barents Sea singles out as a case study, a study of ecosystem HCRs for mackerel and mesozooplankton in the Norwegian Sea, a study on balanced harvest for the Norwegian and Barents Sea (Nilsen et al. 2020), and indicator evaluation for the Barents Sea.
5 - WP4 Communication of uncertainty, dissemination of project results, capacity building and project coordination
5.1 - Aims
Implementation and communication of REDUS results together with strengthening and building scientific networks were the focus of WP4. Specifically, this entailed strengthening the international collaboration, communication of uncertainty in stock assessments (internally and externally), establishing a best-practice guide for stock assessment, and developing the IMR Stock assessment meta-database.
5.2 - Tasks and milestones
A project webpage was established at the start of the project, together with a twitter-account (@redusproject). Through continuous collaboration with the IMR communications department REDUS deliverables (e.g., articles, new methods) were disseminated through online news articles, posts on Facebook and Twitter, as well as op-ed articles in Norwegian newspapers.
Transparency and open access to all project outcomes have been achieved by publishing open-access science articles and collaborating with international partners on open-access code at the IMR’s or collaborators’ GitHub. Open access software (e.g., R) has been the chosen tools, as well as working with the IMR S2D project on version-control of datasets.
The REDUS project was presented at a kick-off meeting in Bergen in June 2016 with invited participants from the USA (NOAA), Russia (PINRO), ICES, as well as several Norwegian research institutions. The project was terminated with an open webinar presenting the main project results in December 2020, inviting the participants on the kick-off meeting, representatives for the Norwegian fishing industry, and all stock-responsible scientists at IMR.
Yearly seminars with the fishing industry were held in 2017, 2018 and 2019 to present the project, receive feedback and discuss how to communicate uncertainty in fisheries advice. Internally, yearly seminars were held for the stock assessment scientists at IMR. REDUS was further presented and evaluated at the 2019 IMR ‘Stock assessment review’.
5.3 - Deliverables
A stock-assessment database (Bestandstabell (hi.no)) containing information on each stock that IMR gives advice on was established and revised, and is updated on a regular basis. This database provides links to information about each stock, including the latest advice, and lists per stock any red-listing, the name of the stock-responsible scientist at IMR, as well as priority research needs.
A best practice guide for stock assessment was another key deliverable from WP4. This best practice guide describes each step of the monitoring, assessment and advisory process, providing practical checkboxes for stock-assessment scientists for evaluating how their specific assessment adheres to best-practice in relation to the choice of methods, surveys, quality control and communication. The best-practice guide is now part of the IMR Quality Control process and is under implementation for all analytical fisheries stock-assessments. Further revisions/updates are planned for applying the best-practice guide also for data-limited stock assessments, as well as assessments of shellfish stocks and marine mammals.
Three op-ed articles have been published in Norwegian newspapers highlighting both the overarching topic of the importance of and pathways to reducing uncertainty in stock assessment, but also on specific topics like the uncertainty linked to a survey (‘skreitoktet’), as well as the effects of mass mortality events (e.g. oil spills) on the ecosystem.
REDUS co-chaired a theme session at the ICES Annual Science Conference in 2017 (Ft. Lauderdale, USA) on “Stock assessment methods, model complexity and uncertainty”.
Two scientific papers summing up the REDUS project experience are in the pipeline with plans for submissions to scientific journals in 2021.
Increasing the skills and proficiency of IMR personnel in advanced stock assessment methods and new REDUS tools has been a key activity in WP4 with annual courses on topics like the XSAM stock assessment model (two courses), TMB model building tool (three courses), as well as training in the new StoX-ECA tool for key personnel (Table 6.1).
Yearly meetings with the fishing industry were organized in 2017 (Myhre), 2018 (Bekkjarvik), and 2019 (Ålesund), and a 3-days open webinar presenting the main project results was held at the end of the project period (December 2020).
Table 6.1: Courses and training, 2017-2020.
Course
Instructor
Year
TMB
Anders Nielsen, Hans Julius Skaug
2017
Transfer of competence Øigård-Biuw
Martin Biuw, Tor Arne Øigård
2017-2020
Training in XSAM (IMR and NR personell)
Knut Korsbrekke
2018
TMB
Hans Julius Skaug, Olav Nikolai Breivik
2018
XSAM
Sondre Aanes
2018
Training in StoX-ECA
Edvin Fuglebakk
2019
TMB
Hans Julius Skaug, Olav Nikolai Breivik, Jens Christian Wahl
2019
SAM
Knut Korsbrekke, Olav Nikolai Breivik, Sindre Vatnehol
2020
Training in StoX-ECA
Edvin Fuglebakk
2020
SAM (ICES course)
Anders Nielsen, Olav Nikolai Breivik
2020
5.3.1 -
5.3.2 - International collaboration
The REDUS project identified NOAA, DTU-Aqua and ICES (Transparent Assessment Framework (TAF) development team) as strategic international collaborators that were invited to participate and give input to the project. NOAA were invited to the project kick-off meeting and five NOAA scientists visited IMR as guest scientists for periods lasting from two weeks to two months. Reciprocally, one IMR scientist visited NOAA Northwest Fisheries Science Center for a two-month period.
REDUS scientists have also collaborated with scientists from DTU-Aqua in developing the SAM model code base to include XSAM functionality and implementing these developments in models for NEA Cod.
There has been a close and continuous collaboration with the ICES TAF team on ensuring that the REDUS framework and other tools are fully compatible with the TAF. There have been several meetings between the REDUS and TAF teams, and the REDUS programmer has been invited as a member of the Working Group of TAF Governance (WGTAFGOV).
A practical presentation and demo of the REDUS framework was planned for the ICES Annual Science meeting in 2020, but due to COVID-19 the meeting has been postponed to 2021, and so has the presentation of the REDUS framework.
5.3.3 - Stock assessment review
In 2019, the IMR carried out a comprehensive peer-review based evaluation of its entire stock assessment process. The review was initiated by the IMR and carried out by an international team of experts: William Karp (chair), James Ianelli, Anna Rindorf, and Gunnar Stefannson. In addition to evaluating the assessment process for individual stocks, the panel also reviewed the REDUS project. Some of their main findings in relation to REDUS and the Best Practice Guide were:
“The panel noted that the concept of reducing assessment uncertainty may be misleading. Experience suggests that improving assessments requires a more complete consideration and accurate estimate of uncertainty (which often can result in increased uncertainty). We think that improving assessments means providing advice that clearly estimates the uncertainty and relative risks.”
“The panel noted that since “Optimum Economic Yield” is a priority for many Norwegian fisheries, it would be helpful to indicate how this requirement is recognized within the REDUS project. Similarly, some recognition and discussion of the linkages between uncertainty, risk evaluation, and precaution should be provided."
“Implementation of the REDUS framework for the two demonstration stocks appears to be near completion. Following thorough review, this framework should be adapted to include all assessed stocks.“
“This [the Best Practice Guide for Stock assessment] is a useful guide and should be implemented to the extent practicable for all assessments. The guidelines themselves and individual checklists should be date stamped. The panel noted that in Table 4, growth information, e.g. weight in the stock or weight in the catch should be included. While these are observed historically, they also need to be forecast, and this can be a major source of uncertainty; a best practice should be to evaluate the relative impact. Data processing and assessment model code should be checked minimally at benchmarks but ideally also through technical consultations with colleagues tasked to scrutinize these aspects."
6 - The REDUS assessment framework
6.1 - Introduction
REDUS Assessment Framework (RAF) is a data processing framework that is built with the aim to improve the Norwegian Institute of Marine Research (IMR) fisheries advice process and to help the stakeholders of the process to identify and reduce the uncertainties that may impair the integrity of the advice.
To achieve its aim, RAF is devised to make the information that is used to support the fisheries advice process (i.e., stock assessment reports, management strategy evaluation reports) to be:
Transparent: All input/output data and programming scripts involved are publicly available.
Reproducible: Anyone can use RAF to reproduce the steps of an official assessment process, that is from the raw input data until the final assessment reports.
Flexible: RAF can also be used to experiment on how differences in input data/assessment parameters and configuration can affect the final assessment results.
Universally available: Anyone in the world can have access to and use RAF anytime.
Peer-reviewable: In addition to all the above, all parts of the RAF system itself are open source. Therefore, anyone can freely inspect the RAF inner machineries and process flow that it is executing.
Figure 7.1: REDUS Assessment Framework simplified process flow.
The simplified illustration of the RAF process flow begins with the data that IMR has collected from the sea (e.g., biological sampling, acoustic sampling, etc.) and ends with information that are essential to support the important fisheries advice (cf. Figure 7.1 ). However, in reality, the flow can be much more complex (cf. Figure 7.2 ). There are many components that need to be working in harmony. Some of the most important components are the data storage and StoX/ECA components that are part of the Sea2Data project.
Figure 7.2: REDUS Assessment Framework process flow and related components. The “Data Storage” (top) section and its data components are coming from separate Sea2Data project. The components in “StoX/ECA” (center) section is processed using StoX/RStox program from separate Sea2Data project.
6.2 - Features
RAF is designed by incorporating these design choices and functional features:
User-oriented Graphical User Interface (GUI).
The user-facing interface is a web-based GUI (cf. Figure 7.3 and Figure 7.4 ) that is accessible from any internet browsers.
Figure 7.3: Assessment model selection (left). A user selected assessment is preparing to run (right).
Ability to select and run different assessments in parallel.
Each assessment run is executed in its own isolated environment in the server. Users can always access them anytime and from any locations.
Support for doing comprehensive assessment experiments.
Users are given the options to configure the assessment’s three main components (cf. Figure 7.5):
Survey estimates
Catch estimates
Assessment models and their configuration
Figure 7.4: User interfaces to interact with the assessment run. File manager (top, left). Command console (top, right). Running logs (bottom, left). Auto-generated reports after each finished run (bottom, right) .
6.3 - System Life Cycle
A RAF object (a single assessment) has a simple and straightforward life cycle. For example, to add a new year of (a single-/multi-) stock assessment (e.g., assessment of the North East Arctic Cod in 2018), the required steps are the following:
Responsible scientists prepare or update the survey time series and catch time series for the target species.
Responsible scientists make the assessment bundle (scripts + data), or convert (e.g., from a SAM assessment), in a special RAF format bundle (RAF format = ICES TAF format with additional scripts).
RAF system administrator adds the new assessment into the RAF server.
Users are able to run and experiment with the assessment using the RAF system.
A RAF object can be re-used in the future. For example, to add a new assessment year. Assuming the StoX time series for the new year is available, a slight configuration to the existing RAF object is enough to add the new assessment year into the system.
Figure 7.5: Assessment configuration options. Configure the survey input data (left). Configure the assessment model (right).
6.4 - REDUS Framework and Sea2Data Project
RAF process begins with loading data products that have been collected and provided by Sea2Data project (e.g., NMD Datasetexplorer). The main data products required by RAF are the 1) Survey (StoX) Time Series and 2) Catch (ECA) Time Series . These products are composed by these data components (cf. Figure 7.2 ):
Biotic data
Acoustic (echosounder) data
Landings data
StoX project files
RAF is processing the above data using StoX program, which is another part of Sea2Data project, to produce abundance estimates that is required for running the assessment.
6.5 - Technical Overview
RAF system consists of two conceptual processing units (servers). In practice, the servers can reside in just one physical machine. These units are 1) REDUS API server and 2) REDUS framework server . Each unit is made of several sub-components (cf. Figure 7.6 ).
Figure 7.6: Assessment Framework components diagram. Connected piece of puzzles are the essential components.
6.6 - REDUS API server
REDUS API server serves two important roles:
Periodically running all IMR survey estimates using Rstox, and:
Produces StoX projects sanity check report
Detects changes in the survey estimates
Stores results from the periodic runs as the official survey estimates
Accepts API calls for fetching the official survey estimates.
The main requirement for this server is a Linux machine with R program and REDUStools R package installed.
6.6.1.1 - REDUStools
REDUStools is an R package (source) and, with combination with a CRON job, can periodically process all the available IMR survey time series and store the results in file-backed database in the server (backend). All previous results are preserved in the database and the results are also accompanied by their metadata information to aid reproducibility in the future. Some of the recorded metadata are:
REDUStools version
Rstox version
R version
Data version/timestamp
Run timestamp
REDUStools also provides APIs for getting the survey time series results and gives users two sets of front-ends to explore the stored results (cf. Figure 7.7).
Figure 7.7: REDUStools front-ends. Survey time series dashboard (link) (left). Survey time series explorer (link) (right).
7.5.2 - REDUS framework server
REDUS framework server provides user with a GUI to configure all aspects of a single pipeline run and is responsible to launch a Docker/Podman container to start a new assessment run using the user-defined configuration.
The server requirement is a Linux machine with Podman/Docker and NodeJS installed.
6.6.1.2 - Fishdocker
Fishdocker is a collection of Dockerfile, the recipe to create image that will be used inside a container (e.g., REDUS framework and portable Rstox images). The collection is available in this Github repostory.
6.6.1.3 - REDUS framework app
REDUS framework app is a NodeJS package (code) that is responsible for providing web-based GUI for users to configure their run and launch Podman/Docker container for each of the assessment runs. This app also features interactive file manager, web-based console, logs, and results visualization for each of the assessment runs (cf. Figure 7.4).
The app is temporarily live in this location, pending a move onto a more suitable REDUS dedicated server.
6.6.1.4 - REDUStools
REDUStools is also a crucial element in REDUS framework server, because this package is included in the REDUS framework Docker/podman image. Here, REDUStools is responsible for client-side/in container processing (API broker) actions:
Making API calls to REDUS API server
Re-processing survey time series estimation using Rstox
Generating figures and tables for the assessment runs
6.6.2 - Other supporting applications
Other than the essential applications, there are also several supporting applications that help RAF to functions properly. Among them are the survey time series tools and echosounder comparison packages.
6.6.2.1 - Survey time series tools
These tools are contained in an R package (source). One tool in the package enables users to download a complete StoX's survey time series project (StoX project file + biotic data + acoustic data). A drop-in replacement of the deprecated NMD datasetexplorer's ZIP download feature.
Another tool enables users to check if their own survey time series' StoX project XML file is correct (i.e., can be processed and produces official estimates) or not. These tools are live in this location.
6.6.2.2 - Echosounder comparison
Echosounder comparison is an R package (source). Its main role is to check and compare multiple echosounder data from different sources that are coming from the same cruise. The package is live in here (cf. Figure 7.8).
The estimates of catch-at-age or length along with their uncertainty estimates is now standard input in analytical stock assessment models in Europe (e.g., SAM). However, to-date, there is no standardized framework that allows to test and produce simulated estimates of catch in numbers at age or length based on different fishery survey sampling designs and sampling effort. Further development of the Fishery Simulator and ECA_TMB would be the first step towards generating such a framework and would potentially be beneficial to the whole ICES community.
For many stocks assessed within ICES, the fishery-independent scientific surveys are coordinated among nations so that reliable abundance indices can be obtained. However, fishery-dependent sampling of catches from the commercial fleet has been less well coordinated regionally, especially for the part of the National fleets that land a large portion of their catches abroad. This is especially the case for the large pelagic fleet, where large portions of the catches of species such as mackerel, blue whiting and herring taken by one nation may be landed in foreign countries. To achieve sustainable management of the widely dispersed Marine Fishery resources it is important that the data collection to support stock assessment and quota advice be internationally coordinated, and that a regional sampling method is agreed upon. Since stock assessments of the large pelagic stocks generally are based on input data on catch in numbers at age and abundance indices at age from multiple nations, it is strongly recommended that Norway collaborate through ICES to develop developing catch sampling design, statistical estimators, and sampling protocols for regional probabilistic catch sampling from pelagic fisheries in ICES.
In Norway, the plan is to implement mandatory electronic catch reporting (ERS) for all commercial vessels within the next few years. It is recommended that probabilistic catch sampling based on two-way communication with vessels through ERS methods in the catch sampling lottery also be developed for the coastal fisheries.
State space assessment models is a flexible framework where several types of data can be integrated into the final stock assessment. However, this flexibility also means that the user is responsible for the exact model specification and parameterization of the model. In order to make informed decisions in model-specification the relative importance of model parameters needs to be understood. We suggest that the model variants that result from data driven methods should be developed for automatic or semi-automatic model selection. This will provide a seamless transition in model-specification from a flexible model for data-rich assessments with precise input-data, to a simpler model parsimonious model for stock assessments based on limited and noisy input data. This would give less subjective model choices and would help less experienced users to apply an appropriate model.
Through REDUS the Mackerel assessment has been investigated and some analysis has been performed on the NEA Haddock assessment and its sensitivity to different data sources. Both analyses have suggested that improved understanding of data source weighting in stock assessment models may help in judging the relevance of assessment models and uncover important side-effects of changes in variance-covariance specifications. We suggest that data source weighting schemes in current stock assessment models should be analyzed to better understand their implications and possibly provided informed proposals for alternative data weighting approaches.
WP2
To ensure that all steps in the production of survey estimation are transparent and reproducible it is of utmost importance that the survey time series routines established in Sea2Data and REDUS continue. New estimation functions should be made in StoX for those estimators that are not in place. It should be possible to run spatio-temporal models (e.g. the model made by Breivik et al, submitted), and it is recommended that StoX and the survey time series structure at NMD should enable such model structures.
It is also important to establish and enforce control routines which ensure that e.g. Program Leaders are notified when survey time series are not updated in due time.
Make routines to ensure a full transparency and reproducibility of all data exported to ICES (e.g. DATRAS, ICESacoustic). It is recommended to use the procedures implemented in the Sea2Data project.
It is recommended to expand the survey estimation models in StoX to enable the estimation of combined swept-area and acoustic estimates (see Ono et al. 2017).
Further work is needed for evaluation of uncertainty in acoustic categorization in acoustic surveys. The uncertainty should propagate through the survey estimation and be included in the overall survey estimation uncertainty. It is likely that machine learning of acoustic categorization is an important part of the solution, and this issue is a task in the ongoing CRIMAC project.
It is recommended that the work of implementing unmanned surface vehicles at IMR for data collection should be better organized to ensure an efficient and more structured run of the future USV fleet.
WP3
One key outcome of the work conducted here is that as the MSE tools grow more complex and sophisticated, they require greater resources in both computer power and scientific understanding. In order to be able to use the new generation of MSE tools in a wide range of stocks, IMR needs a dedicated scientist to support stock assessors, as well as to continue developing the tools.
Given the commitment to Ecosystem Based Fishery Management in Norway and globally, it is important to continue to develop the tools that will be required to provide the scientific underpinning for such management. This implies building on the work connecting multispecies Operating Models to the MSE tools, for both tactical management and research. Applying multiple end-to-end ecosystem models as testbeds for new HCRs more frequently would also support moving closer to the aim of EBFM/EBM. So far, the ecosystem HCRs that have been applied in NoBa, has been discussed within the integrated ecosystem assessment (IEA) group for the Norwegian Sea (WGINOR). Usually, it is within the IEA groups the end-to-end models are most frequently used and discussed. However, a future recommendation would be to include end-to-end modelers in the discussions and testing of new HCRs on commercially important species.
One important outcome of the collaboration between ecosystem and multispecies work in this project is the ongoing development of a simulated data set from Atlantis which can be used for evaluating and comparing multispecies models, and this should receive priority in the future.
WP4
The Best Practice Guide for Stock Assessment (BPG) has been one of the main products coming from REDUS, and highlighted by the SAR as an important tool to ensure higher quality and reduced uncertainty in IMR stock assessment. To ensure that the BPG continues to be relevant to data-rich stock assessments, as well as being applicable for other assessed stocks the following actions should be taken:
Implement an annual review process of the BPG, with input from stock assessment responsible scientists, and program- and group-leaders.
Evaluate new tools and methods for inclusion in the BPG
Develop annexes to the BPG that cover:
Data-limited stock assessments
Shellfish stock assessments
Marine mammal stock assessments
The REDUS framework has been developed and implemented for NEA Cod and NSS Herring, but development should continue to make the framework applicable for more stocks, both data-rich as well as data-limited, ensuring a continued compatibility with ICES TAF and other international assessments platforms.
Ensuring that personnel have the right training to carry out assessments and use the advanced tools developed through REDUS is a key success-criteria for ensuring high-quality assessments and reducing uncertainty. Training in advanced stock assessment methods (e.g. XSAM), model building tools (e.g. TMB), as well as Stox-ECA that have been initiated through REDUS should continue on a regular basis. In addition, training and courses in new REDUS methods and tools, like the REDUS framework and the Spatio-Temporal modelling extension of StoX should be initiated. Ideally this should be coupled with research groups developing training plans for personnel involved in stock assessments to ensure that all personnel involved have the necessary skills.
A close dialogue and collaboration with stakeholders has been a key aspect of REDUS and it is advised that IMR continues regular broad dialogue meetings with stakeholders on monitoring and stock assessment, e.g. through existing dialogues and for a like FUR and ‘Rådgivende gruppe for ressursforskning’.
8 - Conclusions
The UN Ocean Decade for Ocean Science highlights “ A productive ocean supporting sustainable food supply and a sustainable ocean economy ” as one of the key outcomes of the decade. Reducing the errors in fisheries stock assessment is therefore not just a cornerstone in the sustainable management of the fish resources, but also for the wider Ecosystem-Based Fisheries Management (EBFM) and in relation to the integrated management of marine ecosystems taking all human activities and climate change into account.
The REDUS project has over a five-year period contributed directly to improving our methods and hence the quality of assessment of data-rich stocks in the Northeast Atlantic, thus providing an improved staging point for further developments to achieve the ambitious goals for the UN Ocean Decade. By working broadly, covering the entire monitoring and assessment process from survey design, analysis of survey data, development of statistically sound catch sampling program, improved assessment methods, new tools to evaluate management strategies in a single-species and ecosystem context, and developing a virtual work-bench that links all data-sources and assessment methods in a quality-controlled way, the REDUS project has succeeded in improving the stock assessment quality and capability of the IMR. Together with a defined guide for the best practice in stock assessment and an external review of its stock assessment processes the IMR is now in a much improved position to provide better advice with less uncertainty, and in a more efficient and transparent way than five years ago. REDUS has thus achieved its goals of strengthening the tools and methods, increasing the skills and competency of IMR staff, and improving our scientific network within fisheries stock assessment science.
At the start of the project much anticipation and resources were allocated to developing sonar as a tool in quantifying fish biomass in the water column. Experiments carried out during surveys in the past five years have shown that sonar is probably not as useful in the direct estimation of biomass as hoped, but remains an important tool to map the distribution of schooling fish and understanding their behavior in relation to surveys.
In terms of stock assessment modelling, the greatest improvement has been in the development and implementation of the XSAM stock assessment model in the NSS herring assessment and as an auxiliary model in the NEA cod assessment. XSAM is also no longer a stand-alone model, but fully integrated into the SAM code base, allowing easy access to XSAM functionality in all assessments using the SAM code.
Quality assurance and control of the input data to assessments have also been a key activity, with particular effort put into establishing a new and statistically designed catch sampling procedure for the pelagic fishing fleet – the ‘catch lottery’. The ‘catch-lottery’ uses a probabilistic approach to take samples from catches, reducing the sampling intensity and improving the estimates. New methods for estimating the Catch-at-Age matrix from commercial catches have also been developed and are available as an open-source R-package linked to the StoX software (Stox-ECA). Quality control of data-sets and exported data products (e.g. exports to DATRAS) have also been a key output, linked to development of the virtual workbench – the REUDS framework - which allows running the entire stock assessment process from choosing input data (e.g. survey data), rerunning survey time series (for both catch and scientific surveys), running the assessment using the model of choice, and providing links to the Management Strategy Evaluation tools. The REDUS framework has been implemented for cod and herring, but is easily modifiable to other stocks and works directly with the ICES TAF framework, thereby providing a tool allowing for simulation testing of all steps in the stock assessment process under one unifying framework.
REDUS has been developed as an internal IMR project, but with participation from key collaborators (e.g. NOAA and ICES). However, as most stocks in the Northeast Atlantic are shared we see the need to increase international collaboration, both on surveys, analysis of data, but perhaps most importantly on establishing statistically sound catch sampling programs in all regions and across all national fleets.
Although the COVID-19 pandemic had limited impacts on the REDUS project some meetings and conferences were postponed, postponing venues where we had intended to present and integrate the project results. Therefore, some of the planned papers and presentations will be delayed until 2021.
Improving the fisheries stock assessment methods and processes have been a cornerstone activity of the IMR since the institute was founded 120 years ago. It will continue to be a key activity in the years to come, not least seen in relation to the UN Decade of Ocean Science and the 2030 agenda for reaching the UN Sustainable Development Goals. Therefore, although the REDUS project came to a close in 2020, key activities will continue through other projects and initiatives, building on the skills and competencies developed over the past five years.
9 - References
Aanes, S., Engen, S., Saether, B.E., and Aanes, R. 2011. Estimation of the parameters of fish stock dynamics from catch-at-age data and indices of abundance: Can natural and fishing mortality be separated? Can. J. Fish. Aquat. Sci. 64: 1130-1142. 10.1139/f07-074.
Fournier D, Skaug H, Ancheta J, Ianelli J, Magnusson A, Maunder M, Nielsen A, Sibert J. 2011. AD Model Builder: using Automatic Differentiation for Statistical Inference of Highly Parameterized Complex Nonlinear Models. Optimization Methods and Software 27(2): 233–249. ISSN 1055-6788.
Gudmundsson 1994. Time series analysis of catch-at-age observations. Royal Statistical Society. Applied Statistics 43(1): 117-126. https://doi.org/10.2307/2986116
Hirst, D.J., Aanes, S., Storvik, G., Huseby, R.B., and Tvete, I.F. 2004. Estimating catch-at-age from market sampling data using a Bayesian hierarchical model. Appl. Stat. 53: 1–14.
Hirst, D.J., Storvik, G., Aldrin, M., Aanes, S. and Huseby, R.B 2005 Estimating catch-at-age by combining data from different sources. Can. J. Fish. Aquat. Sci: 62: 1377–1385.
Hirst, D.J., Storvik, G., Rognebakke, H., Aldrin, M., Aanes, S. and Vølstad, J.H. 2012. A Bayesian modelling framework for the estimation of catch-at-age of commercially harvested fish species. Can. J. Fish. Aquat. 69: 1–13. doi:10.1139/CJFAS-2012-0075
Holmin, A.J. 2020. Rstox: Running Stox functionality independently in R. R package version 1.11. https://github.com/Sea2Data/Rstox
ICES. 2014. Report of the third Workshop on Practical Implementation of Statistical Sound Catch Sampling Programmes, 19-22 November 2013, ICES HQ, Copenhagen, Denmark. ICES CM2013/ACOM:54. 109 pp. (Chaired by Jon Helge Vølstad and Mike Armstrong)
Johnsen, E., Totland, A., Skålevik, Å., Holmin, A.J., Dingsør, G.E., Fuglebakk, E. and Handegard, N.O. 2019. StoX: An open source software for marine survey analyses. Methods in Ecology and Evolution 10(9): 1523-1528.
Kristensen, K., Nielsen, A., Berg, C.W. and Skaug, H. 2016. TMB: Automatic Differentiation and Laplace Approximation. J. Stat. Softw. 70: 1-21.
Lumley, T. 2010. Compex Surveys. A Guide to Analysis Using R. John Wiley & Sons. Hoboken. 276 pp.
Løland, A., Aldrin, M., Ona, E., Hjellvik, V., and Holst, J.C. 2007. Estimating and decomposing total uncertainty for survey-based abundance estimates of Norwegian spring-spawning herring. ICES Journal of Marine Science 64(7): 1302-1312.
Nielsen, A. and Berg, C.W. 2014. Estimation of time-varying selectivity in stock assessments using state-space models. Fisheries Research 158: 96-101.
Shepherd, J.G. 1999. Extended survivors analysis: An improved method for the analysis of catch-at-age data and abundance indices. ICES Journal of Marine Science 56: 584–591.
Skogen, M.D, Svendsen, E., Berntsen, J., Aksnes, D. and Ulvestad, K.B. 1995. Modelling the Primary Production in the North Sea Using a Coupled Three-Dimensional Physical-Chemical-Biological Ocean Model. Estuarine, Coastal and Shelf Science 41, no. 5 (November 1, 1995): 545–65. https://doi.org/10.1016/0272-7714(95)90026-8.
Quinn, T.J. and Deriso, R.B. 1999. Quantitative fish dynamics. Oxford University Press, New York.
10 - Appendix 1 - Bibliography and code repositories
10.1 - Journal articles (peer reviewed)
10.1.1 - WP1 Fisheries-dependent (catch) surveys and assessment modeling
Aldrin, M., Aanes, S. and Subbey, S. 2019. Comments on incongruous formulations in the SAM (state-space assessment model) model and consequences for fish stock assessment. Fisheries research 210: 224-227, doi:10.1016/j.fishres.2018.08.001.
Aldrin, M., Tvete, I.F., Aanes, S. and Subbey, S. 2020. The specification of the data model part in the SAM model matters. Fisheries Research 229, Article Number 105585, doi:10.1016/j.fishres.2020.105585.
Jokar, M., Subbey, S. and Gjøsæter, H. 2021. A Logistic Function to Track Time-dependent Fish Population Dynamics. Fisheries Research 236 (105840)
Nakagawa, T., Subbey, S. and Solvang, H.K. 2018. Integrating Hawkes Process- and Biomass Models to Capture Impulsive Population Dynamics. Dynamics of continuous, discrete and impulsive systems Series B: Applications & Algorithms, 1-17 pp.
Solvang, H.K., Subbey, S. and Frank, A.S.J. 2017. Causal drivers of Barents Sea capelin (Mallotus villosus) population dynamics on different time scales. ICES Journal of Marine Science 75(2): 621-630.
Solvang, H.K. and Subbey, S. 2019. An improved methodology for quantifying causality in complex ecological systems. PLOS ONE 14: 1-19.
Subbey, S. 2018. Parameter estimation in stock assessment modelling: caveats with gradient-based algorithms. ICES Journal of Marine Science (doi:10.1093/icesjms/fsy044): 1-7.
In revision
Jourdain, N.O.A.S., Fuglebakk, E. and Subbey, S. 2020. Maturation in the Barents Sea capelin – Contrasting length- and gonad-based metrics. Fisheries Research
Allken, V., Handegard, N.O., Rosen, S., Schreyeck, T., Mahiout, T. and Malde, K. 2019. Fish species identification using a convolutional neural network trained on synthetic data. ICES Journal of Marine Science 76: 342–349.
Harbitz, A. 2019. A zigzag survey design for continuous transect sampling with guaranteed equal coverage probability. Fisheries Research 213: 151-159.
Holmin, A.J., Mousing, E.A., Hjøllo, S.S., Skogen, M.D., Huse, G. and Handegard, N.O. 2020. Evaluating Acoustic-Trawl Survey Strategies Using an End-to-End Ecosystem Model. ICES Journal of Marine Science. https://doi.org/10.1093/icesjms/fsaa120.
Jourdain, N.O.A.S., Breivik, O., Fuglebakk, E., Aanes, S. and Vølstad, J.H. 2020. Evaluation of sampling strategies for age determination of cod (Gadus morhua) sampled at the North Sea International Bottom Trawl Survey. ICES Journal of Marine Science 77(3): 859-869.
Ono, K., Kotwicki, S., Dingsør, G.E. and Johnsen, E. 2018. Multispecies acoustic dead-zone correction and bias ratio estimates between acoustic and bottom-trawl data. ICES Journal of Marine Science 75: 361–373. doi:10.1093/icesjms/fsx115.
Vatnehol, S., Peña, H. and Handegard, N.O. 2018. A method to automatically detect fish aggregations using horizontally scanning sonar. ICES Journal of Marine Science 75: 1803–1812.
Vatnehol, S. and Handegard, N.O. 2018. Echo integration using non-vertical sonar beams: The bias caused by non-uniform distribution of fish within the echo beam. The Journal of the Acoustical Society of America 144: 2160–2165.
In press
Breivik, O.N., Aanes, F., Søvik, G., Aglen, A., Mehl, S. and Johnsen, E. Predicting abundance indices in areas without coverage with a latent spatio-temporal Gaussian model. ICES Journal of Marine Science.
In preparation
Holmin, A.J., Korneliussen, R.J., Pena, H., Johnsen, E., Vatnehol, S. and Handegard, N.O. Comparison between fisheries acoustics sensors: The efficacy of omnidirectional sonars, scientific multibeam sonars and echo sounders.
Korneliussen, R.J., Pedersen, G., Holmin, A.J., Johnsen, E. and Handegard, N.O. Data processing and estimation using a scientific multi beam sonar.
10.1.3 - WP3 Evaluate and test long-term management strategies
Howell, D., Schueller, A.M., Bentley, J.W., Buchheister, A., Chagaris, D., Cieri, M., Drew, K., Lundy, M.G., Pedreschi, D., Reid, D. and Townsend, H. 2021 Combining ecosystem and single-species modelling to provide ecosystem-based fisheries management advice within current management systems. Frontiers in Marine Science 7: 607831, https://doi.org/10.3389/fmars.2020.607831
Kaplan, I.C., Hansen, C., Morzaria-Luna, H.N., Girardin, R. and Marshall, K.N. 2020. Ecosystem-based harvest control rules for Norwegian and US ecosystems. Frontiers in Marine Science 7: 652. doi: 10.3389/fmars.2020.00652
Nilsen, I., Kolding, J., Hansen, C. and Howell, D. 2020. Exploring Balanced Harvesting by Using an Atlantis Ecosystem Model for the Nordic and Barents Seas. Frontiers in Marine Science 7: 70. doi: 10.3389/fmars.2020.00070
Olsen, E., Hansen, C., Nilsen, I., Perryman, H. and Vikebø, F. 2019. Ecological Effects and Ecosystem Shifts Caused by Mass Mortality Events on Early Life Stages of Fish. Frontiers in Marine Science 6: 669. doi: 10.3389/fmars.2019.00669
Olsen, E., Fogarty, M.J., Fulton, E.A., Hansen, C., Kaplan, I.C., Otto, S.A. and Tam, J.C. 2020. Editorial: Future oceans under multiple stressors: from global change to anthropogenic impact. Frontiers in Marine Science. doi: 10.3389/fmars.2020.606538
Pethybridge, H.R., Weijerman, M., Perrymann, H., Audzijonyte, A., Porobic, J., McGregor, V., Girardin, R., Bulman, C., Ortega-Cisneros, K. and Sinerchia, M. 2019. Calibrating process-based marine ecosystem models: An example case using Atlantis. Ecological Modelling 412: 108822.
Sparholt, H., Bogstad, B., Christensen, V., Collie, J., van Gemert, R., Hilborn, R., Horbowy, J., Howell, D., Melnychuk, M.C. and Pedersen, S.A. 2020. Estimating Fmsy from an ensemble of data sources to account for density dependence in Northeast Atlantic fish stocks. ICES Journal of Marine Science. fsaa175, https://doi.org/10.1093/icesjms/fsaa175
In revision or review
Bentley, J.W., Lundy, M.G., Howell, D., Beggs, S.E., Bundy, A., De Castro, F., Fox, C., Heymans, J.J., Lynam, C.P., Pedreschi, D., Schuchert. P., Serpetti, N., Woodlock, J. and Reid, D. In review. Operationalizing ecosystem information for fisheries advice. Submitted to Frontiers in Marine Science.
Goto, D., Devine, J.A., Umar, I., Fischer, S.H., De Oliveira, J.A.A., Howell, D., Jardim, E., Mosqueira, I. and Ono, K. In review. A precautionary solution to estimation bias in shaping safe harvest boundaries. Submitted to Ecological Applications. Preprint: https://doi.org/10.1101/2020.12.05.413070
Goto, D., Filin, A.A., Howell, D., Bogstad, B., Kovalev, Y. and Gjøsæter, H.. In revision. Trade-offs of managing Arctic predator harvest in fluctuating oceans. Submitted to Ecological Applications. Preprint: https://doi.org/10.1101/2020.06.17.154971
Hansen, C., van der Meeren, G., Loeng, H. and Skogen, M.D. In review. Assessing the state of the Barents Sea using indicators. How, when and where? Submitted to ICES Journal of Marine Science.
Perryman, H.A., Hansen, C., Howell, D. and Olsen, E. In review. A review of applications evaluating fisheries management scenarios through marine ecosystem models. Submitted to Reviews in Fisheries Science and Aquaculture.
In preparation
Lam, M., Pitcher, T., Szymon, S. and Perryman, H.A. Simulating management strategies for Norwegian Spring-Spawning Herring (Clupea harengus) under an ecosystem context: a comparison between Ecopath with Ecosim and Atlantis.
Perez-Rodríguez, A., Howell, D., Umar, I. and González, D. Estimation of multispecies based HCRs using a multispecies MSE framework to assess the risk of collapse and the fishery-ecological trade-offs.
Perez-Rodríguez, A., Howell, D., Umar, I. and González, D. How important is accuracy of natural mortality in stock assessment? The Flemish Cap demersal fisheries in NAFO as a case study.
Perryman, H.A., Lam, M., Hansen, C. and Howell, D. Simulating management strategies for Norwegian Spring-Spawning Herring (Clupea harengus) under an ecosystem context.
Perryman, H.A., Hansen, C., Howell, D. and Olsen, E. Exploring bias in the Norwegian Spring Spawning Herring and Northeast arctic cod: How does bias impact the performance of two different fisheries?
10.2 - Popular science articles
10.2.1 - WP3 Evaluate and test long-term management strategies
Rogne, S. and Olsen, E. 2019. «Oljesøl kan gi varige skader på økosystem i havet» Op-ed in Aftenposten, 5th November 2019
10.2.2 - WP4 Communication of uncertainty, dissemination of project results, capacity building and project coordination
Olsen, E. and Rogne, S. 2016. “Torsken, en feit og fin og norsk en” Op-ed (kronikk) in Bergens Tidende, 30th June 2016
Olsen, E. 2018. «Nye verktøy gir forskerne flere svar om skreien» Op-ed in FiskeribladetFiskaren, 6th June 2018
10.3 - Other articles & reports
10.3.1 - WP1 Fisheries-dependent (catch) surveys and assessment modeling
Aanes, S. 2016a. A statistical model for estimating fish stock parameters accounting for errors in data: Applications to data for Norwegian Spring-spawning herring. WD4 in ICES. 2016. Report of the Benchmark Workshop on Pelagic stocks (WKPELA), 29 February–4 March 2016, ICES Headquarters, Copenhagen, Denmark. ICES CM 2016/ACOM:34. 106pp.
Aanes, S. 2016b. Diagnostics of models fits by XSAM to herring data. WD12 in ICES. 2016. Report of the Benchmark Workshop on Pelagic stocks (WKPELA), 29 February–4 March 2016, ICES Headquarters, Copenhagen, Denmark. ICES CM 2016/ACOM:34. 106pp.
Aanes, S. 2016c. Forecasting stock parameters of Norwegian spring spawning herring using XSAM. WD in ICES. 2016. Report of the Working Group on Widely Distributed Stocks (WGWIDE), 31 August-6 September 2016, ICES HQ, Copenhagen, Denmark. ICES CM 2016/ACOM:16. 500 pp.
Breivik, O.N., Nielsen, A. and Aanes, S. 2019. Working document for AFWG2019: Using structures from
XSAM in the NEA cod assessment. (link)
ICES. 2016a. Report of the Benchmark Workshop on Pelagic stocks (WKPELA), 29 February–4 March 2016, ICES Headquarters, Copenhagen, Denmark. ICES CM 2016/ACOM:34. 106pp.
ICES. 2016b. Report of the Working Group on Widely Distributed Stocks (WGWIDE), 31 August-6 September 2016, ICES HQ, Copenhagen, Denmark. ICES CM 2016/ACOM:16. 500 pp.
ICES. 2017a. Report of Inter-benchmark protocol on Northeast Arctic cod (IBP ARCTIC COD 2017), Copenhagen, 3-6 April 2017. ICES CM 2017/ACOM:29.
ICES. 2017b. Report of the Working Group on Widely Distributed Stocks (WGWIDE), 30 August -5 September 2017, ICES Headquarters, Copenhagen, Denmark. ICES CM 2017/ACOM:23. 1111 pp.
ICES. 2018a. Report of the Workshop on the determination of reference points for Norwegian Spring Spawning Herring (WKNSSHREF), 10–11 April 2018, ICES Headquarters, Copenhagen, Denmark. ICES CM 2018/ACOM:45. 83 pp.
ICES. 2018b. NEAFC request concerning long-term management strategy for herring in the Northeast Atlantic (Norwegian spring-spawning herring). In Report of ICES Advisory Committee, 2018. ICES Advice 2018, sr.2018.17.
ICES. 2018c. Report of the Working Group on Widely Distributed Stocks (WGWIDE), 28 August- 3 September 2018, Torshavn, Faroe Islands. ICES CM 2018/ACOM: 23. 488 pp.
Johannesen, E., Johnsen, E., Johansen, G.O. and Korsbrekke, K. 2019. STOX APPLIED TO COD AND HADDOCK DATA FROM THE BARENTS SEA NOR-RUS ECOSYSTEM CRUISE IN AUTUMN Swept area abundance, length and weight at age 2004-2017. Fisken og havet nr. 2019-6.
Korneliussen, R., Peña, H. and Holmin, A.J. 2019. Vertical distribution of herring from sonars during international ecosystem survey in Nordic seas (IESNS) in May 2019. Internal cruise report. Institute of Marine Research, P. O. Box 1870. N-5024 Bergen, Norway. 8 pp.
Mehl, S., Aglen, A. and Johnsen, E. 2016. Re-estimation of swept area indices with CVs for main demersal fish species in the Barents Sea winter survey 1994–2016 applying the Sea2Data StoX software. Fisken og havet nr. 10-2016.
Mehl, S., Aglen, A., Johnsen, E. and Skålevik, Å. 2018. Estimation of acoustic indices with CVs for cod and haddock in the Barents Sea winter survey 1994 – 2017 applying the Sea2Data StoX software. Havforskningsinstituttet, Bergen, Norge. Fisken og Havet nr. 5-2018.
Peña, H. 2017. School observations using omni directional fisheries sonar during international ecosystem survey in Nordic SEA (IESNS) in May – June 2017. Internal cruise report. Institute of Marine Research, P. O. Box 1870. N-5024 Bergen, Norway. 9 pp.
Peña, H. 2020a. Vertical distribution of herring from omni directional fisheries sonar during international ecosystem survey in Nordic SEA (IESNS) in May – June 2020. Internal cruise report. Institute of Marine Research, P. O. Box 1870. N-5024 Bergen, Norway. 7 pp.
Peña, H. 2020b. Vertical distribution of herring from omni directional fisheries sonar during international ecosystem survey in Nordic SEA (IESNS) during 2020. [PowerPoint presentation]. ICES Working group of International Pelagic Surveys, post-cruise online meeting, 16 June 2020.
Peña, H and Holmin, A.J. 2019. Vertical distribution of herring from omni directional fisheries sonar during international ecosystem survey in Nordic SEA (IESNS) from 2017 to 2019. [PowerPoint presentation]. ICES Working group of International Pelagic Surveys, post-cruise meeting, Bergen, 15 January 2020.
Vatnehol, S. and Peña, H. 2018. Observations of Norwegian spring spawning herring (NSSH) using fisheries sonar during international ecosystem survey in Nordic SEA (IESNS) in May – June 2018. Internal cruise report. Institute of Marine Research, P. O. Box 1870. N-5024 Bergen, Norway. 9 pp.
10.3.3 - WP3 Evaluate and test long-term management strategies
ICES. 2018. Report of the Workshop on the evaluation of harvest control rules for Sebastes mentella in ICES areas 1 and 2 (WKREBMSE), June–August 2018, by correspondence. ICES CM 2018/ACOM:52. 32 pp.
ICES. 2019a. Workshop on North Sea stocks management strategy evaluation (WKNSMSE). Edited by J. De Oliveira. ICES Scientific Reports. 1:12. 347 pp.
ICES. 2019b. Workshop on Guidelines for Management Strategy Evaluations (WKGMSE2). Edited by C. Fernández. ICES Scientific Reports. 1:33. 162 pp.
ICES. 2020a. Workshop on Catch Forecast from Biased Assessments (WKFORBIAS; outputs from 2019 meeting). ICES Scientific Reports. 2:28. 38 pp. http://doi.org/10.17895/ices.pub.5997
ICES. 2020b. The Third Workshop on Guidelines for Management Strategy Evaluations (WKGMSE3). Edited by J. De Oliveira. ICES Scientific Reports. 2:116. 112 pp.
10.4 - Theses
Kelly, C. 2019. Evaluating the utility of a Novel Harvest Control Rule in the management of long-lived sporadically recruiting species through Management Strategy Evaluation. Master thesis. The University of Bergen. http://hdl.handle.net/1956/20734
10.5.1 - WP1 Fisheries-dependent (catch) surveys and assessment modeling
Aanes, S. 2020. Efficient use of data in stock assessment. Presented at ICES workshop.
Aanes, S. and Vølstad, J.H. 2016. Self-sampling of the Norwegian Springs Spawning Herring fishery – optimizing data collections to achieve sufficient precision in stock assessment. ICES CM 2016/O:467 s. ICES Annual Science Conference; 2016-09-19 - 2016-09-23
Azevedo, M., Silva, C. and Vølstad, J.H. 2016. Modeling length distribution by commercial size category to estimate species catch length composition for stock assessment. ICES CM 2016/O:170. ICES Annual Science Conference; 2016-09-19 - 2016-09-23
Breivik O.N. 2019. Time varying observation variance in stock assessment, and a spatial model for estimating abundance of marine mammals. 15. October 2019, Seminar, NOAA Woods Hole, USA.
Currie, D., Dubroca, L., Fuglebakk, E., Håkansson, K. B., Kjems-Nielsen, H., Leuzer, T. and Prista, N. 2018. Towards a Regional Database and Estimation System for fisheries. In G. A, F. M, and V. Tosello (Eds.), (pp. 209–210). Presented at the International Conference on Marine Data and Information Systems, Barcelona.
ldrin, M., Aanes, S., Tvete, I.F. and Subbey, S. 2020. The data model part of SAM matters. Presented at ICES workshop WKRFSAM - Workshop on the Review and Future of State Space Stock Assessment Models in ICES, 21.-23. January 2020, Copenhagen, Denmark.
Vølstad, J.H. 2017. Developing a sampling scheme to evaluate Norwegian marine recreational fisheries. University of Florida, Fisheries and Aquatic Sciences, Fisheries Seminar; 2017-05-19 - 2017-05-19
Vølstad, J.H. 2017. Maximizing effective sample size for estimating age-composition of annual catch in a commercial fishery - A case study from Norway. University of Florida, Fisheries and Aquatic Sciences, Fisheries Seminar; 2017-02-17 - 2017-02-1.
Vølstad, J.H. 2018. Commercial marine fisheries i Norway: Towards science-based management in collaboration with industry– herring as an example (Key-note presentation). “The future of fishery in the Western Baltic”; 2018-11-19 - 2018-11-19
WKRFSAM - Workshop on the Review and Future of State Space Stock Assessment Models in ICES, 21.-23. January 2020, Copenhagen, Denmark.
Holmin, A.J., Johnsen, E., Handegard, N.O., Totland, A., Skålevik, Å. and Mehl, S. 2018. Sensitivity analysis of acoustic-trawl and swept area survey estimates. ICES CM 2018/J:438. ICES Annual Science Conference; 2018-09-24 - 2018-09-27
Vatnehol, S., Holmin, A.J., Johnsen, E. and Handegard, N.O. 2018. Assessing bias sources on fisheries independent surveys by using supplementary vertical distribution. ICES CM 2018/J:303. ICES Annual Science Conference; 2018-09-24 - 2018-09-27
10.5.3 - WP3 Evaluate and test long-term management strategies
De Oliveira, J.A.A., Fischer, S.H., Berges, B., Cole, H.S., Devine, J.A., Goto, D.,Hintzen, H.T., Miethe, T., Mosqueira, I., Umer, I., Walkerm, N.D. and Jardim, E. 2019. The challenges for ICES raised by conducting full MSEs for some jointly-managed stock in the North Sea. ICES Annual Science Conference. Gothenburg, Sweden. 9-12 September.
Goto, D. 2020. Effects of uncertainty on risk assessments in management strategy evaluation. The Third Workshop on Guidelines for Management Strategy Evaluations (WKGMSE3). Online via Webex. 26–30 October.
10.5.4 - WP4 Communication of uncertainty, dissemination of project results, capacity building and project coordination
Olsen, E., Søvik, G. and Dankel, D. 2017. Uncertain communication of uncertainty. ICES CM 2017/S:444. ICES Annual Science Conference, 18-21 September 2017, Fort Lauderdale, Florida.
Søvik, G. 2017. Bestandstabellen? Hvilken nytte kan fiskerne ha av den? Usikkerhetsseminar. 31. januar, Myre.
Søvik, G. 2018. Kommunikasjon av usikkerhet i forskning og råd. Åpent fiskermøte om ressursforskning. 17. september, Bekkjarvik.
Søvik, G. 2019. Synliggjøring av informasjon og kommunikasjon av usikkerhet. REDUS-seminar med fiskerinæringen: Hvordan redusere usikkerheten i fiskerirådgivingen for bunnfiskeriene? 28. oktober, Ålesund.
10.6 - Software and code
All software developed during the REDUS project has been collated in a code repository available at: https://redus-imr.github.io/codes/. In the repository each piece of code is described, linked to the original repository (e.g. package) if available and examples of working code showed in a Jupyter Notebook (that is run using a web interface). As the repository gives all the details of the code, below we only present the names and short descriptions of the various REDUS code available.
10.6.1 - WP1 Fisheries-dependent (catch) surveys and assessment modeling
10.6.1.1 - Library for multi-stage estimation
Library for design-based estimation and bootstrap estimation from multi-stage sampling designs. Contains functions for estimation from unequal probability sampling, and example data from the Catchlottery-sampling.
10.6.1.2 - Prototype for RDBES conversion
Prototype for RDBES conversion, preparing data for the RDBES test data call in 2020 (Herring and Blue Whiting). Prepares landings and efforts, and samples from catch lottery and other fisheries-targeted sampling (missiontype 1 and 19).
10.6.1.3 - Reporting functions for StoX-Reca
Contains functions and example scripts for generating commonly requested reports from StoX-Reca projects (StoX v2.7).
10.6.1.4 - Library for Fisheries Dependent Analysis
Library for Fisheries Dependent Analysis. Contains a generic interface to Reca, which facilitate adaptation of Reca to many kinds of data formats, and functions for plotting results. Also contains various support functions for fisheries dependent analysis.
10.6.1.5 - Snapshot-extraction
Tool for fetching date-versioned data via NMD-biotic API. E.g. Extract the data as they were on a given date in the past.
10.6.1.6 - Coastal cod analysis with Reca
Contains script for using Rstox and Reca run catch at age estimate for coastal-cod and NEA cod with stock split estimated from otolith-typing, and area definitions incorporating 12-nm delimiter.
10.6.1.7 - Reca support in Rstox
Functions for preparing data for Reca and for plotting results and reports
10.6.1.8 - Easy RECA Package
Reca is a package made for the Institute of Marine Research. The package produces predictions of catch-at-age, i.e. the number of fish caught within each age group, of different fish species. This is a testing version of a universal platform RECA package with OpenBLAS.
A Shiny app for examination and manipulation of the Norwegian Maritime Data Center (NMD) standard Biotic xml files as well as the IMR’s Biotic database.
10.6.2.2 - Echosounder comparison tool
An R package to visually check and compare multiple echosounder data from different sources (NMD, CES, BEI, etc.) that are coming from the same cruise.
10.6.2.3 - Python EchoTools
A collection of Python scripts that can help in organizing all of the IMR’s acoustic raw data and LSSS databases. This tools also supports an automatic batch processing of the raw data to produce LUF20 reports by utilizing LSSS application.
10.6.2.4 - RstoxData
Set of tools to read and manipulate various data formats for fisheries. Mainly catered towards scientific trawl survey sampling (‘biotic’) data, acoustic trawl data, and commercial fishing catch (‘landings’) data. Among the supported data formats are the data products from the Norwegian Institute Marine Research (‘IMR’) and the International Council for the Exploration of the Sea (ICES).
10.6.2.5 - Survey time series tools
An R package containing survey time series tools. One tool in the package enables users to download a complete StoX’s survey time series project (StoX project file + biotic data + acoustic data). A drop-in replacement of the deprecated NMD datasetexplorer’s ZIP download feature. Another tool enables users to check if their own survey time series’ StoX project XML file is correct (i.e., can be processed and produces official estimates) or not.
10.6.2.6 - Various useful snippets
This is a collection of some scripts that can be useful for processing the IMR biotic data version 3 using R program. One script is for downloading a whole cruise and flattening the tables into one big table, while another one is for adding the missing scientific names for all the samples
10.6.2.7 - Trawl Performance Report
Program that reads the trawl sensors data (Scanmar data and toktlogger REF files) to create a report. The report gives insights on when a trawl is performing correctly or when there is something that needs to be looked into further (i.e., opening height is too low/high or the trawl did not have good bottom contact, etc).
10.6.2.8 - IBTSNorthSea: sampling strategies for age determination of cod (Gadhus morhua)
The North Sea cod stock assessment is based on indices of abundance-at-age from fishery-independent bottom trawl surveys. The age structure of the catch is estimated by sampling fish for otoliths collection in a length-stratified manner from trawl hauls. Since age determination of fish is costly and time consuming, only a fraction of fish is sampled for age from a larger sample of the length distribution and an age–length key (ALK) is then used to obtain the age distribution. In this study, we evaluate ALK estimators for calculating the indices of abundance-at-age, with and without the assumption of constant age–length structures over relatively large areas. We show that the ALK estimators give similar point estimates of abundance-at-age and yield similar performance with respect to precision. We also quantify the uncertainty of indices of abundance and examine the effect of reducing the number of fish sampled for age determination on precision. For various subsampling strategies of otoliths collection, we show that one fish per 5-cm-length group width per trawl haul is sufficient and the total number of fish subsampled for age from trawl surveys could be reduced by at least half (50%) without appreciable loss in precision.
10.6.3 - WP3 Evaluating and testing of long-term management strategies
10.6.3.1 - Evaluating the utility of a Novel Harvest Control Rule in the management of long-lived sporadically recruiting species through Management Strategy Evaluation
The code for the masters thesis work with the above title. Contains a Novel HCR, which reflected an Escapement HCR, was tested on a stock whose dynamics was informed by Greenland halibut (Reinhardtius hippoglossoides). The code is implemented as a modification of the FLBEIA software (https://github.com/flr/FLBEIA).
10.6.3.2 - Ecological effects and ecosystem shifts caused by mass mortality events on early life stages of fish
The following deposition contains scripts for creating the figures in Olsen et al. (2019). This deposition includes example files for executing the code. The files are inputs and outputs to/from the Norwegian and Barents Seas Atlantis model.
10.6.3.3 - Atlantis-R interface
The marine ecosystem model Atlantis is structured following the MSE framework, meaning Atlantis simulates both the operating model and the management procedure. This is an advantageous feature for simulating MSE under and ecosystem-based context, however it may be cumbersome to program complicated/specific management procedures into Atlantis. To integrate Atlantis into the REDUS framework, Atlantis was programmed to send/receive data back and forth with the statistical software R. With this new functionality, Atlantis can be treated solely as an operating model while R is used to simulate the management procedure. Thus, management procedures previously programmed in R can now be simulated under an ecosystem-based context within Atlantis.
10.6.3.4 - GadgetR
GadgetR is an R library that allows users to create a two-way interface to the simulation function (via a “gadget -s” command line switch) of Hafro’s Globally applicable Area Disaggregated General Ecosystem Toolbox (Gadget) program. To simply put, GadgetR provides users flexibility to explicitly control gadget simulation steps, and inspect and modify (as needed) gadget internal objects (such as recruitment parameters, fleet consumption amount, among others) at any point in time during the simulation. These functionalities are especially useful when you want to use a gadget model as an operating model (single or multi- species) in existing management strategy (MSE) frameworks in R (FLR/mse or FLBEIA). GadgetR ships with the latest Gadget program (version 2.2.00-BETA) and retains all of the original Gadget program functionality.
10.6.3.5 - Multi Fleet Deterministic Projection (MFDP)
Program for the fisheries short-term prediction. Allows for multi-fleet catch constraints and multi-annual prediction. This program is an attempt to re-create the original Multi Fleet Deterministic Projection (MFDP) program for fisheries in R.
10.6.3.6 - MSE Framework
FLR-Gadget is a Management Strategy Evaluation (MSE) framework using FLR (The Fisheries Library in R) mse (https://github.com/flr/mse) with an R package of customized Gadget (Globally applicable Area Disaggregated General Ecosystem Toolbox, https://github.com/Hafro/gadget2), GadgetR (https://github.com/REDUS-IMR/gadget), as an operating model (OM). This framework is designed to run single and multi- species MSEs. The OM can be age- or length- based. The framework runs short-cut and full-feedback MSEs. Currently, a4a (Assessment for All, https://github.com/flr/FLa4a) statistical catch-at-age model and SAM (State-space Assessment Model, https://github.com/flr/FLSAM) are implemented as an assessment model.
10.6.3.7 - mse-bootstrap-gcp
Scripts for running the North Sea Saithe Management Strategy Evaluation (MSE) on Google Cloud Platform (GCP)
10.6.3.8 - North Sea saithe Management Strategy Evaluation (MSE)
A management strategy evaluation (MSE) framework for North Sea saithe (Pollachius virens) in Subareas 4, 6 and Division 3.a (North Sea, Rockall and West of Scotland, Skagerrak and Kattegat) developed using the Fisheries Library in R mse package as part of the Workshop on North Sea stocks Management Strategy Evaluation (WKNSMSE).
10.6.4 - WP4 Communication of uncertainty, dissemination of project results and capacity building
10.6.4.1 - Fishdocker
A collection of Dockerfile, or the recipe to create images that will be used inside a container (e.g., REDUS framework and portable Rstox images). This collection is an important element of the REDUS Assessment Frameowrk.
10.6.4.2 - REDUS Framework app
This repository contains the cloud-based REDUS framework’s backend and frontend systems.
The frontend provides user with the framework’s runtime configuration and control, as well as a set of “live” panels that connect directly into the framework’s docker machine. The current available panels are the file manager, console terminal, and log viewers. The frontend system uses Vue.js, Bootstrap + Vue, and axios HTTP client.
The backend system responsible for generating runtime configurations for the framework, creating docker machines and starting them, and providing http/websocket proxy tunnels to make file manager, console terminal, and log viewers available to the users. The backend system utilizes NodeJS, Docker, and Docker Machine.
10.6.4.3 - REDUStools
REDUStools is an R package (source) that can periodically process all the available IMR survey time series and store the results in file-backed database in the server. REDUStools also provides APIs for getting the survey time series results and gives users two sets of front-ends to explore the stored results. This package is the important piece of code for the REDUS Assessment Framework.
10.6.4.4 - SAM-course
SAM-course held at IMR
10.6.4.5 - TMB courses
TMB course held at IMR
11 - Appendix 2 – The REDUS Science plan
11.1 - Summary
There are unknown uncertainties surrounding stock assessment and the whole fishery advisory process. The lack of knowledge of these uncertainties is costly in terms of suboptimal management, monitoring and advice. ICES, the Norwegian Government, the Norwegian Research council and others have therefore identified more precise and accurate stock assessment as a key development challenge within fisheries. Recent model and data infrastructure developments make it realistic to quantify uncertainty from observations through stock assessment to advice. The REDUS project will provide a seamless and generic framework for uncertainty estimation and analysis that will allow for more optimal fisheries management (e.g., potential higher long-term quotas) and better prioritization of fisheries monitoring and research. By coupling measures of survey and observational uncertainty with stock assessment models that account for uncertainty this provides the basis for harvest control rules and management strategy evaluation leading to providing statistically robust measures of uncertainty for quota advice and long-term harvest strategies alike. REDUS will build a generic Open Access toolbox founded on the StoX package and the S2D format that has a potential universal application in renewable marine resource management.
11.2 - Aims and objectives
Aim
Achieving reduced uncertainty in stock assessment and advice for our most important fish stocks.
Objective
Develop and implement the ability to quantify and communicate the trade-offs and risks caused by varying levels of uncertainty of stock assessment and management advice from: i) observations, ii) stock assessment modeling, iii) management strategy evaluation (including harvest control rules), and iv) real-world implementation in practical fisheries management.
The REDUS project will use both a bottom-up approach (from observations through management) and a top-down (society’s uncertainty requirements implications for observations). Thus, REDUS will provide society with knowledge of how uncertainty affects stock assessment and hence quota advice, and complementary how much catches can increase if we reduce this uncertainty.
11.3 - Relevance of the REDUS project
Sustainable and precautionary management is widely acknowledged as a central pillar of ecosystem-based fisheries management (EBFM, see Pikitch et al 2004, Link 2010). Understanding how different human factors and actions affect the ecosystem is a key to sustainable fisheries management, but without knowledge of the uncertainty associated with each factor alone, or the compounded total uncertainty, it is fruitless to compare different management options. Perceived differences might be statistically insignificant, or the effect of changes in fishing, monitoring or management might be impossible to evaluate, all because the uncertainties are too high. The sources of uncertainty in fisheries advice and management are complex and compounded, but it is essential to be able to estimate the magnitude of this uncertainty and how it affects the various steps in the advisory process, leading up to management decisions: observation of stock status, stock assessment, stock projection and stock advice. Once this uncertainty can be pinpointed and quantified it will be possible to estimate the total uncertainty associated with a particular advice, discuss this with stakeholders and decision-makers to reach a common understanding of the management implications of the given levels of uncertainty leading specifically to how much precaution must be included in the quota setting to avoid detrimental stock or ecosystem impacts. Conversely, a comprehensive understanding of the uncertainty allows society to a priori set thresholds for uncertainty of advice, and from this managers and scientists can infer which monitoring and assessment efforts and tools are necessary to reach the target set by society. Understanding uncertainty will make the fisheries management process more transparent and understandable for stakeholders and experts alike, identifying and prioritizing areas for improvement that will lead to direct benefits for the fishing industry in terms of more predictable stock advice. Therefore, both the Norwegian Government and the Norwegian Research Council place high priority on improving the methods for fish stock assessment (see: “Masterplan for marin forskning” and “Marine Ressurser og Miljø - MARINFORSK. Programplan 2016-2025”).
11.4 - Background and state of the art
The premise for reducing uncertainty in stock assessments is that sources of errors in input-data and modeling errors can be quantified. Stock assessments that form the basis for scientific advice for many commercially important stocks in Europe often provide point estimates of stock parameters (e.g., SSB, F), with no measures of uncertainty, and annual catch recommendations that consist of a single number (Dankel et al. 2016). Since stock assessment outputs and predictions used for quota advice always will be subject to different types of uncertainty, it is important to (i) quantify sources of errors in input-data, observation methods and sampling regimes and how they propagate to stock assessment and advice, (ii) test the robustness of the quota advice, harvest control rules and management strategies to different types of uncertainty and (iii) have a clear and transparent dialogue with the resource users and decision-makers to communicate uncertainties and risks. ICES is asking for the next generation of assessment models that can incorporate uncertainty in complex input data from multi-stage sampling surveys and quantify how errors propagates to stock assessment and advice (e.g., WCSAM 2013, World Conference on Stock Assessment Methods for Sustainable Fisheries).
Analytical stock assessments in ICES are based on data from fisheries-independent as well as fisheries-dependent sampling surveys, with inherent uncertainty due to sampling errors and various sources of bias. Historically, yearly point estimates of abundance-indices and catch by age-class have been used as input-data to VPA type of models. The uncertainty in estimated catch at age has generally been ignored and errors in input data have been assigned solely to abundance indices in various methods for tuning the VPA (e.g., Shepherd 1999). Gudmundsson (1994), Quinn and Deriso (1999), Aanes et al (2007), Gudmundsson and Gunnlaugsson (2012), and Nielsen and Berg (2014) (and references therein) provide alternative statistical assessment models that can provide measures of uncertainty in estimated stock-parameters. To account for spatial variability in demographic rates and population variables Thorson (2015) has developed a delay difference model that helps explain large portions of parameter variance and hence reduce model uncertainty. In REDUS we will focus on the further development and parameterization of statistical assessment models that can integrate data with varying accuracy (bias and precision) from multiple sources.
11.5 - Scientific problems, hypotheses and research approach
11.5.1 - Accuracy of input-data to stock assessments
Time series derived from combining biological sampling from commercial fisheries with official surveys and scientific abundance surveys are critical to stock assessments and quota advice. Such long-term monitoring is costly, and it is therefore crucial to employ cost-effective survey designs and efficient estimators to minimize errors. The overall aim for a design-based sampling strategy (e.g., Særndal 1978; Gregoire 1998) is to:
Collect data in a way that accuracy (bias and precision) can be reliably assessed at national and regional level
Ensure that sampling intensity is allocated in a way that would minimize bias and maximize precision at the level where it matters most in the assessment of stocks and fisheries
We follow Jessen and Jessen (1978) and use the term accuracy as a measure of the proximity of an estimate to the true value (i.e., high accuracy signifies high precision and low bias). It is useful to evaluate the accuracy of input-data to stock assessments within the framework of “total survey design,” which is defined as the attempt to control the total error in the estimates derived from survey data (Lessler and Kalsbeek 1992). In sampling theory, the total error is generally divided into variable errors and bias (e.g., Cochran 1977). Bias refers to systematic errors that cause the average survey value to deviate from the true population value under a specific survey design. Bias can be reduced by employing unbiased statistical estimators, improving the survey designs and coverage, and by reducing measurement errors. In this project, we will try to control the total error in input-data to stock assessments, and choose the combination of sampling design, measurement procedure, and estimators that will minimize the total errors within the resources available for monitoring. In the literature, this has been referred to as total survey design (e.g., Lessler and Kalsbeek, 1992).
It is useful to separate sources of errors in input-data to stock assessments into three broad categories: (1) Sampling errors, (2) Coverage errors, and (3) Measurement errors.
Sampling error reflects the degree to which a survey statistic (e.g., estimated number of fish per age-class in the total yearly catch of a species) differs from the “true” value due to the fact that one particular survey only realizes one of nearly infinitely many possible survey samples. Small sampling errors for a survey statistic signify high precision, i.e., the estimate from one sample is close to the average over repeated samples (see Jessen and Jessen 1978).
Coverage error is the degree to which statistics such as estimated abundance indices in number of fish per age-class, based on yearly scientific trawl surveys, are off due to the fact that the available biological samples from the trawls do not properly represent the entire target population.
Measurement error is the degree to which a survey statistic differs from the targeted population value due to imperfections in the way the data from each sample is collected. In scientific abundance surveys, sampling is typically conducted using trawls, plankton nets, and acoustic methods.
REDUS will develop analytical methods for an objective framework to evaluate the benefits versus costs of data sets used to support stock assessment and fishery management advice, where the benefits are in terms of accuracy (bias and precision) of assessment results and derived management variables, and risks to stocks associated with management under uncertainty. This framework will be used to evaluate existing data sets, new data requests from end users, survey design, spatial and temporal coverage, and cost-effective allocation of sampling effort towards the components of data collection that have the greatest influence on quality of assessments and management decisions for particular stocks or groups of stocks.
11.5.2 - Management Strategy Evaluation (MSE)
A key goal of the REDUS project is to answer the critical questions concerning the utility of knowledge on uncertainty in data (both fisheries and survey) for long term stock management. Given the precautionary principle one would expect that reducing and understanding such uncertainties would allow for higher long-term yield while retaining a low probability of overfishing the stock. All of these questions are suited for investigation via Management Strategy Evaluations (MSEs), given a sufficiently flexible software tool. A Management Strategy Evaluation combines an “operating model” (simulating the real world) with an “assessment model” to simulate the assessment and advice-giving cycle as accurately as possible. “Data” on surveys and catches are taken from the operating model, and have errors applied. These are then used to tune an assessment model, which gives an estimate of stock size. This estimate is then applied to the HCR in order to produce a quota, which in turn is input into the operating model (possibly with implementation errors), and the cycle repeated. Such a system allows for HCRs to be evaluated in a realistic setting, but also allows for the performance of the assessment model and the impact of various sources of error to be investigated. In many cases around the world today a slightly simplified version of this procedure is used, with the “assessment model” replaced by exact knowledge of the stock (to which errors can be added). Currently IMR uses this procedure, employing a tool called “PROST” to evaluate harvest control rules (HCRs), but this tool does not offer full MSE (PROST does not include an assessment model). Such simplified procedures are simpler to develop than “full MSE simulations” and are able to evaluate HCRs provided that the assessment model in use is simple. However, they apply errors to output of the assessment model, not to the inputs (e.g., survey indices, fisheries data, age determination), and hence are not suited to evaluating more complex assessment models or evaluating how such models behave when given knowledge of uncertainties in different input datasets. Nor do the tools currently in use allow for multi-species or ecosystem operating models, and therefore cannot incorporate uncertainties that arise from multispecies interactions. Consequently, there is a need at IMR to develop such a tool. A particular challenge to address is to allow for complex correlated input-data resulting from multi-stage sampling. This will be addressed in close cooperation with WP1, where variance-covariance matrices for catch-at-age and abundance indices at age will be estimated and included in the statistical assessment modelling.
11.5.3 - Data infrastructure
The S2D project has developed an application interface (API) to the main data sources for the project. This includes fisheries independent data from scientific surveys, including interpreted acoustic nautical area scattering coefficients (NMDechosounder) and biological data from trawl samples (NMDbiotic). ICES have a adopted similar structure for trawl samples (DATRAS) and acoustic data (AtlantOS project). A thin software client on top of the API can be accessed through http://tomcat7.imr.no:8080/DatasetExplorer/v1/html/main.html. Fisheries-dependent survey sample data are currently being uploaded to NMDbiotic, and will be available through the course of the project. Landing data is currently available via flat text files, updated every 2nd month, but there is a proposal to include this in the NMD API to streamline data access. Intercatch is a web-based system where stock coordinators upload aggregate estimates of catch-at-age that is combined to represent the total catches of a stock. The aggregated output files can then be downloaded to be used as input to ICES stock assessments. In general, these estimates are not provided with associated variances, and since they are aggregated, the variances cannot be estimated for total catch-at-age.
The Sea2Data project has developed the StoX software (http://www.imr.no/forskning/prosjekter/stox/nb-no) and R-libraries (R-StoX and R-ECA) for calculating statistics based on data from the surveys, and these are interfaced with the NMD API described above. These libraries are released under GPL and fully versioned under SVN. The software packages are being adjusted and implemented in ICES under the AtlantOS project. The output from the StoX software is used as input to the stock assessment models (NSS Herring). The framework will extended to other modules like the assessment models and HCR offering an efficient infrastructure for the whole REDUS data and estimation processing pipeline.
11.5.4 - Test case species
The REDUS analytical framework will be generic, in essence being applicable to all species the IMR gives advice on. For development two test case stocks, the Norwegian spring-spawning (NSS) herring and the Northeast Arctic (NEA) cod, will be in focus, but REDUS methods will be applied to other stocks as soon as they have been tested and verified. Cod and herring are chosen because of the extensive and long time-series of data that exist from catch and scientific surveys. Also, these two species form the basis for the two most valuable Norwegian fisheries. Finally, the NSS herring stock assessment has been under intense public scrutiny and debate, while the NEA cod stock is presently declining from a record high abundance. Therefore, both these species are in need for improved stock assessment and advisory processes where uncertainty should be dealt with explicitly and openly.
Norwegian spring-spawning herring
Norwegian spring-spawning herring (Clupea harengus) constitutes the largest herring stock in the world and supports a highly valuable fishery. The NSS herring stock is assessed annually using a virtual population analysis (VPA) type model applied to estimates of fishery catch-at-age data and fishery-independent indices from research surveys for calibration (‘tuning’). The NSS herring stock is characterized by occasionally large year-classes that dominate the fishery for many years. Combined with its wide-ranging pelagic behaviour and high-biomass, makes the stock assessment particularly prone to uncertainties in the data. As such it represents a perfect case study for the REDUS project.
Northeast Arctic cod
The Northeast Arctic cod (Gadus morhua) supports the largest cod fishery in the world and is the commercially most valuable demersal fish species globally. The NEA cod stock is well studied with long high-quality time-series of catch and scientific survey data, which are shared between Norway and Russia that jointly manage the stock. The stock abundance and biomass are assessed yearly by the ICES Arctic Fisheries Working group using a virtual population analysis (VPA) type model applied to estimates of fishery catch-at-age data and fishery-independent indices from research surveys for calibration (‘tuning’). Cod is also a key predator in the ecosystem (including cannibalism on young cod). Multispecies interactions are critical in managing this stock. The interaction between uncertainties in the cod data and the interacting species are different than uncertainties for NSS herring, and the two together cover a wide range of uncertainties on which to test REDUS methods.
Coupled species (ongoing activities relevant to REDUS)
Although NEA cod and NSS herring will constitute the test species, the REDUS project will keep abreast and cooperate with other ongoing stock assessment developments at the IMR. In particular REDUS will establish cooperation with the capelin assessment model development carried out by Drs. Sam Subbey and Hiroko Kato Solvang, and the planned saithe catch sampling and stock assessment project being developed by IMR in accordance with best scientific practice from ICES WKPICS 2013 and the EU fisPi project. Similarly, REDUS will also seek links to the IMR KoFA project focussing on zooplankton biology and assessment.
11.6 - Project plan
The REDUS project will be organized as four linked work-packages overseen by a steering group consisting of key IMR program and research group leaders Dr. Arill Slotte, Dr. Katja Enberg, Dr. Frode Vikebø, Dr. Rolf Korneliussen, the IMR ACOM representative Dr. Harald Gjøsæter, research director Dr. Geir Huse, a representative from the fishing industry, and the REDUS PI Dr. Erik Olsen.
11.6.1 - REDUS Work-Packages and leaders
WP1 “Fisheries-dependent (catch) surveys and assessment modeling” Co-chairs: Jon Helge Vølstad and Knut Korsbrekke
WP2 “Fishery-independent (scientific) surveys” Co-chairs: Nils Olav Handegard and Espen Johnsen
WP3 “Evaluating and testing of long-term management strategies” Co-chairs: Daniel Howell and Cecilie Hansen
WP4 “Communication of uncertainty, dissemination of project results and capacity building” Co-chairs: Erik Olsen and Guldborg Søvik
Figure 12.1: The REDUS project concept showing the interlinkages between the four work-packages. REDUS will work both bottom up delivering uncertainty estimates for management advice (HCRs) based on survey and catch data, as well as top-down estimating the survey design and catch sampling necessary to achieve predefined acceptable levels of uncertainty in the management advice.
11.6.2 - WP1 Fisheries-dependent (catch) surveys and assessment modeling
Work package 1 (WP1) will aim to improve statistical survey designs and estimators for fisheries-dependent surveys and also further develop statistical assessment models that can take into account uncertainty in input data. This work will include development and implementation of statistical/mathematical methods for quantifying and documenting uncertainty in input-data and in stock assessment model output that forms the basis for quota advice. The statistical analysis of input-data from fisheries-dependent will focus on the estimation of sampling errors, and statistical analysis to assess effects of coverage errors. We will employ time-series models and imputation methods (Rubin 1987) to fill data-gaps due to incomplete coverage where applicable. WP1 will also adjust for biases in input time-series of abundance indices from fisheries-independent surveys to stock assessment models by accounting for measurement errors as quantified in WP2 when feasible.
Stock Assessment Modeling
Current computational models in fisheries use commercial catch sampling data, and scientific survey data to estimate stock size and other parameters (e.g., SSB). Such models vary in detail and complexity, and in their representation of key underlying biological processes, such as mortality and recruitment. Improving stock assessment beyond the status quo calls for research in several key areas.
The assessment models to be developed in WP1 will be linked to the NFR-project SUSTAIN (RCN project no. 244647/E10) where IMR is partner. This project addresses development of assessment models that focus on the different sources of variability. The sources of variability include sampling error, but also key stochastic population dynamics parameters such as recruitment and mortality. WP1 will build on Gudmundsson (1994) to create a general and flexible template model that will include other documented statistical assessment models such as DTU Aqua SAM as special cases. Modifications to be considered include 1) replacing the Random walks for fishing mortality F with an autoregressive model that allows for autocorrelation in time (AR (1)) and 2) expanding the observation model so that the complex errors in input data from multi-stage surveys can be specified. The sources of variability include cluster-correlated sampling errors resulting from multi-stage sampling (e.g., Lehtonen and Pahkinen 2004, Nelson 2014; Aanes and Vølstad 2015), but also variability in key-parameters for stochastic processes in population dynamics such as recruitment and mortality.
WP1 will concentrate research on stock assessment models in four key areas:
Defining robust metrics (likelihood or objective functions) that includes information on different scales of observation (time and intensity) and uncertainties (data, model), when defining the quality of model fit, and when evaluation accuracy of model prediction.
Exploring classes of model formulations that are capable of delivering stock projections, especially in cases where the observation input-data is either incomplete (data gaps) or depreciated (e.g., due to limited coverage or measurement errors). The model classes envisaged here include parsimonious state-space models.
Development of robust and fast algorithms for parameter estimation in high dimensional nonlinear models, often with complicated likelihood definitions. Though the ADMB and the R library TMB (Template Model Builder) (Kristensen 2014, https://github.com/kaskr/adcomp/wiki) offer efficient modeling platforms for developing complex statistical models, (Skaug and Fournier, 2006), further work is required in improving the numerical algorithms for estimating marginal likelihoods (especially for nonlinear models)
Uncertainty analysis using the ADMB/TMB platform that allows for quantifying how a combination of errors in input-data propagate to affect the overall uncertainty in assessment model parameters and other model outputs.
The output from the research described above will be statistically quantified uncertainty in stock assessment output such as spawning stock biomass (SSB) and fishing mortality (F). These will be calculated as a function of uncertainty in estimates of abundance indices and catch in numbers of fish per age-class and will be pipelined for further use in WP2 and WP3.
Cost-benefit analysis of surveys
Defining robust model performance indices that incorporate information on different scales of observation and uncertainties (data, model) is another key task for WP1. A metric for such indices must be based on the information content (rather than volume) of observation data. Exploring other model formulations that are capable of delivering stock projections, especially in cases where the observation input-data is either incomplete (data gaps) or depreciated (e.g., due to limited coverage or measurement errors). Incorporating robust and fast algorithms for parameter estimation for nonlinear and high dimensional models which offers some challenges in specification of the likelihood for the data and in maximizing the likelihood. Uncertainty analysis using the ADMB/TMB (Kristensen, 2014, Skaug and Fournier 2006) platform that allows for quantifying how a combination of errors in input-data propagate to affect the overall uncertainty in assessment model parameters and other model outputs.
Figure 12.2: Precision (Relative Standard Error, RSE) in stock assessment parameter (SSB) as a function of sampling effort in fisheries-independent and fisheries-dependent surveys. The effective sample size (information content) in surveys is largely linked to survey design and sampling effort, and determines precision of input-data.
WP1 will develop and implement a framework for quantifying uncertainty in stock assessment output (e.g. SSB and F) as a function of uncertainty in estimates of abundance indices and catch in numbers per age-class (Figure 12.2). This will form the basis for cost-effective allocation of resources to the monitoring of fisheries (catch sampling) versus abundance surveys (scientific surveys).
Survey sampling design and analysis
Fisheries-dependent surveys. WP1 will use the ECA (“Estimating Catch at Age”) (Hirst et al. 2012) model that is being implemented as an R-package (R-ECA) that runs within STOX for analysis of catch sampling data from commercial fisheries. In WP1 we will expand the R-ECA model to also include design-based estimators (Lumley 2010) that will support the estimation of catch-at-age and catch-at-length for the four design classes of catch sampling programs described in ICES Expert Group Practical Implementation of Statistically Sound Catch Sampling Programmes (WKPICS) (ICES 2014).
Using diagnostic tools from R-ECA, and results from the statistical assessment modelling, we will develop cost-effective and reduced uncertainty survey designs for biological catch sampling. Survey designs will be developed with the aid from theoretical analysis and simulations, and then tested as pilot studies in one or more case studies. This is one key component of the process to optimize future catch sampling and reduce uncertainty in stock assessments, and a direct link to WP2.
One proposed case study to improve accuracy of catch-at-age estimates is to develop and test probabilistic at-sea catch sampling for the Norwegian spring-spawning herring. The aim is to develop cost-effective catch sampling that minimize or eliminate coverage errors, and also reduce sampling errors in estimates of catch-at-age. The other case study will focus on the reduction of bias in estimate of catch-at-age due to incomplete sampling coverage of the fleet. Only aggregated data on catch at age is available from Russian catches that constitute half of the total catch, and the survey design and sampling effort is not documented. We will assess coverage errors through the analysis of time-series of data and use imputation methods to fill data gaps.
Correcting for bias due to incomplete spatial and temporal coverage of the target population.In some years, large or entire part of the target populations are not surveyed (e.g. due to no access to Russian waters, or limited budgets). WP 1 will evaluate the effects of incomplete temporal and spatial coverage in estimates from fisheries-independent, and fisheries-dependent surveys that provide input data to the stock assessment models when combining survey data and time series analysis. This work will be tightly linked and coordinated with design and practical implementation of IMR fisheries-independent monitoring surveys. The joint Norwegian - Russian winter bottom trawl surveys in the Barents Sea (Pennington et al 2011) and the joint Russian-Norwegian Ecosystem survey (Olsen et al. 2011, Pennington et al. 2011) will be analyzed in detail to evaluate if these jointly can be used in model-assisted analysis (Særndal et al. 1992) to reduce coverage errors in abundance indices that are used in stock assessments.
Students/Post-doc
A post-doc position will be coordinated with the other work packages and will be considered after two new research scientist positions in applied statistics/quantitative fisheries ecology have been filled.
Tasks
T1.1 Further development and full implementation of a stock assessment model which uses the covariance-matrix in input files
T1.2 Full implementation of R-ECA with all survey design modules
T1.3 Establish and implement probability-based survey design for estimating catch-at-age
T1.4 Establish methods to handle poor sampling spatial coverage (e.g. no access to Russian EEZ)
Milestones
M1.1 2017. Next generation statistical assessment model(s) (XSAM), and framework for quantifying the propagation of errors from input data to stock assessment outputs. 2018. User-friendly version implemented in STOX framework
M1.2 2017. Probabilistic survey design for catch sampling (NSS herring)
M1.3 2018. Design-based estimators in R-ECA.
M1.4 2018. Catch sampling for NSS herring test implementation
Deliverables
D1.1 Develop and implement next generation statistical assessment models that can account for uncertainty in input data from fisheries-dependent and fisheries-independent surveys.
Provide probability-distributions in estimates of spawning stock biomass (SSB) and fishing mortality (F) as output to WP3. Use bias-corrections from WP2 for input data from fisheries-independent surveys when feasible.
D1.2 Develop and implement R-ECA in StoX framework, including an option for design-based estimation methods for catch at age that can be generally applied.
D1.3 Establish a statistical framework for optimizing monitoring effort to support stock assessment and quota advice. Complete manuscripts:
Manuscript: A framework for assessing adequate level of catch- and abundance monitoring for stock assessment and estimation of biological reference points. To be submitted to tier 2 fisheries journal
Manuscript: Cost-effective biological catch sampling from commercial fisheries and efficient statistical estimation methods. To be submitted to ICES JMS or CJFAS.
Manuscript: Comparing model‐based and design‐based estimators for catch‐at‐age. To be submitted to tier 2 fisheries journal.
D1.4 Framework for simulation of sample surveys to test the assessment models and effects and sensitivity to sampling variability, variable cover bias and measurement errors.
D1.5 Develop a probabilistic biological catch sampling from the Norwegian herring fishery (Implementation of pilot study is proposed for 2017), in particular in relation to automating requests for samples from Norges Sildesalgslag catch reporting system.
D1.6 Development and implementation of experiments to test the feasibility of probabilistic trawl sampling in acoustic surveys. If pilot demonstrates feasibility, we will aim to expand the experiments to all strata.
The overall goal of WP 2 is to reduce the variance and to identify, quantify, and adjust for systematic sampling errors (bias) in the fishery independent survey indices. The importance and magnitude of the various sources of error differ between swept-area and acoustic-trawl surveys, and may also differ by species, fish size, and in time and space. We will build a general simulation framework and data and estimation processing pipeline (Figure 12.3) to assess the effects of the various sources of errors on the stock assessment result in collaboration with WP1.
The first step will be to use the StoX software and add error structures to the data to simulate the different sources of uncertainty. The data simulation will form the basis for data analysis and in situ experiments. The aim is to utilize the simulation as a basis for new available observation methodologies to identify and correct for bias in the assessment results. To test the framework, we will use the NEA cod and NSS herring case studies.
A final step will be to develop an observation model that is linked to a spatially resolved ecosystem models (Figure 12.3, input from WP3), e.g. ATLANTIS, NORWECOM or others. This will enable us to simulate data from models that can be used as operating models in an MSE framework, further enabling us to test how the error structures in survey estimates affect long term management.
Figure 12.3: The key data infrastructure elements of WP2 and how it relates to the other WPs in the REDUS. (1) Noise module 1 will be used to add noise on scrutinized data, representing the various error sources, and (2) noise module 2 will be used to add noise on raw data. An observation model (3) will be developed to predict data both for noise module 1 and 2, depending on the resolution of the ecosystem model (4) (c.f. WP3). The colored boxes are modules or data that is already existing or planned for the IMR infrastructure. WP2 will further adjust these to fit the REDUS framework. Note that the framework allows a full MSE if the spatially resolved ecosystem model (4) can utilize the data from the assessment model and HCR (6).
Random sampling errors
A review study will be carried out to examine the efficiency and validity of current sampling designs and estimators in use, with a focus on herring and cod surveys. The sampling variance will be estimated for all parameters and indices estimated from from the fisheries independent surveys. If needed, effort will be made to develop and implement improved statistical design and estimators for these surveys. Preliminary analyses show a potential gain in including probabilistic based trawl sampling in acoustic surveys and estimators for transect based swept area surveys and acoustic trawl surveys, and adaptive sampling for patchy distributions.
Systematic sampling errors (bias)
Effective implementation of methods to quantify and reduce bias in statistics from fisheries independent surveys, in addition to the implementation of efficient survey designs and statistical estimators (see above), is a central aim of REDUS. The focus of the project will be investigating the improvement in accuracy by combining data recorded from sampling gears and multiple observation tools. A successful implementation dependent on a sound statistical framework (Kotwicki et al 2014) as well as knowledge of the limitations and strengths of the sampling gears and observation tools. The improvement of accuracy in survey statistics and stock assessments will require close cooperation across work packages, and teamwork that integrate survey sampling experts (Dr. Vølstad & co) and observation methodology experts.
Several factors may introduce bias in key survey estimates, and WP 2 will conduct a review and thorough investigation to identify the most important sources of bias. In many surveys, many important sources of bias are well known and we have briefly described several of these in the following:
Movement of the target species: When the target species moves during the survey period, the associated bias needs to be evaluated or adjusted for. Active migration will be measured using sonar (Pena et al, 2013) and ADPC. The effect will also be assessed using simulations (the model in WP3), and the observation model that couples WP3 and WP2, by combining drift and active migration (e.g. NORWECOM).
Vessel avoidance: Local change in behaviour for the target species around the survey platform may bias the results (DeRobertis and Handegard, 2013). This effect may be substantial, especially at shallow depth and for pelagic species. If the vertical distribution differs between years, this may cause a year effect since the avoidance behaviour is more pronounced in the upper water column. We utilize sonars and AUVs to measure this effect during the herring case study, in addition to simulate the effect on the assessment based on earlier in situ experiments.
Age reading: Errors in age determination will cause errors in estimates catch-at-age, and hence may increase uncertainty in stock assessments. Further, age-reading errors can also lead to errors in the estimation of for example weights-at-age, and maturity-at-agee. The R-ECA model includes methods for accounting for the effects of age-reading errors in estimates of catch-at-age. For scientific survey indices of abundance by age, methods described in Punt et al. (2008) and also the simulation framework described above can be used to investigate effects on stock assessments.
Trawl selectivity: The catchability of the trawl varies with species and length groups (e.g. Engås and Godø, 1989), and may change with environment. The effect of measured or modelled length selectivity curves for different species will be included in the estimation framework and the estimation framework will be used to assess the effect of this bias on the assessment.
Blind zone: The zone between the surface and the effective transducer depth, is a potentially crucial bias, since fish moving in and out of the zone may strongly bias the survey indices, especially if this effect is variable among years. This will be addressed by analyzing the vertical sonar beam and estimate the variability in the vertical distribution. The estimated vertical distribution will be used to simulate this effect on the error structure module, which in turn will be propagated to the StoX software to assess the sensitivity to this source of bias.
Bubble attenuation: Bubble sweep errors will be added as an increase Sv at the higher water column (Dalen and Løvik, 1981). The error source module that adds error structures to the output from LSSS will be used to add typical bubble sweep errors, and the effect on the survey index or HCR will be explored. Based on an acceptable bias level stop or reduced speed rules will be developed. For extinction (shadowing) effects, we will use real data and simply estimate the effect based on historical data and using the parameters for herring (Zhao and Ona, 2003).
Classification of acoustic targets: During post-processing the acoustic energy is allocated to species or species groups through a subjective process, which may cause bias, and it is difficult to test whether the allocations are correct or not. We will use the next generation broadband echo sounders with high range resolution and in combination with optic deep vision systems on the trawl to improve the acoustic categorization and target strength measurements. Furthermore, several automated classification methods based on the differences in multifrequency backscatter exists for species (e.g. Fernandes et al, 2006) and length (Johnsen et al 2009), and by comparing automated classifications with manual scrutinizers, potential inconsistencies in the manual scrutinization process will be explored. The magnitude of the discrepancies will be added to the error module and the effect of them will be propagated through the REDUS framework.
Tasks
T2.1 Review of all the potential sources of errors for the NSS herring and NEA cod fishery independent surveys
T2.2 Build an error source module between LSSS and StoX to simulate the different sources of bias
T2.3 Build an observation model to translate model states from spatially resolved ecosystem models to acoustic and trawl station observations.
T2.4 Conduct in situ experiments associated to the NSS herring surveys and use sonar data to assess vertical distribution and the effect on sampling variance of the increased sampling volume, including validation of the methodology using, e.g., AUVs with vertically aligned echo sounders that covers the overlap between the zones.
T2.5 Set up LSSS’ CORONA module to automatically allocate acoustic backscatter to species and use that to test the consistency and potential bias caused by variable allocations.
T2.6 Develop and implement alternative probabilistic methods for selecting trawl stations in acoustic surveys e.g. for trawling “on registration”.
T2.7 Develop methods to combine echo sounder data and swept-area data into combined survey estimates.
T2.8 Further development of estimators for transect based swept-area trawl surveys
Milestones
M2.1 Specification of the noise module 1 and 2 (c.f. Figure 12.3).
M2.2 Specification of the observation model that translates model states to observations (c.f. Figure X).
M2.3 Join survey and estimate vertical distribution and the effect of increased sampling volume on the NSS Herring survey
M2.4 Interface the LSSS Corona module with the the S2D system to enable automatic classification of acoustic backscatter to species groups
M2.5 2016. Probabilistic survey design for trawl sampling in acoustic survey for Pilot study
M2.6 2017. Pilot experimental testing of probabilistic survey design for trawl sampling in acoustic survey (in Norway)
Deliverables
D2.1 Build a time series module in StoX to estimate the whole time series based on manipulated/simulated data including the noise module
D2.2 Describe and quantify the sources of bias and variance in the NSS Herring surveys.
D2.3 Describe and quantify the sources of bias and variance in the NEA Cod surveys.
D2.4 Manuscript on and operational observation translating model states from spatially resolved ecosystem models to acoustic and trawl station observations; Methods in Ecology and Evolution or similar.
D2.5 Manuscript on the use of sonar in acoustic trawl surveys; IJMS or similar.
D2.6 Manuscript on the effect on the assessment of using automatic vs manual acoustic backscatter allocations: Can research vessels be replaced with drones? Methods in Ecology and Evolution or similar.
D2.7 Manuscript on adaptive sampling and decision rules for trawling “on registration”; CJFAS
D2.8 Manuscript on combining echo sounder data and swept-area data for NEA Cod (in collaboration with NOAA Alaska Fisheries Science Centre); IJMS.
11.6.4 - WP3 Evaluate and test long-term management strategies
Main aim: Develop a flexible and extendable software toolbox to conduct MSEs.
The software toolbox will build upon existing work at IMR on HCR rule evaluation and MSEs (the HCR tool “Prost” Skagen et. al 2003, work on linking Gadget to FLR Howell and Bogstad 2010), and be informed by current best practice globally. The first task in WP3 will be to conduct a review of software tools in use or under development around the world, and use this to inform the design of an MSE tool suitable for use in Norwegian ecosystems. The tool must be developed to suit the requirements of the stock assessments and HCRs in use at IMR, and be able to adapt to future requirements. For example, the recent HCR evaluations for NEA cod included a multispecies HCR (based on the biomass of both cod and capelin), while the forthcoming HCR for Pandalus borealis in the Skagerrak requires a quarterly time step in the assessment model to account for rapid growth and consequent changes in selectivity over the course of a year. The tool will be directly linked to the StoX package and the overall REDUS toolbox, and should incorporate several alternative operating models for our ecosystems that could be used to predict observations that in turn will be used as test-cases in WP2. Both single species and multispecies operating models should be employed, in order to investigate multispecies HCRs and the errors involved in ignoring multispecies interactions. A key capability is that new models should be relatively easy to add to the tool. Finally, the model must also be able to incorporate various uncertainties, and different types of information on the uncertainty structure (eg. cv around a point survey estimate, effective sample size, errors in age reading, uncertainty on discards). The MSE tool will therefore be developed using a modular structure, with well defined links between the components. This will make developing and testing simpler, but crucially will also make the tool more flexible and extendable by ensuring that changes can be made to each module independently.
Such an MSE tool has several uses, and the design will be chosen to accommodate all of these. The first is to evaluate Harvest Control Rules (HCR) for given uncertainties and variabilities and a given assessment model. Equally important is to evaluate how well a particular assessment model performs, not just in how accurately it can assess a stock at a given point in time, but in how well it performs in relation to the HCR and long term yield. The tool will therefore incorporate the assessment model from WP1. The tool can then be used to identify relative gains in yields resulting from reducing different sources of uncertainty, and thus form part of the work towards a cost-benefit analysis of improvements in different data sources. Such a tool also provides a platform for generating simulated data, and operating model outputs will be used to provide simulated data to both WP1 and WP2.
It should be noted that WP3 does not, in any sense, stand alone. Rather, it requires tight integration with the other WPs, and with other ongoing work on HCR evaluation within IMR. Collaboration with WP1 is essential in designing the errors to be added to results of the operating model. The tools developed in this WP are those required to test the potential improvements from WP2. By providing a tool to evaluate different HCRs and the impact of uncertainty on the HCR performance, this WP provides a platform to use in communicating with a wide range of stakeholders, and thus links directly to WP4. Input from WP4 is also critical on designing the structure of the simulations, and specifying acceptable risk thresholds. Where direct transfer of data occurs, this should be automated and included within the software tool. In addition, the development of such an MSE tool should not occur in isolation, but in close collaboration with scientists working on similar projects around the world.
Figure 12.4: Schematic overview of a Management Strategy Evaluation process (from Holland 2010).
Although not an immediate goal of this project, it should be noted that the results of MSEs can be generalized from fish stock status and fisheries yield to economic or socio-economic outcomes. Work on such analyses is in progress in a number of institutes (notably FLBEIA at AZTI (http://flbeia.azti.es/) and Gulf of Mexico (GoM) Atlantis at NOAA and South-East Australia Atlantis at CSIRO). Building a flexible tool would allow such considerations to be incorporated at a later date if required.
Post-doc position
Build, test and evaluate the MSE tool (either as main programmer or in collaboration with the full time programmer/modeller)
Perform and evaluate HCRs and MSEs for the case study species
Tasks
T3.1 Review existing model tools, decide upon which is best suited for our area and purpose, including both single-species and ecosystem models
T3.2 Build flexible MSE tool which works with key operating assessment models and ecosystem models, and which takes uncertainty into account
T3.3 Use the MSE tool to test
T3.3.1 The importance of uncertainty on stock assessment and on ecosystem level
T3.3.2 The impact of uncertainty on the catches, the single stocks and on the ecosystem
T3.3.3 Evaluate the HCRs considering the findings in T3.3.1 and T3.3.2.
Milestones
M3.1 Decision on which tool to use/build in collaboration with the other WPs - implement observation model in MSE.
M3.2 Implement a flexible extendable MSE tool which works with key operating and assessment models, and which takes uncertainty into account
M3.3 Incorporate a multispecies operating model
M3.4 Case study assessing the effect of uncertainty on the performance of the fishery using the two target species (NSS herring and cod).
M3.5 Case study: Comparing bias to random noise: Identify impact on fisheries and possible differences between the two case studies
Deliverables
D3.1 Flexible MSE tool which ‘talks’ to the existing models (both single-species and ecosystem) at the institute
D3.2 Technical report on the MSE tool
D3.3 Peer-reviewed paper: Reducing sources of uncertainty - impact on the performance of the fisheries. Submit to tier 2 fisheries journal
D3.4 Incorporate the new assessment model developed during WP1 into the MSE tool
D3.5 Peer-reviewed paper: Exploring bias in the Norwegian Spring Spawning Herring and Northeast arctic cod: How does bias impact the performance of two different fisheries? Submit to tier 2 fisheries journal.
D3.6 Peer-reviewed paper: Towards ecosystem based management in the Barents and Norwegian Sea: The effect of determining HCRs on isolated stocks compared to the ecosystem approach. Submit to tier 2 fisheries journal
11.6.5 - WP4 Communication of uncertainty, dissemination of project results, capacity building and project coordination
In WP4 the implementation and communication of REDUS results are in focus together with strengthening and building scientific networks in fisheries science.
International collaboration
REDUS will be initiated through an international workshop in Q2 2016 where leading international scientists will be asked to contribute to a horizon-scanning paper on the way forward in implementing uncertainties in fisheries stock assessments and management. To further strengthen international collaboration key scientists will be invited to the IMR as visiting scientists for periods up to 6 months.
Communication of uncertainty
How to communicate and discuss uncertainty in a public management setting will be one of the main tasks of WP4. Researchers and stakeholders will be invited to a yearly workshop to discuss and analyze: i) challenges of communicating uncertainty, ii) ways uncertainty are communicated in other fields, iii) suggestions for how to best communicate uncertainty in fisheries. Based on the input from the yearly workshop IMR will seek to adjust its communication of uncertainty.
The REDUS analytical framework will be implemented both in Norway and internationally. At the IMR, the REDUS framework will be used to retrospectively evaluate the monitoring and assessment that have been carried out as well as a priori to plan and prioritize monitoring and assessment efforts. Internal communication at IMR to inform about the project developments and tools will be a priority. REDUS will use web-broadcasted seminars, organize workshops, and actively ask to have meetings in research groups to spread the use of the REDUS toolkit within the IMR assessment community.
For international implementation, REDUS scientists will partake in ICES EGs and share REDUS methods and approaches, advocating for their implementation in the ICES Advisory process. REDUS scientists are leading and/or participating in WGSAM, WGIPEM, AFWG, WGWIDE, WGNSSK, WGCATCH, NIPAG, PGDATA, Benchmark steering committee, WGFAST, SSGIEOM, and WGMIXFISH. There is a need for increased involvement by IMR in PGDATA (Planning Group on Data Needs for Assessment and Advice). Particular attention will be given to sharing and discussing REDUS methods and results with PINRO and VNIRO.
The results from the REDUS project will be shared and communicated in the scientific community through participation in workshops and conferences, and open access peer-reviewed publications. REDUS will also make active use of social media and a project research blog (web pages). REDUS methods (scripts, programs and R-packages) will be openly available through GitHub where new users can flag issues and questions and be in constant dialogue with the various development teams. Yearly public project seminars organized together with the fishing industry in key fishing ports (e.g. Austevoll, Tromsø, Egersund) will be used to present and discuss REDUS results and how these best can be implemented to benefit fishermen, managers and stakeholders. REDUS will produce short (2-5 min English and Norwegian) videos explaining topics, methods and results to be shared through the REDUS YouTube channel. Final results of REDUS will be shared at a popular-science conference, preferentially as a ‘TEDx-fish’ event in collaboration with the Bergen marine research cluster (UiB)
Stock Assessment Metadatabase
IMR is currently developing a Stock Assessment Metadatabase, which includes all stocks being monitored by the institute. The database will be available online with the source code and data-base structure being version controlled using GIT and shared through publicly available services like GitHub. Presently the IMR Stock Assessment Metadatabase consists of a table with stock-wise information on stock responsible scientist(s), quota advice, surveys, responsible ICES working groups, management objectives, red listing etc. Follow up work will couple the metadatabase to the existing data framework at IMR, such that one may, for any stock, follow the whole data chain back to a specific survey in any year. Anyone should be able to find information on assessment input data (fisheries-dependent and fisheries-independent), survey designs, assessment model, and uncertainty estimates. Prioritized needs for new knowledge and new and/or improved data per stock will be listed in the metadatabase, such that the database can be used to identify research needs. In assessment work, the goal is for stock responsible scientists to be able to generate stock-based overviews on input data, models and uncertainties for use in appendices to working group reports etc. By documenting uncertainty in all steps in the assessment process through interfacing and operationalizing the REDUS framework, the metadatabase will be used to prioritize survey and sampling effort, within or between stocks, such that the resulting assessment and advice may have the lowest possible uncertainty pending available resources.
Data infrastructure framework
A key element of the project will be to provide components to the IMR data infrastructure. This will secure that the project results will be implemented across a wide range of fish stocks; not only the case study stocks. Each component will support command line execution and instances of the whole simulation loop will be available for the project participants. This will enable us to test the effect of various alterations of the data processing chain, e.g. we can test the effect on the assessment and harvest control rules of a revised target strength on an acoustic survey or any other alteration of the processing chain. We can also omit data sources, add various error structures to the data, and any combination thereof, and investigate the effect not only on, e.g. survey estimate, but on the full data processing chain leading up to the advice. The framework will support management strategy evaluation (MSE) and have the capacity to be extended to include operating models that can simulate data, and include error structures, across the full data processing chain. This will require the operating model to be able to predict the observations on the appropriate scales, and appropriate observation models need to be developed.
A key is that the components can be easily accessed and executed across the full frame work. This will enable the different WP’s to focus on the content of each “box” in the framework, while at the same time test the consequences of changes within the respective boxes on the bigger picture. These key components in the project is outlined in Figure 12.1.
Milestones
M4.1 Set up project research blog (web pages)
M4.2 Project Twitter, Facebook, Instagram and YouTube account
M4.3 Project GitHub account
M4.4 Present REDUS at internal IMR seminar with special invitation to stock-scientists
M4.5 Present REDUS at seminar for FDIR, NFD, Fishermen's organization and NGOs
M4.6 REDUS Kick-off meeting
M4.7-11 Communication of uncertainty workshop 2016, 2017, 2018, 2019, 2020
D4.9-16 Annual update of IMR Stock Assessment Metadatabase 2016, 2017, 2018, 2019, 2020 with presentation seminar for FDir
D4.17 Manuscript: “How renewable resource management (compare marine and terrestrial eg. reindeer management) improves by including uncertainty in prospective and retrospective analyses”. High Impact journal
D4.18 Manuscript “The REDUS uncertainty analysis toolbox for natural resource management”. Tier 2 Fisheries Journal
D4.19 Technical manuscript about the REDUS toolbox submitted to ICES EGs and ACOM
11.7 - Budget
The overall budget for the REDUS project is given in Table 12.1 below. Over the five-year project period the REDUS project budget will be 68.69 million NOK. The project budget is fully specified in the IMR economy system MACONOMY.
Table 12.1: REDUS overall budget for the project period 2016 - 2020.
2016
2017
2018
2019
2020
WP1 Developing and implementing methods to estimat the sources and contributions of uncertainty
Sum research hours & NR contract
5 357 000
3 714 000
3 735 000
3 756 000
3 777 000
Post.Doc/PhD
430 286
1 039 000
1 070 000
629 714
0
Ecological programmer/modeller
176 000
434 310
448 320
462 330
476 340
WP1 Sum
5 963 286
5 187 310
5 253 320
4 848 044
4 253 340
WP2 Correction of survey bias and reduction of uncertainty in survey data
Researcher, hours sum
889 000
2 112 000
2 176 000
2 240 000
2 304 000
Post.Doc/PhD
430 286
1 039 000
1 070 000
629 714
0
Ecological programmer/modeller
176 000
434 310
448 320
462 330
476 340
WP2 Sum
1 495 286
3 585 310
3 694 320
3 332 044
2 780 340
WP3 Evaluation, testing and validation of long-term management strategies.
Researcher, hours sum
759 000
2 034 000
2 176 000
2 240 000
2 304 000
Post.Doc/PhD
430 286
1 039 000
1 070 000
629 714
0
Ecological programmer/modeller
176 000
434 310
448 320
462 330
476 340
WP3 Sum
1 365 286
3 507 310
3 694 320
3 332 044
2 780 340
WP4 Project coordination, capacity building and communication of uncertainty.
Researcher, hours sum
719 010
1 452 000
1 496 000
1 540 000
1 584 000
SAMBA stock meta-table
500 000
500 000
500 000
500 000
500 000
Kick-off workshop
200 000
0
0
0
0
Travel costs
400 000
200 000
200 000
200 000
200 000
Visiting scientist
80 000
200 000
200 000
200 000
200 000
Yearly project meeting
0
150 000
150 000
150 000
150 000
Communication workshop
100 000
100 000
100 000
100 000
100 000
Computer equipment
100 000
30 000
30 000
10 000
10 000
Training courses
75 000
200 000
100 000
50 000
0
Publication costs (OA fees)
0
70 000
70 000
100 000
100 000
WP 4 Sum
2 174 010
2 902 000
2 846 000
2 850 000
2 844 000
REDUS YEARLY SUM
10 997 867
15 181 930
15 487 960
14 362 133
12 658 020
REDUS TOTAL PROJECT SUM (2016 - 2020)
68 687 910
11.8 - Compliance with strategic documents
The REDUS project is of the highest relevance to national and international strategic priorities in fisheries management and marine science. In “Masterplan for Marin Forskning” (2015) the Norwegian government identifies complexity and research capacity on the major fish stocks and calls for more monitoring and increased fisheries management science, to which the REDUS project is a direct response. Similarly, REDUS will provide knowledge corresponding to the Norwegian Research council priority research areas for the topic “Sustainable harvesting and value creation - 4.1.3” as described in “Marine Ressurser og Miljø - MARINFORSK. Programplan 2016-2020“ (2015). Internationally, the REDUS project is of direct relevance to the implementation of the ICES science plan from 2014 to 2018 that identifies the optimization of surveys as one of the central goals (ICES science prioritize area 26). Similarly, REDUS is of direct relevance to the EU Horizon 2020 work plan for “Food security, sustainable agriculture and forestry, marine and maritime and inland water research and the bioeconomy” seeking research that supports healthy oceans and sustainable management for renewable resources. Locally, REDUS is a direct response to the IMR Strategic plan (2011-2017) priorities for advice calling for the IMR to be: “leaders in development of ecosystem-based resource management” and “carry out quantitative assessments and projections of the state of our large marine ecosystems”.
11.9 - Collaborations (international and national)
The REDUS project team was put together primarily on scientific basis, but also to balance age, experience and gender to best address the complexities of marine management issues facing society. Our team is diverse, spanning from young PhD and post-docs to experienced scientists, and it includes two female scientists as co-leaders of WP 3 and WP 4. We will particularly encourage emerging female MSc and PhD students to apply for the post.doc. and PhD positions.
11.11 - Dissemination and communication of results
Dissemination of results: Project results will be published in open-access, peer-reviewed scientific journals and presented at international conferences and work-shops. The project participants will also actively use social media (e.g. Twitter, Facebook, Researchgate, Instagram) and blogs to share publications, results and activities. Project information and publication will be made available on the project web-site and open forums like the Open Science Framework (www.osf.io). Open access to all project data, results and methods is essential. Source code will be versioned and made publically available through collaborative software sites like GitHub (www.github.com) Software will be licenced under strong copyleft, e.g. GNU Public Licence or Lesser Gnu Public Licence, depending on the license of interfaced libraries. We will follow romeo green or gold standards for scientific publications. Other output will be licenced under Creative Commons Attribution (CC BY-SA) license.
Communication with users: In addition to the active implementation of REDUS project results through the ICES advisory process, REDUS will communicate results and methods to the public in general and fishing sector in particular through popularizing results as opinion articles in newspapers and fishing industry magazines. A yearly open project seminar will be held in different fishing ports around the country, organized in collaboration with key industry organizations like Fiskarlaget and Fiskebåt. The REDUS reference steering group consisting of key program leaders at IMR and the IMR ACOM representative are also key to communicating the project results to a wider audience thereby facilitating implementation. Final project results and other timely, topical and provocative talks are planned presented at a broad and high-profile international public conference (e.g. TEDx event) organized by IMR and project partners.
11.12 - References
Aanes, Sondre, Steinar Engen, Bernt-Erik Sæther, and Ronny Aanes. 2007. “Estimation of the Parameters of Fish Stock Dynamics from Catch-at-Age Data and Indices of Abundance: Can Natural and Fishing Mortality Be Separated?” Canadian Journal of Fisheries and Aquatic Sciences 64 (8): 1130–42.
Aanes, Sondre, and Jon Helge Vølstad. 2015. “Efficient Statistical Estimators and Sampling Strategies for Estimating the Age Composition of Fish.” Canadian Journal of Fisheries and Aquatic Sciences 72 (6): 938–53.
Boyer, D. C., and I. Hampton. 2001. “Development of Acoustic Techniques for Assessment of Orange Roughy Hoplostethus Atlanticus Biomass off Namibia, and of Methods for Correcting for Bias.” South African Journal of Marine Science 23 (1): 223–40. doi:10.2989/025776101784528719.
Cochran, William G. 1977. “Sampling Theory.”
Dalen, John, and Arne Lo/vik. 1981. “The Influence of Wind‐induced Bubbles on Echo Integration Surveys.” The Journal of the Acoustical Society of America 69 (6): 1653–59.
Dankel, Dorothy Jane, Jon Helge Vølstad, and Sondre Aanes. 2015. “Communicating Uncertainty in Quota Advice: A Case for Confidence Interval Harvest Control Rules (CI-HCRs) for Fisheries.” Canadian Journal of Fisheries and Aquatic Sciences 73 (2): 309–17.
Demer, David A. 2004. “An Estimate of Error for the CCAMLR 2000 Survey Estimate of Krill Biomass.” Deep Sea Research Part II: Topical Studies in Oceanography, The CCAMLR 2000 Survey: a multinational, multi-ship biological oceanography survey of the Atlantic sector of the Southern Ocean, 51 (12–13): 1237–51.
De Robertis, Alex, and Nils Olav Handegard. 2013. “Fish Avoidance of Research Vessels and the Efficacy of Noise-Reduced Vessels: A Review.” ICES Journal of Marine Science 70 (1): 34–45.
Engås, Arill, and Olav Rune Godø. 1989. “Escape of Fish under the Fishing Line of a Norwegian Sampling Trawl and Its Influence on Survey Results.” ICES Journal of Marine Science 45 (3): 269–76.
Fernandes, P., Rolf Korneliussen, Anne Lebourges-Dhaussy, Jacques Massé, M Iglesias, N. Diner, Egil Ona, Tor Knutsen, and R. Ponce. 2006. “The SIMFAMI Project: Species Identification Methods from Acoustic Multifrequency Information. Final Report to the EC. .486 Pp.” No. Q5RS-2001-02054.
Gregoire, T G. 1998. “Design-Based and Model-Based Inference in Survey Sampling: Appreciating the Difference.” Canadian Journal of Forest Research 28 (10): 1429–47. doi:10.1139/x98-166.
Gudmundsson, Gudmundur, and Thorvaldur Gunnlaugsson. 2012. “Selection and Estimation of Sequential Catch-at-Age Models.” Canadian Journal of Fisheries and Aquatic Sciences 69 (11): 1760–72.
Hirst, David, Geir Storvik, Hanne Rognebakke, Magne Aldrin, Sondre Aanes, and Jon Helge Vølstad. 2012. “A Bayesian Modelling Framework for the Estimation of Catch-at-Age of Commercially Harvested Fish Species.” Canadian Journal of Fisheries and Aquatic Sciences 69 (12): 2064–76.
Howell, Daniel, and Bjarte Bogstad. 2010. “A Combined Gadget/FLR Model for Management Strategy Evaluations of the Barents Sea Fisheries.” ICES Journal of Marine Science: Journal Du Conseil 67 (9): 1998–2004.
Johnsen, Espen, Ronald Pedersen, and Egil Ona. 2009. “Size-Dependent Frequency Response of Sandeel Schools.” ICES Journal of Marine Science: Journal Du Conseil, April, fsp091.
Kotwicki, Stan, James N. Ianelli, and André E. Punt. 2014. “Correcting Density-Dependent Effects in Abundance Estimates from Bottom-Trawl Surveys.” ICES Journal of Marine Science: Journal Du Conseil, January,
Kristensen, Kasper. 2014. “TMB: General Random Effect Model Builder Tool Inspired by ADMB.” R Package Version 1.
Lehtonen, Risto, and Erkki Pahkinen. 2004. Practical Methods for Design and Analysis of Complex Surveys. John Wiley & Sons.
Lessler, JT, and WD Kalsbeek. 1992. “Nonresponse Errors in Surveys.”
Løland, Anders, Magne Aldrin, Egil Ona, Vidar Hjellvik, and Jens Christian Holst. 2007. “Estimating and Decomposing Total Uncertainty for Survey-Based Abundance Estimates of Norwegian Spring-Spawning Herring.” ICES Journal of Marine Science: Journal Du Conseil 64 (7): 1302–12.
Lumley, Thomas. 2010. “Wiley Series in Survey Methodology.” Complex Surveys: A Guide to Analysis Using R, 277–78.
Nelson, Gary A. 2014. “Cluster Sampling: A Pervasive, Yet Little Recognized Survey Design in Fisheries Research.” Transactions of the American Fisheries Society 143 (4): 926–38.
Nielsen, Anders, and Casper W. Berg. 2014. “Estimation of Time-Varying Selectivity in Stock Assessments Using State-Space Models.” Fisheries Research, SI: Selectivity, 158 (October): 96–101.
“ NRC Research Press PDF Fulltext.” 2016. Accessed March 3.
“ NRC Research Press Snapshot.” 2016. Accessed March 3.
Olsen, E, K Michalsen, NG Ushakov, and VB Zabavnikov. 2011. “The Ecosystem Survey.” The Barents Sea: Ecosystem, Resources, Management, 604–9.
Peña, Héctor, Nils Olav Handegard, and Egil Ona. 2013. “Feeding Herring Schools Do Not React to Seismic Air Gun Surveys.” ICES Journal of Marine Science: Journal Du Conseil 70 (6): 1174–80.
Pennington, M, Mikhail S Shevelev, Jon Helge Vølstad, and Odd Nakken. 2011. “Chapter 10.3 Bottom Trawl Surveys.” The Barents Sea. Ecosystem, Resources, Management. Half a Century of Russian-Norwegian Cooperation, 570–84.
Pikitch, E. K., C. Santora, E. A. Babcock, A. Bakun, R. Bonfil, D. O. Conover, P. Dayton, et al. 2004. “Ecosystem-Based Fishery Management.” Science 305 (5682): 346–47.
Punt, André E., David C. Smith, Kyne KrusicGolub, and Simon Robertson. 2008. “Quantifying Age-Reading Error for Use in Fisheries Stock Assessments, with Application to Species in Australia’s Southern and Eastern Scalefish and Shark Fishery.” Canadian Journal of Fisheries and Aquatic Sciences 65 (9): 1991–2005.
Quinn, Terrance J., and Richard B. Deriso. 1999. Quantitative Fish Dynamics. Oxford University Press.
Rose, George, Stéphane Gauthier, and Gareth Lawson. 2000. “Acoustic Surveys in the Full Monte: Simulating Uncertainty.” Aquatic Living Resources 13 (5): 367–72.
Särdnal, CE, B Swensson, and JH Wretman. 1992. “Model Assisted Survey Sampling,” 1–694.
Särndal, Carl-Erik, Ib Thomsen, Jan M. Hoem, D. V. Lindley, O. Barndorff-Nielsen, and Tore Dalenius. 1978. “Design-Based and Model-Based Inference in Survey Sampling [with Discussion and Reply].” Scandinavian Journal of Statistics 5 (1): 27–52.
Shepherd, J. G. 1999. “Extended Survivors Analysis: An Improved Method for the Analysis of Catch-at-Age Data and Abundance Indices.” ICES Journal of Marine Science: Journal Du Conseil 56 (5): 584–91.
Skagen, Dankert W., Bjarte Bogstad, Per Sandberg, and Ingolf Røttingen. 2003. “Evaluation of Candidate Management Plans, with Reference to North-East Arctic Cod.” Working paper. ICES.
Skaug, Hans J., and David A. Fournier. 2006. “Automatic Approximation of the Marginal Likelihood in Non-Gaussian Hierarchical Models.” Computational Statistics & Data Analysis 51 (2): 699–709.
Thorson, James T., James N. Ianelli, Stephan B. Munch, Kotaro Ono, and Paul D. Spencer. 2015. “Spatial Delay-Difference Models for Estimating Spatiotemporal Variation in Juvenile Production and Population Abundance.” Canadian Journal of Fisheries and Aquatic Sciences 72 (12): 1897–1915.
Zhao, Xianyong, and Egil Ona. 2003. “Estimation and Compensation Models for the Shadowing Effect in Dense Fish Aggregations.” ICES Journal of Marine Science: Journal Du Conseil 60 (1): 155–63.