


Stock Name: Barents Sea capelin (ICES subareas 1 and 2 excluding Division 2.a west of 5°W)
Released 19.10.2026
1 - Advice on fishing opportunities
The Joint Russian-Norwegian Working Group on Arctic Fisheries (JRN-AFWG) advises that when the Joint Norwegian–Russian Fisheries Commission management plan is applied, there should be zero catches of Barents Sea capelin in 2027.
2 - Stock development over time
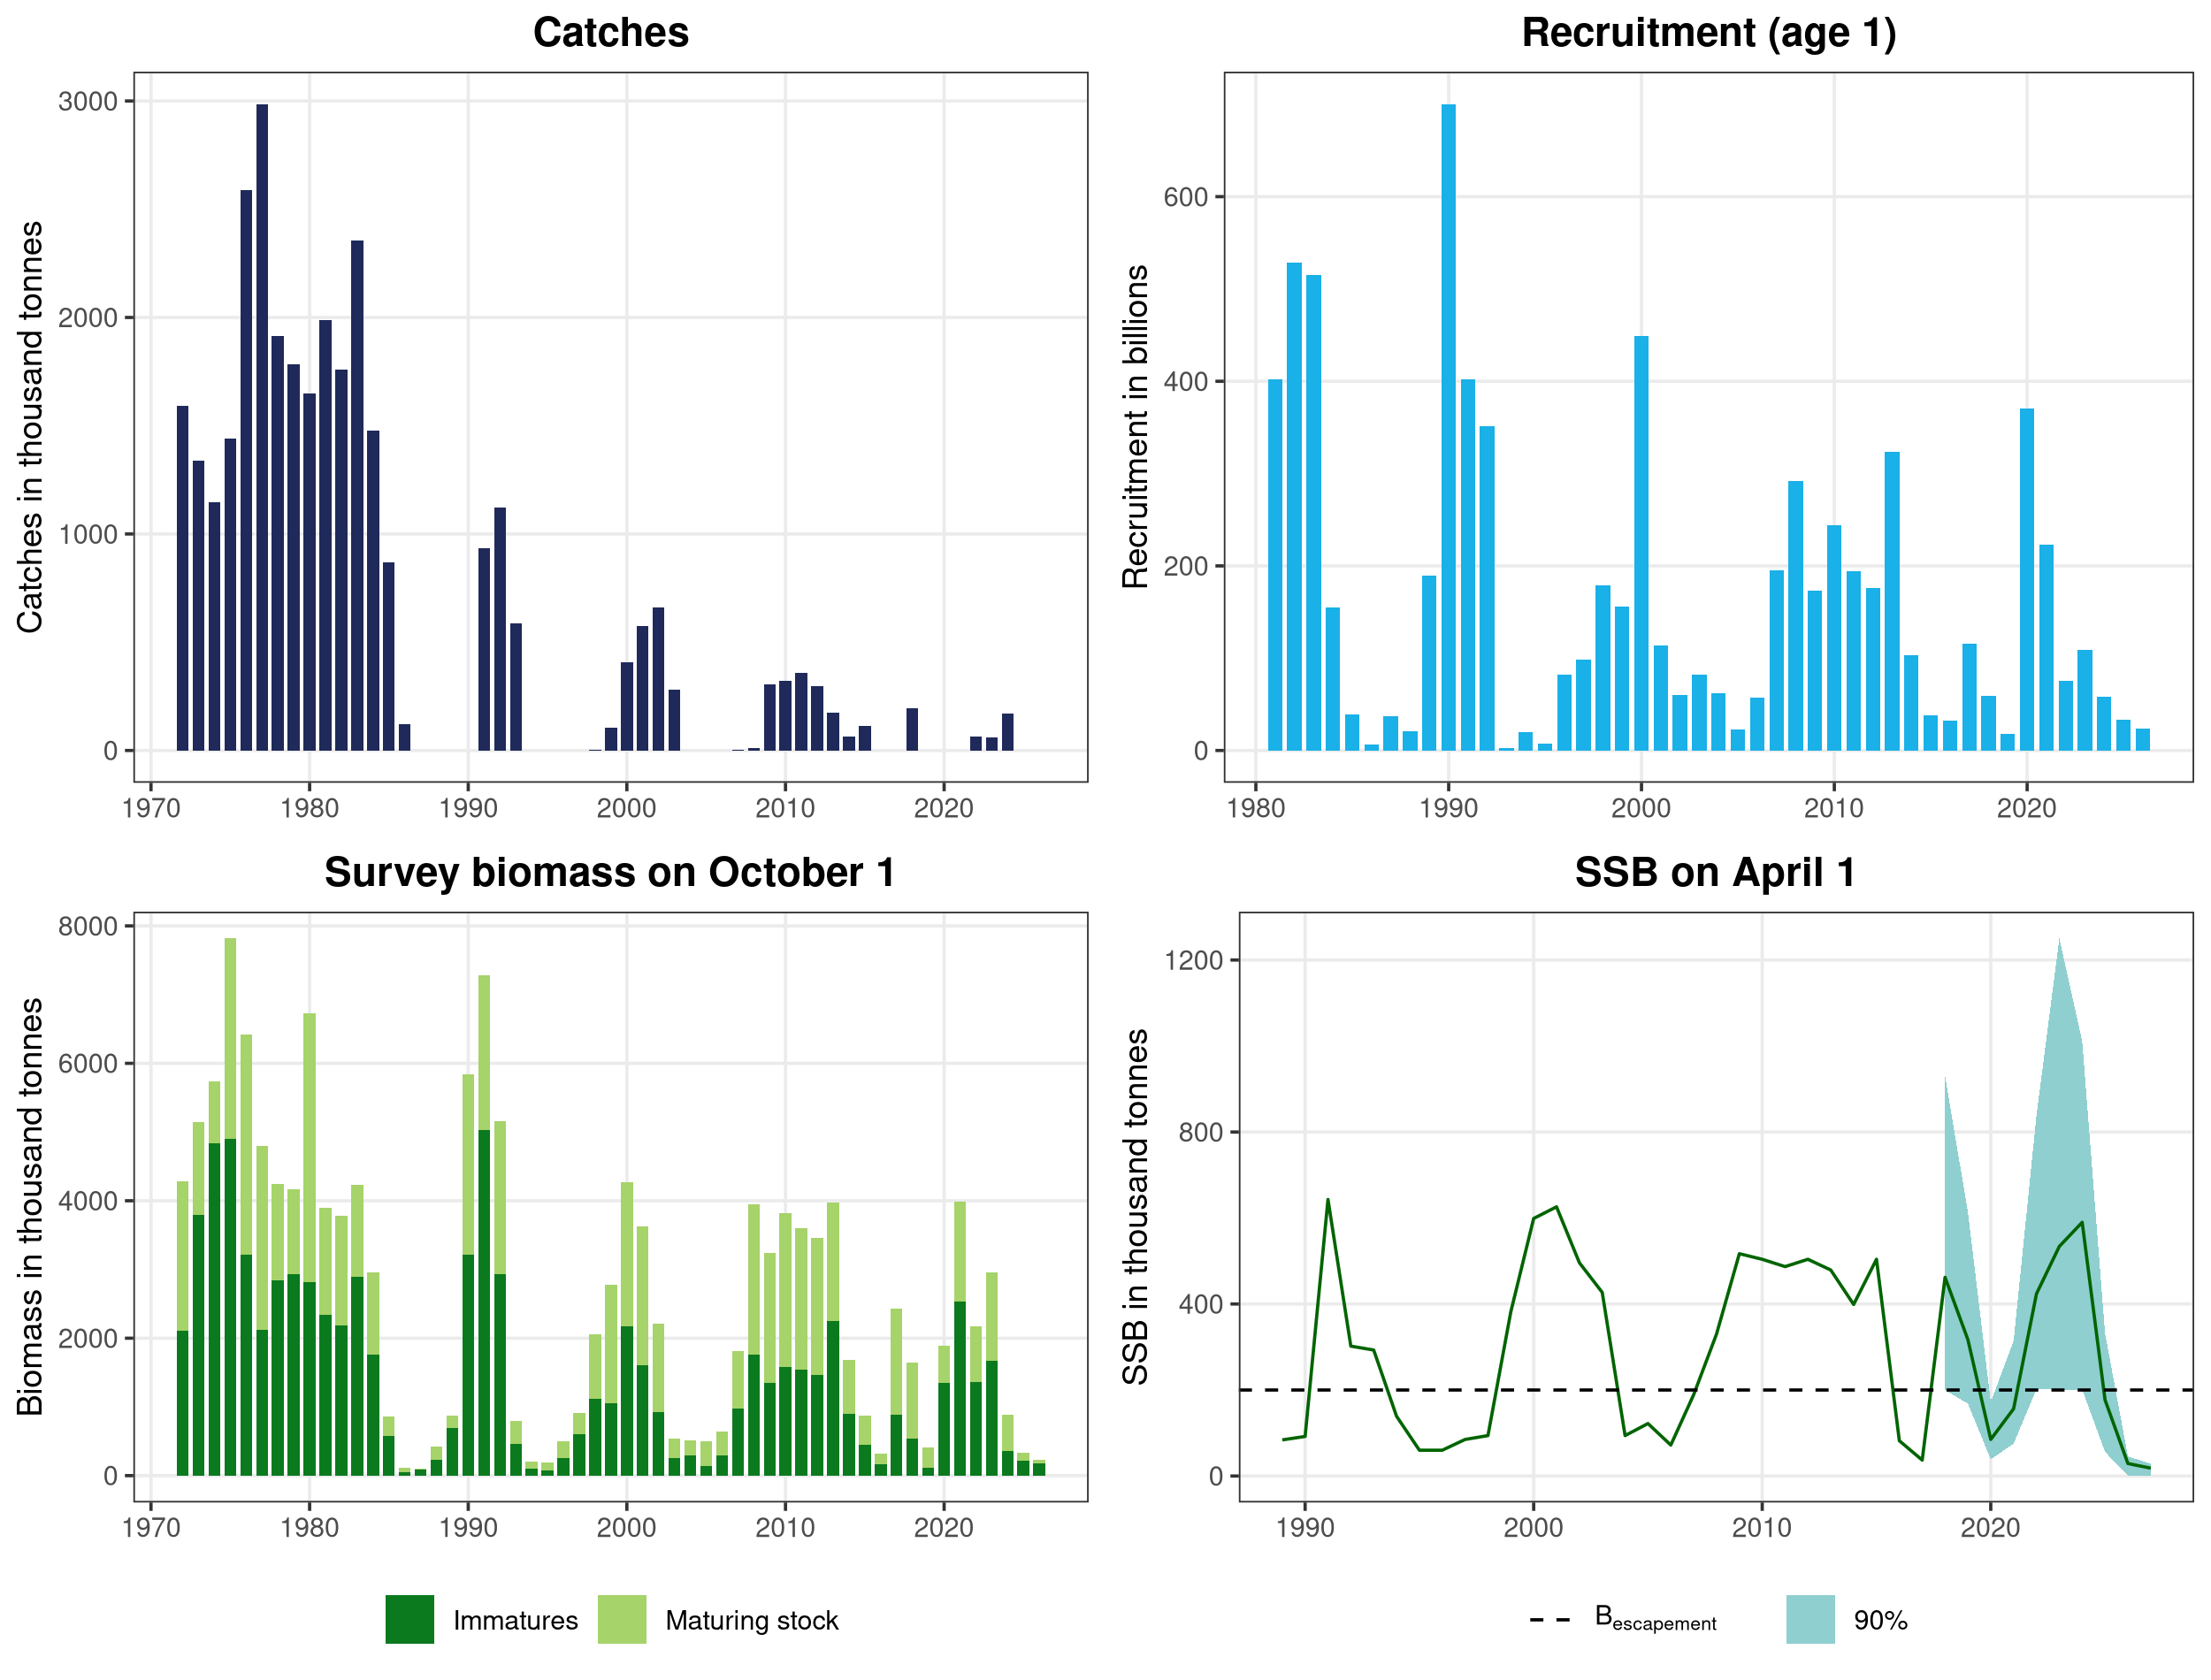
There is less than 95% probability that the spawning stock size will be above Bescapement (200 000 tonnes) in 2027. No reference points for fishing pressure have been defined for this stock.
3 - Catch scenarios
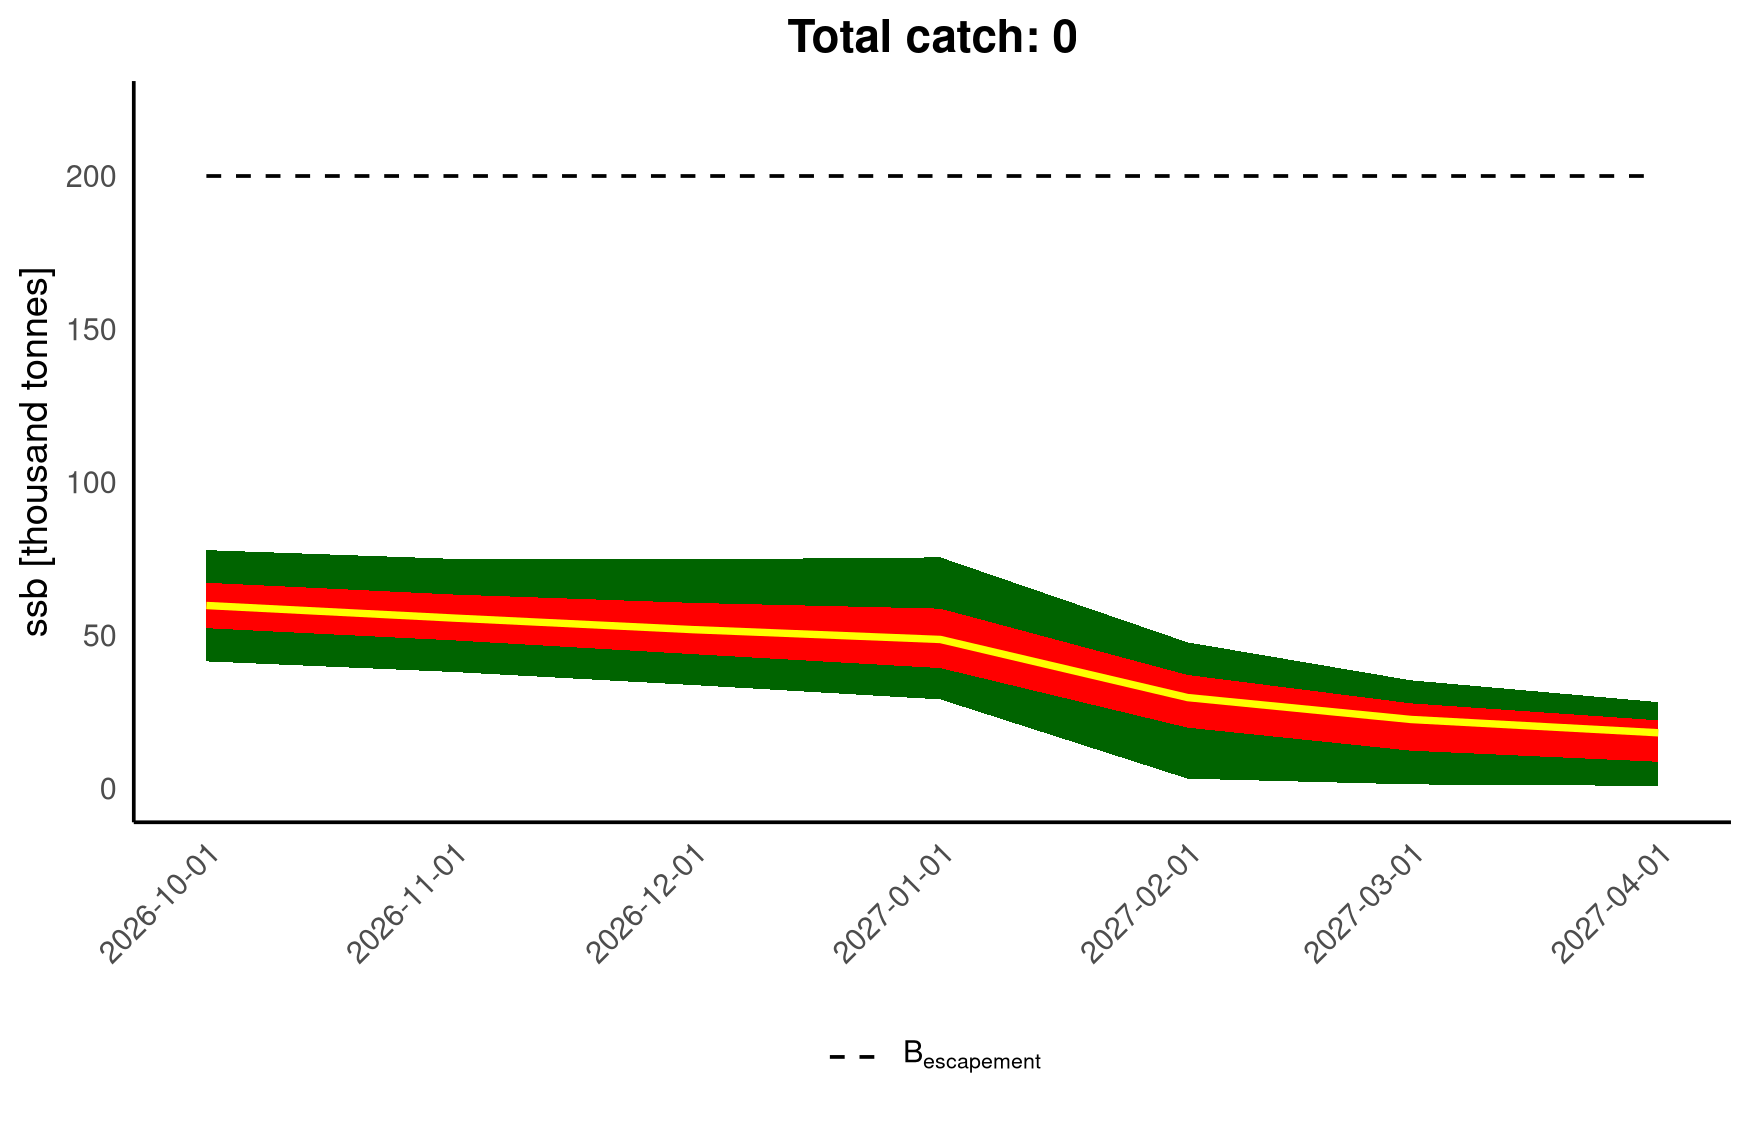
Calculations of catch scenarios are based on a forward projection from the autumn acoustic survey. SSB for April 2027 is calculated with different sources of natural mortality from 1 October to 31 December taken from historically observed survey mortalities, and predation by immature cod from January to March.
| Variable | Value | Notes |
|---|---|---|
| Maturing stock biomass 2026 | 60 000 | Median biomass of fish above the length at maturity (14 cm), estimated based on the autumn acoustic survey 1 October 2026 (from the Bifrost model run, rounded to the nearest 1000 tonnes). These fish will be spawning in April 2027. |
| Predation by immature cod January–March 2027; from the predation model | 30 000 | Based on the prediction of cod abundance in 2027 from the 2026 cod stock assessment (Howell et al., 2026). |
| Basis | Total catch (2027) | Median SSB (2027) | P(SSB 2027 > Bescapement) in % | % TAC change* | % advice change** |
|---|---|---|---|---|---|
| Advice basis | |||||
| MP harvest control rule, P(SSB > Bescapement=200 000 t) = 95% | 0 | 18 000 | 0 | N/A | N/A |
| Harvest control rule with P(SSB > Bescapement=150 000 t) = 95% | 0 | 18 000 | 0 | N/A | N/A |
* TAC (2027) vs. TAC (2026).
** Advice (2027) vs. Advice (2026).
4 - Basis of the advice
| Advice basis | Management plan |
| Management plan | In 2002, the Joint Norwegian–Russian Fisheries Commission (JNRFC) adopted the following harvest control rule (HCR) for Barents Sea capelin: 'The TAC for the following year should be set so that, with 95% probability, at least 200 000 tonnes of capelin (Blim) will be allowed to spawn'. ICES evaluated this HCR as well as alternative HCRs suggested by JNRFC in 2016 (ICES, 2016), and only the existing HCR was found to be precautionary. Following ICES evaluation, the JNRFC decided to maintain the existing HCR (JNRFC, 2016). It should be noted that the term Blim in the harvest control rule is replaced by Bescapement in the latest benchmark report (ICES, 2023a), and Bescapement is set to 200 000 tonnes (cf Table 4). |
5 - Quality of the assessment
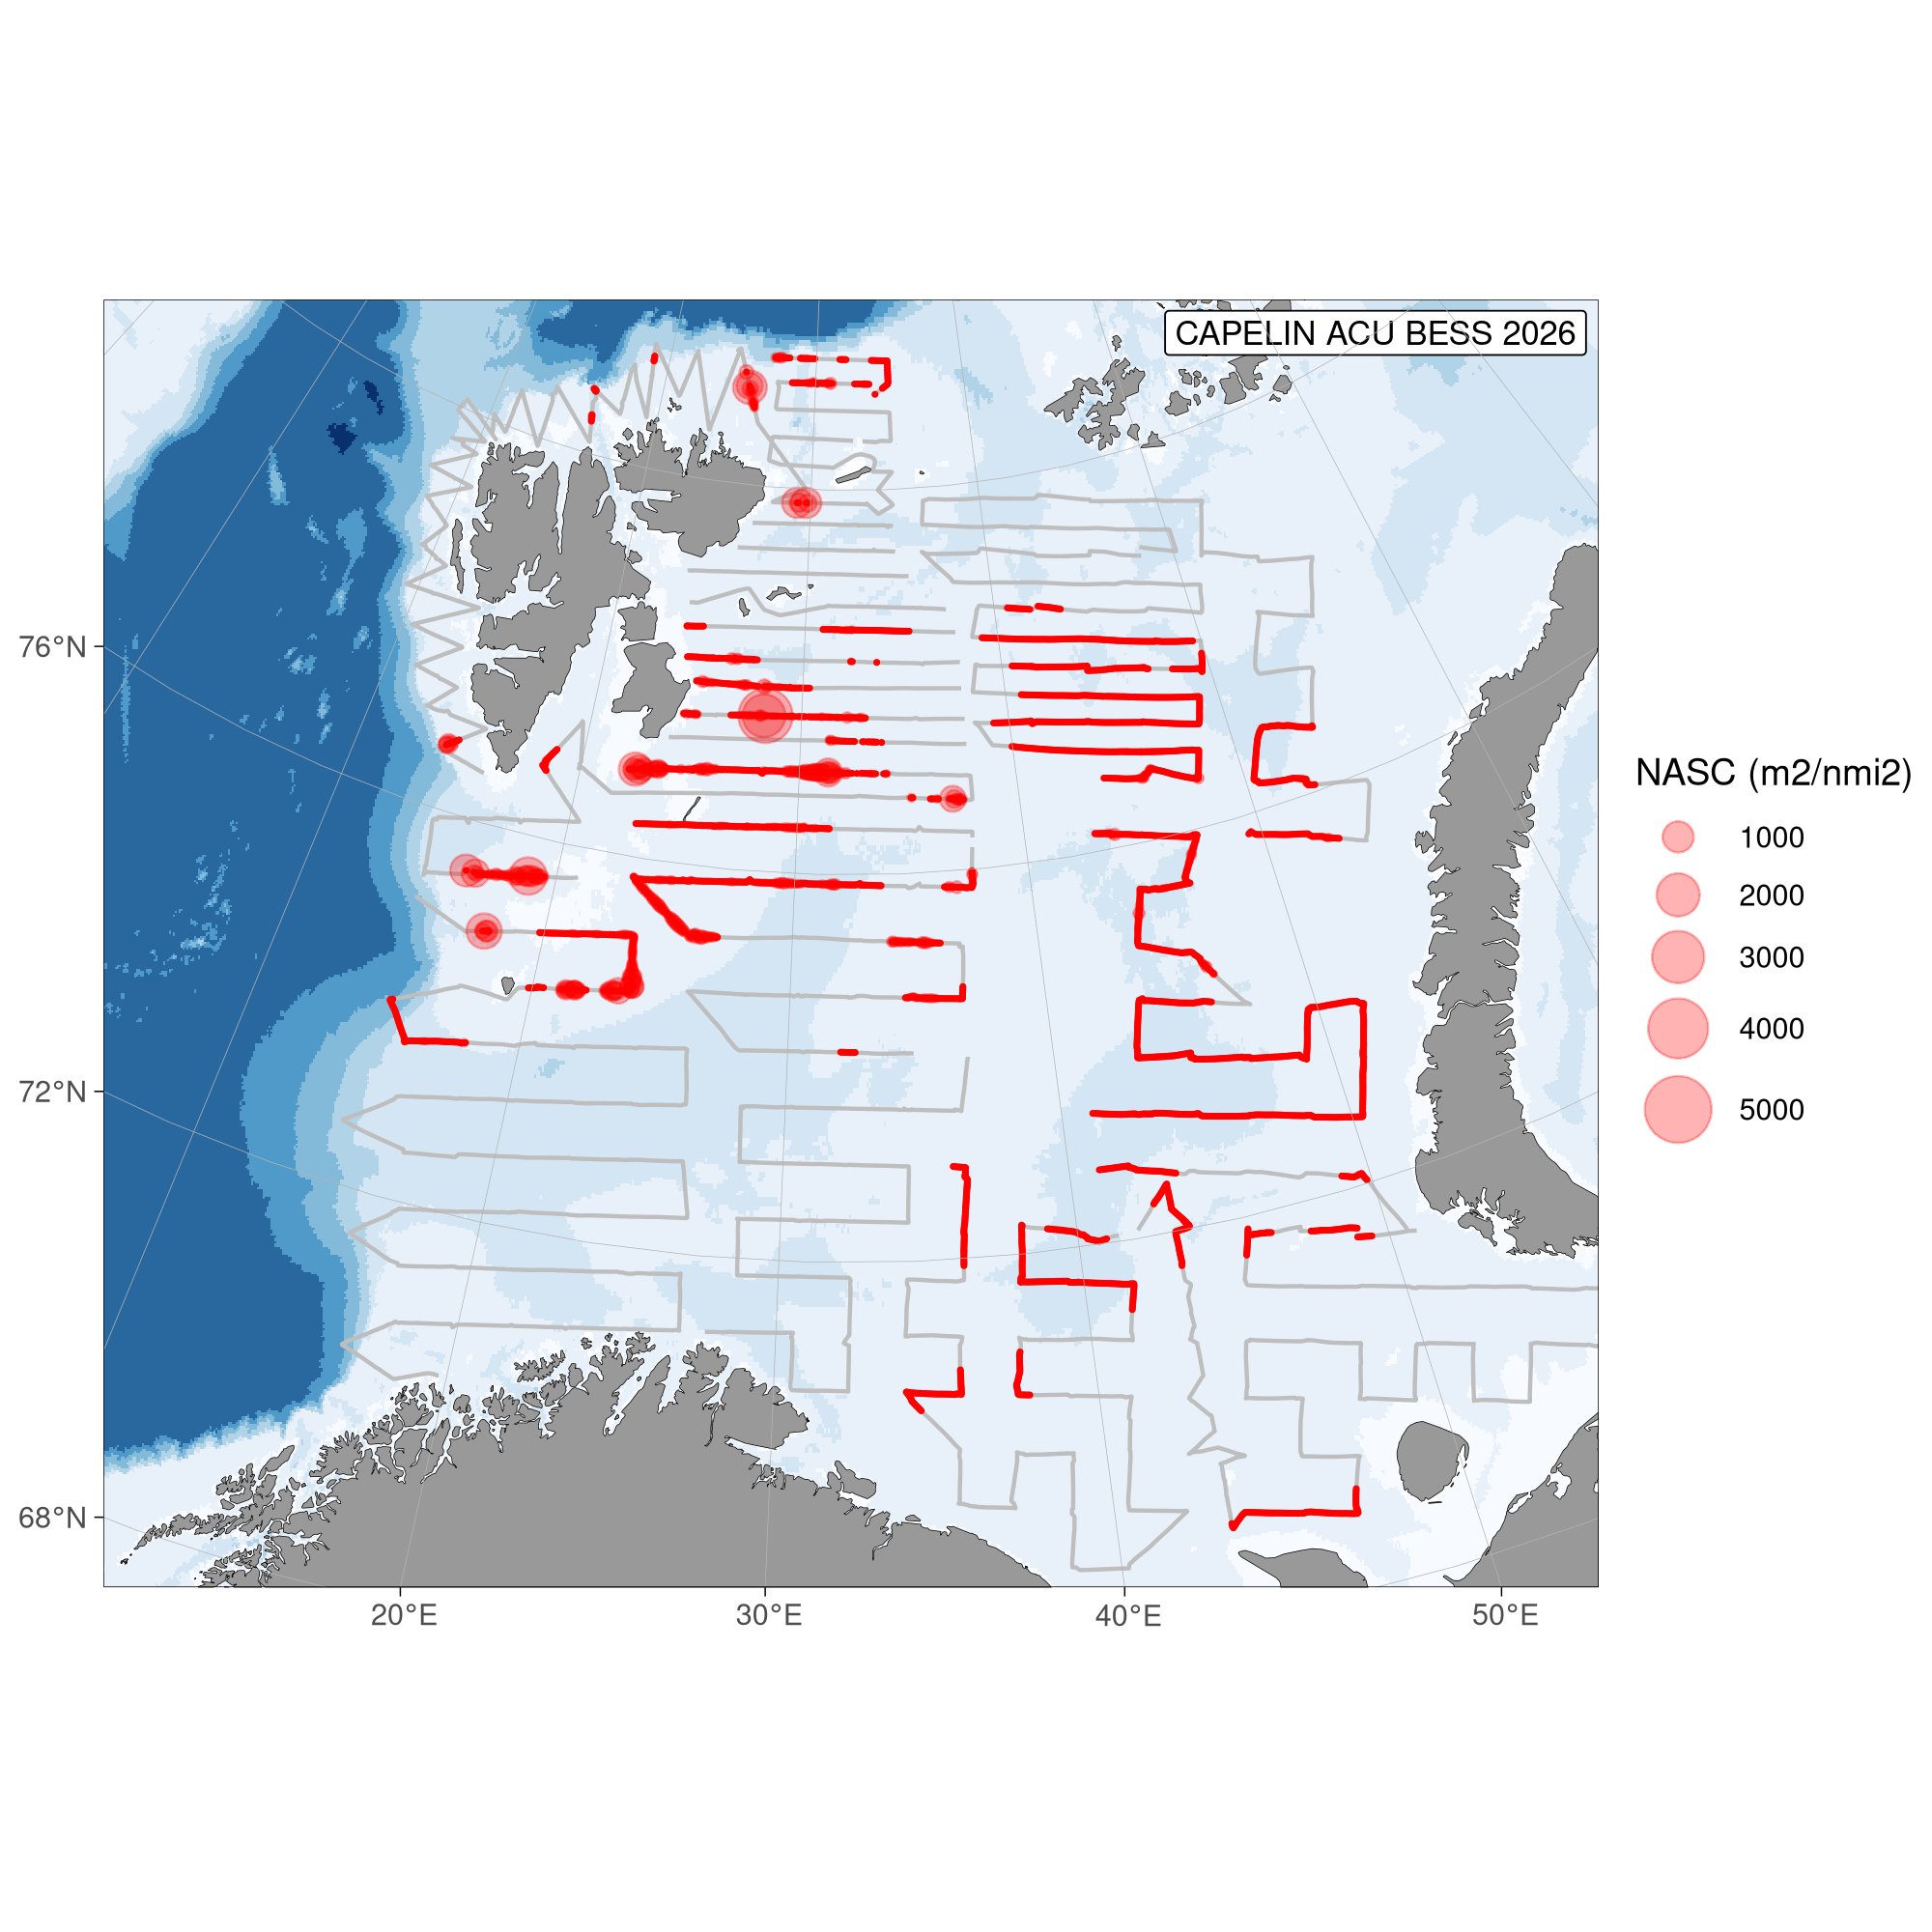
The geographical survey coverage of the Barents Sea capelin stock during the BESS in 2026 was good (Figure 3). In the main distribution area the degree of coverage was very good. Lack of coverage in the ‘Loophole’ was the only significant exception.
It was noted that several of the capelin schools observed acoustically had a stronger response at 200 than 38 kHz, and appeared weaker than expected at 38 kHz. This is known to sometimes occur in capelin (Silva et al. 2025), and the biomass of such schools is likely underestimated when using standard target strength to length conversion. Future work should try to quantify the magnitude of this phenomenon, and investigate whether it is more common in years of low capelin abundance.
6 - Issues relevant for the advice
This stock assessment has been conducted by the Joint Russian-Norwegian Arctic Fisheries Working Group (JRN-AFWG), consisting of scientists from VNIRO (Russia) and IMR (Norway), since 2022 (Howell et al., 2026).
This advice has been provided outside ICES and should not be considered as ICES advice. However, this assessment and advice have been produced following the methodology agreed at the ICES benchmark in 2022 (ICES, 2023a).
On request from managers (Joint Norwegian-Russian Fisheries Commission), Trochta et al. (2024) assessed harvest control rules for capelin in the Barents Sea using a management strategy evaluation (MSE), a modeling framework that simulates population and fishery responses to management actions. The form of the current escapement rule is retained and is defined by Bescapement, the biomass of spawning fish that should be left after fishing is accounted for. The MSE specifically tested four different Bescapement values (100 000, 150 000, 200 000 and 400 000 tonnes) with and without three alternative fixed minimum quotas (25 000, 50 000 or 75 000 tonnes).
All four Bescapement values without fixed minimum quotas maintained a low risk (<5%) of spawning biomass falling below Blim, the SSB below which recruitment is reduced, assuming historical capelin productivity, accurate survey estimates and that survey precision is correctly estimated. However, a Bescapement equal to 100 000 tonnes showed notably higher risk (of SSB<Blim) if the survey estimate is either biased high or survey precision is lower than assumed in the assessment. High probabilities of fishery closures resulted from Bescapement = 400 000 tonnes. All of the alternative rules using fixed minimum quotas showed very high risk of SSB falling below Blim and the model framework projected reduced future recruitment to the extent of stock collapse over the long term. In Table 2 we have thus provided catch options for the tested Bescapement values which were found to be precautionary, i.e. 150 000 and 200 000 tonnes (i.e. current HCR). Due to the low stock size, we do not show catch options for a Bescapement of 400 000 tonnes.
7 - Reference points
| Framework | Reference point | Value | Technical basis | Source |
|---|---|---|---|---|
| MSY approach | MSY Btrigger | Not defined | ||
| FMSY | Not defined | |||
| Precautionary approach | Blim | 68 000 t | SSB1990, which was the lowest SSB after the herring collapse that has produced a good year class. SSB estimated on April 1; tonnes | ICES (2023a) |
| Bpa | Not defined | |||
| Flim | Not defined | |||
| Fpa | Not defined | |||
| Management plan | Bescapement | 200 000 t | The TAC for the following year is set so that, with 95% probability, at least 200 000 tonnes of capelin (Bescapement) will be allowed to spawn | JNRFC (2016) |
| Fmgt | Not defined |
8 - Basis of the assessment
| ICES stock data category | 1 (ICES, 2023b). |
| Assessment type | Model based on acoustic survey and prediction six months ahead to calculate spawning biomass. Target escapement strategy used. |
| Input data | Norwegian–Russian acoustic survey in September. Model estimates of maturation based on survey data. Natural mortalities from multispecies model (predation by immature cod on prespawning capelin based on information on cod distribution, age composition, abundance and stomach content data). |
| Discards and bycatch | All catches are assumed to be landed. The amount of bycaught capelin in other fisheries is very low. |
| Indicators | None. |
| Other information | Latest benchmark was in 2022 (ICES, 2023a). |
| Working group | Joint Russian-Norwegian working group on Arctic Fisheries (JRN-AFWG). |
9 - History of the advice, catch, and management
| Year | Official advice | Catch corresponding to advice | Agreed TAC | Catch |
|---|---|---|---|---|
| 1988 | No catch | 0 | 0 | 0 |
| 1989 | No catch | 0 | 0 | 0 |
| 1990 | No catch | 0 | 0 | 0 |
| 1991 | TAC | 1000000 | 900000 | 933000 |
| 1992 | SSB > 400 000–500 000 t | 834000 | 1100000 | 1123000 |
| 1993 | A cautious approach, SSB > 400 000–500 000 t | 600000 | 630000 | 586000 |
| 1994 | No fishing | 0 | 0 | 0 |
| 1995 | No fishing | 0 | 0 | 0 |
| 1996 | No fishing | 0 | 0 | 0 |
| 1997 | No fishing | 0 | 0 | 1000 |
| 1998 | No fishing | 0 | 0 | 3000 |
| 1999 | SSB > 500 000 t | 79000 | 80000 | 105000 |
| 2000 | 5% probability of SSB < 200 000 t | 435000 | 435000 | 409000 |
| 2001 | 5% probability of SSB < 200 000 t | 630000 | 630000 | 575000 |
| 2002 | 5% probability of SSB < 200 000 t | 650000 | 650000 | 659000 |
| 2003 | 5% probability of SSB < 200 000 t | 310000 | 310000 | 282000 |
| 2004 | No fishing | 0 | 0 | 0 |
| 2005 | No fishing | 0 | 0 | 1000* |
| 2006 | No fishing | 0 | 0 | 0 |
| 2007 | No fishing | 0 | 0 | 4000* |
| 2008 | No fishing | 0 | 0 | 12000* |
| 2009 | 5% probability of SSB < 200 000 t | 390000 | 390000 | 307000 |
| 2010 | 5% probability of SSB < 200 000 t | 360000 | 360000 | 323000 |
| 2011 | 5% probability of SSB < 200 000 t | 380000 | 380000 | 360000 |
| 2012 | 5% probability of SSB < 200 000 t | 320000 | 320000 | 296000 |
| 2013 | 5% probability of SSB < 200 000 t | 200000 | 200000 | 176000 |
| 2014 | 5% probability of SSB < 200 000 t | 65000 | 65000 | 66000 |
| 2015 | 5% probability of SSB < 200 000 t | 6000 | 120000 | 115000 |
| 2016 | Zero catch | 0 | 0 | 0 |
| 2017 | Zero catch | 0 | 0 | 0 |
| 2018 | 5% probability of SSB < 200 000 t | 205000 | 205000 | 194520 |
| 2019 | Zero catch | 0 | 0 ** | 39* |
| 2020 | Management plan | 0 | 0** | 19* |
| 2021 | Management plan | 0 | 0** | 8* |
| 2022 | Management plan | ≤70000 | 70000 | 65249 |
| 2023 | Management plan | ≤62000 | 62000 | 60701 |
| 2024 | Management plan | ≤196000 | 196000 | 168694 |
| 2025 | Management plan | 0 | 0 | 700*** |
| 2026 | Management plan | 0 | 0 | 5*** |
| 2027 | Management plan | 0 |
*Research catch and bycatches in other fisheries.
**Up to 500 tonnes was allowed for research survey catches.
***Bycatches in other fisheries.
10 - History of catch and landings
| Year | Winter | Summer–Autumn | Year total | |||||
|---|---|---|---|---|---|---|---|---|
| Norway | Russia | Others | Total | Norway | Russia | Total | ||
| 1965 | 217 000 | 7 000 | 0 | 224 000 | 0 | 0 | 0 | 224 000 |
| 1966 | 380 000 | 9 000 | 0 | 389 000 | 0 | 0 | 0 | 389 000 |
| 1967 | 403 000 | 6 000 | 0 | 409 000 | 0 | 0 | 0 | 409 000 |
| 1968 | 460 000 | 15 000 | 0 | 475 000 | 62 000 | 0 | 62 000 | 537 000 |
| 1969 | 436 000 | 1 000 | 0 | 437 000 | 243 000 | 0 | 243 000 | 680 000 |
| 1970 | 955 000 | 8 000 | 0 | 963 000 | 346 000 | 5 000 | 351 000 | 1 314 000 |
| 1971 | 1 300 000 | 14 000 | 0 | 1 314 000 | 71 000 | 7 000 | 78 000 | 1 392 000 |
| 1972 | 1 208 000 | 24 000 | 0 | 1 232 000 | 347 000 | 13 000 | 360 000 | 1 592 000 |
| 1973 | 1 078 000 | 34 000 | 0 | 1 112 000 | 213 000 | 12 000 | 225 000 | 1 337 000 |
| 1974 | 749 000 | 63 000 | 0 | 812 000 | 237 000 | 99 000 | 336 000 | 1 148 000 |
| 1975 | 559 000 | 301 000 | 43 000 | 903 000 | 407 000 | 131 000 | 538 000 | 1 441 000 |
| 1976 | 1 252 000 | 228 000 | 0 | 1 480 000 | 739 000 | 368 000 | 1 107 000 | 2 587 000 |
| 1977 | 1 441 000 | 317 000 | 2 000 | 1 760 000 | 722 000 | 504 000 | 1 226 000 | 2 986 000 |
| 1978 | 784 000 | 429 000 | 25 000 | 1 238 000 | 360 000 | 318 000 | 678 000 | 1 916 000 |
| 1979 | 539 000 | 342 000 | 5 000 | 886 000 | 570 000 | 326 000 | 896 000 | 1 782 000 |
| 1980 | 539 000 | 253 000 | 9 000 | 801 000 | 459 000 | 388 000 | 847 000 | 1 648 000 |
| 1981 | 784 000 | 429 000 | 28 000 | 1 241 000 | 454 000 | 292 000 | 746 000 | 1 987 000 |
| 1982 | 568 000 | 260 000 | 5 000 | 833 000 | 591 000 | 336 000 | 927 000 | 1 760 000 |
| 1983 | 751 000 | 373 000 | 36 000 | 1 160 000 | 758 000 | 439 000 | 1 197 000 | 2 357 000 |
| 1984 | 330 000 | 257 000 | 42 000 | 629 000 | 481 000 | 368 000 | 849 000 | 1 478 000 |
| 1985 | 340 000 | 234 000 | 17 000 | 591 000 | 113 000 | 164 000 | 277 000 | 868 000 |
| 1986 | 72 000 | 51 000 | 0 | 123 000 | 0 | 0 | 0 | 123 000 |
| 1987 | 0 | 0 | 0 | 0 | 0 | 0 | 0 | 0 |
| 1988 | 0 | 0 | 0 | 0 | 0 | 0 | 0 | 0 |
| 1989 | 0 | 0 | 0 | 0 | 0 | 0 | 0 | 0 |
| 1990 | 0 | 0 | 0 | 0 | 0 | 0 | 0 | 0 |
| 1991 | 528 000 | 159 000 | 20 000 | 707 000 | 31 000 | 195 000 | 226 000 | 933 000 |
| 1992 | 620 000 | 247 000 | 24 000 | 891 000 | 73 000 | 159 000 | 232 000 | 1 123 000 |
| 1993 | 402 000 | 170 000 | 14 000 | 586 000 | 0 | 0 | 0 | 586 000 |
| 1994 | 0 | 0 | 0 | 0 | 0 | 0 | 0 | 0 |
| 1995 | 0 | 0 | 0 | 0 | 0 | 0 | 0 | 0 |
| 1996 | 0 | 0 | 0 | 0 | 0 | 0 | 0 | 0 |
| 1997 | 0 | 0 | 0 | 0 | 0 | 1 000 | 1 000 | 1 000 |
| 1998 | 0 | 2 000 | 0 | 2 000 | 0 | 1 000 | 1 000 | 3 000 |
| 1999 | 50 000 | 33 000 | 0 | 83 000 | 0 | 22 000 | 22 000 | 105 000 |
| 2000 | 279 000 | 94 000 | 8 000 | 381 000 | 0 | 28 000 | 28 000 | 409 000 |
| 2001 | 376 000 | 180 000 | 8 000 | 564 000 | 0 | 11 000 | 11 000 | 575 000 |
| 2002 | 398 000 | 228 000 | 17 000 | 643 000 | 0 | 16 000 | 16 000 | 659 000 |
| 2003 | 180 000 | 93 000 | 9 000 | 282 000 | 0 | 0 | 0 | 282 000 |
| 2004 | 0 | 0 | 0 | 0 | 0 | 0 | 0 | 0 |
| 2005 | 1 000 | 0 | 0 | 1 000 | 0 | 0 | 0 | 1 000 |
| 2006 | 0 | 0 | 0 | 0 | 0 | 0 | 0 | 0 |
| 2007 | 2 000 | 2 000 | 0 | 4 000 | 0 | 0 | 0 | 4 000 |
| 2008 | 5 000 | 5 000 | 0 | 10 000 | 0 | 2 000 | 2 000 | 12 000 |
| 2009 | 233 000 | 73 000 | 0 | 306 000 | 0 | 1 000 | 1 000 | 307 000 |
| 2010 | 246 000 | 77 000 | 0 | 323 000 | 0 | 0 | 0 | 323 000 |
| 2011 | 273 000 | 87 000 | 0 | 360 000 | 0 | 0 | 0 | 360 000 |
| 2012 | 228 000 | 68 000 | 0 | 296 000 | 0 | 0 | 0 | 296 000 |
| 2013 | 116 000 | 60 000 | 0 | 176 000 | 0 | 0 | 0 | 176 000 |
| 2014 | 40 000 | 26 000 | 0 | 66 000 | 0 | 0 | 0 | 66 000 |
| 2015 | 71 000 | 44 000 | 0 | 115 000 | 0 | 0 | 0 | 115 000 |
| 2016 | 0 | 0 | 0 | 0 | 0 | 0 | 0 | 0 |
| 2017 | 0 | 0 | 0 | 0 | 0 | 0 | 0 | 0 |
| 2018 | 128 520 | 66 000 | 0 | 194 520 | 0 | 0 | 0 | 194 520 |
| 2019 | 5 | 34 | 0 | 39 | 0 | 0 | 0 | 39 |
| 2020 | 0 | 19 | 0 | 19 | 0 | 0 | 0 | 19 |
| 2021 | 0 | 8 | 0 | 8 | 0 | 0 | 0 | 8 |
| 2022 | 42 597 | 22 646 | 0 | 65 243 | 0 | 6 | 6 | 65 249 |
| 2023 | 37 652 | 23 040 | 0 | 60 692 | 0 | 9 | 9 | 60 701 |
| 2024 | 117 555 | 51 125 | 0 | 168 680 | 0 | 14 | 14 | 168 694 |
| 2025 | 0 | 0 | 0 | 0 | 0 | 700 | 700 | 700 |
| 2026 | 0 | 5 | 0 | 5 | 0 | 0 | 0 | 5 |
11 - Summary of the assessment
| Year | Predicted SSB assuming catch = advised catch, 1 April (tonnes) | Recruitment from autumn acoustic survey, 1 October | Stock biomass from autumn acoustic survey, 1 October (tonnes) | Catch | |||
|---|---|---|---|---|---|---|---|
| Median | 5th percentile | 95th percentile | Age 1, millions | Immature | Maturing | ||
| 1972 | 2 104 000 | 2 182 000 | 1 592 000 | ||||
| 1973 | 3 796 000 | 1 350 000 | 1 337 000 | ||||
| 1974 | 4 831 000 | 907 000 | 1 148 000 | ||||
| 1975 | 4 900 000 | 2 916 000 | 1 441 000 | ||||
| 1976 | 3 220 000 | 3 200 000 | 2 587 000 | ||||
| 1977 | 2 127 000 | 2 676 000 | 2 986 000 | ||||
| 1978 | 2 845 000 | 1 402 000 | 1 916 000 | ||||
| 1979 | 2 934 000 | 1 227 000 | 1 782 000 | ||||
| 1980 | 2 810 000 | 3 913 000 | 1 648 000 | ||||
| 1981 | 402 560 | 2 341 000 | 1 551 000 | 1 987 000 | |||
| 1982 | 528 310 | 2 187 000 | 1 591 000 | 1 760 000 | |||
| 1983 | 514 880 | 2 897 000 | 1 329 000 | 2 357 000 | |||
| 1984 | 154 750 | 1 756 000 | 1 208 000 | 1 478 000 | |||
| 1985 | 38 690 | 572 000 | 285 000 | 868 000 | |||
| 1986 | 6 029 | 55 000 | 65 000 | 123 000 | |||
| 1987 | 37 578 | 83 000 | 17 000 | 0 | |||
| 1988 | 20 987 | 227 000 | 200 000 | 0 | |||
| 1989 | 84 000 | 189 200 | 695 000 | 174 000 | 0 | ||
| 1990 | 92 000 | 700 370 | 3 221 000 | 2 617 000 | 0 | ||
| 1991 | 643 000 | 402 090 | 5 034 000 | 2 248 000 | 933 000 | ||
| 1992 | 302 000 | 351 290 | 2 927 000 | 2 228 000 | 1 123 000 | ||
| 1993 | 293 000 | 2 237 | 467 000 | 330 000 | 586 000 | ||
| 1994 | 139 000 | 19 761 | 105 000 | 94 000 | 0 | ||
| 1995 | 60 000 | 7 130 | 75 000 | 118 000 | 0 | ||
| 1996 | 60 000 | 81 907 | 254 000 | 248 000 | 0 | ||
| 1997 | 85 000 | 98 876 | 598 000 | 312 000 | 1 000 | ||
| 1998 | 94 000 | 179 026 | 1 123 000 | 932 000 | 3 000 | ||
| 1999 | 382 000 | 155 921 | 1 056 000 | 1 718 000 | 105 000 | ||
| 2000 | 599 000 | 449 166 | 2 177 000 | 2 097 000 | 409 000 | ||
| 2001 | 626 000 | 113 587 | 1 610 000 | 2 019 000 | 575 000 | ||
| 2002 | 496 000 | 59 703 | 919 000 | 1 290 000 | 659 000 | ||
| 2003 | 427 000 | 82 444 | 254 000 | 280 000 | 282 000 | ||
| 2004 | 94 000 | 62 056 | 289 000 | 225 000 | 0 | ||
| 2005 | 122 000 | 22 661 | 143 000 | 355 000 | 1 000 | ||
| 2006 | 72 000 | 57 294 | 289 000 | 348 000 | 0 | ||
| 2007 | 189 000 | 195 125 | 970 000 | 846 000 | 4 000 | ||
| 2008 | 330 000 | 292 392 | 1 766 000 | 2 185 000 | 12 000 | ||
| 2009 | 517 000 | 172 754 | 1 355 000 | 1 892 000 | 307 000 | ||
| 2010 | 504 000 | 243 649 | 1 576 000 | 2 248 000 | 323 000 | ||
| 2011 | 487 000 | 194 255 | 1 544 000 | 2 059 000 | 360 000 | ||
| 2012 | 504 000 | 176 130 | 1 460 000 | 1 996 000 | 296 000 | ||
| 2013 | 479 000 | 323 845 | 2 248 000 | 1 725 000 | 176 000 | ||
| 2014 | 399 000 | 103 136 | 904 000 | 785 000 | 66 000 | ||
| 2015 | 504 000 | 37 832 | 444 000 | 434 000 | 115 000 | ||
| 2016 | 82 000 | 32 575 | 163 000 | 153 000 | 0 | ||
| 2017 | 37 000 | 115 370 | 882 000 | 1 547 000 | 0 | ||
| 2018 | 462 000 | 200 000 | 930 000 | 58 812 | 541 000 | 1 100 000 | 194 520 |
| 2019 | 317 000 | 168 282 | 613 733 | 18 029 | 111 000 | 302 000 | 39 |
| 2020 | 85 110 | 38 830 | 171 850 | 370 016 | 1 348 000 | 542 000 | 19 |
| 2021 | 156 376 | 75 197 | 314 559 | 222 667 | 2 528 000 | 1 459 000 | 8 |
| 2022 | 423 751 | 201 897 | 838 670 | 75 460* | 1 356 000* | 817 000* | 65 249 |
| 2023 | 534 000 | 201 000 | 1 250 000 | 108 509 | 1 666 000 | 1 286 000 | 60 701 |
| 2024 | 590 000 | 201 000 | 1 011 000 | 58 560 | 353 000 | 534 000 | 168 694 |
| 2025 | 177 000 | 56 000 | 332 000 | 33 531 | 215 000 | 124 000 | 700 |
| 2026 | 29 082 | 1 317 | 45 784 | 24 094 | 174 000 | 60 000 | 5 |
| 2027 | 18 214 | 884 | 28 227 | ||||
*Not adjusted for incomplete survey coverage.
12 - References
Bogstad et al. 2026. Report of capelin assessment by the Joint Russian-Norwegian Working Group on Arctic Fisheries (JRN-AFWG) 2026. IMR-VNIRO report series x-2026, xx pp.
Howell, D. et al. 2026. Report of the Joint Russian-Norwegian Working Group on Arctic Fisheries (JRN-AFWG) 2026. IMR-VNIRO Report Series 5-2026, 323 pp.
ICES. 2001. Barents Sea capelin (Subareas I and II, excluding Division IIa west of 5°W). In Report of the Advisory Committee on Fishery Management, 2001, Part 1, Section 3.1.8, pp. 65–70. ICES Cooperative Research Report No. 246. 921 pp. https://doi.org/10.17895/ices.pub.5383.
ICES. 2016. Report of the second Workshop on Management Plan Evaluation on Northeast Arctic cod and haddock and Barents Sea capelin, 25–28 January 2016, Kirkenes, Norway. ICES CM 2016/ACOM:47. 76 pp. https://doi.org/10.17895/ices.pub.5296.
ICES 2023a. Benchmark workshop on capelin (WKCAPELIN). ICES Scientific Reports. 5:62. 282 pp. https://doi.org/10.17895/ices.pub.23260388
ICES. 2023b. Advice on fishing opportunities. In Report of the ICES Advisory Committee, 2023. ICES Advice 2023, section 1.1.1. https://doi.org/10.17895/ices.advice.22240624
JNRFC. 2016. Protocol of the 46th Session of the Joint Norwegian–Russian Fisheries Commission, Annex 12. Translated from Norwegian to English. For an accurate interpretation, please consult the text in the official languages of the Commission (Norwegian and Russian) at https://www.jointfish.com/content/download/501/6352/file/46-norsk.pdf (Norwegian) and https://www.jointfish.com/rus/content/download/502/6357/file/46-russisk.pdf (Russian).
Silva, T., S. Þ. Jónsson, T. C. dos Santos Schmidt, et al. 2025. Influence of diel vertical distribution and physiology on capelin (Mallotus villosus) target strength measurements. Reviews in Fish Biology and Fisheries 35:1935-1952. https://doi.org/10.1007/s11160-025-09987-y
Trochta, J., B. Bogstad, Y. Kovalev, D. Prozorkevich, G. Skaret, S. Vatnehol, and D. Howell. 2024. Report on evaluation of harvest rules for Barents Sea capelin in subareas 1 and 2 (Northeast Arctic), excluding Division 2.a west of 5°W - full report. IMR-PINRO Report Series 17-2024, 45 pp.