Summary
Increased and updated knowledge of reproductive strategies of fish is crucial to optimize the temporal and spatial planning for conducting seismic surveys; in order to reduce its potential negative ecosystems impacts. The overall goal of this study is to improve our knowledge about the spawning times of the major North Sea fish stocks.
This report describes sampling methods of eggs and larvae, the molecular barcode and traditional visual taxonomic analysing methods employed, and initial results from the total data collection period; August 2017 to August 2020. Four supply vessels from the oil industry provided weekly samples collected from the water column (10 m above bottom to surface) using WP-2 nets hauled at four locations in the North Sea (Tampen, Sleipner, Ekofisk and the Norwegian Trench). In total, 41 different fish taxa were identified from the samples. Based on historic data and previously published literature, our results agree with the expected number of the most prevalent fish species breeding in the North Sea. This dataset also includes identification of species not previously reported to spawn in the area; the Jeffrey`s goby (Buenia jeffreysii), Crystal goby (Crystallogobius linearis), Four-spot megrim (Lepidorhumbus boscii) and Acadian redfish (Sebastes fasciatus), which are more commonly distributed in areas southwest of the Norwegian sector. We also demonstrate a northward increase in species diversity. In general, a northbound trend was identified with a decreasing temporal spawning window, and this applied in also for some species that spawned throughout the study area, demonstrating their highly developed degree of ecological plasticity. Further, species with the most northernly spawning centers of gravity maintained their short spawning periods during spring at their southern spawning sites, while species with the southernmost spawning centers of gravity which have protracted spawning periods at Ekofisk have somewhat less protracted spawning period at Sleipner and Tampen. In addition, these southernly species also seem to switch their peak spawning from summer in the south to spring at Tampen.
Our results provide improved and updated knowledge about the spawning time resolution and knowledge of spawning peaks for the major North Sea reproducing species. This study delivers tools necessary to produce improved advice in timing, and to a certain degree also the spatial design, of seismic surveys to avoid negative impacts on the reproductive output of fish.
The project has demonstrated that commercial oil industry vessels can be utilized as research platforms for the collection of scientific information on spawning time for fish, and that the successful cooperation between scientists and the oil industry provides potential benefits and opportunities for developing future scientific advice for management of timing of seismic investigations necessary for oil exploitation.
Further recommended work: 1) to perceive temporal changes in the highly dynamic Norwegian Sea system, it is recommended to conduct studies on a regular basis; 2) since the sampling sites included in this study was largely governed by logistical opportunities, future studies can be designed to also consider updating knowledge about the Norwegian Sea's species preferred spawning habitats.
Introduction
Studies have shown that the sound from high-energy acoustic sources, such as those produced from geological surveys where seismic methods are applied can impact behaviour and causes physical damage to fish, depending of their immediate vicinity of the airguns(Falk and Lawrence 1973; Engås et al. 1993, 1996; Løkkeborg and Soldal 1993; Dalen et al. 1996; Evans and Nice 1996; Wardle et al. 2001; Slotte et al. 2004). The most susceptible periods for fish are associated to the spawning period with seismic signals affecting spawning behaviour and that juveniles, eggs and larvae stages are being the most vulnerable stages to physiological damage from the signals (Kostyuchenko 1973, Dalen et al. 1987, Knudsen et al. 1992, 1994, 1997, Holmstrøm 1993, Booman et al. 1996, Sætre & Ona 1996).
In the North Sea, more than 140 different species of fish have been identified, with the most economically important fish species accounting for less than 10 % of the number of species (Sundby et al. 2017). Despite the increased amount of studies and scientific information available concerning the biology and ecology of fish species in the North Sea, literature on spawning fish is still not very comprehensive with a distinct lack of information.
This initiated the project KINO-1 (“Dynamic Mapping of North Sea Spawning”, in 2014-2016), which mainly collated historic information on the spatial distribution of spawning areas and from various databases and literature. In addition, modelling on transport and dispersion of pelagic offspring from selected species were done. Finally, the literature on fish species spawning time was reviewed (Sundby et al., 2017). The latter review on spawning times exposed the need for further detailed information of the spawning periods and spawning dynamics, particularly in the Norwegian sector of the North Sea. Also, increased temperatures in the Northern part of the Atlantic Ocean over the last decades, likely affect indirectly or directly the distribution and abundance patterns of some fish species such as cod (Gadus morhua), haddock (Melanogrammus aeglefinus), whiting (Merlangius merlangus), saithe (Pollachius virens) and Norway pout (Trisopterus esmarkii) in the North Sea (Sundby et al., 2017). These species display a decrease in biomass and a shift in the distribution towards northeast, while other species such as sardines (Clupeidae) and anchovy (Engraulidae) have recently started to migrate towards the North Sea from the English Channel increasing in abundance. Consequently, these changes have altered the traditional preferred areas for feeding and spawning.
As an extension of KINO-1, subsequent preparations for a KINO-2 project were implemented including providing sampling equipment and the training of crew onboard supply vessels, from the Norwegian oil industry, for sample collection procedures of fish eggs and larvae, during spring 2017. Three sampling sites (Tampen, Sleipner and Ekofisk), located along a north-south axis, were chosen based on that this was where supply vessels could be located throughout the year. In 2019, a fourth sampling site, in the Norwegian trench, was included and established when an opportunity arose with the use of yet another vessel. Test collection of samples from the supply vessels for the KINO-2 project initiated during August 2017. Financing and official initiation of the KINO-2 project, started 1. May 2018. KINO-2 aims to improve knowledge about spawning areas and timing for the main fish species reproducing in the North Sea during 2017-2020 and the projects ends in 2021.
Herein, we present methods for the data collection, the molecular barcode and traditional visual taxonomic analysing methods employed, and results including data representing the total sampling period; August 2017 to August 2020. This information will be important for future production of robust management advice regarding timing and location of seismic surveys to minimize potential negative effects on reproduction and development of early life stages of the North Sea fishes.
Another important part of this project was to develop methods suitable for using commercial oil industry vessels as research platforms for the collection of scientific information on spawning for fish and to map potential fields in need of further knowledge acquisition.
Materials and Methods
Study site
Sampling sites were located preferably within 10 nautical miles of four different locations along a south-north latitudinal axis in the central and northern subregions of the North Sea (Figure 1); Ekofisk (the southernmost location), Sleipner (the middlemost location), Tampen and the Norwegian trench (the northernmost locations). The locations were selected due to: i) previous data availability for comparative purposes with the results from the former “KINO-1” project, and ii) their spatial importance for the oil industry activities.
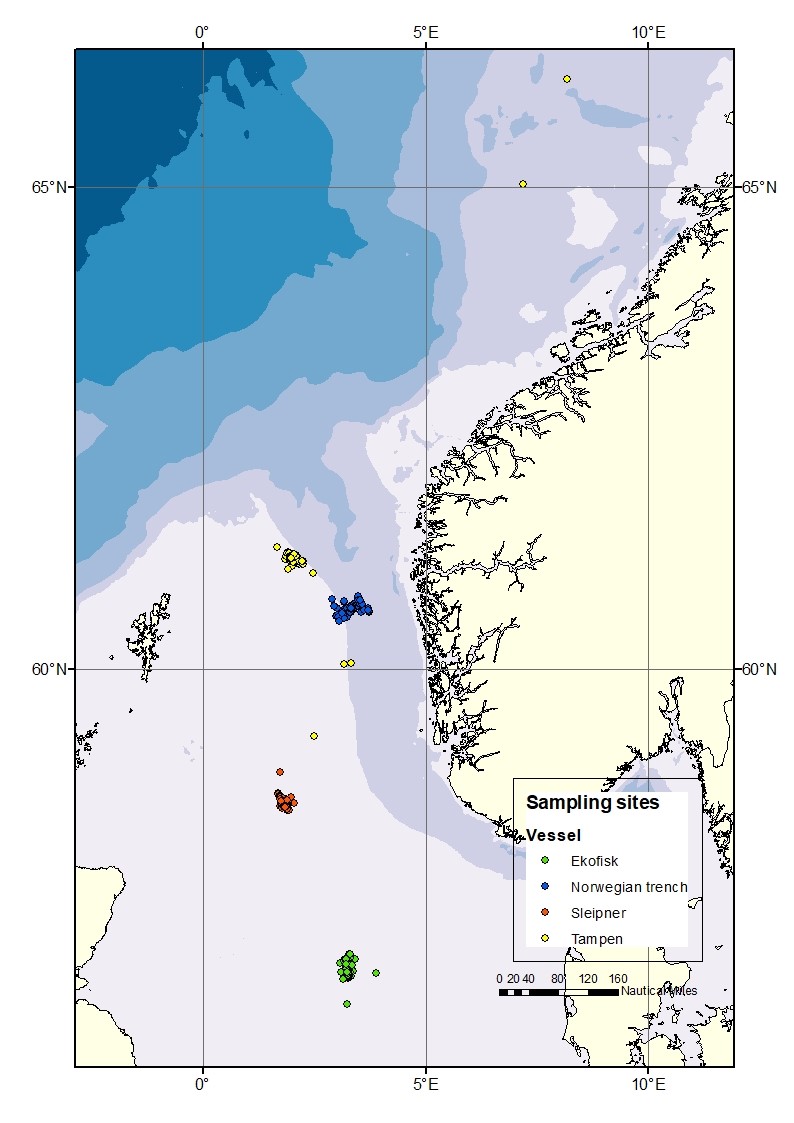
Figure 1. Map of the four different sampling sites: Ekofisk, Sleipner, Tampen and the Norwegian trench.
Sample collection
Samples have been collected by four different supply vessels managed by Equinor. Skandi Hugen collected samples at Ekofisk, Esvagt Bergen at Sleipner, Stril Herkules and Stril Merkur both at the locations Tampen and the Norwegian trench. The samples were scheduled to be collected once per week per sampling site using a double WP2 net with a mesh size of 500 µm and a mouth opening of 0.57m (0.25 m2) (Figure 2). The double WP2s was hauled two times on each site to increase the number of samples. Plankton sampling was performed by a vertical net-haul from 10 m above bottom at a wire speed of 0.5 m sec-1 to surface. The net configuration was chosen due to its ease of use and its resistance when used in relatively harsh weather conditions (Hassel et al., 2017). Each vessel was equipped with a RBRconcerto3 C.T.D which was attached to the net during each haul providing depth profiles of temperature and salinity. In addition, the vessels were equipped with a Starmon TD logger (Star Oddi, Iceland) permanently attached between the double nets and continuously logging with an interval of 10 seconds.
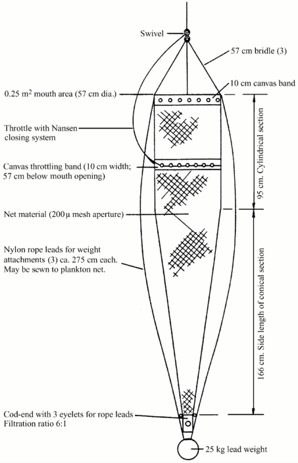
Figure 2. Diagram of a WP2 net (from Gjøsæter et al., 2000).
Samples from both hauls were sequentially poured from the cod-end through a 180 μm meshed sieve and transferred into a 100 mL square plastic bottle (Figure 3) for fixation. In the first haul samples from one net was preserved in 96% ethanol for the molecular taxonomic analyses, whereas samples from the second net was preserved in seawater borax buffered 4% formalin concentration for on shore visual taxonomic identification (Figure 3). This same procedure was repeated for the second haul.
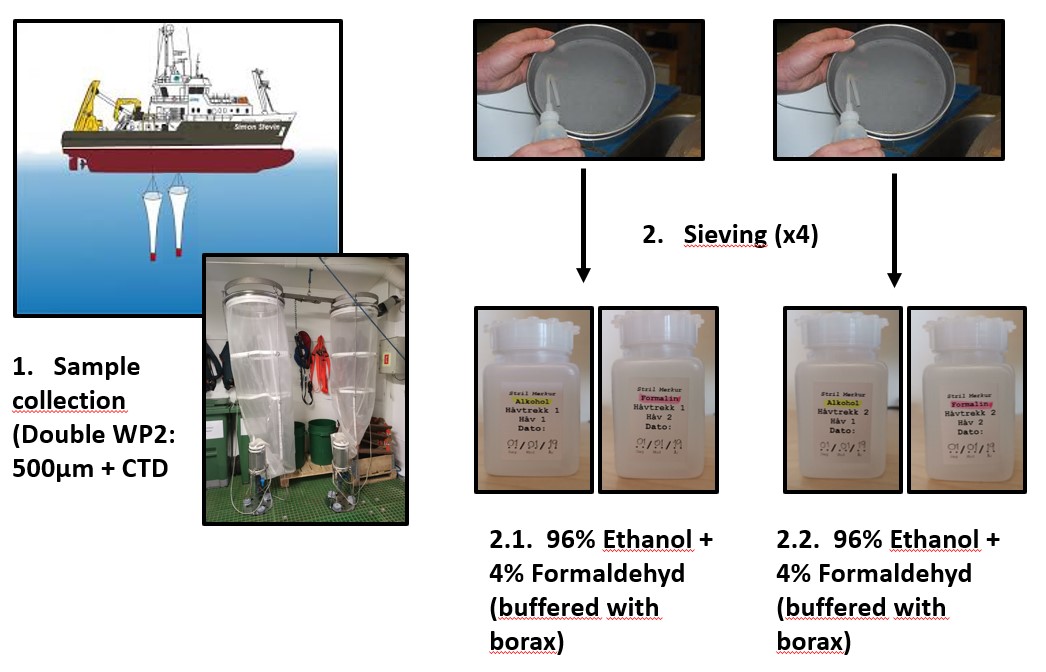
Figure 3. Diagram of the steps followed for sample collection.
Visual taxonomic method
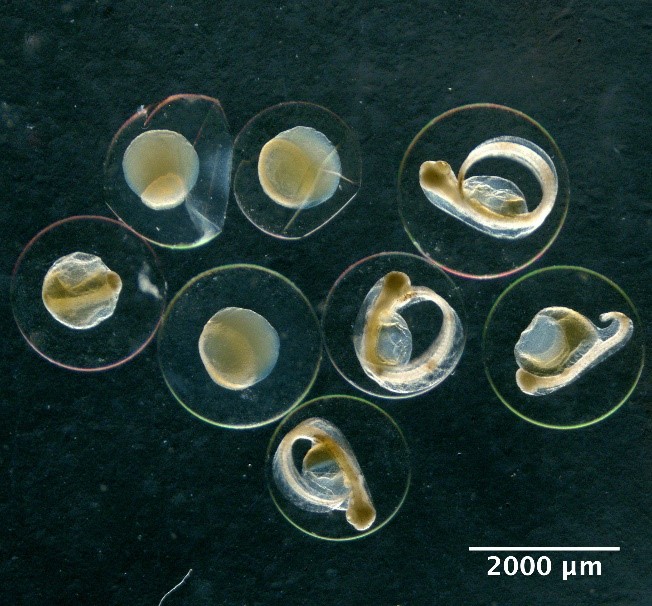
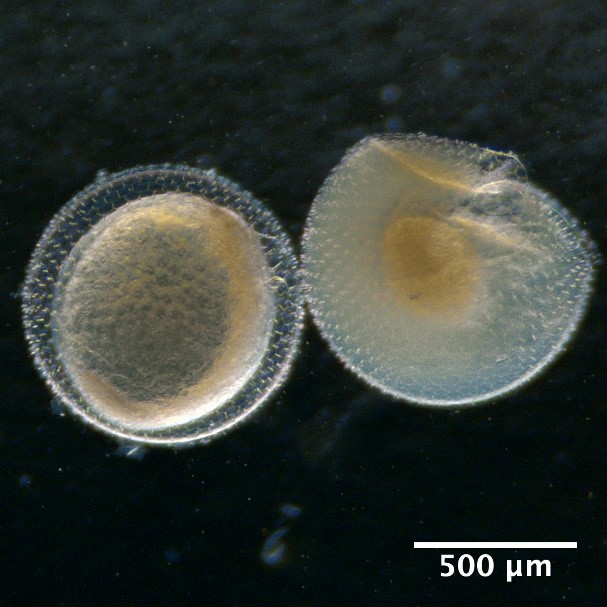
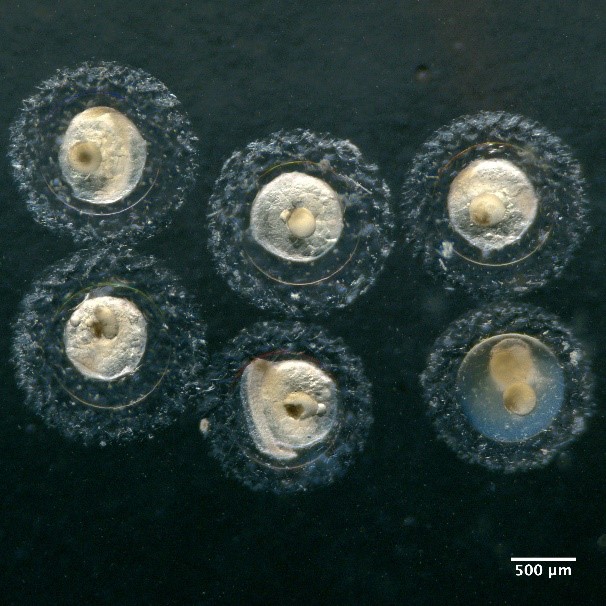
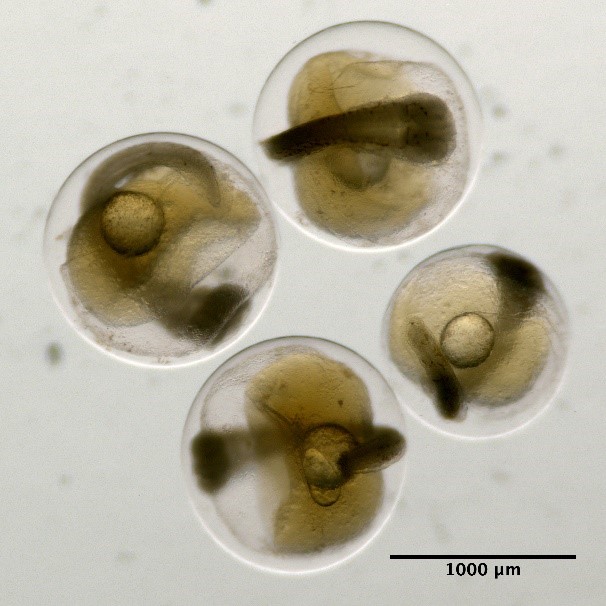
Fish eggs and larvae sorted from the samples preserved in seawater, borax buffered 4% formalin were identified to the lowest taxonomic level possible under binocular microscope following procedures described in previous studies (Russell 1976 and Munk 2005). Larval morphometry (e.g. standard length) was measured using a Leica M80 stereomicroscope with focusing arm (Leica Microsystems) using a millimeter paper.
The eggs were photographed under an Olympus SZX16 stereomicroscope (Olympus, Japan) with a 0.4575 pixels µm-1 resolution and subsequently measured using the open source image analysis program Image J (https://imagej.nih.gov/ij/) with the plugin ObjectJ (https://sils.fnwi.uva.nl/bcb/objectj/) and the Cindy's Fish Eggs project (https://sils.fnwi.uva.nl/bcb/objectj/examples/CindysFisheggs/Manual-Cindy-6.htm).
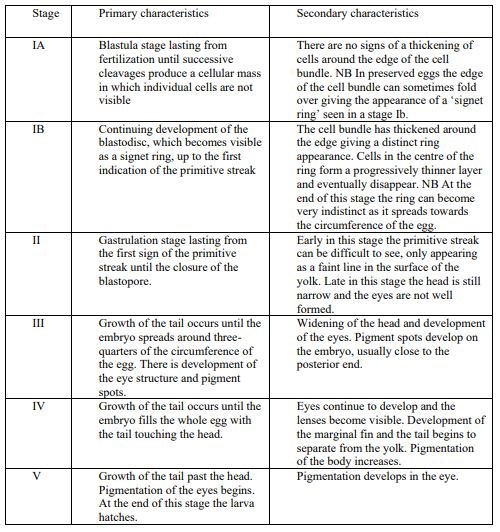
Egg identification was performed following the parameters described in Russel (1976) and the two main categories described in Ahlstrom and Geoffrey (1980). Briefly, eggs were classified according to: i) independent characters of the embryo (i.e. presence or absence of oil globules, egg size, egg shape, character of yolk, and width of the perivitelline space) and ii) dependent characters of the embryo (mainly pigment patterns). Furthermore, egg staging was determined based on the criteria following Thompson and Riley (1981). The developmental stages of eggs are divided into 5 stages, with primary and secondary characteristics (Apppendix material and methods). Stage IA and IB are often difficult to distinguish in preserved samples, and in this study, they were therefore they were merged into stage one.
Molecular taxonomic method
Both eggs and larvae present in the ethanol preserved samples were transferred collectively into a 24 mL scintillation bottle containing abundant pure ethanol (99%) and stored in the fridge at 4°C until further processing. To process the eggs and larvae for DNA sequencing a previously published workflow was followed (Mateos-Rivera et al., 2020). Briefly, for DNA isolation, either single eggs or larval eyes were placed in individual wells of the 200 µL 96 well-plates (Axygen Scientific, CA, USA) containing 75 µL of a solution 5% Chelex 100 Resin (BioRad, CA, USA) and 15 µL of Proteinase K (Qiagen, Germany). The 96 well-plates were then incubated at 56°C for 1 h followed by 10 min at 96°C. After a brief centrifugation, the supernatant containing the nucleic acids were transferred into new 96 well-plates.
Following DNA isolation, PCR amplification targeting the MT-CO1 gene was performed in 12 µL reactions containing 2.4 µL 5x buffer, 1 µL of MgCl2 [25 mM], 1.92 µL dNTPs [1.25 mM], 1.44 µL 10 µM primer pair combination (Table 1), 0.07 µL GoTaq G2 DNA polymerase (Promega, WI, USA), 3.17 µL dH2O and 2 µL template DNA. The PCR conditions were i) an initial denaturation of 2 min at 95°C, followed by ii) 38 cycles of amplification (denaturation 30 s at 94°C, annealing at 52°C for 30 s and an extension of 1 min at 72°C), and iii) a final extension of 10 min at 72°C. Clean-up of the PCR products were performed mixing 5 µL of the PCR product and 2 µL ExoSap-IT PCR product Cleanup (ThermoFisher, MA, USA) followed by an incubation at 37°C for 15 min and 80°C for 15 min. Finally, sequencing was performed using 1 µL of M13F primer [0.35 µM] (Table 1) at the sequencing facility at the University of Bergen (http://www.seqlab.uib.no). Sequence analysis were performed in Geneious v8.0.5 (Kearse et al., 2012). To confirm sequence identity, they were used as queries for BLASTn (Altschul et al., 1990) against the NCBI database (http://www.ncbi.nlm.nih.gov/blast).
Table 1. List of primers.
|
Primer
|
Sequence
|
Amount added (µL)
|
Reference
|
|
LepF1_t1
|
TGTAAAACGACGGCCAGTATTCAACCAATCATAAAGATATTGG
|
0.12
|
Ivanova et al. (2007)
|
|
VF1_t1
|
TGTAAAACGACGGCCAGTTCTCAACCAACCACAAAGACATTGG
|
0.12
|
Ivanova et al. (2007)
|
|
VF1d_t1
|
TGTAAAACGACGGCCAGTTCTCAACCAACCACAARGAYATYGG
|
0.12
|
Ivanova et al. (2007)
|
|
VF1i_t1
|
TGTAAAACGACGGCCAGTTCTCAACCAACCAIAAIGAIATIGG
|
0.36
|
Ivanova et al. (2007)
|
|
LepRI_t1
|
CAGGAAACAGCTATGACTAAACTTCTGGATGTCCAAAAAATCA
|
0.12
|
Ivanova et al. (2007)
|
|
VR1d_t1
|
CAGGAAACAGCTATGACTAGACTTCTGGGTGGCCRAARAAYCA
|
0.12
|
Ivanova et al. (2007)
|
|
VR1_t1
|
CAGGAAACAGCTATGACTAGACTTCTGGGTGGCCAAAGAATCA
|
0.12
|
Ivanova et al. (2007)
|
|
VR1i_t1
|
CAGGAAACAGCTATGACTAGACTTCTGGGTGICCIAAIAAICA
|
0.36
|
Ivanova et al. (2007)
|
|
M13F (-21)
|
CAGGAAACAGCTATGAC
|
1
|
Messing (1983)
|
Results
Since the beginning of the experiment in August 2017 until September 2020 a total of 1201 samples have been collected with irregular timing, especially during the initiation period of the project (Appendix Table S1). At Ekofisk, the southernmost location, a total of 356 different samples were collected. A total of 271 samples were collected at Sleipner, the middlemost location. At the two southernmost locations, Tampen and the Norwegian trench, a total of 364 and 210 samples were sampled, respectively (Appendix Table S1).
In total, 12125 individuals have been analysed. 6163 (4772 eggs and 1391 larvae) following the visual taxonomic approach and 5962 (5253 eggs and 709 larvae) for the molecular taxonomic approach. A total of 41 different species were identified during this project, including one species not previously described spawning in the Norwegian sector of the North Sea (Crystal goby, Crystallogobius linearis), two species with their core production regions west and south of the British Isles and not previously described spawning in the North Sea (Jeffrey's goby, Buenia jeffreysii, and four-spot megrim, Lepidorhombus boscii), and finally one species apparently not observed even in the Northeast Atlantic earlier (Acadian redfish, Sebastes fasciatus) (Table 2). We assume that the appearance of these novel species is part of the general poleward migration of species under the influence of global warming in the Northeast Atlantic over the recent 40 years. The majority of the 41 species were found at Tampen (31 species), while 23 species were found at Sleipner and at the Norwegian Trench, despite the lower number of samples collected at the latter location, and last 18 species were found at Ekofisk (Figure 4).
Table 2. List of all the species found in this study (including larvae and fish eggs) with their previously known spawning distribution (1: Sundby et al. 2017, 2: Heessen et al. 2015, 3: https://fishbase.in, 4: The first Jeffrey's goby caught on a fishing rod in Norway has arrived at Museum Stavanger. - Museum Stavanger). * Not previously described spawning in the Norwegian sector of the North Sea. **Not previously described spawning in the North Sea. *** Not previously described spawning in the Northeast Atlantic.
|
Latin name
|
Common name Known Spawning areas
|
|
Ammodytes marinus
|
Lesser sandeel Central/southern NS (1)
|
|
Argentina silus
|
Greater argentine Skagerrak/shelfbreak (1)
|
|
Argentina sphyraena
|
Lesser argentine Skagerrak/shelfbreak (2)
|
|
Arnoglossus laterna
|
Scaldfish Mainly in southern North Sea up to 57oN (2)
|
|
Benthosema glaciale
|
Glacier lantern fish Norwegian Trench (3)
|
|
Brosme brosme
|
Tusk Norwegian Trench (1)
|
|
**Buenia jeffreysii
|
Jeffrey's goby Only in the Irish Sea and Eng. Ch. (2,4)
|
|
Callionymus maculatus
|
Spotted dragonet Most of central and northern NS (2)
|
|
*Crystallogobius linearis
|
Crystal goby Not common in Norw. sector (2)
|
|
Echiodon drummondi
|
Pearlfish Western slope of Norw. Trench (2)
|
|
Enchelyopus cimbrius
|
Four-bearded rockling Very common in Norw, sect (2)
|
|
Eutrigla gurnardus
|
Grey gurnard Most of NS (2)
|
|
Gadiculus argenteus
|
Silvery pout Norw. Trench and shelf to the west (2)
|
|
Gadus morhua
|
Cod Larger part of NS (1)
|
|
Gaidropsaurus macrophthalmus
|
Bigeye rockling Northern and southern NS (2)
|
|
Gaidropsaurus vulgaris
|
Three-bearded rockling Northern and southern NS (2)
|
|
Glyptocephalus cynoglossus
|
Witch Northern NS and western edge of Norw. Trench (1)
|
|
Hippoglossoides platessoides
|
Long-rough dab Northern NS (1)
|
|
**Lepidorhombus boscii
|
Four-spot megrim West of Ireland (2)
|
|
Lepidorhombus whiffiagonis
|
Megrim Mainly west of Ireland and north of Scotland (2)
|
|
Limanda limanda
|
Dab Most of NS (1)
|
|
Maurolicus muelleri
|
Pearlside Norwegian Trench (1)
|
|
Melanogrammus aeglefinus
|
Haddock Northern NS (1)
|
|
Merlangius merlangus
|
Whiting Central NS (1)
|
|
Merluccius merluccius
|
European hake Central eastern NS (1)
|
|
Micromesistius poutassou
|
Blue whiting Northern edge of NS (1)
|
|
Microstomus kitt
|
Lemon sole Central NS (1)
|
|
Molva molva
|
Ling Northern edge of NS and Norw. Trench (1)
|
|
Phrynorhombus norvegicus
|
Norwegian topknot Mainly in southern NS and Irish Sea (2)
|
|
Pleuronectes platessa
|
Plaice Central and southern NS (1)
|
|
Pollachius pollachius
|
Pollack Northeastern NS (1)
|
|
Pollachius virens
|
Saithe Northern NS (1)
|
|
Scomber scombrus
|
Mackerel Central/Northern NS (1)
|
|
***Sebastes fasciatus
|
Acadian redfish Northwest Atl. From Maine to Iceland (3)
|
|
Sebastes viviparus
|
Norway redfish Northern North Sea (2)
|
|
Scophthalmus maximus
|
Turbot Mainly in the southern NS. Also in southern Norw. S (2)
|
|
Sprattus sprattus
|
Sprat Minor spawning areas to the west of Norw.Tr. (1,2)
|
|
Trachurus trachurus
|
Atlantic horse mackerel Entire NS (2)
|
|
Trisopterus esmarkii
|
Norway pout Northern NS (1)
|
|
Trisopterus minutus
|
Poor cod Northern and central NS (1)
|
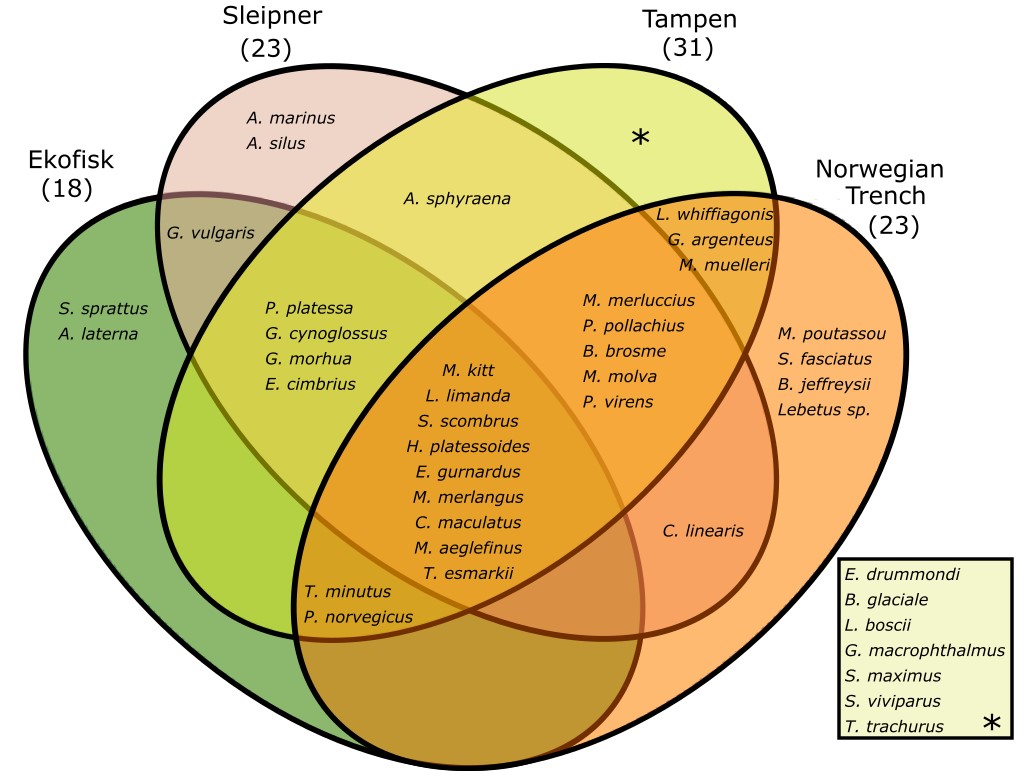
Figure 4. Venn diagram of the species found in this study per sampling site.
Nine species were detected in all of the four sampling sites, among them dab (L. limanda), whiting (M. merlangus), long-rough dab (H. platessoides) and mackerel (S. scombrus) (Fig. 4). Sprat (S. sprattus) and scaldfish (A. laterna) were only found at Ekofisk, the lesser sandeel (A. marinus) was only found in Sleipner and blue whiting (M. poutassou), arcadian redfish (S. fasciatus), Jeffrey’s goby (B. jeffreysii) and Lebetus sp. were only found at the Norwegian Trench (Fig. 4). Furthermore, 7 different species were only found at Tampen, including the glacier lantern fish (B. glaciale), the four-spot megrim (L. boscii) and turbot (S. maximus) (Fig. 4). Of the 41 different species found in this project 38 were detected using the molecular taxonomic approach and 22 using the visual taxonomic approach. Only the greater argentine (A. silus), pearlfish (E. drummondi) and Lebetus sp. where not found using the molecular taxonomic approach.
Among the four novel species, the crystal goby (C. linearis) with its core production region in the southern North Sea was found at Sleipner and in the Norwegian Trench. The other three species have apparently entered the North Sea by the Atlantic inflow from the northern entrance as they were found at Tampen (Four-spot megrey, L. boscii) and the Norwegian Trench (Jeffrey’s goby, B. jeffreysii, and Acadian redfish, S. fasciatus) respectively.
Visual taxonomic analyses
For the visual taxonomic method, total of 5863 individuals have been analysed, consisting of 4772 fish eggs and 1391 larvae. At Ekofisk, the southernmost location, there was a total of 1878 individuals (1580 eggs and 298 larvae), 2028 individuals (1501 eggs and 527 larvae) at Sleipner, 1821 individuals (1323 eggs and 498 larvae) at Tampen and 436 individuals (368 eggs and 68 larvae) at the Norwegian trench.
Fish eggs
Only a few species have been determined to species with a high certainty. Therefore, to still get a sense of the distribution, the eggs were categorized in different groups following the parameters described in Russel (1976) and the two main categories described in Ahlstrom and Geoffrey (1980) (Table 3).
Table 3. List of species and groups of fish eggs found a the different sites using the visual taxonomic analyses at the different sampling sites following parameters described in Russel (1976) and the two main categories described in Ahlstrom and Geoffrey (1980).
| Group |
Ekofisk |
Sleipner |
Tampen |
NT |
Total |
|
Eggs without oil globules and unsegmented yolk
|
1236 |
887 |
599 |
125 |
2847 |
|
Eggs with one oil globule and unsegmented yolk
|
87 |
441 |
191 |
123 |
842 |
|
Eggs with one oil globule and segmented yolk - Maurolicus muelleri
|
1 |
1 |
263 |
91 |
356 |
|
Large eggs with large perivitelline space - Hippoglossoides platessoides
|
211 |
79 |
39 |
2 |
331 |
|
Undetermined
|
45 |
92 |
78 |
10 |
225 |
|
Small eggs with sculptured membrane and no oil globule - Callionymidae
|
|
1 |
117 |
17 |
135 |
|
Eggs without oil globules and segmented yolk
|
|
|
29 |
|
29 |
|
Scomber scombrus
|
|
|
7 |
|
7 |
|
Eggs with several oil globules and yolk with peripheral segmentation
|
|
|
|
|
|
|
Eggs with several oil globules and unsegmented yolk
|
|
|
|
|
|
|
Pelagic oval eggs
|
|
|
|
|
|
The species long-rough dab, pearlside (M. muelleri), mackerel, and the family Callionymidae have clear characteristics, and therefore the species identification based on the taxonomy criteria’s can be made with a high certainty. However, for gadoids and many other species the identification is difficult if all species are spawning in the same area and many are overlapping in size, and thus a grouping on a higher level is necessary.
The most numerous group was the “eggs without oil globules and unsegmented yolk” with high numbers on all locations: 1234 eggs at Ekofisk, 887 eggs at Sleipner, 599 eggs at Tampen and 125 eggs at the Norwegian trench. This is a diverse group including many gadoid species such as cod (G. morhua), saithe (P. virens) and other common species such as dab. The same is also true for the group “eggs with one oil globule and unsegmented yolk”, which is diverse and include many common species such as mackerel and European hake (M. merluccius).
Eggs of mackerel has only been found in the Tampen site. However, it should be noted that this species also falls in under the group “eggs with one oil globule and unsegmented yolk”, so it could be placed within this group if the identification characteristics were not clear. The group “eggs without oil globules and segmented yolk” has also only been found at Tampen. Furthermore, pearlside has been found in all locations in the visual taxonomic approach, however, with 263 and 91 individuals at Tampen and Norwegian trench, while only 1 egg has been found in the Ekofisk and Sleipner site. The family Callionymidae has been found in all sites besides at Ekofisk.
For the visual taxonomic approach fish eggs at all sites were also staged based on the criteria following Thompson and Riley (1981) (Table 4). Staging of the development stages of fish egg is only feasible using visual taxonomy and can give a good indication of the spawning time of the fish eggs. The incubation period is dependent on the temperature, the size of the egg and among if yolk the egg contains, and with this information a calculation can be made to give an approximate time of spawning (Russel, 1976).
Table 4. Developmental stages of species and groups of fish eggs found at all sites combined for the visual taxonomic approach based on the criteria following Thompson and Riley (1981).
| Group |
Developmental state |
| |
1 |
2 |
3 |
4 |
5 |
|
Eggs without oil globules and unsegmented yolk
|
1318 |
168 |
462 |
655 |
244 |
|
Eggs with one oil globule and unsegmented yolk
|
359 |
52 |
183 |
185 |
63 |
|
Eggs with one oil globule and segmented yolk - Maurolicus muelleri
|
317 |
7 |
19 |
13 |
|
|
Large eggs with large perivitelline space - Hippoglossoides platessoides
|
94 |
27 |
77 |
81 |
52 |
|
Undetermined
|
148 |
17 |
36 |
13 |
11 |
|
Small eggs with sculptured membrane and no oil globule - Callionymidae
|
73 |
30 |
26 |
6 |
|
|
Eggs without oil globules and segmented yolk
|
|
|
|
25 |
4 |
|
Scomber scombrus
|
|
1 |
2 |
3 |
1 |
|
Eggs with several oil globules and yolk with peripheral segmentation
|
|
|
|
|
|
|
Eggs with several oil globules and unsegmented yolk
|
|
|
|
|
|
|
Pelagic oval eggs
|
|
|
|
|
|
| Total: |
2309 |
302 |
805 |
981 |
375
|
The highest number of eggs (with 2309 eggs) were eggs in developmental stage 1, followed by developmental stages 3 and 4, with 805 and 981 eggs, respectively. Of the 2309 eggs found in developmental stage 1, 1318 of the eggs belonged to the group “Eggs without oil globules and unsegmented yolk”, which is also the most numerous group overall. The lowest number of eggs were found in developmental stages 2 and 5, with 302 and 375 eggs, respectively. The different developmental stages have been found in almost every group and species, besides for the species pearlside and the family Callionymidae, in which the developmental stage 5 have not been found and developmental stage 1 for mackerel. Only developmental stage 4 and 5 have been found for the group “Eggs without oil globules and segmented yolk”.
Fish larvae
Most of the 1331 larvae were successfully assigned to species, genus or family level, with the exception of 60 individuals which were assigned as Undetermined and “Flatfish”. The remaining larvae were classified into 22 species (Table 5). Additionally, 158 larvae were assigned to 11 families (as species identification was not possible due to damage in the larvae or difficulties in larval identification). Overall, the most abundant species were the flatfish species dab with 322 individuals, followed by the gadoid species saithe and whiting with 163 individuals and 130 individuals, respectively (Table 5). A total of 6 species and 2 families were found at all four sampling locations: dab, whiting, Norway pout (T. esmarkii), long-rough dab, witch (G. cynoglossus), haddock (M. aeglefinus), gobies (Gobiidae) and gurnards (Triglidae). At Ekofisk three species were only found here: The species crystal goby (C. linearis), four-bearded rockling (E. cimbrius), and plaice (P. platessa). The species cod and greater argentine were only found at Sleipner, whereas the species megrim (L. whiffiagonis), pearlfish, Norwegian topknot (P. norvegicus), the families soles (Soleidae) and sea snails (Liparidae) were only found at Tampen, Lastly, at the Norwegian trench, the genus Lebetus sp was only found here.
Table 5. Larval species identified in this study using the visual taxonomic approach.
| Latin name |
Ekofisk |
Sleipner |
Tampen |
Norwegian Trench |
Total |
|
Limanda limanda
|
193 |
126 |
2 |
1 |
322 |
|
Pollachius virens
|
|
6 |
133 |
24 |
163 |
|
Merlangius merlangus
|
20 |
55 |
53 |
2 |
130 |
|
Trisopterus esmarkii
|
1 |
42 |
77 |
3 |
123 |
|
Scomber scombrus
|
|
61 |
6 |
19 |
86 |
|
Hippoglossoides platessoides
|
11 |
64 |
10 |
1 |
86 |
|
Glyptocephalus cynoglossus
|
19 |
43 |
8 |
1 |
71 |
| Callionymidae |
|
4 |
56 |
3 |
63 |
|
Melanogrammus aeglefinus
|
3 |
47 |
12 |
|
62 |
| Undetermined |
5 |
18 |
25 |
6 |
54 |
| Gadidae |
|
9 |
27 |
4 |
40 |
|
Molva molva
|
|
1 |
33 |
|
34 |
|
Microstomus kitt
|
13 |
2 |
2 |
|
17 |
|
Merluccius merluccius
|
|
4 |
12 |
|
16 |
|
Pollachius pollachius
|
1 |
10 |
4 |
|
15 |
|
Gadus morhua
|
|
15 |
|
|
15 |
|
Lepidorhombus whiffiagonis
|
|
|
14 |
|
14 |
|
Gobiidae
|
3 |
4 |
5 |
1 |
13 |
| Triglidae |
4 |
4 |
2 |
1 |
11 |
| Pleuronectidae |
4 |
|
5 |
1 |
10 |
| Phycidae |
1 |
3 |
2 |
|
6 |
| Argentinidae |
1 |
|
4 |
|
5 |
| Clupeidae |
4 |
1 |
|
|
5 |
|
Eutrigla gurnardus
|
4 |
1 |
|
|
5 |
|
Enchelyopus cimbrius
|
3 |
1 |
|
|
4 |
|
Flatfish
|
3 |
|
|
|
3 |
|
Argentina sphyraena
|
|
2 |
1 |
|
3 |
|
Pleuronectes platessa
|
3 |
|
|
|
3 |
|
Soleidae
|
|
|
2 |
|
2 |
|
Trisopterus sp.
|
|
2 |
|
|
2 |
| Ammodytidae |
1 |
1 |
|
|
2 |
|
Lebetus sp.
|
|
|
|
1 |
1 |
|
Argentina silus
|
|
1 |
|
|
1 |
|
Crystallogobius linearis
|
1 |
|
|
|
1 |
|
Echiodon drummondii
|
|
|
1 |
|
1 |
|
Liparidae
|
|
|
1 |
|
1 |
|
Phrynorhombus norvegicus
|
|
|
1 |
|
1 |
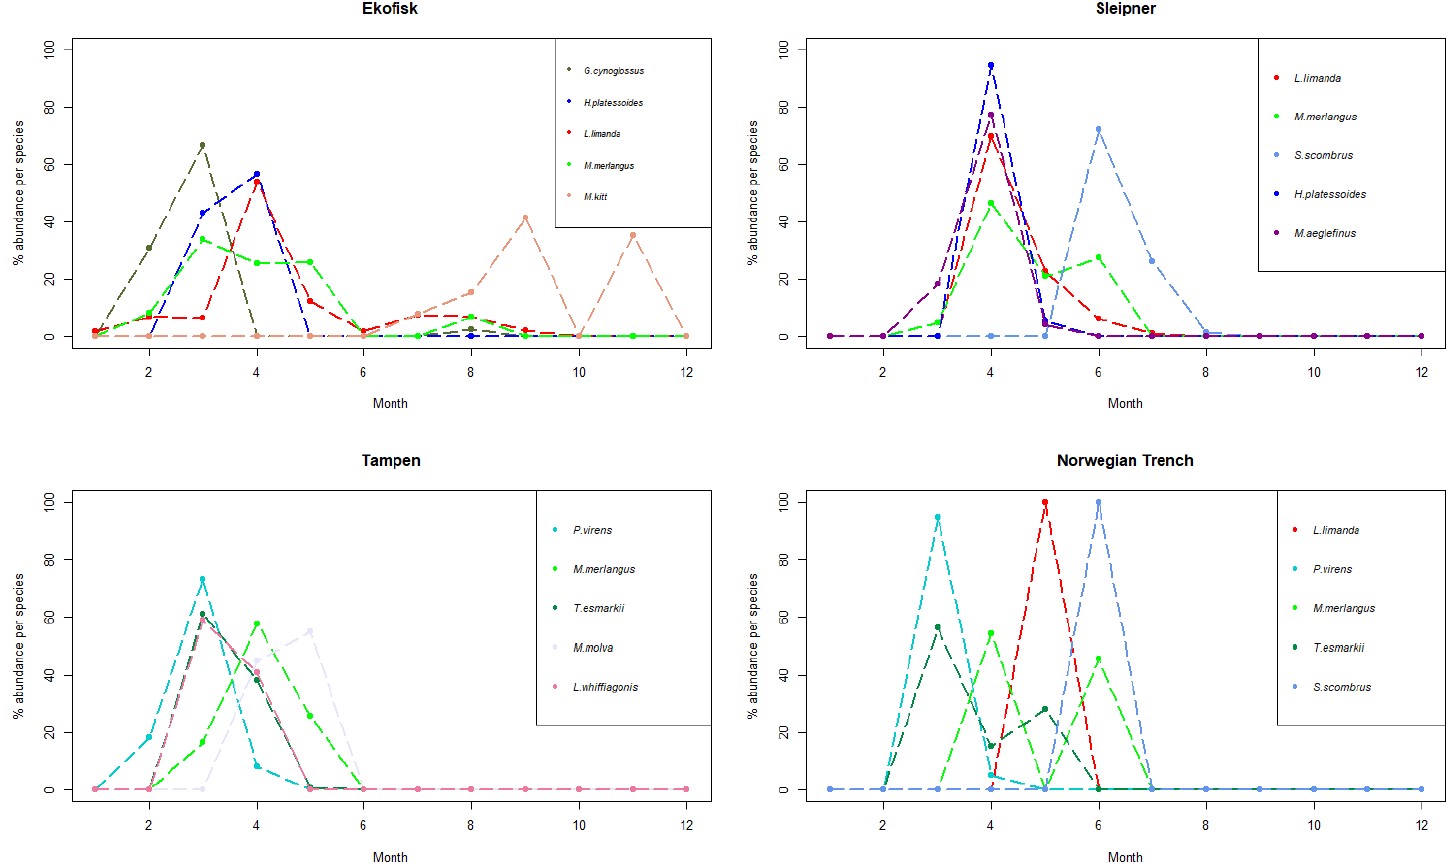
Figure 5. Line charts with the 5 more abundant species identified in the larvae collected during this project at the 4 sampling sites. The y-axis represents the % of abundance of each species per month (x-axis), respect to the total number of individuals retrieved from those individual species along the whole year. As different number of samples has been collected each month, data has been rarefied to 1 haul collected per month.
Ekofisk
At Ekofisk, the five most abundant larval species were more distributed across the whole year compared to the other 3 sites, with larval abundance spreading from January to November (except October) (Appendix Fig. S3). Of all the four sites, Ekofisk had the highest number of individuals of the species dab, with 193 individuals (Table 5). Dab was found in samples collected between January and September (Fig. S3), and dab was also the most dominant in the larval individuals in April, with 100 individuals (Figure 5). The second and third most abundant species was witch and whiting, where both species was found in February, March and August, and whiting was in addition found in April and May (Fig. 5). Lemon sole was found later in the year, in the months of July-September and November and the species long rough dab found early in the year in March and April (Fig. S3).
Sleipner
The abundance of four of the five dominant larval species at Sleipner showed a pattern with narrow abundance throughout the year, and larvae found in March to July peaking in April (Fig. 5). Mackerel however, showed a slightly different pattern with larval abundance from June to August and with a peak in June (Fig. 5). The most abundant species at Sleipner was dab, which was found in samples collected between April and July (Fig. S3), dominating as larval stage in April (Fig. 5). Mackerel was the second most abundant larval species, whereas the species long rough dab was the third most abundant species and was just found in April and May (Fig. S3). Other abundant species were whiting, which was found between the months of March and June, and haddock found between March and May (Fig. S3).
Tampen
As at Sleipner, Tampen displayed an abundance pattern concentrated during spring, with larvae found only between February and May (Fig. S3). The most abundant species was saithe, found in the months of February, March and April, with a peak in March (Fig. 5). Saithe was followed by Norway pout and whiting, and both species was found in samples collected in March, April and May, with peaks in March and April, respectively (Fig. 5). Ling (M. molva) was identified in samples collected during the months of April and May with a peak in May, whereas Megrim (L. whiffiagonis) was found in the months of March and April with a peak in March (Fig. 5).
Norwegian Trench
At the Norwegian Trench only 68 larvae were retrieved. From those, 24 larvae (35 %) were identified as saithe. Saithe was found between March and April (Fig. S3), being more abundant in March (Fig. 5). Saithe was followed in abundance by mackerel, which showed a different abundance pattern, with abundance only in June (Fig. S3). Other abundant species were Norway pout, whiting and dab (Fig. S3). Norway pout exhibited the same pattern as saithe, however with addition to abundance in May as well (Fig. S3). Whiting was detected in April and June, but not in the samples from May (Fig. S3). Dab had very low abundances than the other species and there was only retrieved one individual, and that was in May (Fig. S3).
Molecular taxonomic analyses
Regarding the molecular taxonomic approach, since the beginning of the project in August 2017, a total of 5962 individuals (5253 eggs and 709 larvae) were retrieved in all samples collected. For three of the four locations there is an increased number of individuals due to the higher number of samples collected. Samples collected at Sleipner contained 1902 individuals (1601 eggs and 301 larvae), while samples collected at Tampen included 1660 individuals (1457 eggs and 203 larvae), and 1634 individuals were retrieved at Ekofisk (1517 eggs and 117 larvae). At the Norwegian Trench only 242 individuals were found (210 eggs and 32 larvae). Furthermore, only 524 individuals (8.8 % of the total) could not be assigned to any taxa, including around 200 individuals from Sleipner that were poorly preserved. The most abundant species found as egg were dab, whiting and mackerel. However, the most abundant larvae were dab, followed by saithe and the long-rough dab. Only the lesser sandeel (A. marinus) and the Jeffrey’s goby (B. jeffreysii) were not found as egg (Table 6).
Table 6. List of species found using the molecular taxonomic analyses at the different sampling sites including the total numbers of fish eggs and larvae.
| |
Eggs
|
Larvae
|
|
|
|
Ekofisk
|
Sleipner
|
Tampen
|
Norwegian Trench
|
Total eggs
|
Ekofisk
|
Sleipner
|
Tampen
|
Norwegian Trench
|
Total Larvae
|
Total all
|
|
A. laterna
|
1
|
0
|
0
|
0
|
1
|
0
|
0
|
0
|
0
|
0
|
1
|
|
A. marinus
|
0
|
0
|
0
|
0
|
0
|
0
|
1
|
0
|
0
|
1
|
1
|
|
A. sphyraena
|
0
|
1
|
15
|
0
|
16
|
0
|
2
|
0
|
1
|
3
|
19
|
|
B. brosme
|
0
|
2
|
5
|
1
|
8
|
0
|
0
|
0
|
0
|
0
|
8
|
|
B. glaciale
|
0
|
0
|
2
|
0
|
2
|
0
|
0
|
0
|
0
|
0
|
2
|
|
B. jeffreysii
|
0
|
0
|
0
|
0
|
0
|
0
|
0
|
0
|
1
|
1
|
1
|
|
C. linearis
|
0
|
1
|
0
|
1
|
2
|
0
|
0
|
0
|
0
|
0
|
2
|
|
C. maculatus
|
2
|
4
|
128
|
12
|
146
|
0
|
1
|
6
|
0
|
7
|
153
|
|
E. cimbrius
|
4
|
45
|
4
|
0
|
53
|
0
|
2
|
1
|
1
|
4
|
57
|
|
E. gurnardus
|
51
|
72
|
19
|
3
|
145
|
3
|
0
|
1
|
0
|
4
|
149
|
|
G. argenteus
|
0
|
0
|
9
|
9
|
18
|
0
|
0
|
0
|
0
|
0
|
18
|
|
G. cynoglossus
|
11
|
32
|
6
|
0
|
49
|
0
|
8
|
3
|
0
|
11
|
60
|
|
G. macrophthalmus
|
0
|
0
|
1
|
0
|
1
|
0
|
0
|
0
|
0
|
0
|
1
|
|
G. morhua
|
9
|
31
|
8
|
0
|
48
|
0
|
7
|
0
|
0
|
7
|
55
|
|
G. vulgaris
|
2
|
6
|
0
|
0
|
8
|
0
|
0
|
1
|
0
|
1
|
9
|
|
H. platessoides
|
170
|
139
|
64
|
2
|
375
|
29
|
85
|
0
|
0
|
114
|
489
|
|
L. boscii
|
0
|
0
|
2
|
0
|
2
|
0
|
0
|
2
|
0
|
2
|
4
|
|
L. limanda
|
923
|
528
|
34
|
2
|
1487
|
59
|
75
|
0
|
0
|
134
|
1621
|
|
L. whiffiagonis
|
0
|
0
|
10
|
0
|
10
|
0
|
0
|
6
|
1
|
7
|
17
|
|
M. aeglefinus
|
1
|
89
|
43
|
1
|
134
|
1
|
26
|
8
|
0
|
35
|
169
|
|
M. kitt
|
29
|
13
|
10
|
2
|
54
|
0
|
1
|
2
|
0
|
3
|
57
|
|
M. merlangus
|
103
|
241
|
176
|
27
|
547
|
15
|
37
|
8
|
0
|
60
|
607
|
|
M. merluccius
|
0
|
68
|
10
|
1
|
79
|
0
|
0
|
1
|
0
|
1
|
80
|
|
M. molva
|
0
|
10
|
125
|
10
|
145
|
0
|
2
|
12
|
3
|
17
|
162
|
|
M. muelleri
|
0
|
0
|
264
|
49
|
313
|
0
|
0
|
0
|
0
|
0
|
313
|
|
M. poutassou
|
0
|
0
|
0
|
7
|
7
|
0
|
0
|
0
|
0
|
0
|
7
|
|
P. norvegicus
|
8
|
0
|
7
|
3
|
18
|
0
|
0
|
0
|
0
|
0
|
18
|
|
P. platessa
|
61
|
1
|
1
|
0
|
63
|
3
|
1
|
0
|
0
|
4
|
67
|
|
P. pollachius
|
0
|
2
|
27
|
11
|
40
|
0
|
0
|
1
|
0
|
1
|
41
|
|
P. virens
|
0
|
1
|
156
|
10
|
167
|
0
|
1
|
104
|
18
|
123
|
290
|
|
S. fasciatus
|
0
|
0
|
0
|
1
|
1
|
0
|
0
|
0
|
0
|
0
|
1
|
|
S. maximus
|
0
|
0
|
1
|
0
|
1
|
0
|
0
|
0
|
0
|
0
|
1
|
|
S. scombrus
|
48
|
259
|
135
|
42
|
484
|
0
|
0
|
4
|
0
|
4
|
488
|
|
S. sprattus
|
86
|
0
|
0
|
0
|
86
|
6
|
0
|
0
|
0
|
6
|
92
|
|
S. viviparus
|
0
|
0
|
1
|
0
|
1
|
0
|
0
|
2
|
0
|
2
|
3
|
|
T. esmarkii
|
7
|
56
|
165
|
13
|
241
|
1
|
50
|
40
|
7
|
98
|
339
|
|
T. minutus
|
1
|
0
|
28
|
3
|
32
|
0
|
2
|
1
|
0
|
3
|
35
|
|
T. trachurus
|
0
|
0
|
1
|
0
|
1
|
0
|
0
|
0
|
0
|
0
|
1
|
Fish eggs
Samples collected at Ekofisk had high dominance of dab (Table 6), one flatfish species with core spawning areas in the southern North Sea (Sundby et al. 2017). More than 60% of the eggs retrieved at this location were assigned to dab species with a spawning peak in March (Fig. 6) and a spawning period between February and August (Appendix Fig. S4). Following dab, the long-rough dab was the second most abundant species with 170 eggs found at Ekofisk. The spawning peak of the long rough dab was observed to happen in February (Fig. 6) and the spawning period between January and April (Fig. S4). The third most abundant species was whiting with 103 eggs, a spawning period between January and August (Fig. S4) with a spawning peak in March (Fig. 6). Amongst the other abundant species, plaice (P. platessa) was the dominant species in at the beginning of the year in January (Fig. 6), with a spawning period between December and March (Fig. S4). Further, all of the 86 eggs assigned to saithe (S. sprattus) were found within 2020, from February to April (Fig. S4), with a spawning peak in March.
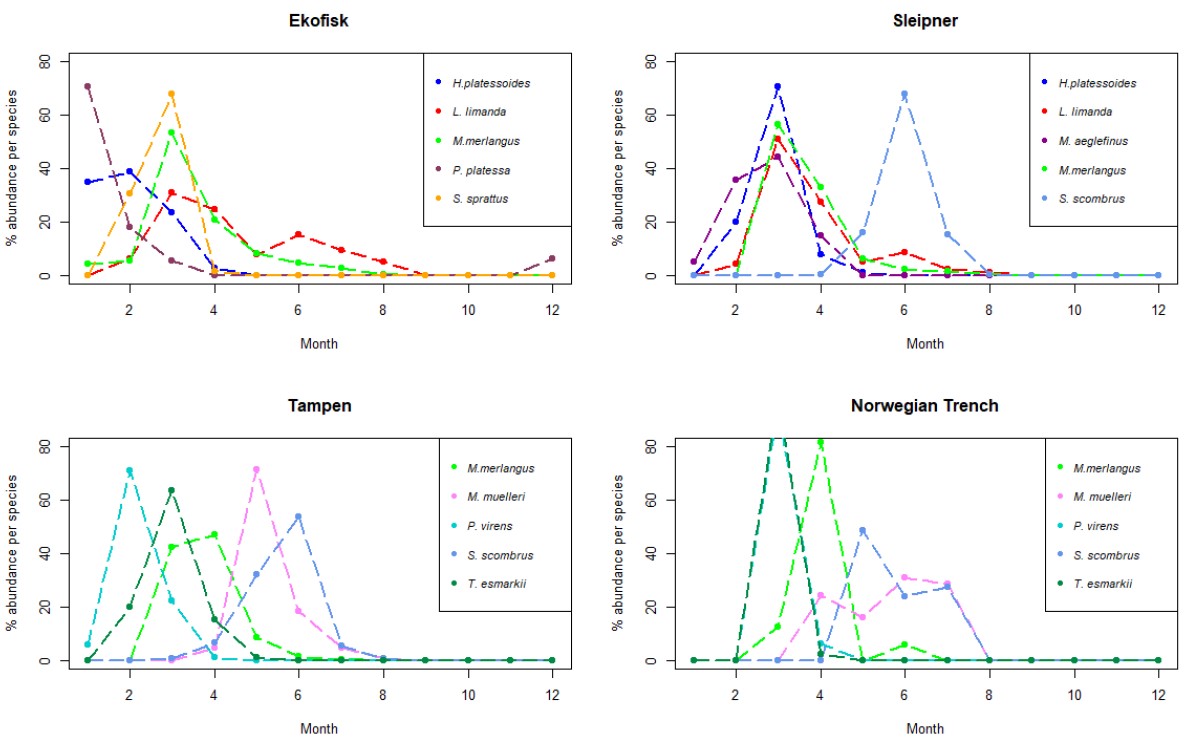
Figure 6. Line charts with the 5 more abundant species identified in the eggs collected during this project at the 4 sampling sites. The y-axis represents the % of abundance of each species per month (x-axis), respect to the total number of individuals retrieved from those individual species along the whole year. As different number of samples has been collected each month, data has been rarefied to 1 haul collected per month.
Sleipner
Samples collected at Sleipner followed the same dominance as Ekofisk with a clear dominance of dab. However, as Sleipner is localized at the border line between the central subregion and the northern subregion of the North Sea the abundance of dab only reached 32% of all the eggs identified at this location. Dab showed similar distribution across the year as at Ekofisk, being found between February and August (Fig. S4), with a spawning peak in March (Fig. 6). The second most abundant species at Sleipner was mackerel, with 16% of all the eggs collected. Mackerel had a narrower spawning period of April to August (Fig. S4) and later spawning peak, in June (Fig. 6). Whiting followed closely mackerel in abundance at Sleipner with 15% of the total eggs. Whiting had a shorter spawning period than what was observed for this species at Ekofisk, covering only 6 months (March to August; Fig. S4). However, the spawning peak was observed at the same time as at Ekofisk, in March (Fig. 6). Other less abundant species at this location were long-rough dab, with a spawning period from February to May (Fig. S4) and a spawning peak in March (Fig. 6), and haddock, found at the beginning of the year, between January and April (Fig. S4), and spawning peak in March (Fig. 6).
Tampen
At Tampen there was no clear dominance of one species as in the other two previous locations. In addition, most of the species had a very narrow spawning period from February to May, while at Ekofisk and Sleipner spawning was more protracted throughout the year (Fig. S4). Nonetheless, the spawning peaks of the most abundant species at Tampen occurred at different times of the year, unlike at Ekofisk and Sleipner (Fig. 6). The most abundant species at Tampen was pearlside with only 18% of all the identified eggs. Pearlside had a spawning period between April and August (Fig. S4) with a clear spawning peak in May (Fig. 6). Whiting followed pearlside in abundance with 12% of the eggs identified at Tampen. The spawning period of whiting was shorter than at Sleipner, following the pattern of a narrower spawning period towards the north. At Tampen, whiting was found between March and July (5 months; Fig. S4) and a spawning peak between March and April (Fig. 6). The third most abundant species at Tampen was Norway pout, with a spawning period between February and May (Fig. S4) and a spawning peak March (Fig. 6). Among the other most abundant species found at Tampen were saithe (P. virens), which was the dominant species at the beginning of the year with a spawning peak in February (Fig. 6) and a spawning period between January and April (Fig. S4). Mackerel was also represented at Tampen with 9% of all the identified eggs, a spawning period between March and August (Fig. S4) and a spawning peak in June (Fig. 6).
Norwegian Trench
The overall distribution of the spawning periods for the different fish species found at the Norwegian Trench was slightly different than at the other three locations with very short spawning periods and very high spawning peaks at a specific month, most of them in March or April (Fig. S4). This might be explained by the lower amount of eggs retrieved at this location, which was included in our results for the first time in August 2019. Therefore, the results at the Norwegian Trench might be somewhat biased by the amount of eggs obtained at this location. The most abundant species at the Norwegian Trench was also pearlside, with 23% of the identified eggs, a spawning period between April and July (Fig. S4) and a spawning peak, slightly later than at Tampen, between June and July (Fig. 6). Mackerel was the second most abundant species with 42 eggs identified at Tampen. Mackerel had spawning period between May and July (Fig. S4), peaking earlier than at Ekofisk, Sleipner and Tampen, in May (Fig. 6). Whiting was found between March and June (Fig. S4) peaking in April. However, no eggs were assigned to whiting in May. Among the other abundant species were saithe and Norway pout. Both of them were found between March and April (Fig. S4) with a clear spawning peak in March (Fig. 6)
Fish Larvae
Ekofisk
A similar pattern as for all three sampling locations, the number of collected larvae vs eggs at Ekofisk, were also lower. Only 8 different species were identified from the collected larvae’s, with dab as the most abundant larval species. Dab was mainly found in the samples collected in April (Fig. 7), i.e. one month later that what was observed for the eggs, and it could be identified in samples collected from March to August (Fig. S5), i.e. one less month than the eggs. However, no dab larvae were found in the samples collected in June. The long-rough dab followed dab in abundance. The long rough dab was found between February and May (Fig. S5), being dominant in the larval individuals collected in March at Ekofisk (Fig. 7). Whiting was the third most abundant larvae at Ekofisk with 15 individuals found between March and June (Fig. S5) and a peak in April (Fig. 7). Within the other abundant species were sprat with 6 larvae found in March and April and plaice with 3 individuals found in January and February (Fig. S5).
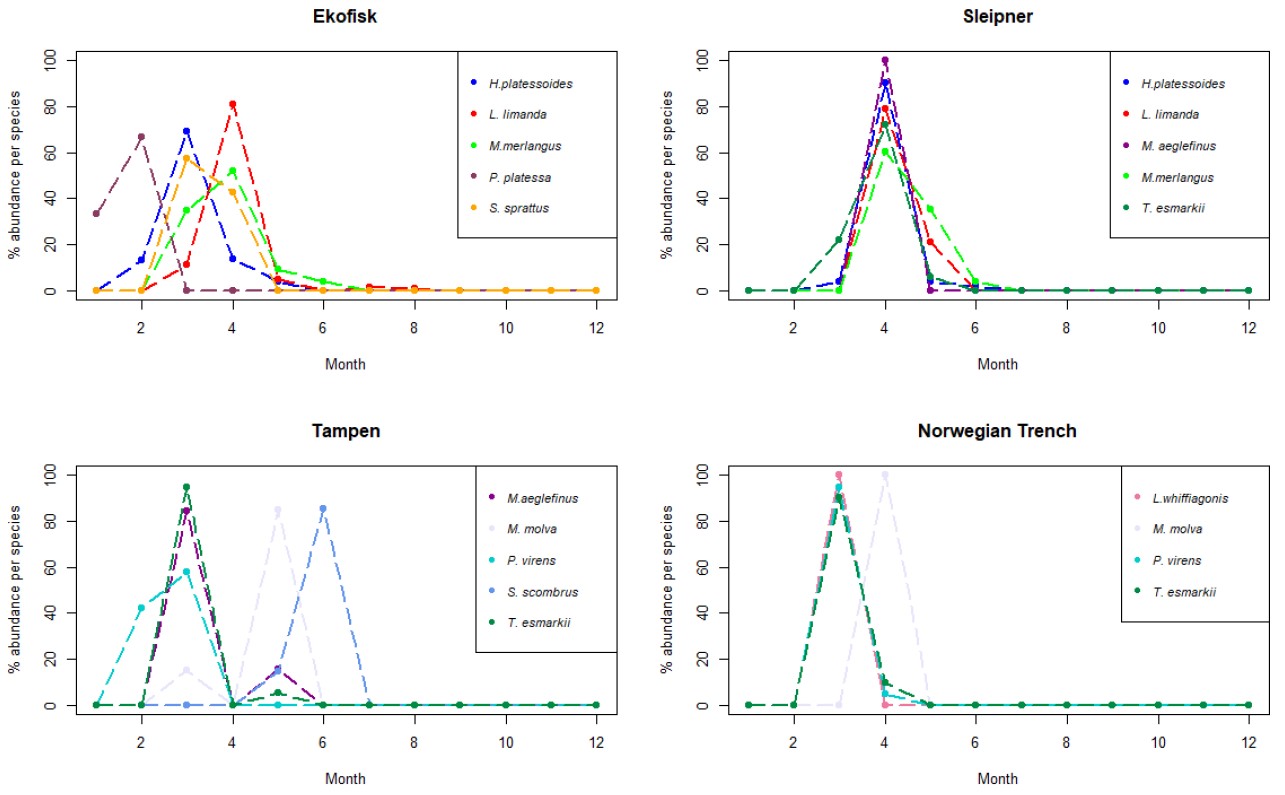
Figure 7. Line charts with the 5 more abundant species (4 for the Norwegian Trench) identified in the larvae collected during this project at the 4 sampling sites. The y-axis represents the % of abundance of each species per month (x-axis), respect to the total number of individuals retrieved from those individual species along the whole year. As different number of samples has been collected each month, data has been rarefied to 1 haul collected per month.
Sleipner
Although the most abundant species found in the eggs collected at Sleipner was dab, that was not the case with the larvae. At this location, the long-rough dab outcompeted dab being the most abundant larvae. In addition, all of the 5 most abundant larval species showed a peak in abundance in April (Fig. 7). The long-rough dab was found between March and June (Fig. S5), but mainly in April (Fig. 7). Dab was the second most abundant larval species at Sleipner. It was found just in April and May, i.e. 5 less months than the eggs (Fig. S5). Norway pout was the third most abundant species, and it was found between the months of March and May (Fig. S5). Other abundant species were whiting, found between April and June, and haddock identified only in samples collected in April (Fig. S5).
Tampen
The most abundant larval species in the samples collected at Tampen sampling site was saithe with more than 50 % of all the larvae retrieved at this location. Saithe was only found in the months of February and March (Fig. S5), being slightly more abundant in March (Fig. 7). Saithe was followed in abundance by Norway pout, representing almost 20 % of the identified larvae. Norway pout was mainly found in the samples collected in March (Fig. 7), although some individuals were obtained in samples collected in May. However, Norway pout was not detected in April (Fig. S5). Ling (M. molva) was the third most abundant larval species at Tampen. Ling followed the same pattern as Norway pout, being identified in samples collected during the months of March and April (Fig. S5). Yet, ling was mainly found in April (Fig. 7). Among the other less abundant larval species at Tampen were mackerel and haddock. Mackerel was found between May and June with a peak in the latter month (Fig. 7), while mackerel also followed the same pattern as Norway pout, being found in March and April, with a peak in March (Fig. 7).
Norwegian Trench
At the Norwegian Trench only 32 larvae were retrieved. From those, 18 larvae (56 %) were identified as saithe. Saithe was found between March and April (Fig. S5), being more abundant in March (Fig. 7). Saithe was followed in abundance by Norway pout (21%) and ling (9%). Norway pout exhibited the same pattern as saithe (Fig. S5), while all ling individuals were found in April (Fig. 7). Megrim was also found at the Norwegian Trench with lower abundances than the latter species and it was only retrieved in the samples collected during March (Fig. 7).
Conclusions
The information from the work presented in this report constitutes crucial knowledge for future management advice regarding timing and location of seismic surveys to minimize or reduce potential negative effects on reproduction and development of early life stages of the North Sea fishes. This assessment contributes with detailed data of high resolution and provides an update of the temporal spawning trends of the most common fish species that reproduce in the northern and central sub regions of the North Sea, along a latitudinal gradient from 61 ˚ to 56 ˚N (Figures 4,5,6,7, S3, S4 and S5). Our results also demonstrate that the species collected in the northern subregion of the North Sea (Tampen) have adapted a shorter spawning period but display higher species diversity versus lower latitudinal regions. Moreover, the egg data (Figure S4) shows that those species with the most northernly spawning centers of gravity (i.e. saithe, Norway pout, haddock, long rough dab, pollock and cod) also maintain their short spawning periods during spring at the southern spawning sites (Sleipner and Ekofisk), while those species with the southernmost spawning centers of gravity (i.e witch, mackerel, four-beared rockling, guernard, hake, plaice, lemon sole, dab, and sprat) which have protracted spawning periods at Ekofisk have somewhat less protracted spawning period at Sleipner and Tampen. In addition, these southernly species also seem to switch their peak spawning from summer in the south to spring at Tampen. The study found three species apparently not previously described spawning in the North Sea, the Jeffrey`s goby, Four-spot megrim and Acadian redfish. In addition, Crystal goby with traditional spawning area in the southern North Sea is not previously registered spawning in the Norwegian sector of the North Sea. We believe that the appearance of these four species at our sampling sites reflects the general impacts of climate change over recent 40 years with poleward displacement of marine species.
We find that for some species, the representative numbers are low, thus additional data are required in order to determine their spawning time with higher resolution. Typically, these individuals were found occasionally only within short bursts in time. Ongoing work with more detailed descriptions of spawning time is also underway. Further work is also being done to synthesize the results from KINO-1 with KINO-2, especially with a view to understanding the spatial component and which advection processes are applicable.
The use of the two different approaches for ichthyoplankton identification allowed for inter-comparisons of their applicability. Overall, it was observed that the use of the molecular taxonomic method allowed for reaching a more detailed taxonomic level vs. the visual taxonomic method (Mateos- Rivera et al. 2020). For larvae identification, more than 98% of the larvae was assigned to species level using the molecular approach, while using the taxonomic method 89% of the larvae was assigned to species level. However, the greatest difference between both methods was observed in the identification of eggs. In comparison to visual identification, gave higher precision of identification for larvae and especially for the eggs. For the eggs 94% were assigned to species level with molecular barcoding, versus 5% identified to species level with the visual identification method. However, visual identification is still needed to provide information on the developmental stages.
Challenges and Improvements
As shown in e.g. Table S1 and Figure 1, there are several defective periods where no samples have been taken and there are dislocations of sampling positions. From a research standpoint, this weakens the dataset and makes analyzes more complicated. For the implementation of similar work in the future, it is important that focus is placed on reducing such cases. Technical problems with winches and bad weather conditions have caused some of these sampling gaps. There have also been complications with different crews being on the different shifts on board. This can probably have caused that the procedures not always have been performed the same way.
We have focused on keeping our industry partners informed about these conditions on an ongoing basis, but such cases are usually not detected until some time has passed since the samples were taken. To improve the methodology, we have held refresher courses for crew in sampling procedures by visiting the vessels and explained the importance of following the sampling protocol. We have improved and simplified the description of the sampling procedures as well as simplified reporting forms. Also, we found that prefilled labeling of the sample containers reduced chances of making such mistakes. Keeping a constant focus on these specific issues is mandatory for the collection of reliable samples and ultimately to enable correct conclusions from the data. Having said that, we would like to emphasize that we have collected unique data in a cost-efficient way, and we see a great potential for future joint collaboration.
Something that also proved effective in maintaining the collection frequency and more systematic sample treatment was the introduction of a sampling reward system onboard the vessels.
During the course of this study we needed to modify and simplify the collection method by substituting the traditional splitting (using a “Motoda-plankton splitter”) of samples we initiated the use of a double WP2 net on all vessels during the summer of 2019, instead of the single WP2 net (as outlined in the annual report from 2018). This net configuration also increased the amount of eggs and larvae obtained per haul and most importantly; increased the accuracy for statistical comparative analyses of the results from the two taxonomic identification techniques. Additionally, each net was deployed with a depth sensor (Starmon TD logger), programmed to log automatically for more than 12 months.
We also experienced issues with the CTD data recordings; mostly they were either data-empty or just contained one measurement point during the depth profile. The reason for these missing data must have been due to deviations from the sampling procedure, as the CTD unit needs to receive proper satellite fix which takes several minutes after it has been switched on before deployment into water, it also needs to stay in the surface waters for some minutes before the descend. This type of CTD was therefore replaced by new CTDs (RBRconcerto3) that were attached to the net frames used on all four vessels and logged during the hauls performed from June 2019-August 2020, these switch on automatically when in contact with saltwater and we have regularly visited each vessel when at port, to download and check data quality.
Future Perspectives
We are investigating possibilities of developing and further improving of the methods. During the project period, we have tested various preservation solutions of the sample material that will make the analyzes more effective and manageable. This work is still ongoing, and results will be published. Another exciting topic we currently investigate is to explore new molecular techniques, including analyzes of e-DNA from water samples to assess whether this may be relevant to introduce into future surveys focusing on mapping species composition. In addition, descriptions of our results will be completed and submitted for publication in scientific journals.
We are confident that the data collection method that has been developed are manageable for non-professional technical personnel after some training. The equipment should need little maintenance and appears to be user friendly. With motivated crew on the supply vessels, this would serve as an excellent base as research platform for this purpose, also in the future.
The environmental conditions in the North Sea is highly dynamic. In order of ensuring that future advice for timing of seismic surveys will be carried out in a most considerate way, we strongly recommend planning of a continuation of the collection and analyses of material even after the determination of the KINO-2 project. It is also important to design future surveys that focus on mapping the most important spawning grounds in the Norwegian Sea.
KINO-2 Publications
International peer reviewed journals
Mateos-Rivera A, Skern-Mauritzen R, Dahle G, Sundby S, Mozfar B, Thorsen A, Wehde H, Krafft BA. 2020. Comparison of visual and molecular taxonomic methods to identify ichtyoplankton in the North Sea. Limnology and Oceanography 18:599-605. DOI:10.1002/lom3.10387
Articles & Reports
Mateos-Rivera A, Mozfar B, Skern R, Dahle G, Wehde H, Kleppe L, Sundby S, Thorsen A, Breistein B, Asplin l, Ezequiel G, Isari S and Krafft B. 2019. Mapping of fish spawning in the North Sea. Report of the KINO-2 project for 2018. Rapport fra Havforskningen 2019-2. 80 pp.
Mateos RA, Mozfar B, Skern R, Dahle G, Wehde H, Kleppe L, Sundby S, Thorsen A, Asplin L, Isari S, Krafft B. 2020. Mapping of fish spawning in the North Sea; Report of the “KINO-2” project for 2019. Rapport fra Havforskningen no. 2020-2. 47 pp. https://www.hi.no/hi/nettrapporter/rapport-fra-havforskningen-en-2020-2
International conference presentations
Mateos-Rivera A, Mozfar B, Skern-Mauritzen R, Dahle G, Thorsen A, Sundby S, Glover K, Kleppe L, Wehde H, Krafft BA (2018) Assessment of the spawning time for the major North Sea fish stocks. ICES Working Group on Atlantic Larvae and Egg Survey (WGALES) - Technical University of Denmark, Copenhagen, October 2018.
Mateos-Rivera A, Mozfar B, Skern-Mauritzen R, Dahle G, Thorsen A, Sundby S, Glover K, Kleppe L, Wehde H, Krafft BA (2018) Assessment of the spawning time for the major North Sea fish stocks. Northern North Sea Planktonic Ecosystem Working Group (NNSPEWG). Institute of Marine Research, Bergen, October 2018.
Mateos-Rivera A, Mozfar B, Skern-Mauritzen R, Dahle G, Thorsen A, Sundby S, Glover K, Wehde H, Krafft BA. (2019). Determining spawning in the North Sea using visual and molecular taxonomic methods. 43rd Larval Fish conference, Palma de Mallorca (Spain)
Acknowledgements
The KINO-2 project is financed by Equinor Energy AS, Conoco Philips Scandinavia AS and Aker BP ASA. We especially thank Rolf Christian Sundt, Equinor, for his commitment and great logistical support throughout the project period. We also thank all vessel crew and personnel involved in data collection and logistics.
References
Ahlstrom H, Geoffrey H (1980) Characters useful in identification of pelagic marine fish eggs. CalCOFI Rep. XXI.
Altschul SF, Gish W, Miller W, Myers EW, Lipman DJ (1990) Basic local alignment search tool. Journal of Molecular Biology 215:403-410
Dalen J, Ona E, Vold Soldal A, Sætre R (1996) Seismiske undersøkelser til havs: En vurdering av konsekvenser for fisk og fiskerier. Fisken og Havet, nr. 9 – 1996. 26 s
Engås A, Løkkeborg S, Ona E, Soldal AV (1993) Effekter av seismisk skyting på fangst og fangsttilgjengelighet av torsk og hyse. Fisken og Havet, nr. 3 – 1993. 111 s.
Engås A, Løkkeborg S, Ona E, Soldal AV (1996) Effects of seismic shooting on local abundance og catch rates of cod (Gadus morhua) og haddock (Melanogrammus aeglefinus). Can. J. Fish. Aquat. Sci. 53(10): 2238-2249.
Evans PGH, Nice H (1996) Review of the effects of underwater sounds generated by seismic survey on cetaceans. Sea Watch Foundation, Oxford.
Falk MR, Lawrence MJ (1973) Seismic Exploration: Its nature and Effects on Fish. Canadian Fisheries and Marine Service Technical Report CEN/T-73-9: 51 s.
Gjøsæter H, Dalpadado P, Hassel A, Skjoldal HR (2000) A comparison of performance of WP2 and MOCNESS. Journal of Plankton Research 22:1901-1908.
Hassel A, Endresen B, Martinussen MB, Knutsen T, Johanessen ME (2017) Håndbok for plankton. Prøvetaking og analyse. Havforskningsinstituttet.
Heessen HJL, Daan N, Ellis JR. (editors.) Fish Atlas of the Celtic Sea, North Sea, and Baltic Sea. Wageningen Academic Publishers and KNNV Publishing, Wageningen, Netherlands.572 pp. ISBN: 978-90-8686-266-5.
Holmstrøm S (1993) Effekter av luftkanonseismikk på larver og yngel - modellering og simulering. SINTEF Rapport STF48 A93007, Trondheim. 70 s.
Ivanova NV, Zemlak TS, Hanner RH, Hebert PDN (2007) Universal primer cocktails for fish DNA barcoding. Molecular Ecology Notes 7: 544-548.
Kearse M, Moir R, Wilson A, Stones-Havas S, Cheung M, Sturrock S, et al. (2012) Geneious Basic: an integrated and extendable desktop software platform for the organization and analysis of sequence data. Bioinformatics 28: 1647-1649.
Knudsen FR, Enger PS, Sand O (1992) Awareness reactions and avoidance responses to sound in juvenile Atlantic salmon, Salmo salar L. J. Fish. Biol. 40:523-534.
Knudsen FR, Enger PS, Sand O (1994) Avoidance responses to low frequency sound in downstream migrating Atlantic salmon smolt, Salmo salar L. J. Fish Biol. 45:227- 233.
Knudsen FR, Schreck CB, Knapp SM, Enger PS, Sand O (1997) Infrasound produces flight and avoidance responses in Pacific juvenile salmonids. J. Fish. Biol. 51:824-829.
Kostyuchenko LP (1973) Effects of elastic waves generated in marine seismic prospecting of fish eggs in the Black Sea. Hydrobiol. Jour. 9 (5): 45-48.
Lelievre S, Vaz S, Martin CS, Loots C (2014) Delineating recurrent fish spawning habitats in the North Sea. Journal of Sea Research 91: 1-14.
Lelievre S, Verrez-Bagins V, Jerome M, Vaz S (2010) PCR-RFLP analyses of formalin-fixed fish eggs for the mapping of spawning areas in the Eastern Channel and Southern North Sea. Journal of Plankton Research 32: 1527-1539.
Løkkeborg S, Soldal AV (1993) The influence of seismic exploration with air guns on cod (Gadus morhua) behaviour og catch rates. ICES Mar. Sci. Symp., 196: 62-67.
Markle DF, Frost LA (1985) Comparative morphology seasonality, and a key to planktonic fish eggs from the Nova Scotian shelf. Canadian Journal of Zoology 63: 246-25
Mateos-Rivera A, Skern-Mauritzen R, Dahle G, Sundby S, Mozfar B, Thorsen A, Wehde H, Krafft BA (2020). Comparison of visual and molecular taxonomic methods to identify ichtyoplankton in the North Sea. Limnology and Oceanography Methods 18:599-605
Messing J (1983) New M13 vectors for cloning. Methods in Enzymology 101: 20-78.
Munk PN, Jørgen G (2005) Eggs and larvae of North Sea fishes. Frederiksberg, Denmark biofolia.
Russell FS (1976) The eggs and planktonic stages of British marine fishes. London Academic Press.
Slotte A, Hansen K, Dalen J, Ona E (2004) Acoustic mapping of pelagic fish distribution and abundance in relation to a seismic shooting area off the Norwegian west coast. Fisheries Research 67 (2004): 143–150.
Sundby S, Kristiansen T, Nash RDM, Johannessen T, Bakkeplass K, Höffle H, Opstad I. (2017) Dynamic Mapping of North Sea Spawning - Report of the KINO Project. Fisken og Havet No. 2-2017, 195 pages. ISSN 0071 – 5638.
Sætre R, Ona E (1996) Seismiske undersøkelser og skader på fiskeegg og -larver; en vurdering av mulige effekter på bestandsnivå. Havforskningsinstituttet, Fisken og Havet, nr. 8 - 1996. 25 s.
Thompson BM, Riley JD (1981) Egg and larval development studies in the North Sea cod (Gadus morhua L.). Rapports et Procès-verbaux des Réunions Conseil International pour l'Exploration de la Mer 178: 553-559
Wardle CS, Carter TJ, Urquhart GG, Johnstone ADF, Ziolkowski AM, Hampson G. Mackie D (2001) Effects of seismic air guns on marine fish. Cont. Shelf Res. 0: 1-23.
Appendix
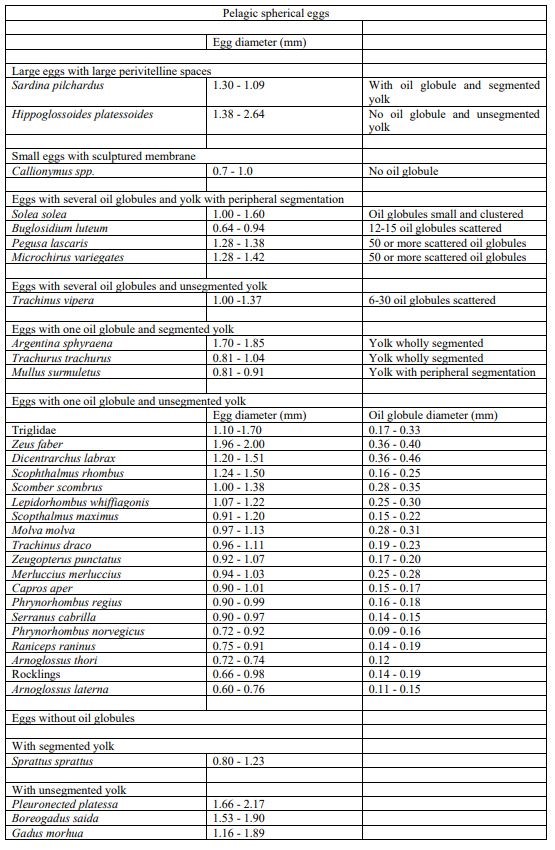
Material and Methods
Key to identification of pelagic eggs (size diameter) used for the visual taxonomic approach following parameters described in Russel (1976).
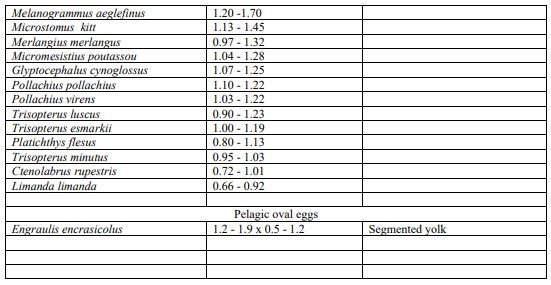
Criteria for egg staging used for the visual taxonomic approach following Thompson and Riley (1981).
Results
Table S1. Distribution of the samples collected per week. Absence of colour indicates weeks where sampling was not conducted. The number in some cells indicates samples collected more than once within the same week.
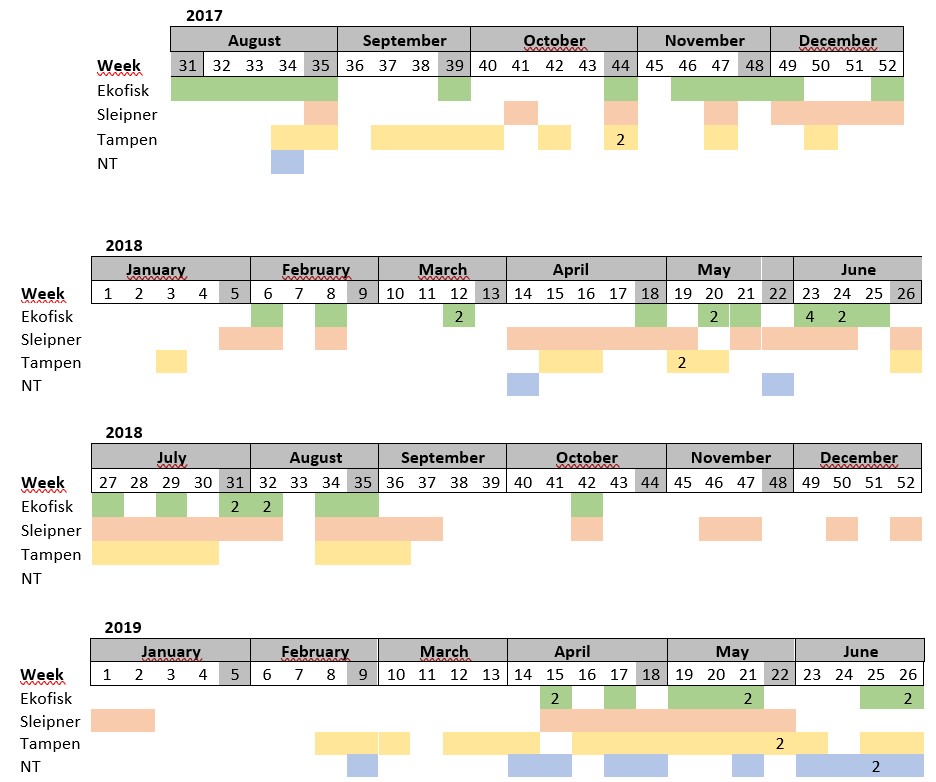
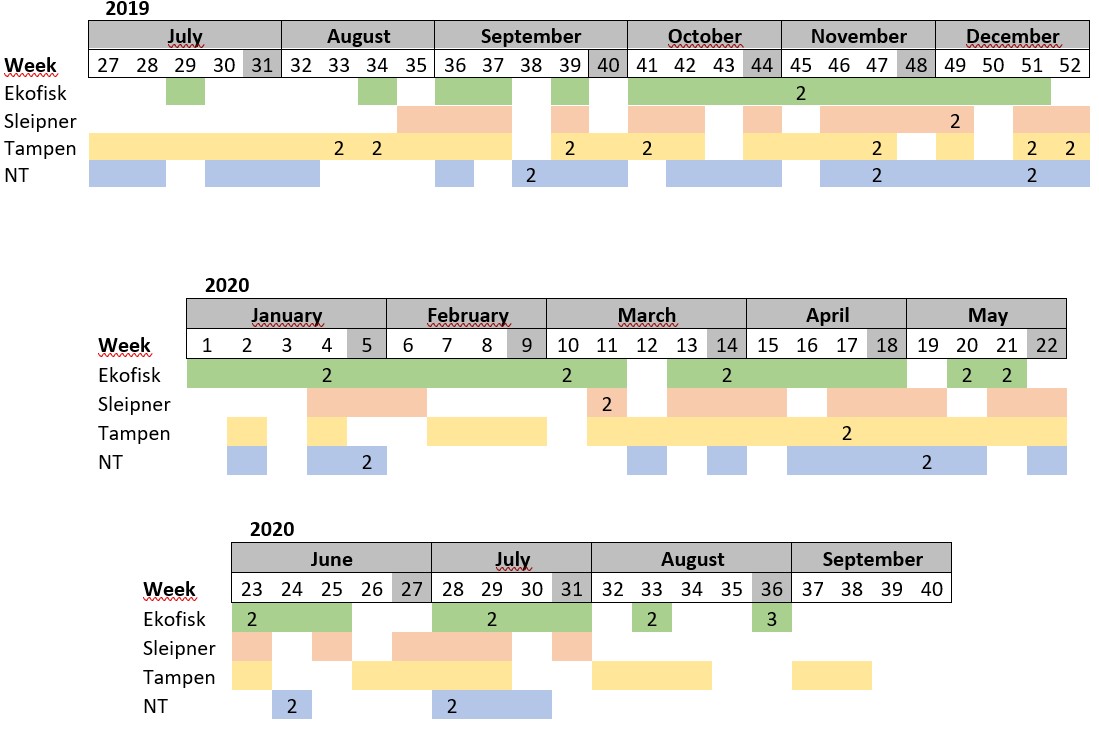
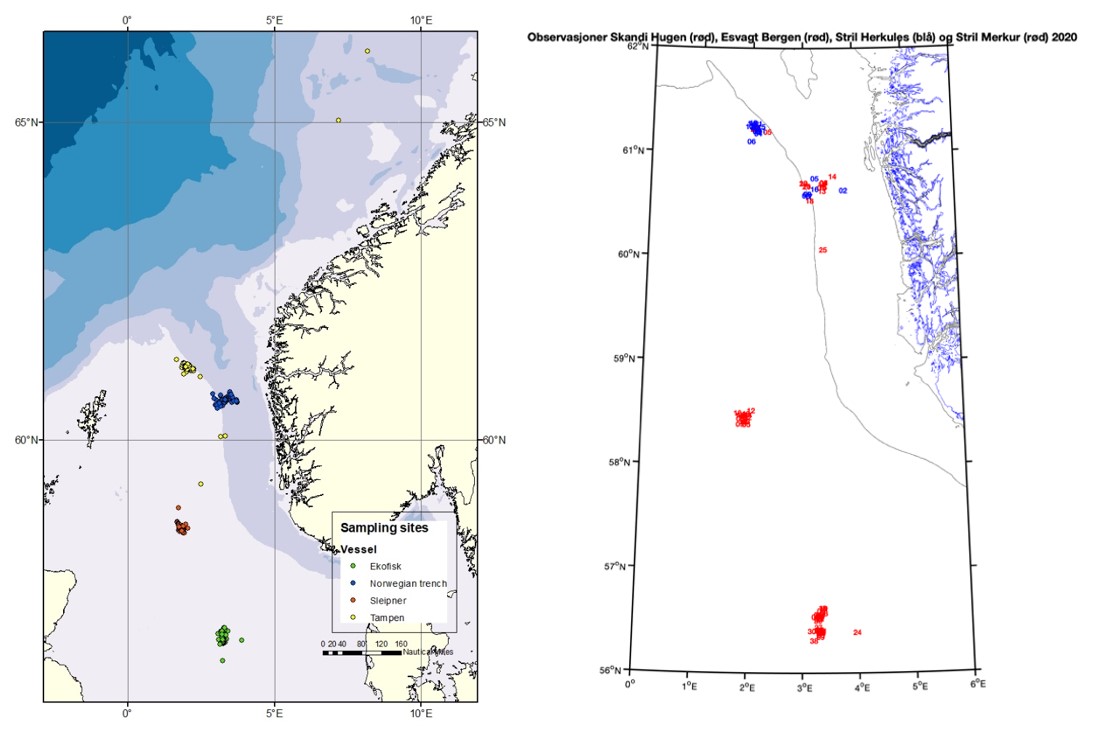
Figure S1. A map illustrating the total number of samples collected in this study (left) and the positions of the measured CTD-profiles (right). The red dots at the bottom indicates profiles obtained at Ekofisk, the red dots in middlemost site indicates profiles from Sleipner and the red (Stril Merkur) and blue (Stril Herkules) dots at the topmost site indicates profiles from Tampen and the Norwegian trench.
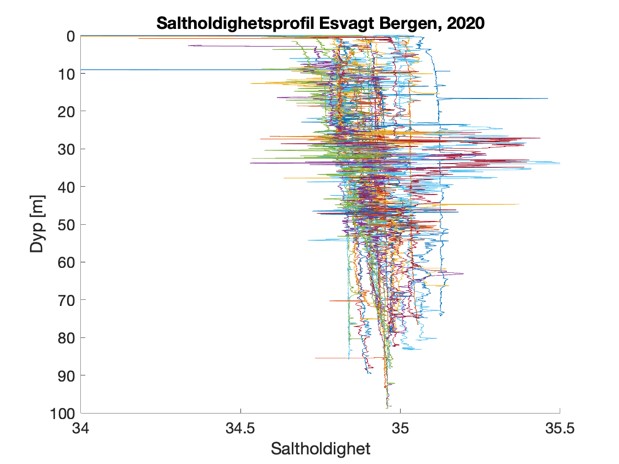
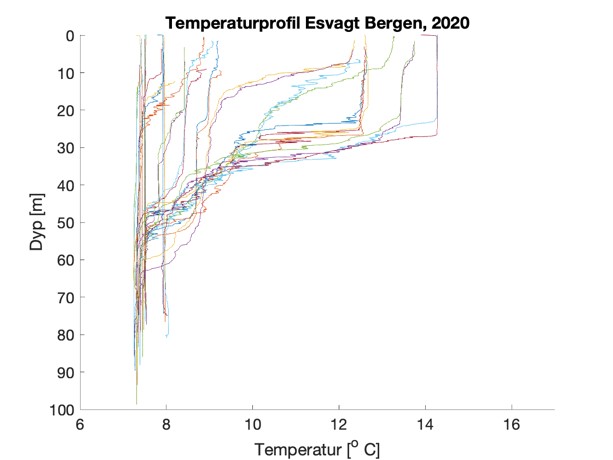
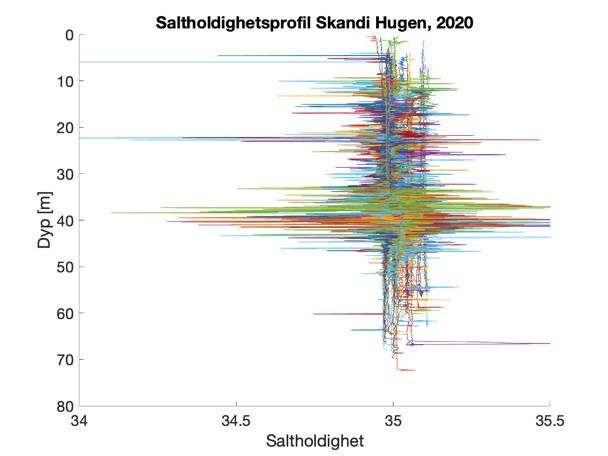
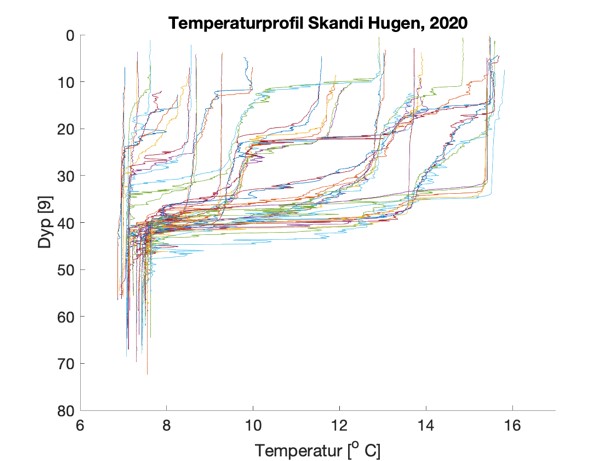
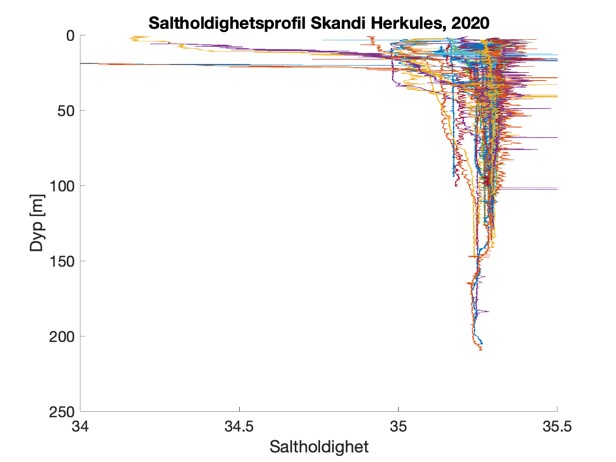
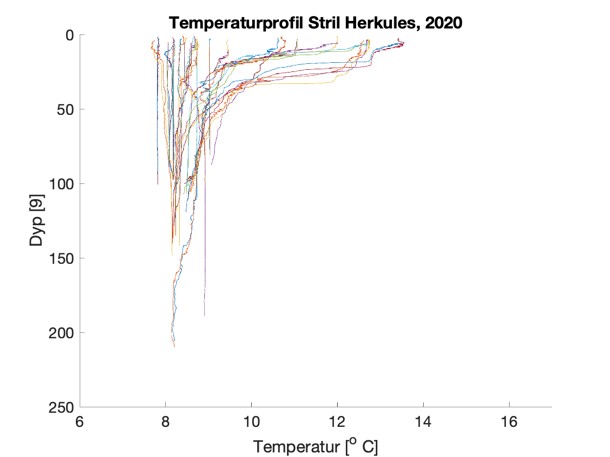
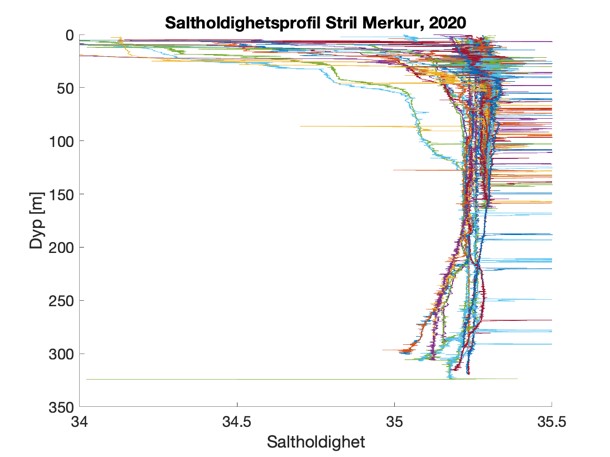
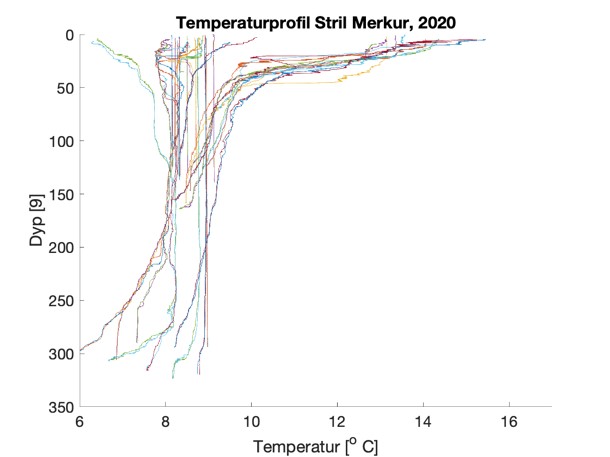
Figure S2. Salinity and temperature profiles obtained from the RBRconcerto3 C.T.D for each of the four sampling sites in 2020.
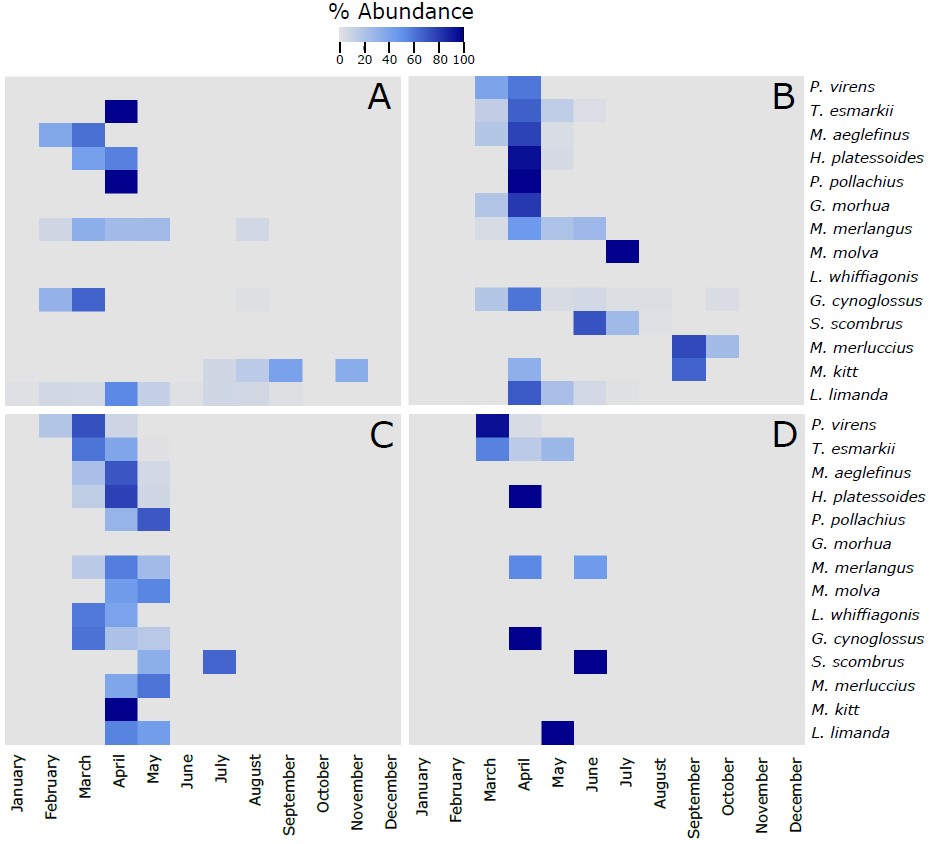
Figure S3. Heatmap of the % of the most abundant fish species (more than 10 larvae collected along the 4 sampling sites) identified in the larvae collected during this project using the visual taxonomic approach at the 4 sampling sites across the different months of the year. The 14 species in each of the panels are vertically ranked after the latitudinal centers of gravity of their spawning areas. Hence, P. virens has the northernmost center of gravity and L. limanda has the southernmost center of gravity. The % of abundance has been calculated using the number of individuals of each species per month, respect to the total number of individuals retrieved from those individual species along the whole year. As different number of samples has been collected each month, data has been rarefied to 1 haul collected per month. A refers to Ekofisk, B to Sleipner, C to Tampen and D to Norwegian Trench.
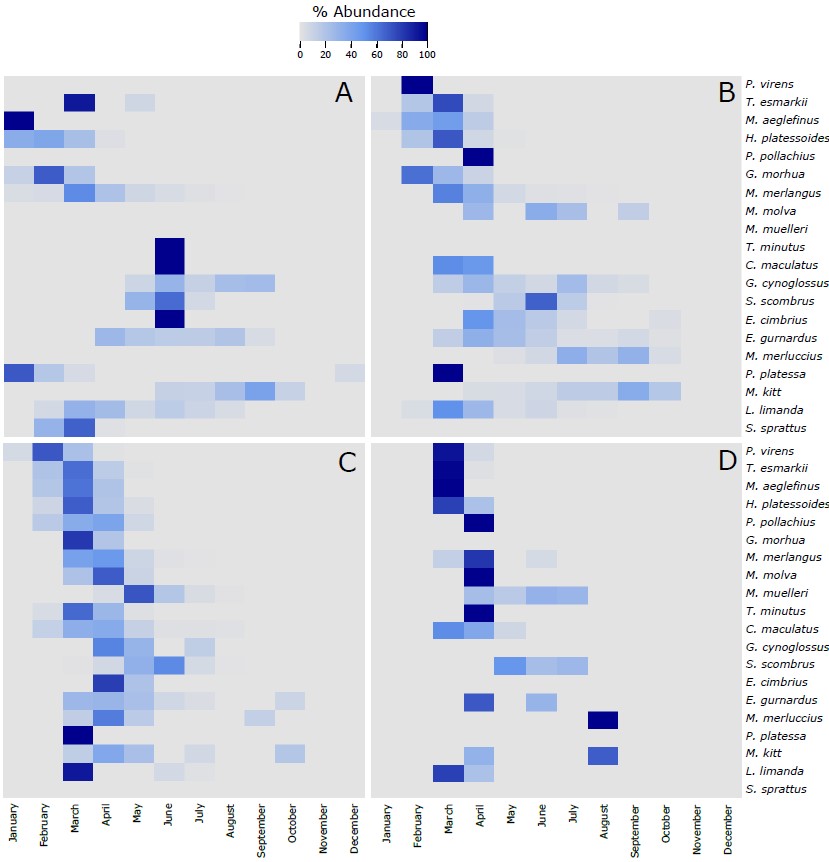
Figure S4. Heatmap of the % of the most abundant fish species (more than 20 eggs collected along the 4 sampling sites) identified in the eggs collected during this project using the molecular taxonomic approach at the 4 sampling sites across the different months of the year. The 20 species in each of the panels are vertically ranked after the latitudinal centers of gravity of their spawning areas. Hence, P. virens has the northernmost center of gravity and S. sprattus has the southernmost center of gravity. The % of abundance has been calculated using the number of individuals of each species per month, respect to the total number of individuals retrieved from those individual species along the whole year. As different number of samples has been collected each month, data has been rarefied to 1 haul collected per month. A refers to Ekofisk, B to Sleipner, C to Tampen and D to Norwegian Trench.
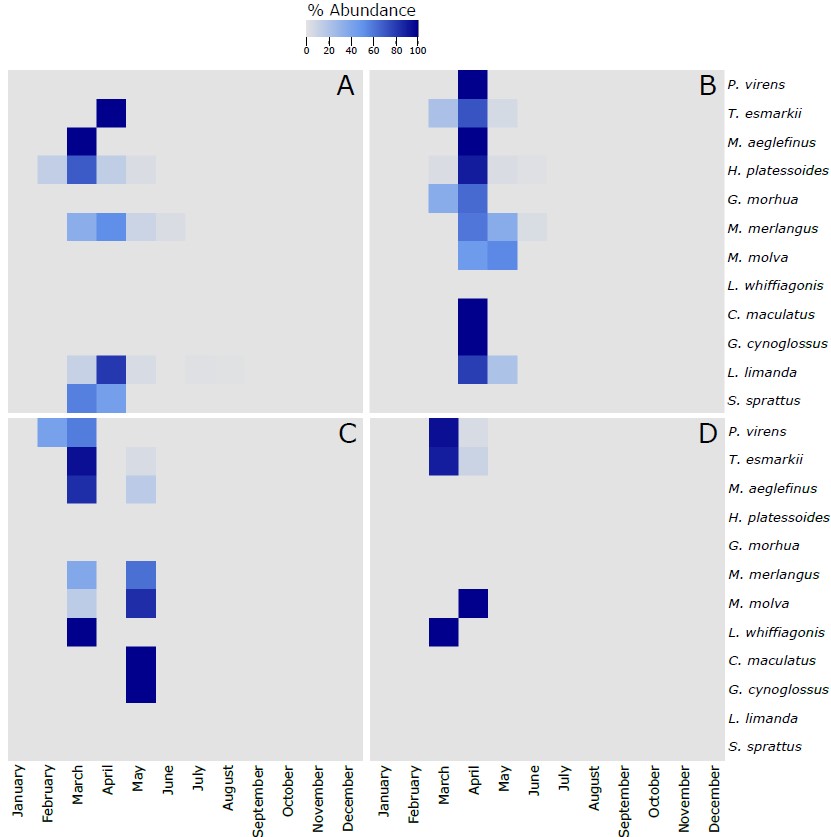
Figure S5. Heatmap of the % of the most abundant fish species (more than 5 larvae collected along the 4 sampling sites) identified in the larvae collected during this project using the molecular taxonomic approach at the 4 sampling sites across the different months of the year. The 12 species in each of the panels are vertically ranked after the latitudinal centers of gravity of their spawning areas. Hence, P. virens has the northernmost center of gravity and S. sprattus has the southernmost center of gravity. The % of abundance has been calculated using the number of individuals of each species per month, respect to the total number of individuals retrieved from those individual species along the whole year. As different number of samples has been collected each month, data has been rarefied to 1 haul collected per month. A refers to Ekofisk, B to Sleipner, C to Tampen and D to Norwegian Trench.
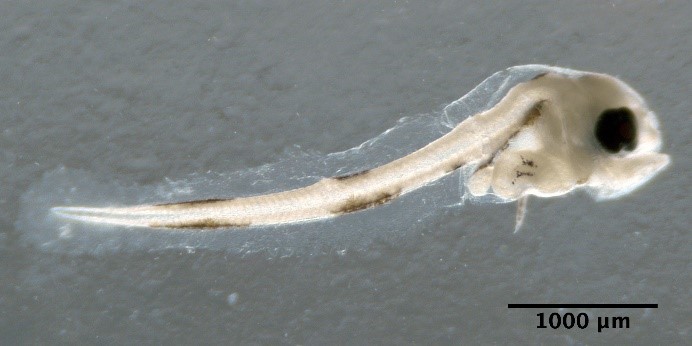
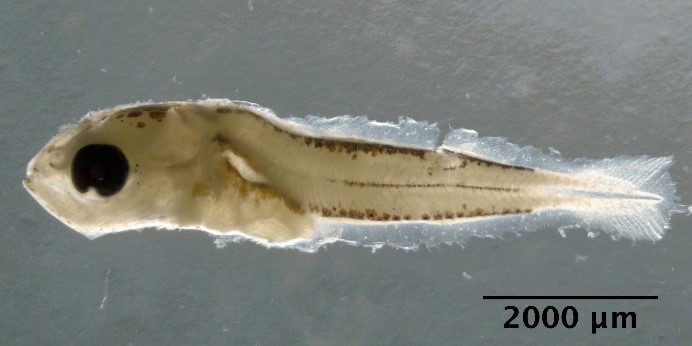
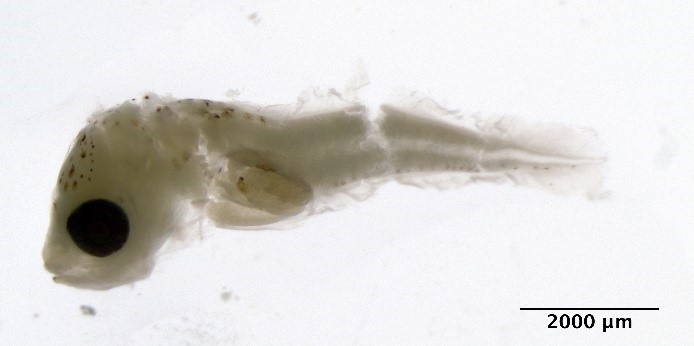
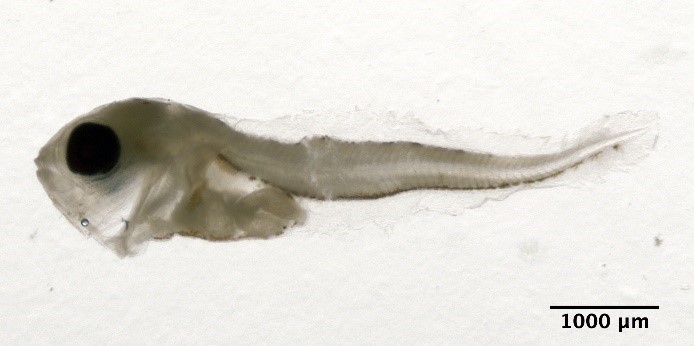
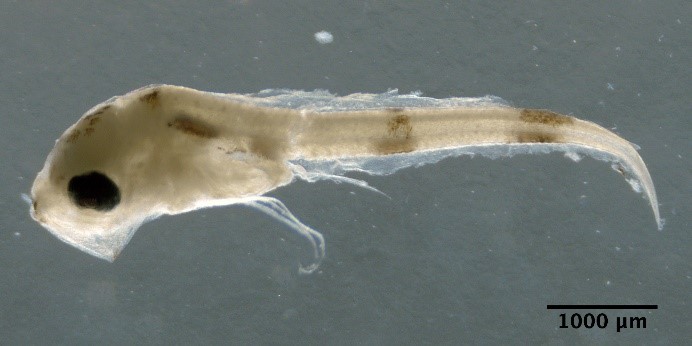
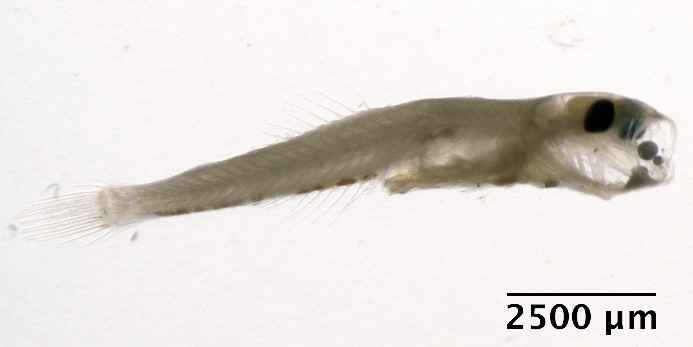
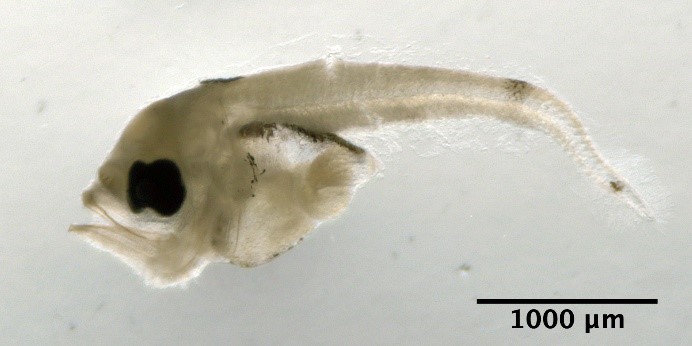
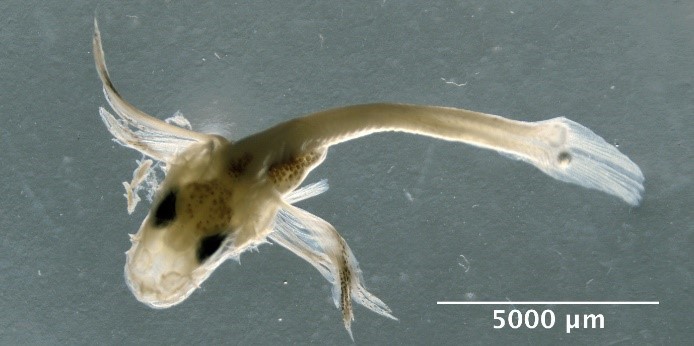
Illustrations of fish larvae identified from using visual taxonomic approach
Argentina sphyraena
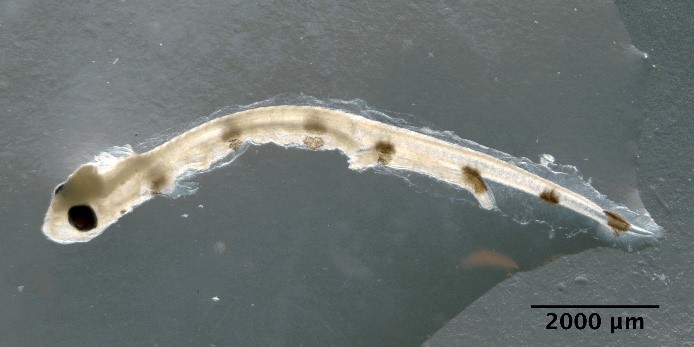
Argentina silus
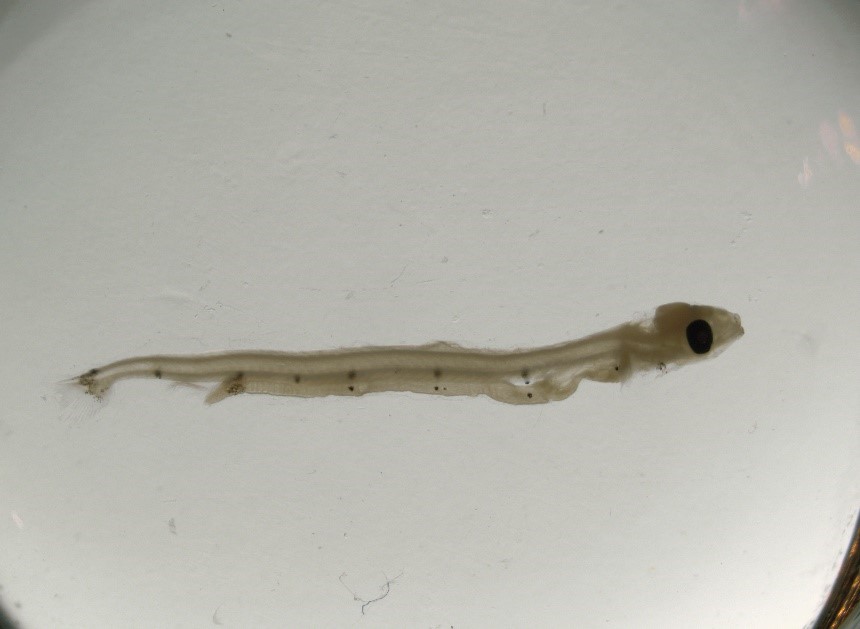
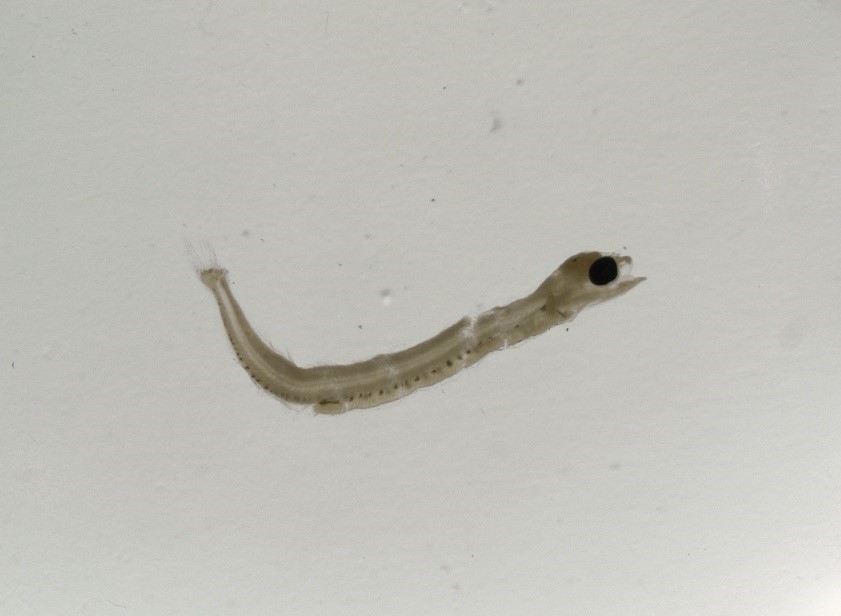
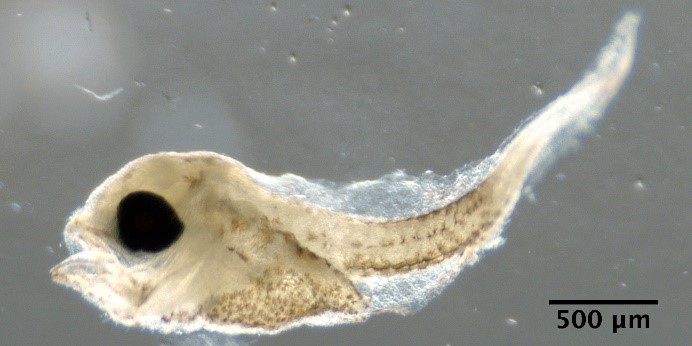
Trisopterus esmarkii
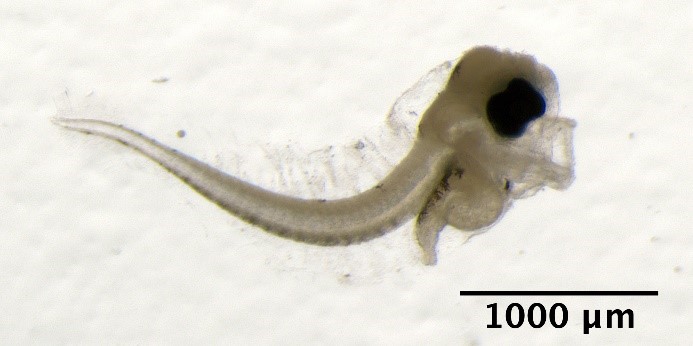
Pollachius virens
Pollachius pollachius
Melanogrammus aeglefinus
Merlangius merlangus
Molva molva
Crystallogobius linearis
Merluccius merluccius
Enchelyopus cimbrius
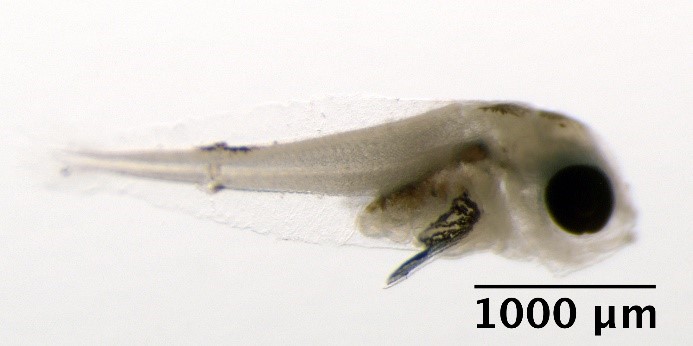
Glyptocephalus cynoglossus
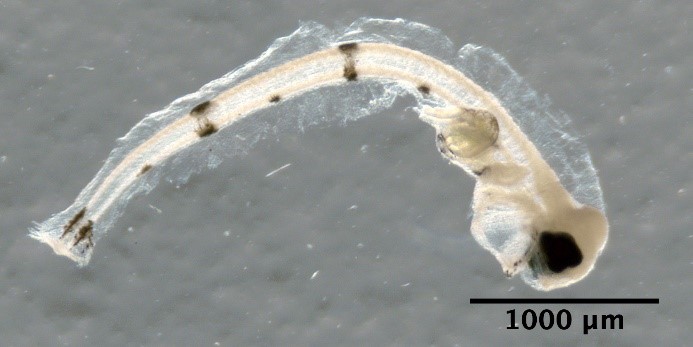
Hippoglossoides platessoides
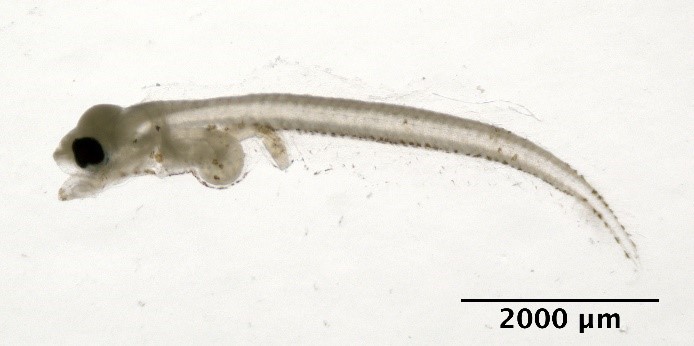
Limanda limanda
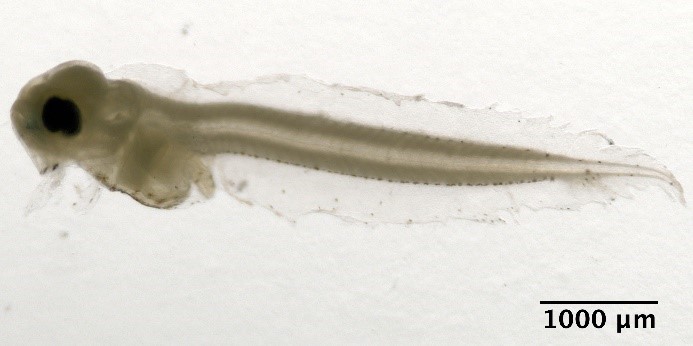
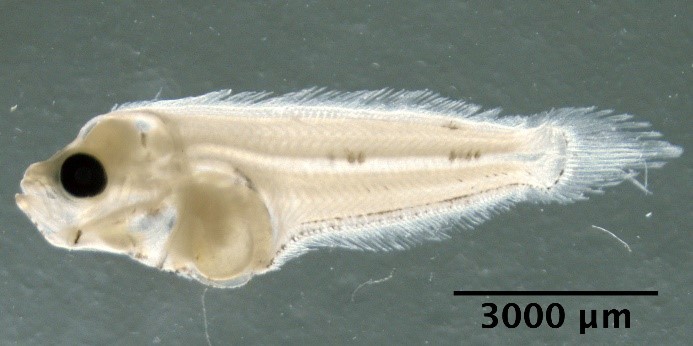
Microstomus kitt
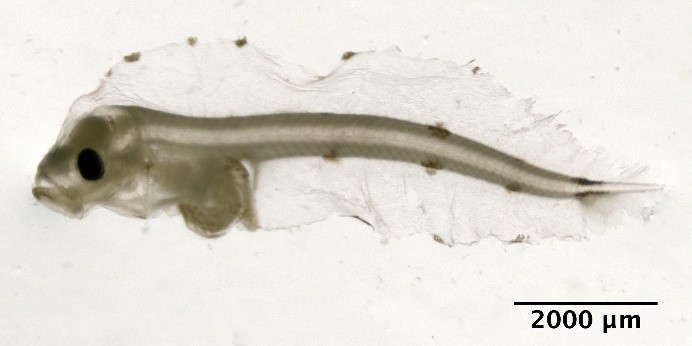
Scomber scombrus
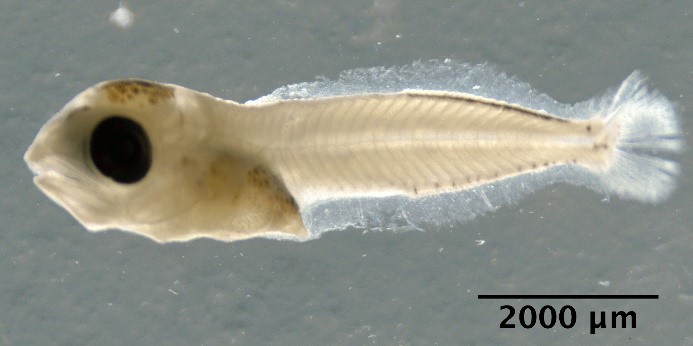
Eutrigla gurnardus
Illustrations of fish eggs identified from using visual taxonomic approach
Large egg with large perivitelline space
Hippoglossoides platessoides
Small eggs with sculptured membrane
Callionymidae spp.
Eggs with one oil globule and segmented yolk
Maurolicus muelleri
Eggs with one oil globule and unsegmented yolk
Eggs without oil globule and unsegmented yolk
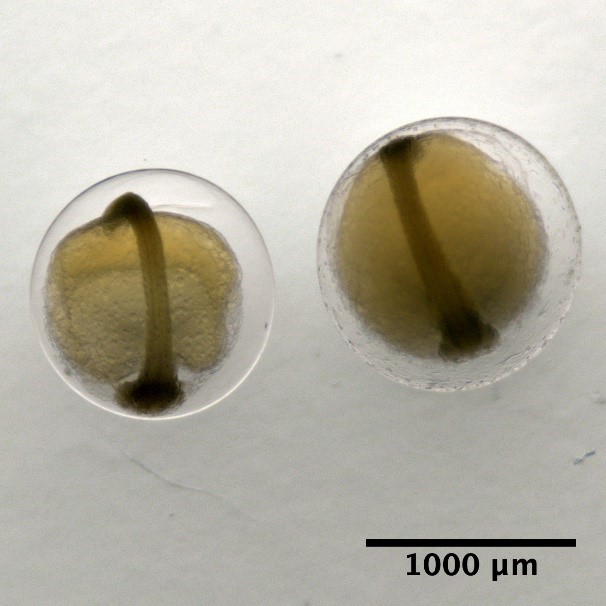
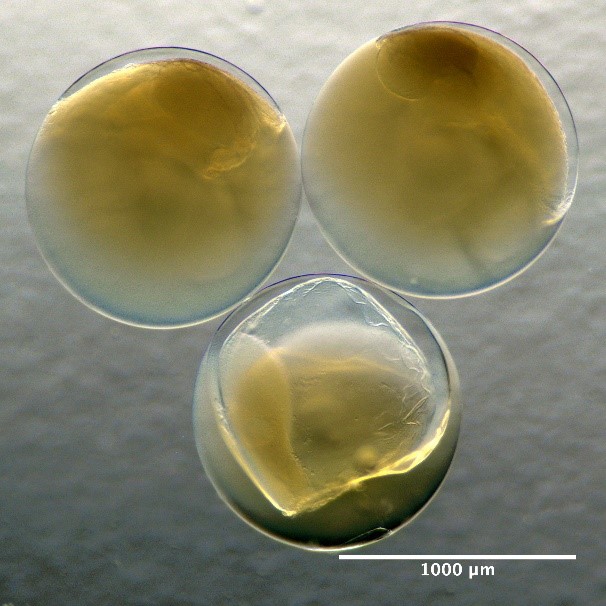
Developmental stages of eggs
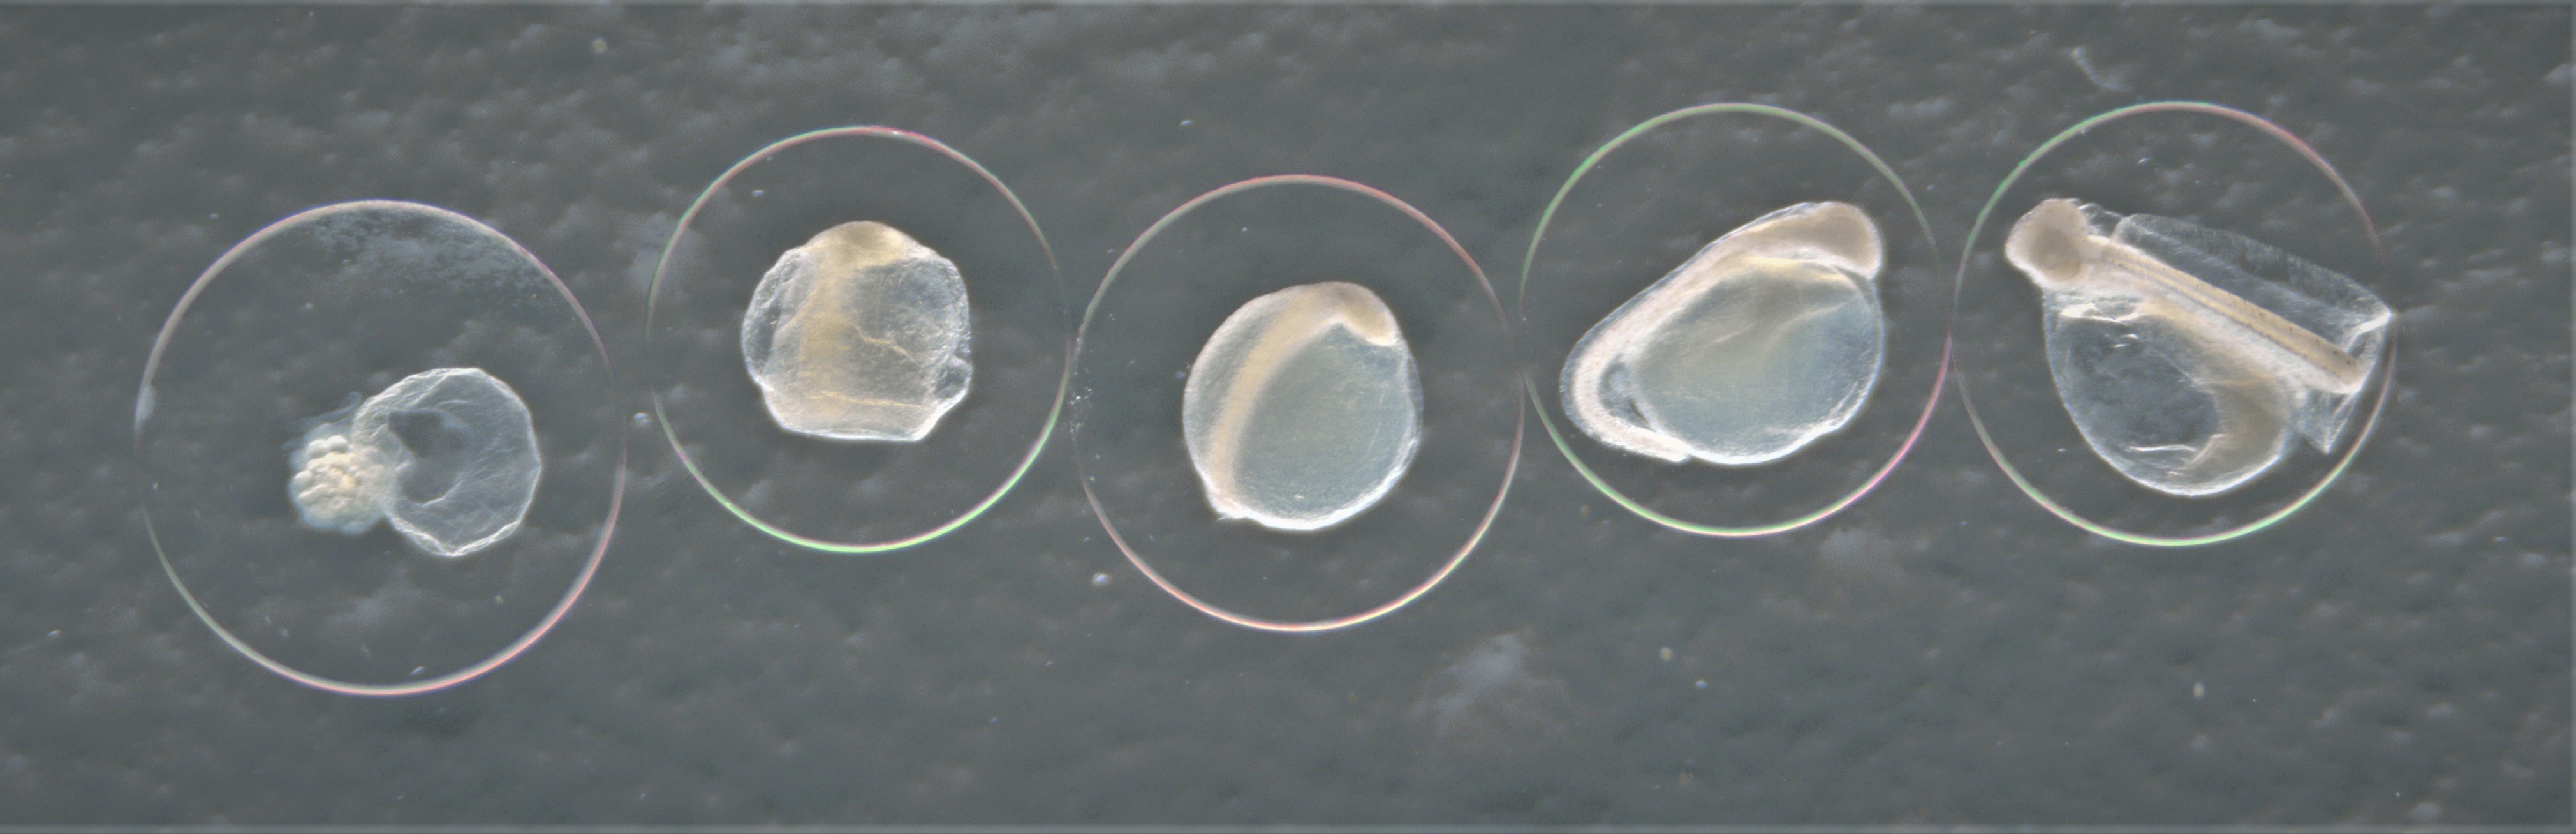
Developmental stage of fish egg with stage 1 starting from the left with increasing stage number ending with stage 5 to the right. Here represented by the species Hippoglossoides platessoides.