I forbindelse med metoderevisjonsarbeidet i ICES på kysttorsk nord for 62°N høsten 2020-våren 2021, ble det utarbeidet nye mengdeindeks-serier basert på faste trålstasjoner og akustikk under kysttoktet om høsten. Akustikkserien dekker perioden 1995-2019, mens trålindeksen dekker perioden 2003-2019. Denne rapporten beskriver metodikken brukt og presenterer kort resultatene i form av tabeller og grafer.
Abundance indices for norwegian coastal cod north of 62°N
Report series:
Rapport fra havforskningen 2021-6
ISSN: 1893-4536
Published: 17.02.2021
Updated: 30.04.2021
Project No.: 12352, 15626-06
Subject:
Torsk – kysttorsk nord for 62°N
Program:
Kystøkosystemer
Approved by:
Research Director(s):
Geir Huse
Program leader(s):
Jan Atle Knutsen
Norsk sammendrag
Summary
In connection with the benchmark processes within ICES on Norwegian Coastal Cod north of 62°N during autumn 2020-spring 2021, new abundance index series based on bottom trawl stations and acoustics at the autumn coastal survey were made. The acoustic index covers the period 1995-2019 while the trawl index covers the period 2003-2019. This report describes the methods used and briefly presents the results.
April 30th 2021: Some updates in Appendix.
1 - Introduction
New abundance index series for Norwegian coastal cod north of 62° were produced using the software StoX (Johnsen et al. 2019). Indices were calculated by applying trawl swept area and acoustic methods, using data collected during the Norwegian annual coastal survey in autumn NOcoast-Aco-4Q.
Time series of indices for the period 1995 to 2019 in numbers and biomass (2003-2019 for the swept-area index), their coefficient of variation, length- and weight-at-age are tabulated for three subareas and the total area in Appendix A (acoustic indices) and Appendix B (swept-area trawl indices).
2 - Biology, stock structure, and management of coastal cod
Coastal cod occurs in fjords and coastal areas along the entire coast of Norway. The management area for this species is divided into two areas south and north of 62 ° N. Genetic studies indicate a genetic cline along the coast from eastern Finnmark to inner Skagerrak (Dahle et al., 2018). Coastal cod north of 62 ° N is somewhat related to Northeast Arctic (NEA) cod, while coastal cod south of 62 ° N showing some similarities to North Sea and Skagerrak cod.
Compared to NEA cod the immature coastal cod has faster individual growth and earlier age of maturation (Berg and Albert, 2003). Since individual growth is reduced after the age of first maturation, the weight at age for old fish is somewhat lower for coastal cod than for Northeast Arctic cod at the same age.
Spawning areas for coastal cod have been mapped by egg sampling and classified according to their relative value (Gytefelt Torsk MB at www.fiskeridirektoratet.no ). See also Figures 18-23 in Aglen et al. (2020). Some of these coastal cod spawning areas are close to spawning areas for NEA cod. Probably due to rather small-scale differences in currents and egg buoyancy, the coastal cod eggs and larvae tend to be retained near the spawning areas, while NEA cod eggs and larvae are transported by currents northward into the Barents Sea.
Annual total allowable catches (TAC) were set for coastal cod at 40 kt in the years 1987-2003, 20 kt in 2004, and 21kt in later years. A large proportion of the annual landings of coastal cod is by-catches in the fishery for NEA cod. A rebuilding plan was established 2011 and several technical regulations were introduced to reduce “bycatches” of coastal cod, including gear restrictions and restrictions on vessel size, and closures of spawning areas in the spawning season (Henningsværstraumen and Inner Lofoten).
3 - The autumn coastal survey
3.1 - The history of the survey and how it has developed over the years
The Institute of Marine Research (IMR) has since 1985 conducted an annual acoustic survey of coastal areas and offshore banks north of 62°N with the objective of obtaining abundance indices of commercially important fish species (Skants, 2019). The annual coverage (in October and November) of coastal areas and fjords, as well as open ocean banks, between Stad (62°N) and Varanger (71.3 °N) has since 1995 included measurements of coastal cod ( Gadus morhua ).
The trawl gear used during the first years was a Campelen 1800 standard shrimp trawl with rock hopper gear and 35 mm mesh size in the cod end. Scanmar sensors provided information about the trawl opening (height in meters), door spread and bottom contact. Since 2003 a Campelen 1800 standard shrimp trawl with rock hopper gear, 20 mm mesh size in the cod end and 80mm (stretched) in the front part is the standard fishing gear, combined with Scanmar trawl and door sensors (Aglen et al., 2005). Additional stations were added in 2017, which was done as it was considered necessary to gather more information on deep water shrimps and redfish (Mehl et al., 2018a). Standard trawl duration is 30 minutes at a speed of 3 knots, with preferred doorspread of 49-52m and trawl opening of 3.5-4.5m. Data were collected with several vessels, which are listed in Table 1.
The survey consists of a stratified grid for acoustic measurements, with fixed bottom trawl stations and additional bottom and pelagic stations on acoustic registrations within each of the strata.
During the surveys hydrographic stations were sampled semi-regularly. CTD-measurements were taken at some of the fixed bottom trawl stations or with a set distance of 30 nautical miles between each station (Staby et al., 2020).
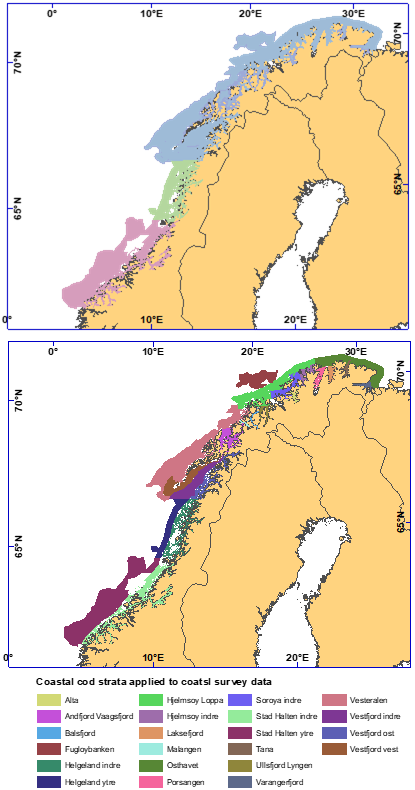
The surveyed area was initially divided into 23 strata, and these were grouped into three subareas: North of 67°N (Area “A”), 65°-67°N (Area “B”), and 62°-65°N (Area “C”) (Figure 1). The stratum “Vestfjorden East” was, however, removed from all years, since this stratum had no acoustic coverage and no trawl hauls in most years.
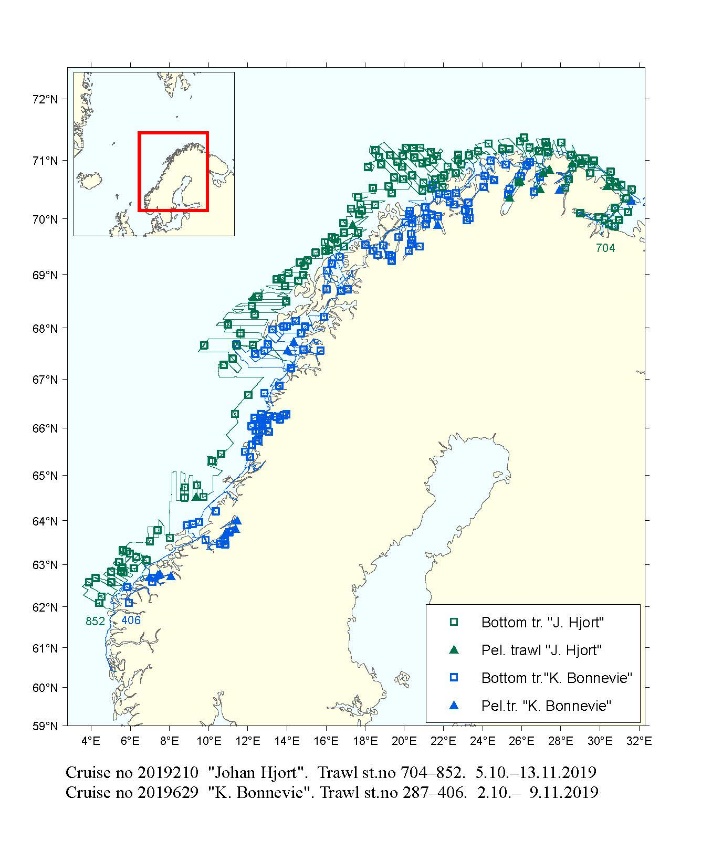
Acoustic transects and bottom trawl hauls are standardized since 2003. In 2017 additional acoustic transects were added to selected strata in order to improve the accuracy of saithe biomass estimates in those strata that contributed a significantly to the total estimate. Figure 2 shows the acoustic transects and trawl hauls made during the coastal survey in 2019.
Trawl catches are sorted and weighed by species according to standard procedures (Mjanger et al., 2020). Length measurements (e.g. total length; from snout to end of the caudal fin) are done for most species, either of all sorted individuals or of a subsample from large catches. Additional information such as age and type from otoliths, sex and gonad maturity stage are collected from cod.
3.2 - Previous attempts to extract abundance indices from the survey data
As described in chapter 1.2, the autumn coastal survey has a long history and has undergone various changes over the years. It started out as an acoustic survey primarily targeting coastal cod in the Troms and Finnmark counties in the 1980s. These surveys were conducted by the former “Fiskeriforskning” marine research institute in Tromsø. IMR in Bergen started a survey at approximately the same time of the year, but targeting mainly saithe in the outer coastal areas, partly overlapping the areas of the former survey. A third survey, covering overwintering herring in the fjords was aslo conducted by IMR. “Fiskeriforskning” was discontinued and the department responsible for resource surveys was included in IMR. From 2003 these surveys were combined and standardized to be a combined acoustic and trawl survey mainly targeting coastal cod and saithe. When the surveys were merged and standardized in 2003, attempts were made to construct an acoustic index for coastal cod based on the original coastal cod survey and the saithe survey, covering also more southern parts of the coast north of 62 ° N. Due to partly different procedures, working protocols, and data format at the two responsible institutes, and since the surveys partly overlapped in space and time, this combination was difficult. The series was started in 1995, but for the years prior to 2003, only some of the acoustic transects, mostly those that had been standardized during the “Fiskeriforskning” survey, were used in index calculations.
3.3 - Description of the survey data
Table 1 lists the surveys from 1995-2019, which vessels took part, the number of stations taken etc.
| Year | Vessel | Cruise ID | For swept area index | For acoustic index | |||||||
| N BT | N aged | N length | N BT (with cod) | N aged | N length | N miles scrutinized | |||||
| Total | With cod | Total | With cod | ||||||||
| 1995 | Michael Sars | 1995111 | 2515 | 497 | 3869 | 3575 | |||||
| Johan Hjort | 1995211 | 80 | 1845 | 3952 | 2158 | ||||||
| Volstad | 1995810 | 0 | 54 | 0 | 0 | ||||||
| 1996 | Johan Hjort | 1996214 | 171 | 2727 | 3285 | 1905 | |||||
| Michael Sars | 4-1996 | 2393 | 5376 | 6186 | 1552 | ||||||
| 1997 | Johan Hjort | 1997213 | 432 | 3656 | 3687 | 2650 | |||||
| Michael Sars | 4-1997 | 1670 | 4653 | 4180 | 0 | ||||||
| 1998 | G.O.Sars | 1998016 | 493 | 2237 | 3030 | 1808 | |||||
| Jan Mayen | 4-1998 | 2476 | 4060 | 3175 | 0 | ||||||
| 1999 | Johan Hjort | 1999215 | 399 | 1083 | 3813 | 1653 | |||||
| Jan Mayen | 4-1999 | 2780 | 4444 | 3420 | 0 | ||||||
| 2000 | Johan Hjort | 2000214 | 414 | 1202 | 3766 | 1816 | |||||
| Jan Mayen | 4-2000 | 4240 | 5276 | 3090 | 0 | ||||||
| 2001 | Johan Hjort | 2001213 | 267 | 844 | 4523 | 1229 | |||||
| Jan Mayen | 4-2001 | 3181 | 3815 | 2614 | 0 | ||||||
| 2002 | Johan Hjort | 2002214 | 362 | 1173 | 4655 | 2128 | |||||
| Jan Mayen | 4-2002 | 2048 | 2511 | 3164 | 0 | ||||||
| 2003 | Johan Hjort | 2003211 | 58 | 50 | 1381 | 2520 | 72 | 1580 | 2808 | 3695 | 2012 |
| Jan Mayen | 2003706 | 78 | 68 | 1367 | 1734 | 109 | 1635 | 2077 | 4007 | 3130 | |
| 2004 | Johan Hjort | 2004212 | 50 | 41 | 981 | 1714 | 67 | 1159 | 2010 | 3502 | 1989 |
| Jan Mayen | 2004704 | 81 | 69 | 1270 | 1814 | 88 | 1345 | 1942 | 3469 | 2824 | |
| 2005 | Johan Hjort | 2005212 | 42 | 36 | 759 | 1345 | 51 | 949 | 1625 | 3013 | 1768 |
| Jan Mayen | 2005704 | 82 | 66 | 695 | 863 | 80 | 689 | 870 | 3794 | 3180 | |
| 2006 | Johan Hjort | 2006213 | 51 | 42 | 543 | 821 | 48 | 677 | 1047 | 3851 | 2165 |
| Håkon Mosby | 2006623 | 0 | 0 | 0 | 0 | 7 | 33 | 51 | 4479 | 34 | |
| Jan Mayen | 2006705 | 90 | 71 | 865 | 995 | 87 | 886 | 1021 | 4013 | 3260 | |
| 2007 | Johan Hjort | 2007212 | 39 | 25 | 179 | 296 | 39 | 327 | 489 | 3550 | 1042 |
| Håkon Mosby | 2007623 | 0 | 0 | 0 | 0 | 8 | 0 | 103 | 3778 | 0 | |
| Jan Mayen | 2007703 | 107 | 87 | 834 | 1040 | 85 | 829 | 1036 | 4670 | 3860 | |
| 2008 | Johan Hjort | 2008210 | 86 | 81 | 1197 | 1773 | 103 | 1381 | 2012 | 6275 | 5831 |
| Håkon Mosby | 2008623 | 31 | 16 | 233 | 329 | 24 | 308 | 439 | 1875 | 0 | |
| Jan Mayen | 2008705 | 4 | 4 | 73 | 127 | 10 | 73 | 192 | 214 | 193 | |
| 2009 | Johan Hjort | 2009209 | 49 | 41 | 760 | 1240 | 46 | 818 | 1306 | 2860 | 1696 |
| Håkon Mosby | 2009629 | 17 | 6 | 11 | 11 | 5 | 29 | 29 | 1127 | 180 | |
| Jan Mayen | 2009703 | 66 | 57 | 1263 | 2345 | 75 | 1299 | 2466 | 2819 | 2680 | |
| Jan Mayen | 2009704 | 4 | 4 | 140 | 382 | 14 | 166 | 544 | 524 | 524 | |
| 2010 | Johan Hjort | 2010211 | 114 | 90 | 1957 | 3847 | 120 | 2284 | 4841 | 6175 | 4284 |
| Jan Mayen | 2010704 | 6 | 6 | 149 | 489 | 12 | 168 | 518 | 380 | 380 | |
| 2011 | Johan Hjort | 2011214 | 38 | 32 | 536 | 839 | 31 | 561 | 880 | 2450 | 1796 |
| Helmer Hanssen | 2011722 | 81 | 71 | 1246 | 2075 | 80 | 1292 | 2158 | 4074 | 2875 | |
| Helmer Hanssen | 2011723 | 6 | 6 | 114 | 177 | 18 | 184 | 290 | 240 | 222 | |
| 2012 | Johan Hjort | 2012210 | 64 | 55 | 834 | 1496 | 64 | 974 | 1701 | 3760 | 2552 |
| Håkon Mosby | 2012620 | 65 | 51 | 1129 | 1878 | 50 | 1202 | 2123 | 2663 | 1402 | |
| 2013 | Johan Hjort | 2013210 | 54 | 51 | 932 | 1638 | 72 | 1020 | 1836 | 3018 | 1602 |
| Håkon Mosby | 2013623 | 59 | 50 | 1160 | 2288 | 65 | 1249 | 2451 | 2339 | 1227 | |
| Helmer Hanssen | 2013851 | 8 | 8 | 124 | 317 | 21 | 124 | 492 | 436 | 432 | |
| 2014 | Helmer Hanssen | 2014011 | 8 | 8 | 209 | 717 | 21 | 222 | 736 | 455 | 449 |
| Johan Hjort | 2014213 | 61 | 54 | 928 | 1601 | 81 | 1046 | 1767 | 4036 | 2680 | |
| Håkon Mosby | 2014621 | 74 | 61 | 1292 | 2555 | 94 | 1344 | 2623 | 2718 | 1837 | |
| 2015 | Johan Hjort | 2015211 | 64 | 53 | 901 | 1272 | 65 | 992 | 1797 | 3880 | 2289 |
| Håkon Mosby | 2015621 | 74 | 58 | 1180 | 1798 | 59 | 1183 | 2580 | 2447 | 1578 | |
| Helmer Hanssen | 2015854 | 8 | 7 | 181 | 566 | 21 | 229 | 613 | 395 | 390 | |
| 2016 | Johan Hjort | 2016210 | 70 | 61 | 1451 | 2336 | 91 | 1545 | 2580 | 4594 | 4429 |
| Håkon Mosby | 2016620 | 69 | 53 | 976 | 1463 | 59 | 1012 | 1522 | 2978 | 1567 | |
| 2017 | Johan Hjort | 2017210 | 99 | 89 | 1616 | 2822 | 94 | 1656 | 2887 | 4696 | 2322 |
| Kristine Bonnevie | 2017620 | 87 | 70 | 917 | 1854 | 97 | 957 | 1931 | 3760 | 1567 | |
| 2018 | Johan Hjort | 2018210 | 110 | 90 | 1713 | 3282 | 134 | 1747 | 3316 | 4141 | 1527 |
| Kristine Bonnevie | 2018623 | 86 | 66 | 1301 | 2365 | 94 | 1389 | 2523 | 3983 | 2146 | |
| 2019 | Johan Hjort | 2019210 | 128 | 100 | 1516 | 2059 | 108 | 1598 | 2164 | 4832 | 2411 |
| Kristine Bonnevie | 2019629 | 87 | 70 | 1191 | 2409 | 117 | 1196 | 2499 | 3345 | 2371 | |
4 - Software used
StoX is a software developed by the Institute of Marine Research for survey analysis and index calculation. StoX is freely available (ftp://ftp.imr.no/StoX/Download/ ) and is relatively well documented (Johnsen et al., 2019). StoX is currently used for the calculation of bottom trawl indices from the Barents Sea winter survey (Mehl et al., 2018b) and from the Barents Sea ecosystem survey in the autumn (BESS) (Johannesen et al., 2019).
The data was mainly downloaded from: https://datasetexplorer.hi.no/apps/datasetexplorer/v2/navigation and the folder “Varanger Stad NOR coastal cruise in autumn». However, for some research vessels, especially in the early part of the period, data was lacking in the relevant folders and had to be retrieved from the original data files and reformatted to the current xml format used by StoX (https://www.hi.no/hi/forskning/prosjekter/stox). Steps have been taken to have these data stored in the “Varanger Stad NOR coastal cruise in autumn” folder structure and quality assure for later use.
5 - Acoustic indices
A stock abundance index series based on acoustic data from the annual autumn coastal survey ( NOcoast-Aco-4Q ) was calculated using the StoX software (Johnsen et al., 2019). Acoustic data covering the coastline from 62°N to the Russian border are available back to 1995, although the coverage in various parts of this area varied somewhat due to various reasons, see chapter 3.1 and 3.2 for details. For some early years in the series, acoustic data was only available from parts of the survey area. The area was split into 23 strata (see above) and the stock abundance index was calculated for each stratum separately. For various reasons, it was decided to split the total area into three subareas: The coast north of 67°N (A, consisting of 18 strata), between 65° and 67°N (B, consisting of 2 strata), and between 62°N and 65°N (C, consisting of 2 strata) (Fig 1). The spatial coverage during most of the time series is much better in subarea A than in B and C.
To estimate the uncertainty, 500 bootstrap runs were performed, and the indices are the average index from these runs.
5.1 - Acoustic indices by length
The conversion of mean nautical area scattering coefficient (NASC, m 2 nmi −2 ) to fish density was carried out using a standard procedure, where trawl stations (with a catch of more than 1 cod individual) were assigned to each PSU. As a rule, all stations within a stratum were assigned to the PSUs in the same stratum. However, if less than three trawl stations were carried out in a stratum, stations in neighbouring strata were assigned to the PSUs so that at least three stations were assigned to each PSU.
The combined length distribution (d), calculated for each transect (PSU, j), is given by
 , (eqn 1)
where d l,s,j is fish density (number by 1 nmi tow distance) by station (s) and length group (l, cm), and n is the total number of stations.
The fish density (ρ, individuals nmi -2 ) by length group and transect was calculated using
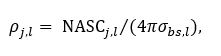 (eqn 2)
where NASC j,l is the mean nautical area scattering coefficient by transect and length group and σ bs,l (m2) is the acoustic backscattering cross-section for a fish of length l.
NASC j,l is given by
![]() (eqn 3)
(eqn 3)
where σ bs,l is the acoustic backscattering cross-section for a fish of length l multiplied by the proportion (p) of a fish of length l in d l,j , and NASC j is the mean nautical area scattering coefficient over a given transect.
The acoustic backscattering cross-section for a fish of length l is calculated using
 , (eqn 4)
where the target strength, TS (dB re 1m 2 ), for a fish of length l is calculated using
 , (eqn 5)
where m and a are constants, set at 20 and -68.0 respectively.
The abundance (N, inds) of cod by length group l and stratum k is given by
 , (eqn 6)
where A (nmi 2 ) is the stratum area, and the mean density of cod by l and k is given by
![]() (eqn 7)
(eqn 7)
where ![]() is the transect weight,
is the transect weight, ![]() is the total number of sample transects and
is the total number of sample transects and ![]() and
and ![]() are the distance of each transect by stratum and the mean transect distance over each stratum respectively.
are the distance of each transect by stratum and the mean transect distance over each stratum respectively.
5.2 - Acoustic indices by age
Only a subsample of the length-measured individuals (j) is aged. A two-stage conversion process is used to convert the abundance of fish by length group to abundance of fish by age group.
First, the abundance ( N k,l ) by l and k is distributed the length-measured individuals to generate so-called super-individuals, each representing an abundance estimated as:
 , (eqn 8)
where
 , (eqn 9)
and m is the number of length-measured individuals.
Second, in instances where a super-individual is not aged, the missing age is filled in by a random data imputation. The imputation of missing age is principally carried out at the station level, randomly selecting the value from aged super-individuals within the same length group. If no aged super-individual is available at station level, the imputation is attempted at strata level, or lastly on survey level. In instances, where no age information is available at any level for a specific length group, the abundance estimate is presented with unknown age. As the imputation of missing age values in both examples also imputes associated biological parameters, abundance can be estimated for any combination of classifications assigned to the super-individuals e.g. sex, maturity, age etc. In our case the otolith type was used to classify the super-individuals, see below.
5.3 - Length and weight at age
Length and weight at age was calculated using the weighting factors defined in eqn 8 (the “super -individuals”).
5.4 - Uncertainty of abundance indices
Uncertainty was estimated as the coefficient of variation (ratio of standard deviation to the mean, CV). StoX calculates CV using bootstrap runs by stratum, treating each trawl station as the primary sampling unit. Here we used 500 bootstrap runs.
5.5 - Extracting coastal cod from total cod
Since the discrimination of coastal cod and other cod caught at the coastal survey is based on otolith types (see above), this poses a special challenge to producing abundance index series with uncertainty for coastal cod. Running a StoX project on the acoustical and biological data to produce an acoustic index series will primarily produce indices for all cod present in these data sources. However, when running the bootstrap process in StoX, it is possible to group the superindividuals by several categories, for instance age and otolith type. There is no facility inside StoX to present those “two-dimensional” bootstrap data but using an R-script manipulating the bootstrap files generated by StoX it is possible to extract relevant data. Thus, this was done after the whole time series was made by ordinary StoX-runs, by selecting only those entries in the bootstrap data that contained superindividuals with otolith types “1” and “2”. All tables and figures in the appendices were produced with this R-script. The R-script itself is documented in appendix C. Since the growth pattern can only be distinguished with certainty in otoliths from two-year old and older fish (although an otolith type is in some cases noted also for younger fish), the indices of age 0 and age 1 were excluded from the index series suggested for use in stock assessment.
5.6 - Acoustic indices - settings in StoX
The processes included and the settings of parameters when running StoX for acoustic indices are given in Tables 2-5:
Table 2. Baseline processes:
| Process | Parameters | Values |
| ReadProcessData | ||
| ReadAcousticXML | FileName1, FileName2, … | Relevant data files |
| FilterAcoustic | AcousticData | ReadAcousticXML |
| DistanceExpr | N/A | |
| FreqExpr | N/A | |
| NASCExpr | acocat == 31 | |
| NASC | LayerType | WaterColumn |
| ReadBioticXML | FileName1, FileName2, … | Relevant file names |
| FilterBiotic | FishStationExpr | fs.getLengthSampleCount(‘TORSK’)>1 |
| CatchExpr | species == ‘164712’ | |
| SampleExpr | N/A | |
| IndExpr | N/A | |
| StationLengthDist | LengthDistType | NormLengthDist |
| RegroupLenghDist | LengthInverval | 1.0 |
| Catchability | CatchabilityMethod | LengthDependentSweepWidth |
| LengthDist | RegroupLengthDist | |
| ParLenfthDependentSweepWidth | SpecCat=;Alpha=5.91;Beta=0.43;LMin=15.0;LMax=62.0 | |
| RelLengthDist | LengthDist | Catchability |
| DefineStrata | UseProcessData | “ True” |
| StratumArea | AreaMethod | Accurate |
| DefineAcousticTransect | DefinitionMethod | UseProcessData |
| MeanNASC | NASC | NASC |
| SampleUnitType | PSU | |
| BioStationAssignment | BioticData | FilterBiotic |
| AssignmentMethod | Stratum (first time, then UseProcessData) | |
| EstLayers | 1~PELBOT | |
| BioStationWeigting | WeightingMethod | SumWeightCount |
| TotalLengthDist | LengthDist | RelLengthDist |
| AcousticDensity | LengthDist | TotalLengthDist |
| NASC | MeanNASC | |
| m | 20 | |
| a | -68 | |
| MeanDensity_Stratum | Density | AcousticDensity |
| SampleUnitType | Stratum | |
| SumDensity_Stratum | Density | MeanDensity_Stratum |
| Abundance | Density | SumDensity_Stratum |
| PolygonArea | StratumArea | |
| IndividualDataStations | Abundance | Abundance |
| IndividualData | IndividualDataStations | IndividualDataStations |
| SuperIndAbundance | Abundance | Abundance |
| IndividualData | IndividualData | |
| AbundWeightMethod | StationDensity | |
| LengthDist | RegroupLengthDist |
Table 3. Baseline report processes:
| Process | Parameters | Values |
| FillMissingData | Superindividuals | SuperIndAbundance |
| FillVariables | ImputeByAge | |
| Seed | 1 | |
| FillWeight | Mean | |
| EstimateByPopulationCategory | Superindividuals | FillMissingData |
| Lengthinterval | 5.0 | |
| Scale | 1000 | |
| Dim1 | olotithtype | |
| Dim2 | age | |
| Dim3 | SpecCat |
Table 4. R processes:
| Process | Parameters | Values |
| runBootstrap | bootstrapMethod | AcousticTrawl |
| acousticMethod | PSU~Stratum | |
| bioticMethod | PSU~Stratum | |
| startProcess | TotalLengtDist | |
| endProcess | SuperIndAbundance | |
| nboot | 500 | |
| seed | 1 | |
| cores | 4 | |
| imputeByAge | seed | 1 |
| cores | 4 | |
| SaveProjectData | “ Enabled” |
Table 5 R report processes:
| Process | Parameters | Values |
| getReports | out | all |
| options | grp1=”age”, grp2=”otolithtype” | |
| getPlots | out | all |
| options | grp1=”age”, grp2=”otolithtype” |
5.7 - Resulting time series
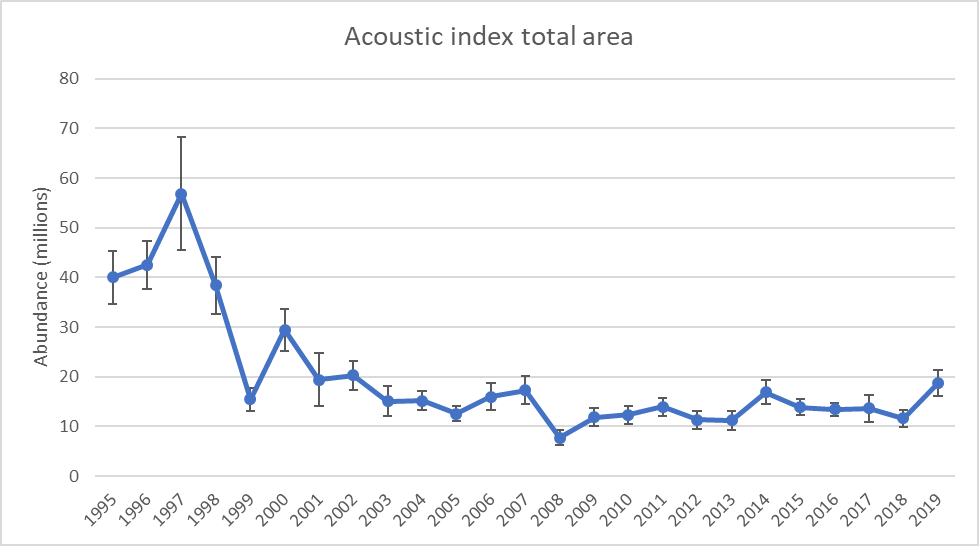
The annual abundance indices and biomass indices by age groups and for age group 2+, their coefficient of variation, and mean length and weight by age groups are shown in Appendix A for the total area and for the subareas A, B and C.
The abundance indices for age 2+ are depicted in Figures 3 to 6. The series for the total area (Fig 3) is characterized by high indices at the beginning of the time series, but rapidly decreasing from 1997 to a level of 10-20 million, without any clear trends. In general, the uncertainties are larger during the first part of the time series compared to more recent years.
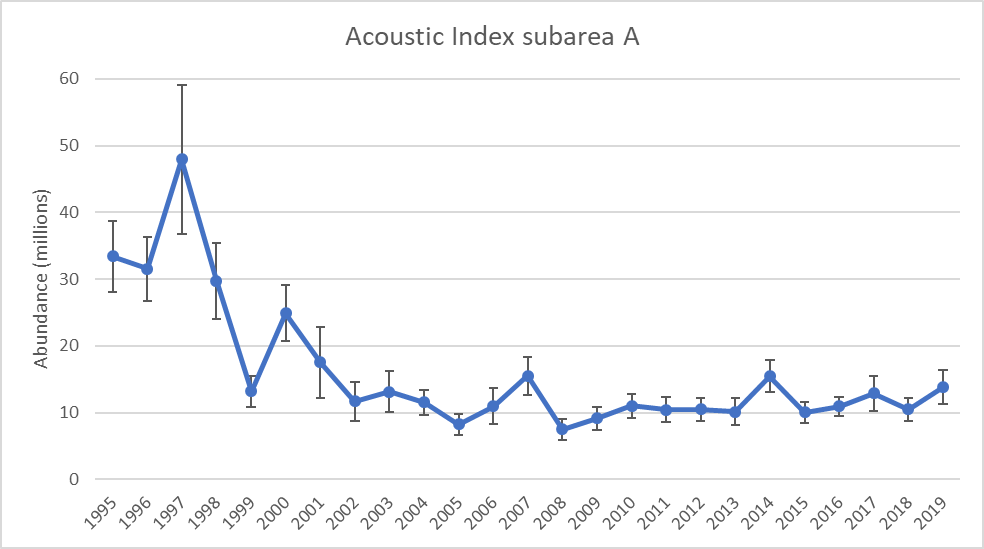
The series for subarea A (the northern part of the survey area, Figure 4) resembles that for the total area, because this area contains most of the coastal cod.
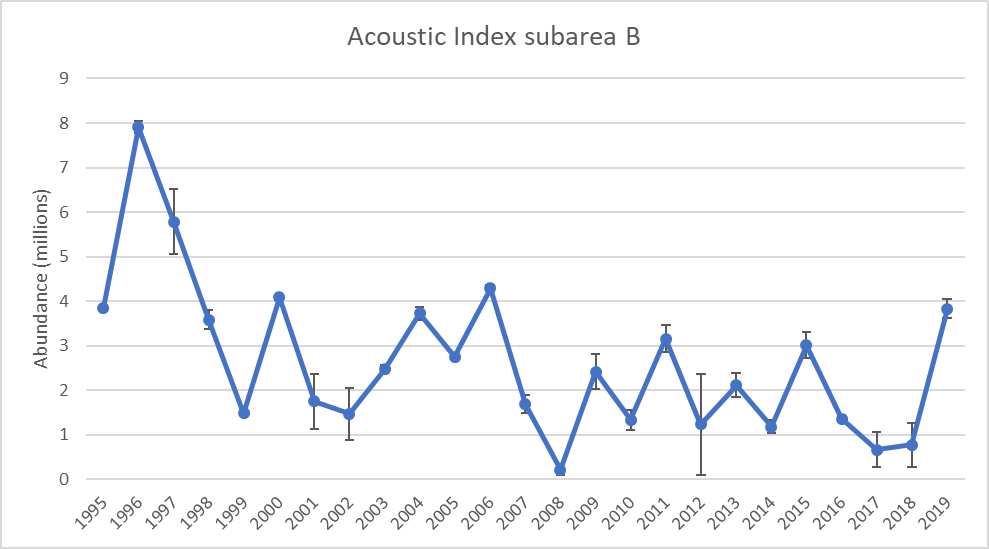
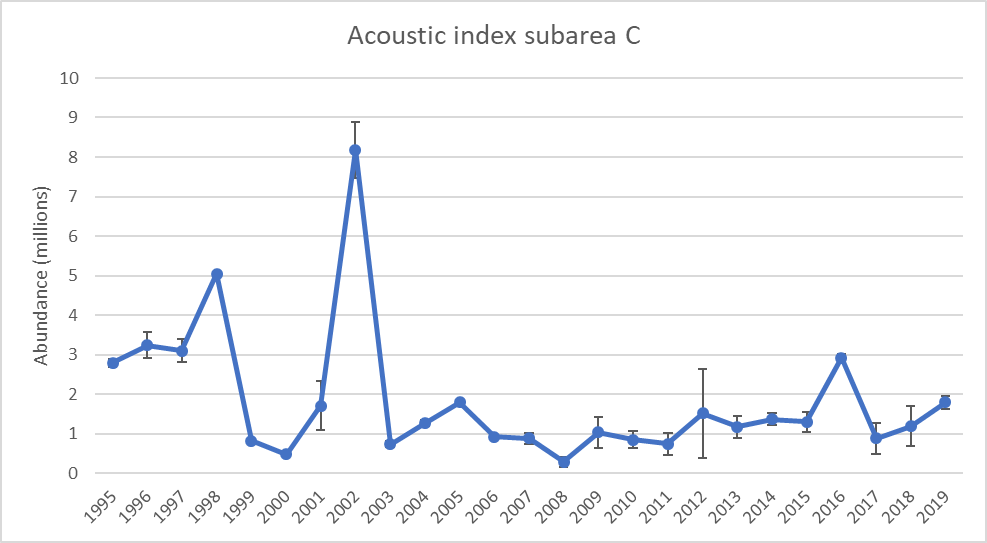
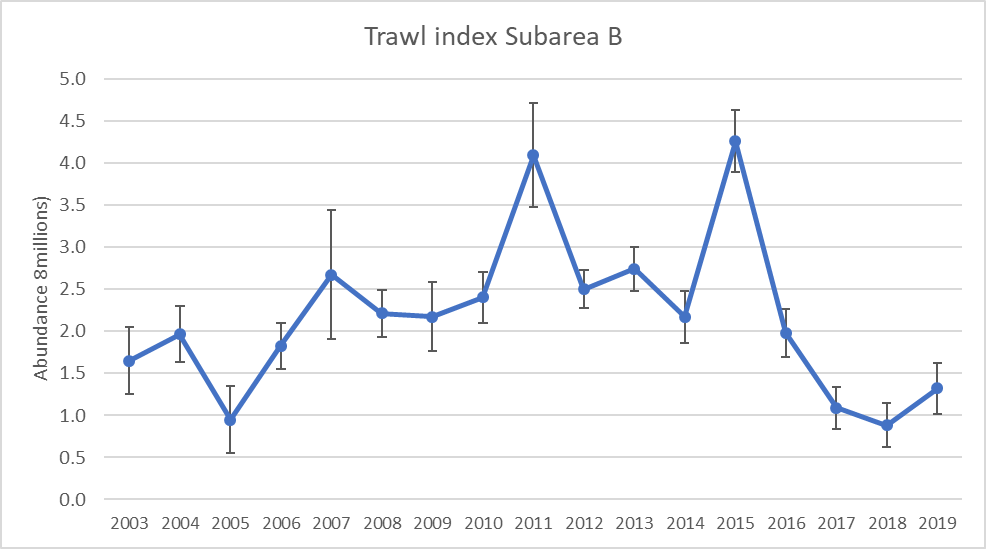
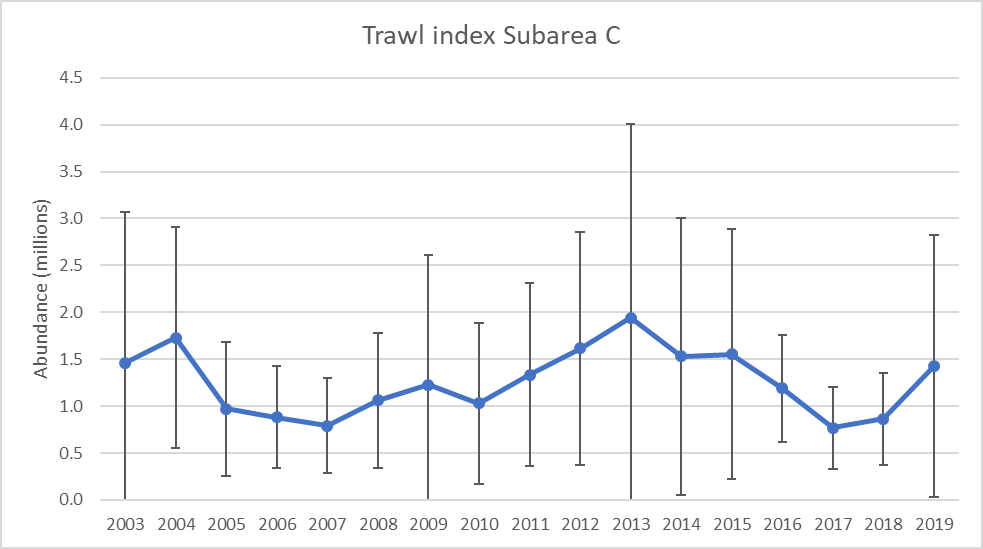
The indices for subareas B (Figure 5) and C (Figure 6) are lower than for subarea A. The uncertainties are also more variable from year to year.
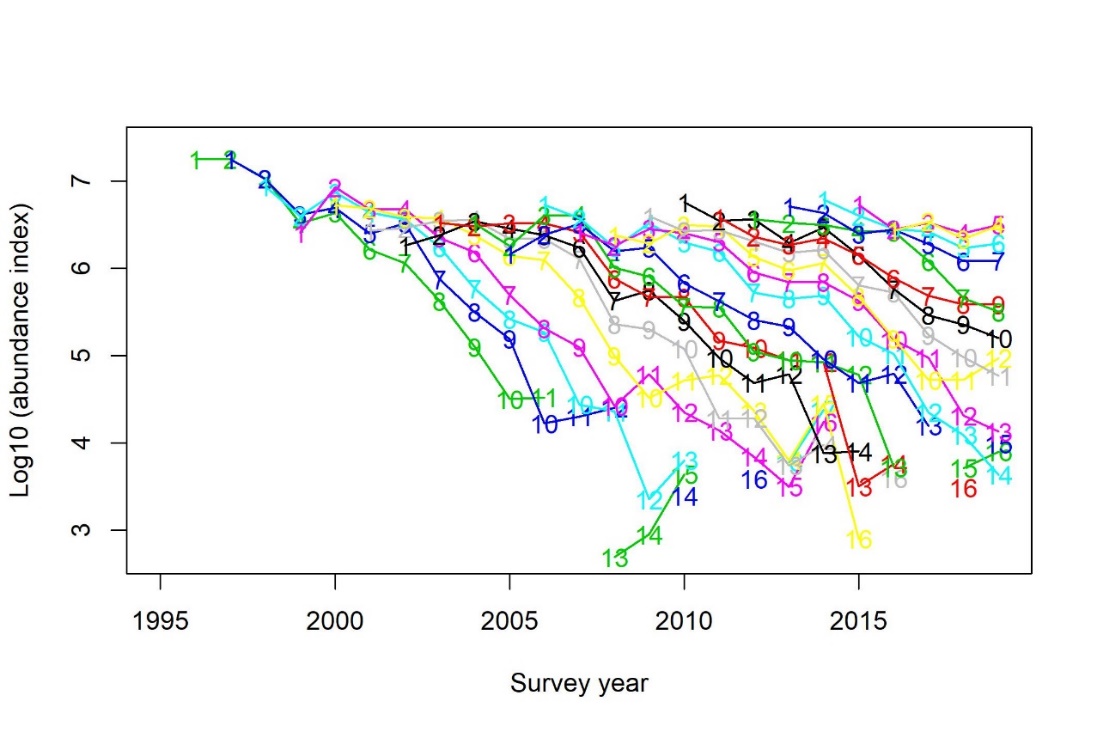
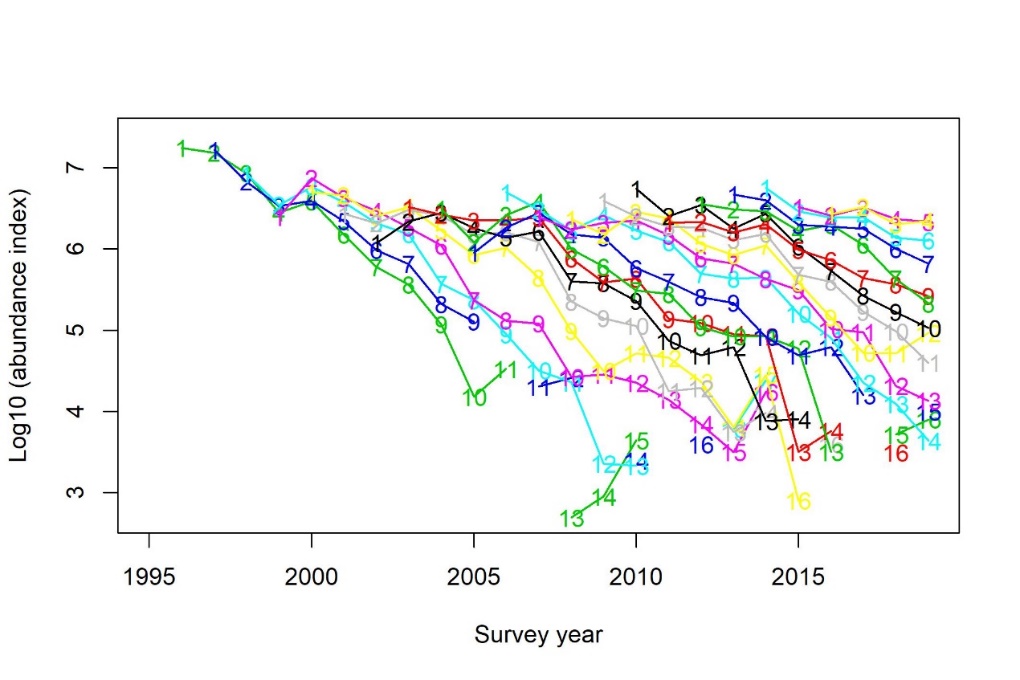
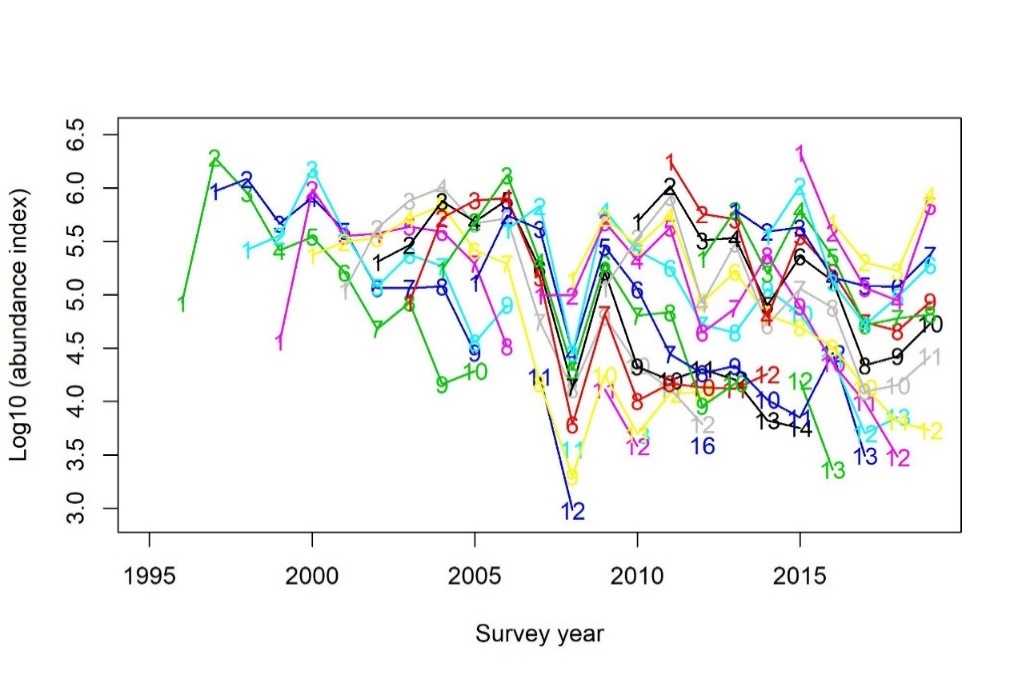
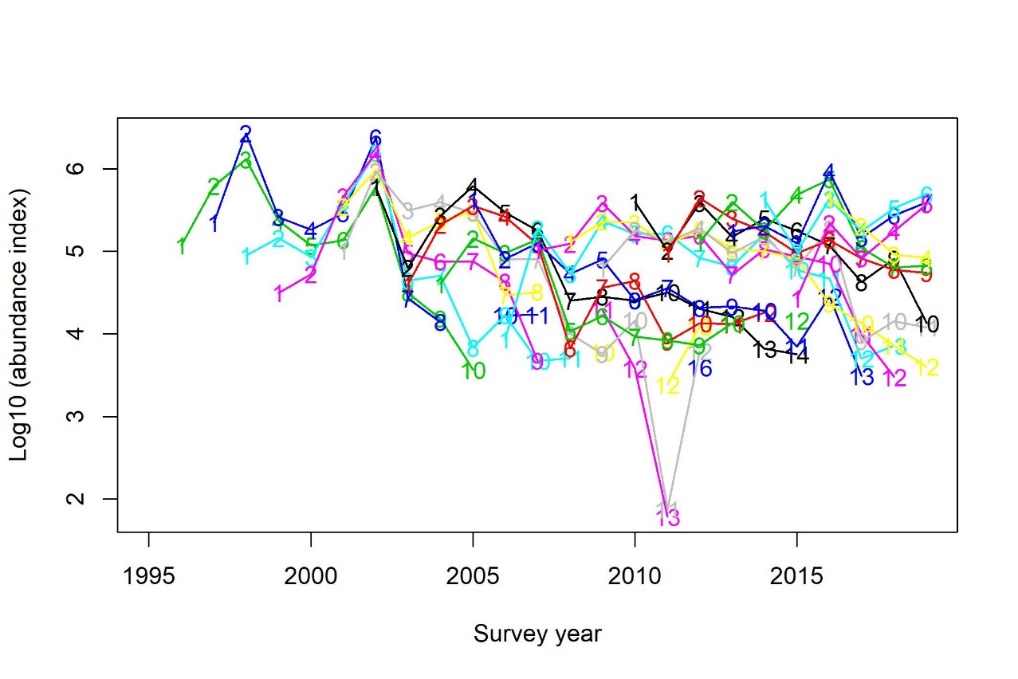
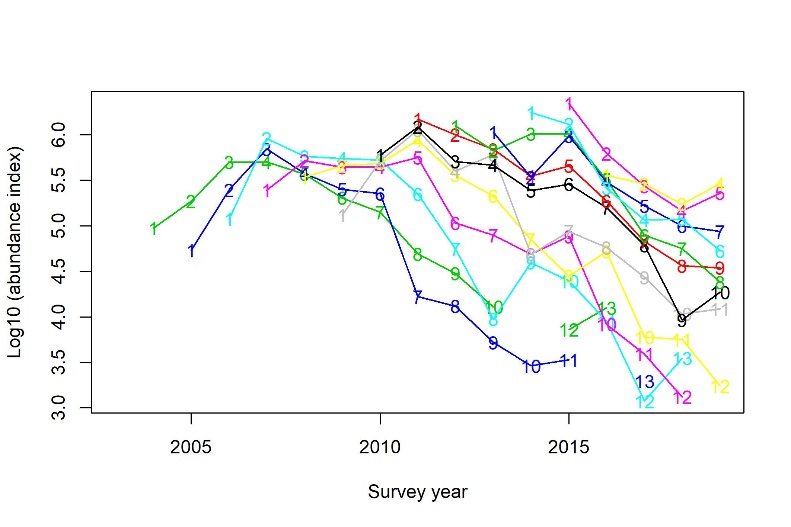
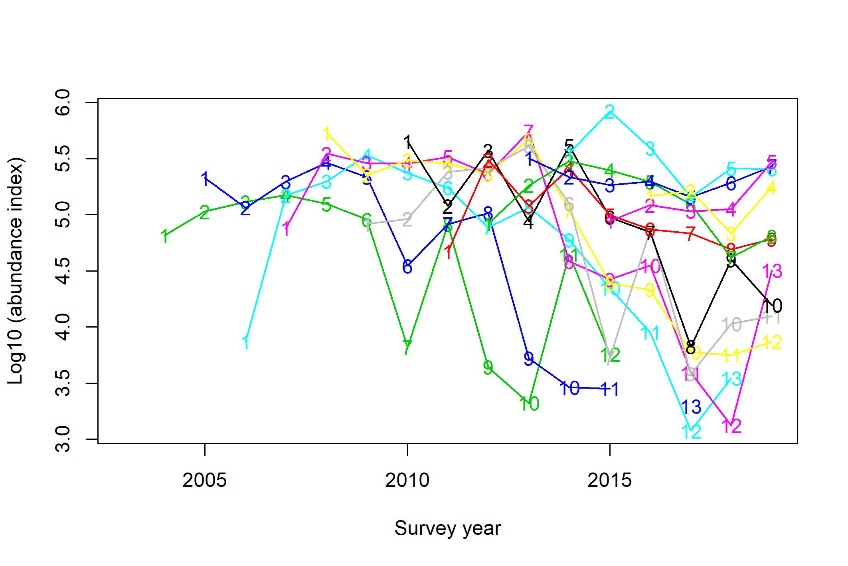
To assess whether the indices can describe the stock dynamics over time, plots on how year classes (cohorts) could be traced from year to year were constructed (Figure 7-10). The progression of year classes through the stock is reasonably well described for the total area and for subarea A (Figures 7-8). A year effect is visible for instance in 1998, when all age groups where recorded lower than expected. In other years, single age groups, in particular among older fish, show unexpected patterns. This seems to be a problem for age groups above 10 years. As expected, the plot for Subarea A (Figure 8) resembles that for the total area, while those for Subarea B (Figure 9) and Subarea C (Figure 10) show a much less consistent picture, where strong year effects are visible .
5.8 - Internal consistency in the acoustic series for subarea A
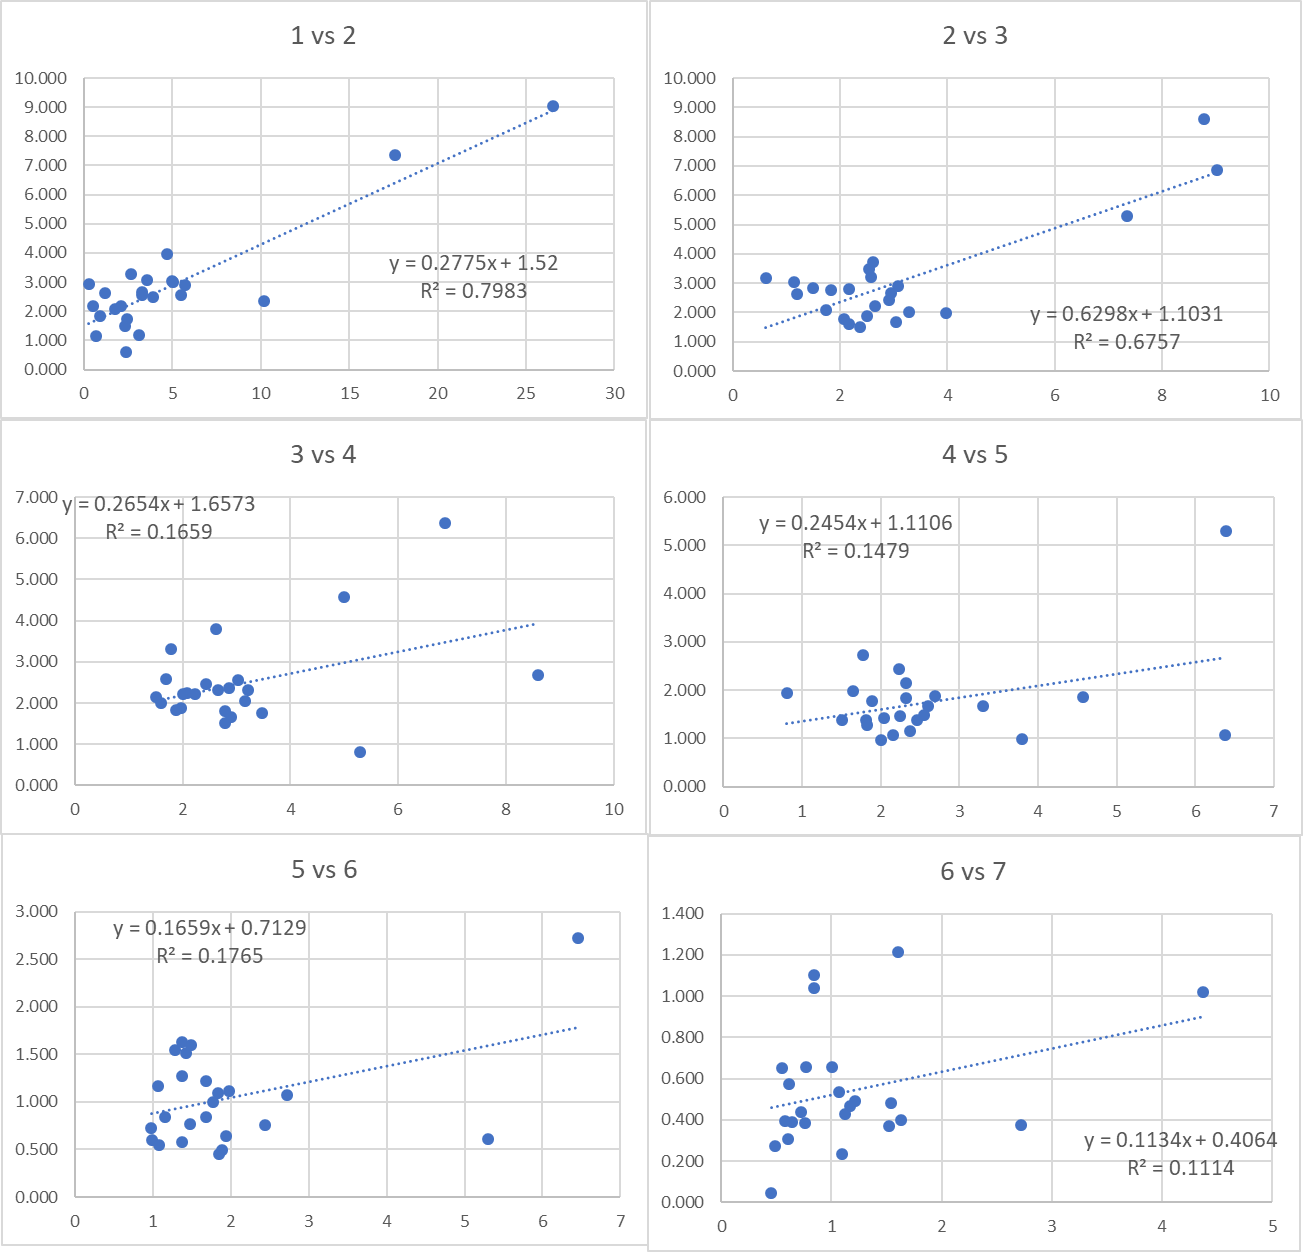
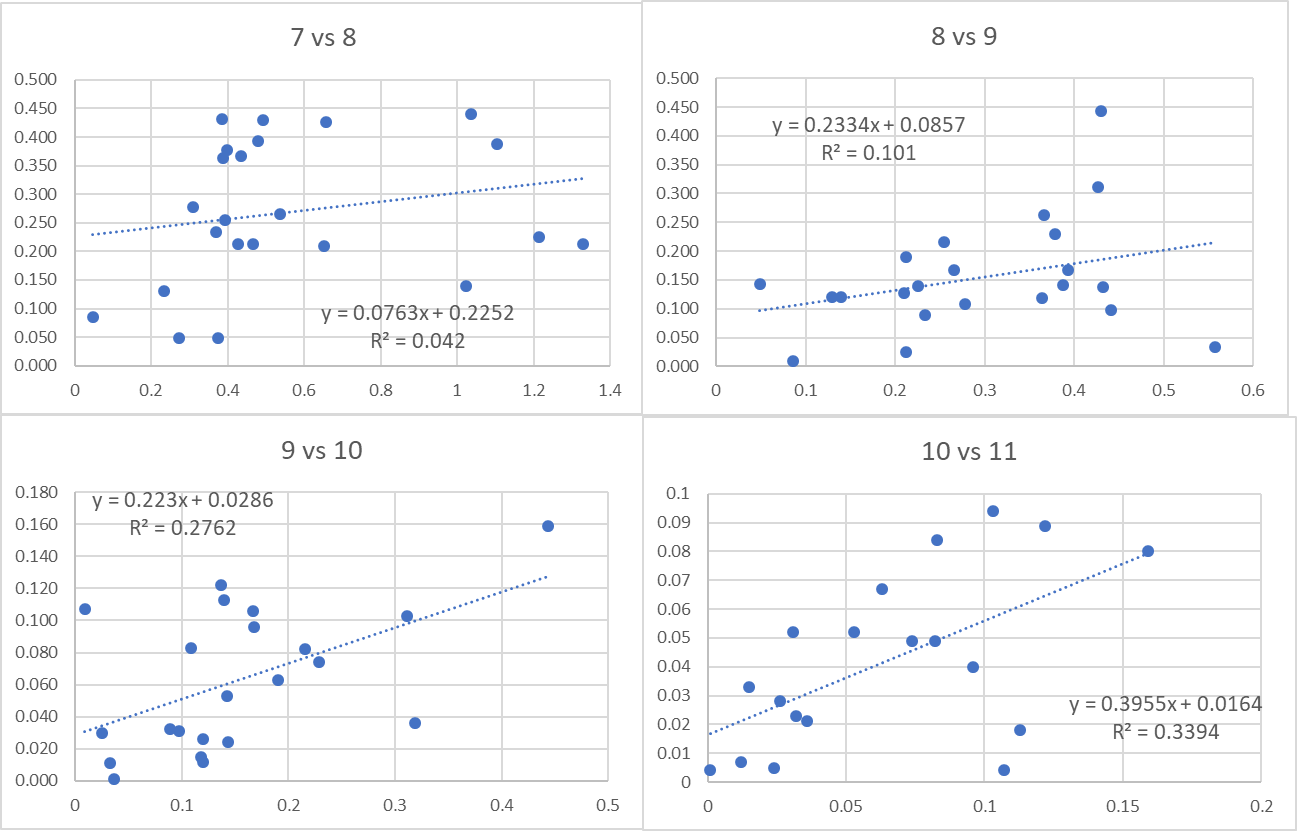
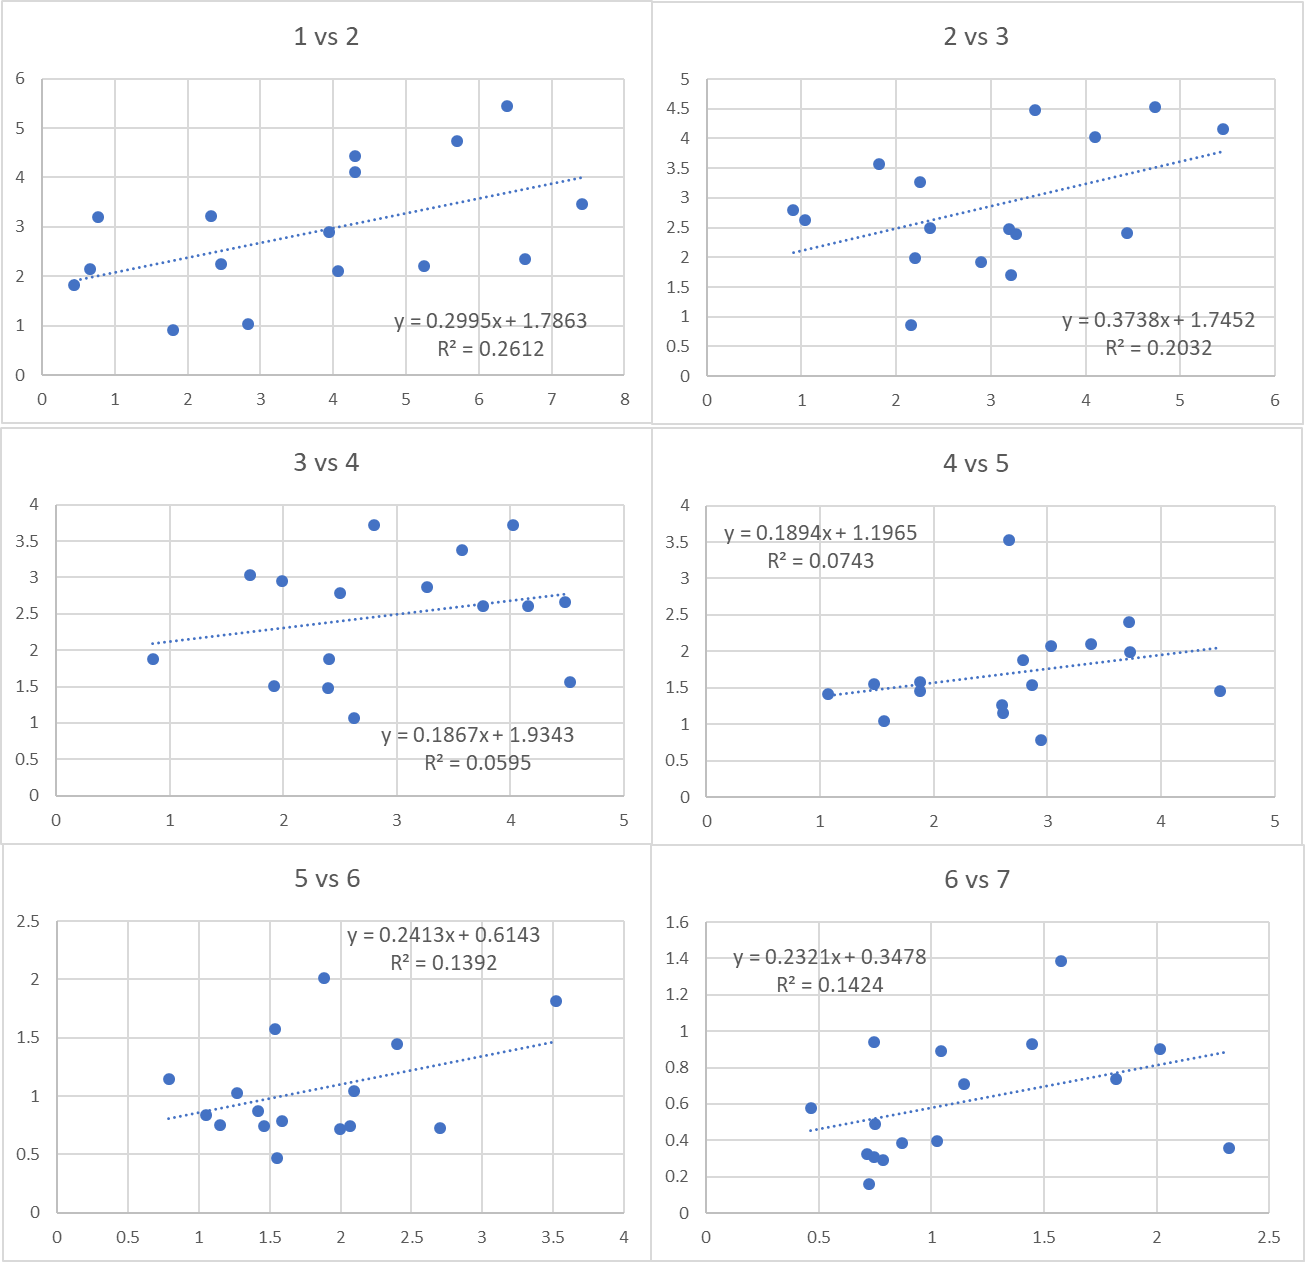
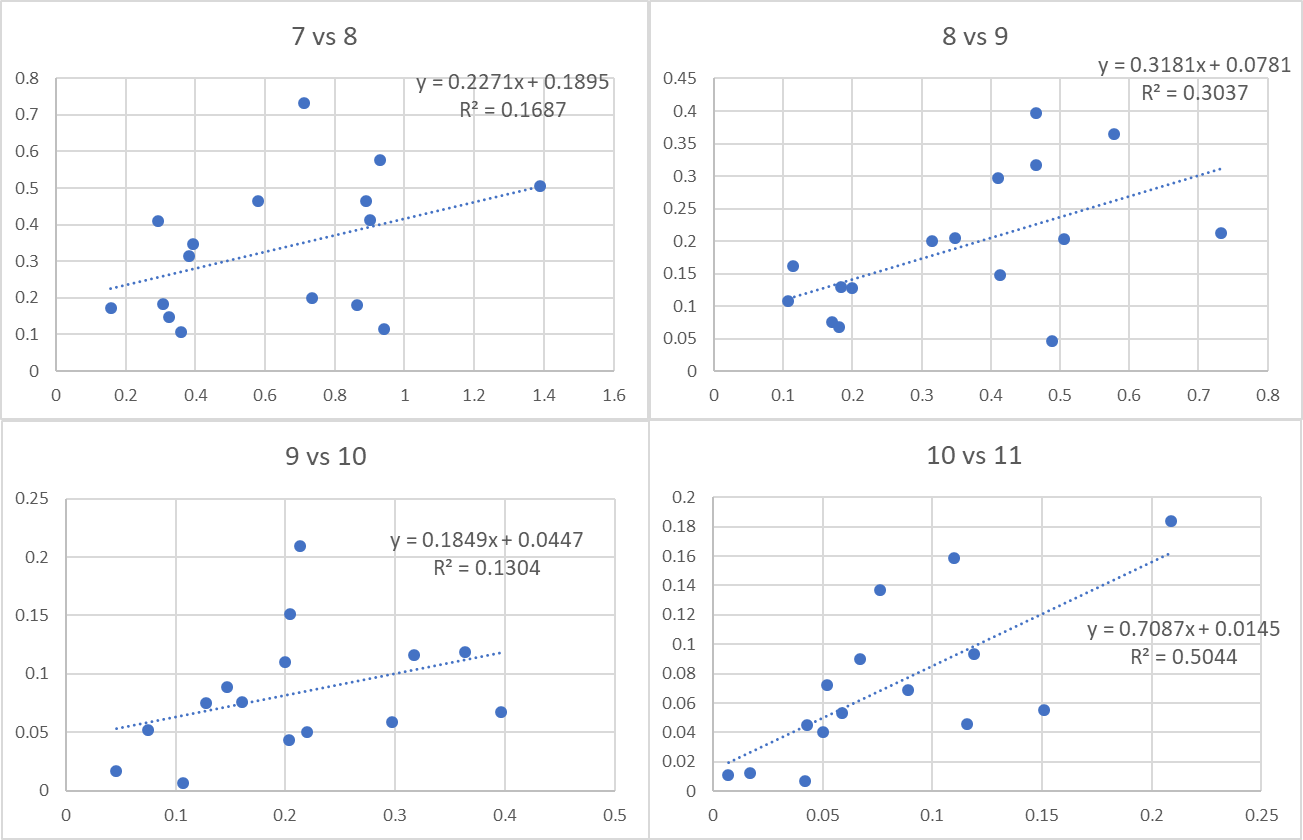
The internal consistency plots (number at age n in year n plotted versus number at age n+1 in year y+1) for age groups 1-6 are shown in Figure 11 and for age groups 7-12 in Figure 12. In most cases the fit is rather poor. Exceptions are age 1-2 and age 2-3, with rather high correlation, but the regressions are highly affected by the large indices during the first part of the period.
5.9 - Comparison with acoustic index series calculated with previous methods
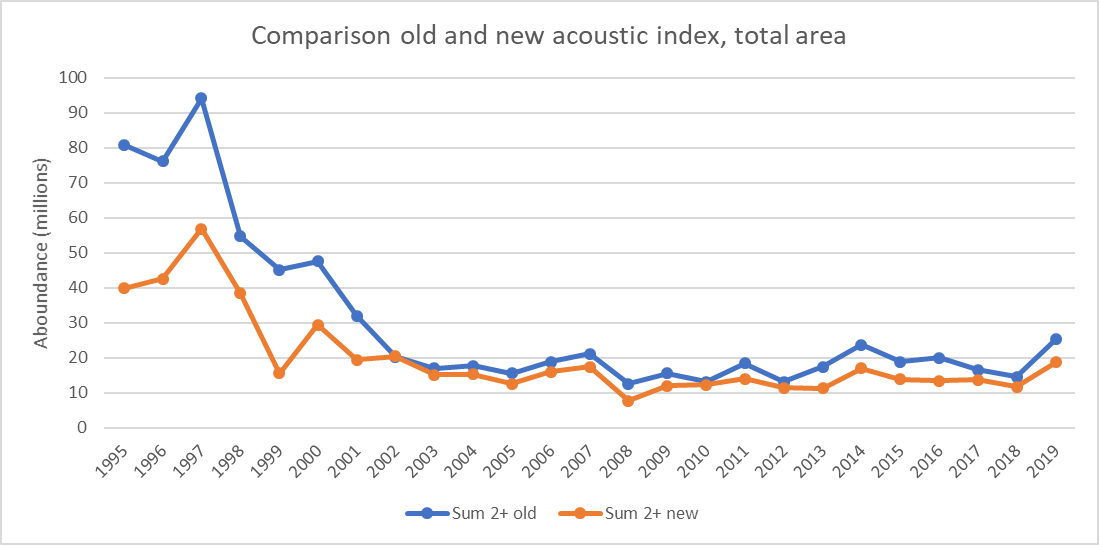
An acoustic index has been calculated for this stock since 1995 (see chapter 1.3). Because this approach used a somewhat more detailed strata system and a method based on the SAS software platform, it is difficult to compare that series with the new acoustic index developed in StoX. Nonetheless, a comparison made for the sum over ages 2+ (Figure 13) shows that there are large differences between the series before 2002. For the period after 2002 the indices are much more similar, with the new series estimates being somewhat lower in most years. A part of the large discrepancies found in the early years of the series can be explained by poor data quality of the acoustic data. When the series was rerun in StoX and the acoustic data checked in detail, some few enormous NASC values were detected, indicating that parts of the bottom signal had been integrated. In small strata containing few transects and few values, such erroneous values may have a big impact on the total index. For instance, in 2000, taking out a NASC value of 4718 from a small stratum (Sørøya Indre) made the index in that stratum change from 46 000 tonnes to 1400 tonnes. In 1996, 1999 and in 2000 six extremely high values were found and removed from the transects, which had profound effects on the index values from these years. It is unknown whether these erroneous values were in fact included in the old acoustic series or not. In the remaining years before 2002, no extreme values could be found and also in these years the new index is substantially lower than the old index, indicating that there are other reasons for the differences. Despite this we argue that the new indices should be accepted on the grounds that they are developed in one go, using a more quality assured software with identical settings from year to year, and with a more thorough quality assurance of the acoustic data.
6 - Swept area indices
A stock abundance index series based on bottom trawl hauls at the annual autumn coastal survey ( NOcoast-Aco-4Q ) was calculated using the StoX software. Trawl data covering the coastline from 62°N to the Russian border were available back to 1995, although the coverage in various parts of this area varied somewhat due to ship availability, weather conditions etc. However, the survey was designed as an acoustic survey before 2003, and trawls were done on acoustic registrations in order to supply biological data for the acoustic observations. Consequently, we did use trawl data prior to 2003 when calculating the swept-area indices for coastal cod. The area is split into 22 strata (Figure 1) and the stock abundance index is calculated for each stratum separately. It was decided to split the total area into three subareas: The coast north of 67°N (A, consisting of 18 strata), between 65° and 67°N (B, consisting of 2 strata), and between 62°N and 65°N (C, consisting of 2 strata). The coverage during most of the time series is much better in subarea A than in B and C.
The coastal cod was split from the NEA cod using the same methods as described for the acoustic index, see above.
To estimate the uncertainty of the estimate, 500 bootstrap runs were performed, and the indices are the average index from these runs.
6.1 - Swept area indices by length
The following description is taken from Johannesen et al. (2019):
The swept area density ( ρ , individuals per square nautical mile, inds nmi -2 ) by stratum (k), station (s) and length group l (1 cm), is given by
 , (eqn 10)
where f k,s,l is the number of individuals standardized over a towing distance of 1 nmi by k, s and l, and sw l is the adjusted swept width in nmi’s by length group calculated using
 , (eqn 11)
where EW l is the length dependent effective swept width. The length dependency of swept width is taken from (Dickson, 1993)
The abundance ( N , inds) by l and k is calculated using
 , (eqn 12)
where A is stratum area (nmi 2 ), and ρ k,l is the average swept area density by l and k, given by
 , (eqn 13)
where n is number of stations.
6.2 - Swept area indices by age
The sampling protocol for the survey is to sample one individual from each 5 cm length group at each trawl station for aging and individual weights. A two-stage conversion process is used to convert the abundance of fish by length group to abundance of fish by age group.
Firstly, the abundance ( N k,l ) by length group l (5 cm) and stratum k is distributed by the length-measured individuals (j) to generate so-called “Super-individuals” (super-individuals represent fractions of a total, our use corresponds to a probability based design where  is the inverse of the inclusion probability for a single fish sample), each representing an abundance estimated as:
, (eqn 14)
where
 , (eqn 15)
and m is the number of length-measured individuals
Secondly, in instances where a super-individual is not aged, the missing age is filled in by a random data imputation. The imputation of missing age is principally carried out at the station level, randomly selecting the value from aged super-individuals within the same length group. If no aged super-individual is available at the station level, the imputation is attempted at strata level, or lastly on survey level. In instances where no age information is available at any level for a specific length group, the abundance estimate is presented with unknown age (Johnsen et al., 2019).
6.3 - Length and weight at age
Length and weight at age was calculated using the weighting factors defined in eqn 15 (the “super -individuals”).
6.4 - Uncertainty of abundance indices
Uncertainty was estimated as the coefficient of variation (ratio of standard deviation to the mean, CV). StoX calculates CV using bootstrap runs by stratum, treating each trawl station as the primary sampling unit. Here we used 500 bootstrap runs.
6.5 - Extracting coastal cod from total cod
Since the discrimination of coastal cod and other cod caught at the coastal survey is based on otolith types (see above) this poses a special challenge to producing abundance index series with uncertainty for coastal cod. Running a StoX project on the biological data to produce a swept-area index series will primarily produce indices for all cod present in this data source. However, when running the bootstrap process in StoX, it is possible to group the superindividuals by several categories, for instance age and otolith type. There is no facility inside StoX to present those “two-dimensional” bootstrap data but using an R-script manipulating the bootstrap files generated by StoX it is possible to extract relevant data. Thus, this was done after the whole time series were made by ordinary StoX-runs, by selecting only those entries in the bootstrap data that contained superindividuals with otolith types “1” and “2”. Alle tables and figures in the appendices to this document were produced by this R-script. The R-script itself is documented in appendix “C”.
6.6 - Swept area indices – settings in StoX
The processes included and the settings of parameters when running StoX for swept area indices are given in tables 6-9:
Table 6. Baseline processes:
| Process | Parameters | Values |
| ReadProcessData | ||
| ReadBioticXML | FileName1, FileName2, … | Relevant file names |
| FilterBiotic | FishStationExpr* | gear =~[‘3270’,’3271’] and |
| gearcondition < 3 and | ||
| tawlquality =~[‘1’,’3’] and | ||
| fishstationtype !=[‘2’] and | ||
| CatchExpr | species == ‘164712’ | |
| SampleExpr | N/A | |
| IndExpr | N/A | |
| DefineSweptAreaPSU | Method | Station |
| StationLengthDist | LengthDistType | NormLengthDist |
| RegroupLenghDist | LengthInverval | 5.0 |
| Catchability | CatchabilityMethod | LengthDependentSweepWidth |
| LengthDist | RegroupLengthDist | |
| ParLenfthDependentSweepWidth | SpecCat=;Alpha=5.91;Beta=0.43;LMin=15.0;LMax=62.0 | |
| RelLengthDist | LengthDist | Catchability |
| DefineStrata | UseProcessData | “ True” |
| StratumArea | AreaMethod | Accurate |
| TotalLengthDist | LengthDist | RegroupLengthDist |
| SweptAreaDensity | SweptAreaMethod | LengthDependent |
| BioticData | FilterBiotic | |
| LengthDist | TotalLengthDist | |
| DistanceMethod | FullDistance | |
| SweepwidthMethod | Predetermined | |
| MeanDensity_Stratum | Density | SweptAreaDensity |
| SampleUnitType | Stratum | |
| PolygonArea | StratumArea | |
| AbundanceByLength | Density | MeanDensity_Stratum |
| IndividualDataStations | Abundance | AbundanceByLength |
| IndividualData | IndividualDataStations | IndividualDataStations |
| SuperIndAbundance | Abundance | AbundanceByLength |
| IndividualData | IndividualData | |
| AbundWeightMethod | StationDensity | |
| LengthDist | RegroupLengthDist |
* In the period 2017-2019 this filter was changed to allow for inclusion of stations coded with StationType = C and trawlQuality = 2
Table 7. Baseline report processes:
| Process | Parameters | Values |
| FillMissingData | Superindividuals | SuperIndAbundance |
| FillVariables | ImputeByAge | |
| Seed | 1 | |
| FillWeight | Mean | |
| EstimateByPopulationCategory | Superindividuals | FillMissingData |
| Lengthinterval | 5.0 | |
| Scale | 1000 | |
| Dim1 | otolithtype | |
| Dim2 | age | |
| Dim3 | SpecCat |
Table 8. R processes:
| Process | Parameters | Values |
| runBootstrap | bootstrapMethod | AcousticTrawl |
| acousticMethod | PSU~Stratum | |
| bioticMethod | PSU~Stratum | |
| startProcess | TotalLengtDist | |
| endProcess | SuperIndAbundance | |
| nboot | 500 | |
| seed | 1 | |
| cores | 4 | |
| imputeByAge | seed | 1 |
| cores | 4 | |
| SaveRImage | “ Enabled” |
Table 9. R report processes:
| Process | Parameters | Values |
| getReports | out | all |
| options | grp1=”age”, grp2=”otolithtype” | |
| getPlots | out | all |
| options | grp1=”age”, grp2=”otolithtype” |
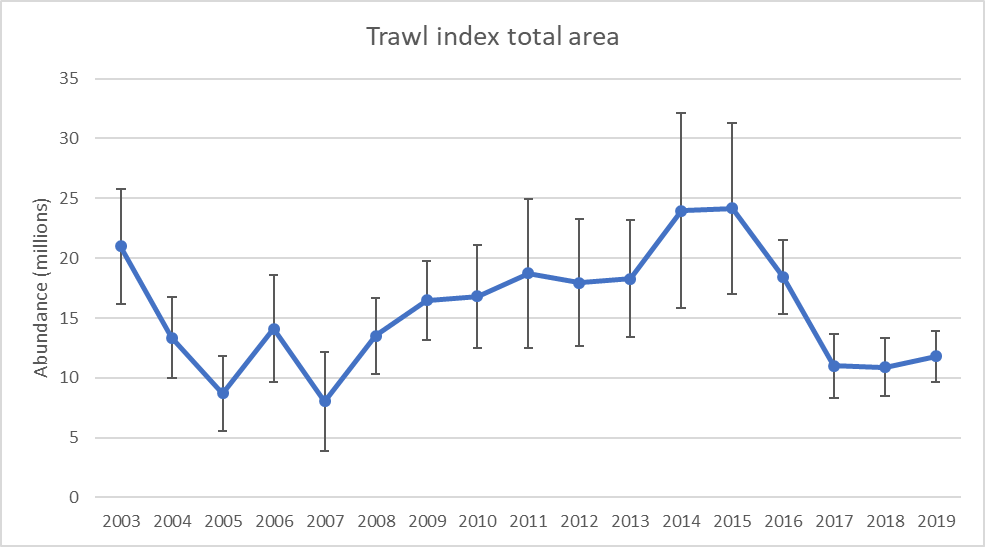
6.7 - Resulting time series
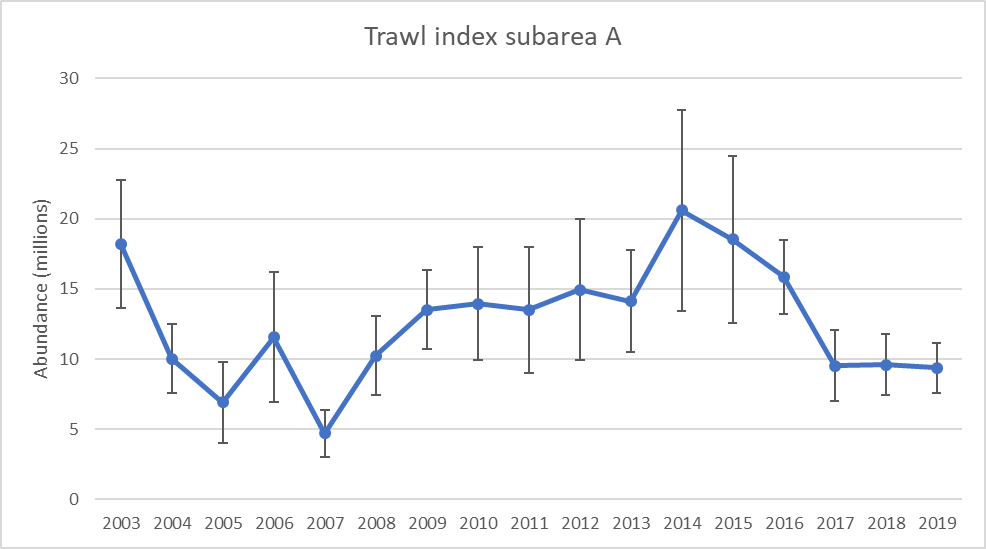
Index series for the total area (Figure 14) and for the three subareas A (Figure 15), B (Figure 16) and C (Figure 17) are shown below. The abundance indices for the total area is rather flat but one year, 1997, stands out from the rest having a three times as high index and much wider confidence limits than the rest of the years in the series.
The amount of coastal cod in subarea A (Figure 15) is much higher than in the more southern subareas B and C, and the index series in subarea A therefore resembles the total index to a high degree. While the index for subarea A (and therefore also the total area) shows peaks in 2003 and in 2014-2015, the series for subareas B and C are without conspicuous trends. The relative uncertainty is much higher for the two southern subareas than for the northern (subarea A). The uncertainty in the last four years is smaller than for the earlier part of the index series, for all subareas.
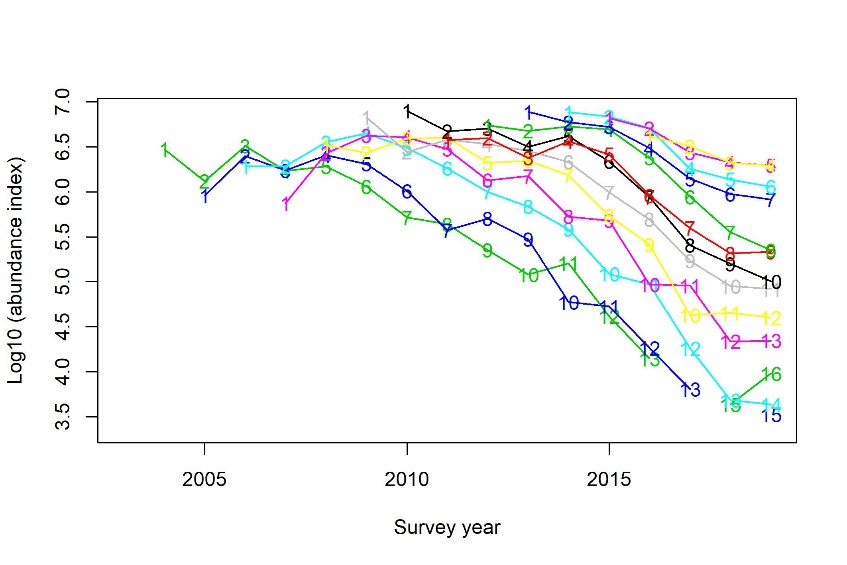
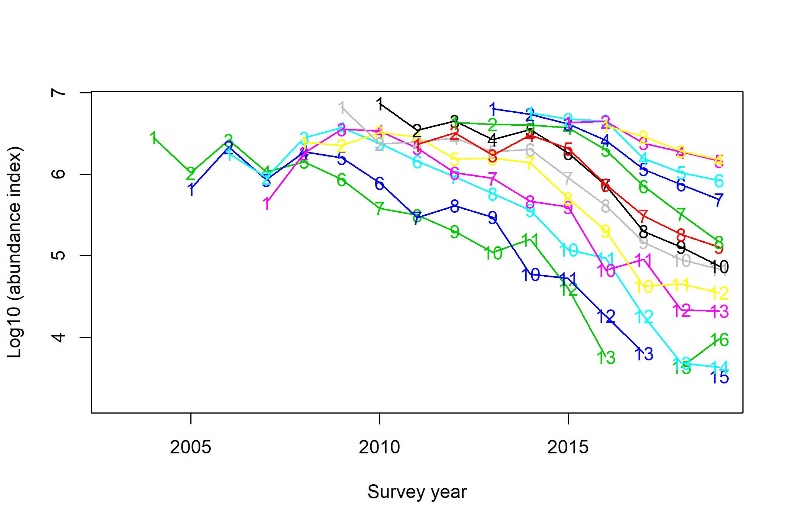
Consistency among cohorts are illustrated on Figures 18-21. The cohorts can be followed in subarea A (and in the total area) without conspicuous year effects, except in 2005 and 2007. For the two subareas B (Figure 20) and C (Figure 21) it is not possible to follow the year classes except for short periods, indicating that the indices for these subareas do not reflect the total abundance of coastal cod during the period 2002 to 2019.
6.8 - Consistency within the trawl index series for area A
The internal consistency plots (number at age n in year n plotted versus number at age n+1 in year y+1) for age groups 1-6 are shown in Figure 22 and for age groups 7-12 in Figure 23. In most cases the fit is poor.
7 - Comparison of the trawl and acoustic index series
The acoustic index series and the trawl index series give a partly independent view of the stock situation over time. They are not totally independent, since the length information used to translate the acoustic backscatter into fish abundance comes by and large from the same trawl hauls that are used for calculation of swept area indices, and the age information used to break the acoustic index down to age groups partly comes from the same trawl hauls that are used to calculate the swept area indices. However, the total backscatter, mainly determining the acoustic index, is totally independent of the catch rates in the trawl hauls, so in this respect the two series give independent information about the amount of fish. There are numerous reasons that these indices differ. Trawling on the bottom is only possible were the bottom is trawlable, that is soft and smooth and not to steep. In many areas of the coast it is not possible to trawl, and consequently the trawl hauls may not be representative of areas with hard and/or steep bottom. On the other hand, even though the acoustic method will cover all navigable waters, the acoustic backscatter signal is difficult to interpret where the bottom is steep, and in all areas the dead zone near the bottom will not be covered. Also, the allocation of acoustic backscattering by species can be challenging, and in particular in areas where it is not possible to trawl.
In Figure 24 the new acoustic index series and the swept-area series are compared, and also the landings statistics are included on the figure for comparison.
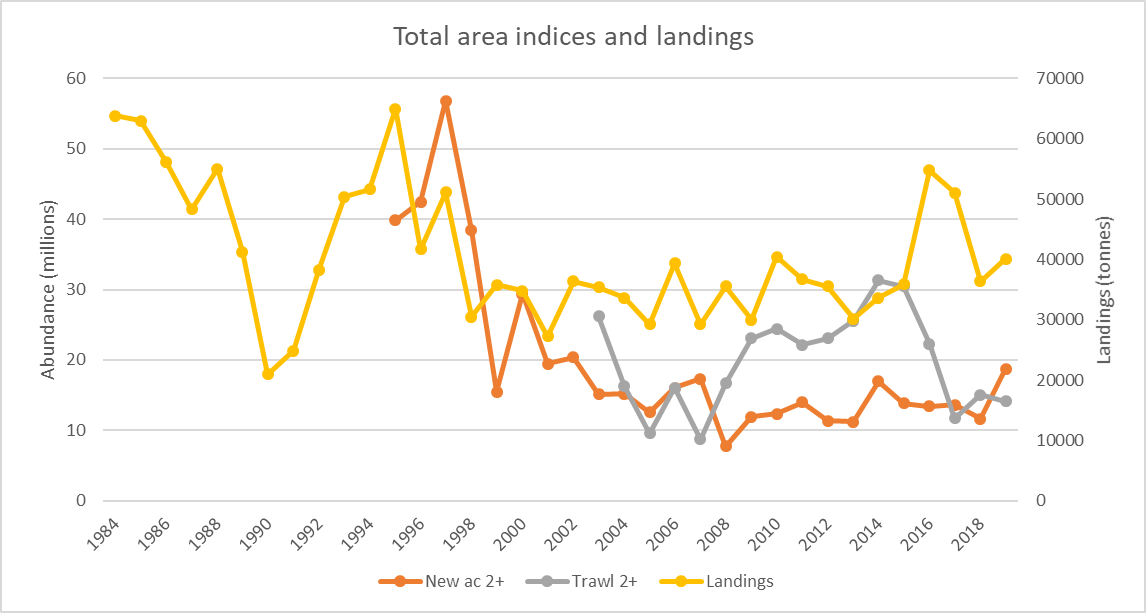
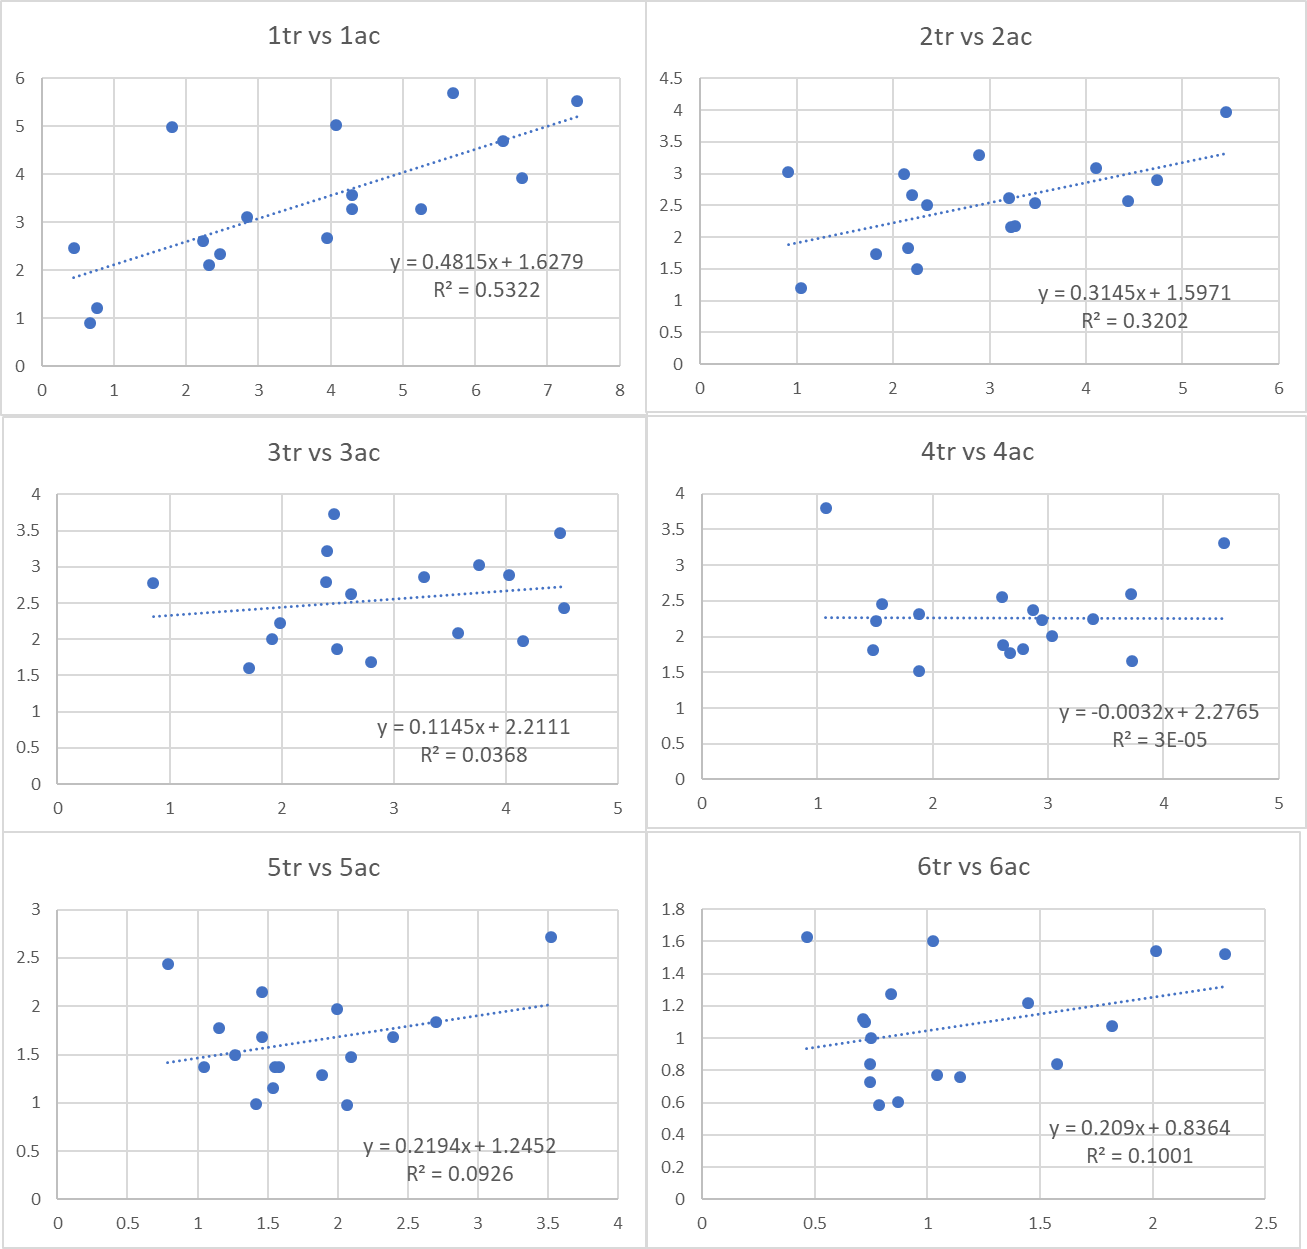
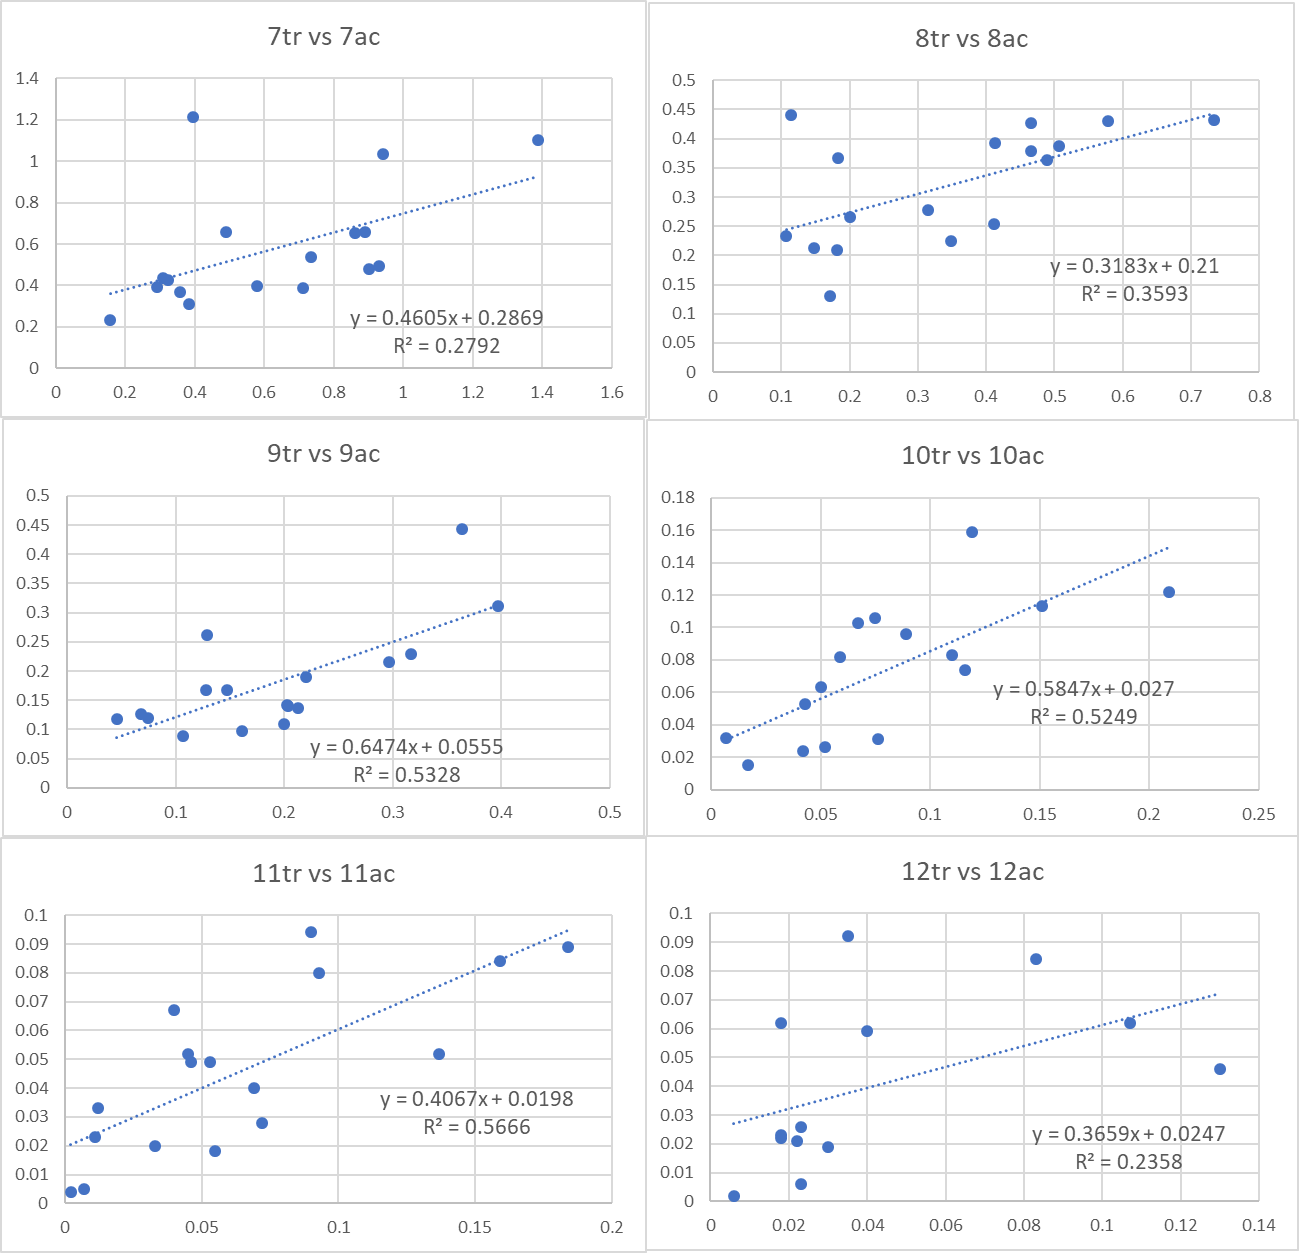
The acoustic series, going back to 1995, shows a decrease in the last part of the 1990s with a simultaneous decrease in catches during that period, from a record high catch in 1995 to a level at about half of that total during the next decades. The acoustic index and the trawl index fluctuate without clear trends after 2003, in some years the acoustic index is higher than the trawl index and vice versa. These index series are compared on age-group basis in figure 25 and 26. The consistency is quite good for many of the age groups, with r 2 in the range 0.2-0.6. However, for some age groups (mainly 3-6) the fit is poorer, with r 2 in the range 0.0-0.1.
8 - Conclusions by the data evaluation workshop regarding inclusion of these time series in the assessment of Norwegian Coastal Cod north of 62°N
Based on an evaluation of what is presented in this document concerning data quality, survey coverage, and year-to-year consistency, the data evaluation workshop held in December 2020 concluded that
-
The acoustic abundance index series from 1995 to 2019, for age groups 2-10+, may be used as input data in analytical assessment models for coastal cod in subarea A. The corresponding estimates of length- and weight-at-age may be used as estimates of length- and weight-at-age in the stock.
-
For subareas B and C, the acoustic indices for biomass of age 2+ may be used in biomass models or to assess changes in stock abundance from year to year, using methods for data-limited stocks.
-
The trawl index series from 2003 to 2019, for age groups 2-10, may be used as input data in analytical assessment models for coastal cod in subarea A. The corresponding estimates of length- and weight-at-age may be used as estimates of length- and weight-at-age in the stock.
-
For subareas B and C, the trawl indices of biomass of age 2+ may be used in biomass models or to assess changes in stock abundance from year to year, using methods for data-poor stocks.
9 - References
Aglen, A., Berg, E., Mehl, S., and Sunnanå, K. 2005. Acoustic abundance of saithe, coastal cod and juvenile herring Finnmark – Møre Autumn 2005. Toktrapport/Havforskningsinstituttet, 2005/23.
Aglen, A., Nedreaas, K., Knutsen, J. A., and Huse, G. 2020. Kysttorsk nord for 62 grader nord. Vurdering av status og forslag til forvaltningstiltak og ny gjenoppbyggingsplan. Fisken og Havet, 2020/2: 1-64.
Berg, E., and Albert, O. T. 2003. Cod in fjords and coastal waters of North Norway: distribution and variation in length and maturity at age. ICES Journal of Marine Science, 60: 787-797.
Dahle, G., Quintela, M., Johansen, T., Westgaard, J. I., Besnier, F., Aglen, A., Jorstad, K. E., et al. 2018. Analysis of coastal cod (Gadus morhua L.) sampled on spawning sites reveals a genetic gradient throughout Norway's coastline. BMC Genet, 19: 42.
Dickson, W. 1993. Estimation of the capture efficiency of trawl gear. 1:Development of a theoretical model. Fisheries Research, 16: 239-253.
ICES 2020. Arctic Fisheries Working Group (AFWG). ICES Scientific Reports., 2:52. : 577
Johannesen, E., Johnsen, E., Johansen, G. O., and Korsbrekke, K. 2019. StoX applied to cod and haddock data from the Barents Sea NOR-RUS ecosystem cruise in autumn. Swept area abundance, length and weight at age 2004-2017. Fisken og Havet, 2019-6: 1-40.
Johnsen, E., Totland, A., Skålevik, Å., Holmin, A. J., Dingsør, G. E., Fuglebakk, E., Handegard, N. O., et al. 2019. StoX: An open source software for marine survey analyses. Methods in Ecology and Evolution, 10: 1523-1528.
Mehl, S., Aglen, A., Berg, E., Dingsor, G. E., and Korsbrekke, K. 2018a. Akustisk mengdemåling av sei, kysttorsk og hhyse Finnmark-Møre hausten 2017. Toktrapport/Havforskningsinstituttet, Nr. 2–2018.
Mehl, S., Aglen, A., Johnsen, E., and Skålevik, Å. 2018b. Estimation of acoustic indices with CVs for cod and haddock in the Barents Sea winter survey 1994 – 2017 applying the Sea2Data StoX software. Fisken og Havet, 5-2018.
Mjanger, H., Svendsen, B. V., Senneset, H., Fuglebakk, E., Skage, M. L., Diaz, J., Johansen, G. O., et al. 2020. Handbook for sampling fish, crustaceans and other invertebrates. pp. 1-157. Institute of Marine Research, Bergen.
Skants, K. D. 2019. Species composition, distribution and ecology of the demersal fish community along the Norwegian coast north of Stad under varying environmental conditions. In Department of Biological Sciences - Marine Biology. University of Bergen, Norway.
Staby, A., Mehl, S., Berg, E., Aglen, A., and Korsbrekke, K. 2020. Acoustic abundance of saithe and coastal cod Finnmark – Møre Autumn 2018. Toktrapport/Havforskningsinstituttet, Nr. 5–2020.
10 - Appendix A. Acoustic abundance indices
2.1 - Total area
| Age 0 | Age 1 | Age 2 | Age 3 | Age 4 | Age 5 | Age 6 | Age 7 | Age 8 | Age 9 | Age 10 | Age 11 | Age 12 | Age 13 | Age 14 | Age 15 | Age 16 | Age 17 | |
| 1995 | 0.031 | 26.961 | 11.015 | 7.254 | 7.207 | 7.023 | 4.618 | 1.561 | 0.678 | 0.340 | 0.042 | 0.134 | ||||||
| 1996 | 22.040 | 17.763 | 10.743 | 12.628 | 6.669 | 7.434 | 3.386 | 1.269 | 0.213 | 0.034 | 0.123 | |||||||
| 1997 | 0.018 | 17.724 | 17.907 | 20.326 | 9.288 | 5.243 | 2.652 | 0.919 | 0.393 | 0.059 | 0.014 | 0.019 | ||||||
| 1998 | 1.269 | 8.713 | 10.675 | 10.731 | 9.626 | 4.238 | 1.806 | 0.951 | 0.141 | 0.123 | 0.037 | 0.009 | 0.026 | 0.026 | ||||
| 1999 | 2.562 | 3.990 | 4.112 | 3.283 | 2.794 | 0.941 | 0.214 | 0.030 | 0.067 | 0.015 | 0.005 | |||||||
| 2000 | 1.979 | 5.264 | 8.468 | 7.426 | 4.935 | 4.320 | 3.106 | 0.712 | 0.307 | 0.087 | 0.029 | 0.026 | 0.010 | |||||
| 2001 | 0.207 | 2.725 | 4.847 | 4.734 | 4.343 | 2.516 | 1.637 | 1.018 | 0.219 | 0.031 | 0.036 | 0.029 | 0.009 | 0.018 | ||||
| 2002 | 0.418 | 1.822 | 2.894 | 3.842 | 4.809 | 3.659 | 3.273 | 1.154 | 0.459 | 0.110 | 0.105 | 0.003 | 0.033 | |||||
| 2003 | 4.819 | 3.324 | 2.401 | 3.516 | 3.757 | 2.245 | 1.743 | 0.749 | 0.423 | 0.207 | 0.024 | 0.004 | 0.026 | 0.016 | ||||
| 2004 | 4.722 | 3.217 | 3.000 | 3.430 | 3.605 | 2.358 | 1.490 | 0.572 | 0.311 | 0.113 | 0.106 | 0.005 | 0.003 | |||||
| 2005 | 0.037 | 1.264 | 1.723 | 3.226 | 2.716 | 2.107 | 1.321 | 0.473 | 0.263 | 0.155 | 0.028 | 0.064 | ||||||
| 2006 | 6.705 | 5.126 | 2.126 | 3.172 | 2.692 | 1.936 | 1.847 | 1.129 | 0.177 | 0.130 | 0.012 | 0.023 | 0.004 | |||||
| 2007 | 26.051 | 2.543 | 3.567 | 3.118 | 4.005 | 2.557 | 1.703 | 1.258 | 0.456 | 0.123 | 0.026 | 0.014 | 0.005 | |||||
| 2008 | 13.880 | 2.399 | 1.815 | 1.733 | 1.573 | 1.015 | 0.763 | 0.425 | 0.230 | 0.099 | 0.026 | 0.023 | 0.025 | 0.000 | 0.000 | |||
| 2009 | 2.032 | 3.973 | 1.945 | 2.898 | 3.289 | 1.738 | 0.812 | 0.471 | 0.558 | 0.199 | 0.033 | 0.065 | 0.002 | 0.001 | 0.002 | |||
| 2010 | 1.300 | 5.701 | 2.689 | 3.141 | 2.522 | 1.978 | 0.681 | 0.364 | 0.465 | 0.248 | 0.120 | 0.052 | 0.023 | 0.006 | 0.002 | 0.004 | ||
| 2011 | 0.518 | 3.795 | 3.527 | 2.746 | 3.011 | 2.018 | 1.544 | 0.421 | 0.355 | 0.149 | 0.094 | 0.019 | 0.060 | 0.013 | ||||
| 2012 | 0.098 | 3.650 | 2.315 | 3.724 | 2.026 | 1.343 | 0.913 | 0.541 | 0.256 | 0.109 | 0.124 | 0.049 | 0.019 | 0.024 | 0.006 | 0.003 | ||
| 2013 | 0.583 | 5.142 | 3.306 | 1.857 | 1.960 | 1.510 | 0.952 | 0.695 | 0.451 | 0.216 | 0.088 | 0.089 | 0.062 | 0.004 | 0.006 | 0.002 | 0.006 | |
| 2014 | 17.884 | 6.474 | 4.500 | 3.324 | 2.337 | 3.135 | 1.714 | 1.202 | 0.698 | 0.509 | 0.098 | 0.087 | 0.082 | 0.007 | 0.007 | 0.025 | 0.013 | 0.015 |
| 2015 | 0.262 | 4.888 | 5.054 | 3.311 | 2.849 | 1.434 | 1.489 | 0.560 | 0.411 | 0.370 | 0.161 | 0.038 | 0.052 | 0.003 | 0.012 | 0.001 | ||
| 2016 | 1.276 | 2.990 | 3.913 | 4.900 | 3.053 | 2.741 | 0.961 | 0.773 | 0.530 | 0.249 | 0.132 | 0.242 | 0.041 | 0.007 | 0.013 | 0.011 | ||
| 2017 | 6.506 | 1.063 | 3.440 | 3.298 | 2.524 | 1.884 | 1.209 | 0.497 | 0.282 | 0.185 | 0.054 | 0.095 | 0.020 | 0.014 | ||||
| 2018 | 0.690 | 5.028 | 2.993 | 2.013 | 2.606 | 1.581 | 1.151 | 0.522 | 0.267 | 0.196 | 0.081 | 0.057 | 0.013 | 0.013 | 0.004 | 0.001 | ||
| 2019 | 0.925 | 3.464 | 3.443 | 4.787 | 3.112 | 3.160 | 1.942 | 1.222 | 0.317 | 0.384 | 0.158 | 0.059 | 0.094 | 0.013 | 0.003 | 0.007 | 0.005 | |
| 2020 | 0.169 | 0.498 | 1.474 | 2.583 | 2.927 | 1.873 | 0.877 | 0.563 | 0.313 | 0.176 | 0.076 | 0.051 | 0.000 | 0.005 | 0.001 |
| Age 0 | Age 1 | Age 2 | Age 3 | Age 4 | Age 5 | Age 6 | Age 7 | Age 8 | Age 9 | Age 10 | Age 11 | Age 12 | Age 13 | Age 14 | Age 15 | Age 16 | Age 17 | |
| 1995 | 1.007 | 0.165 | 0.103 | 0.063 | 0.112 | 0.125 | 0.200 | 0.163 | 0.308 | 0.477 | 0.408 | 0.221 | ||||||
| 1996 | 0.687 | 0.197 | 0.093 | 0.105 | 0.118 | 0.105 | 0.217 | 0.437 | 0.393 | 0.533 | 0.301 | |||||||
| 1997 | 0.970 | 0.228 | 0.214 | 0.134 | 0.134 | 0.127 | 0.229 | 0.218 | 0.412 | 0.903 | 0.815 | 1.060 | ||||||
| 1998 | 0.856 | 0.249 | 0.118 | 0.094 | 0.139 | 0.142 | 0.266 | 0.509 | 0.313 | 0.864 | 1.039 | 0.935 | 0.000 | 0.000 | ||||
| 1999 | 0.237 | 0.092 | 0.093 | 0.169 | 0.154 | 0.184 | 0.157 | 0.459 | 0.132 | 0.923 | 0.917 | |||||||
| 2000 | 0.877 | 0.136 | 0.145 | 0.097 | 0.076 | 0.080 | 0.094 | 0.133 | 0.244 | 0.399 | 0.393 | 0.333 | 0.903 | |||||
| 2001 | 1.052 | 0.178 | 0.294 | 0.163 | 0.139 | 0.161 | 0.163 | 0.201 | 0.286 | 0.701 | 0.689 | 0.475 | 0.745 | 0.864 | ||||
| 2002 | 0.859 | 0.162 | 0.126 | 0.136 | 0.101 | 0.088 | 0.062 | 0.149 | 0.253 | 0.704 | 0.563 | 1.070 | 0.902 | |||||
| 2003 | 0.310 | 0.262 | 0.238 | 0.122 | 0.120 | 0.113 | 0.142 | 0.160 | 0.188 | 0.245 | 0.344 | 1.032 | 1.687 | 1.009 | ||||
| 2004 | 0.185 | 0.158 | 0.135 | 0.116 | 0.086 | 0.096 | 0.130 | 0.125 | 0.175 | 0.644 | 0.238 | 0.611 | 0.808 | |||||
| 2005 | 0.915 | 0.131 | 0.159 | 0.124 | 0.067 | 0.096 | 0.130 | 0.117 | 0.265 | 0.329 | 0.326 | 0.843 | ||||||
| 2006 | 0.519 | 1.048 | 0.584 | 0.122 | 0.119 | 0.115 | 0.240 | 0.205 | 0.168 | 0.212 | 0.000 | 0.841 | 0.992 | |||||
| 2007 | 0.634 | 0.203 | 0.176 | 0.174 | 0.142 | 0.156 | 0.150 | 0.201 | 0.297 | 0.433 | 0.841 | 1.296 | 1.253 | |||||
| 2008 | 0.343 | 0.238 | 0.182 | 0.138 | 0.129 | 0.114 | 0.136 | 0.187 | 0.231 | 0.379 | 0.373 | 0.476 | 0.501 | 0.896 | 0.896 | |||
| 2009 | 1.030 | 0.213 | 0.152 | 0.106 | 0.095 | 0.134 | 0.106 | 0.154 | 0.135 | 0.234 | 0.308 | 0.205 | 0.863 | 1.097 | 0.601 | |||
| 2010 | 0.509 | 0.395 | 0.165 | 0.147 | 0.114 | 0.101 | 0.185 | 0.190 | 0.207 | 0.195 | 0.202 | 0.206 | 0.567 | 0.292 | 0.789 | 0.566 | ||
| 2011 | 0.827 | 0.125 | 0.126 | 0.110 | 0.119 | 0.108 | 0.125 | 0.252 | 0.163 | 0.192 | 0.277 | 0.517 | 0.338 | 0.866 | ||||
| 2012 | 0.596 | 0.200 | 0.185 | 0.122 | 0.128 | 0.126 | 0.098 | 0.177 | 0.162 | 0.233 | 0.179 | 0.415 | 0.465 | 0.559 | 0.572 | 0.795 | ||
| 2013 | 0.543 | 0.129 | 0.149 | 0.120 | 0.133 | 0.119 | 0.118 | 0.165 | 0.195 | 0.312 | 0.345 | 0.357 | 0.485 | 0.919 | 0.569 | 0.905 | 0.666 | |
| 2014 | 1.038 | 0.145 | 0.173 | 0.110 | 0.137 | 0.138 | 0.119 | 0.139 | 0.088 | 0.210 | 0.392 | 0.331 | 0.320 | 0.926 | 0.583 | 0.493 | 0.742 | 0.898 |
| 2015 | 0.706 | 0.151 | 0.097 | 0.089 | 0.068 | 0.086 | 0.096 | 0.142 | 0.140 | 0.130 | 0.271 | 0.360 | 0.427 | 0.804 | 0.554 | 1.010 | ||
| 2016 | 0.564 | 0.281 | 0.117 | 0.103 | 0.074 | 0.115 | 0.141 | 0.160 | 0.195 | 0.347 | 0.304 | 0.452 | 0.431 | 0.399 | 0.526 | 2.264 | ||
| 2017 | 0.635 | 0.326 | 0.151 | 0.119 | 0.151 | 0.133 | 0.166 | 0.206 | 0.257 | 0.421 | 0.246 | 0.410 | 0.522 | 0.746 | ||||
| 2018 | 0.413 | 0.175 | 0.157 | 0.155 | 0.148 | 0.143 | 0.071 | 0.173 | 0.554 | 0.141 | 0.345 | 0.428 | 0.603 | 0.503 | 0.515 | 1.528 | ||
| 2019 | 0.232 | 0.137 | 0.172 | 0.117 | 0.093 | 0.083 | 0.101 | 0.100 | 0.194 | 0.232 | 0.235 | 0.207 | 0.631 | 0.518 | 1.053 | 1.170 | 1.069 | |
| 2020 | 0.827 | 0.320 | 0.134 | 0.158 | 0.111 | 0.133 | 0.141 | 0.220 | 0.299 | 0.466 | 0.527 | 0.433 | 1.148 | 1.151 | 1.011 |
| Age 0 | Age 1 | Age 2 | Age 3 | Age 4 | Age 5 | Age 6 | Age 7 | Age 8 | Age 9 | Age 10 | Age 11 | Age 12 | Age 13 | Age 14 | Age 15 | Age 16 | Age 17 | |
| 1995 | 0.000 | 1.595 | 3.414 | 5.298 | 10.124 | 14.865 | 12.579 | 7.364 | 4.352 | 2.460 | 0.144 | 2.387 | ||||||
| 1996 | 0.151 | 0.716 | 2.459 | 9.286 | 9.228 | 14.394 | 9.253 | 5.554 | 1.402 | 0.378 | 2.020 | |||||||
| 1997 | 0.000 | 0.742 | 4.335 | 13.470 | 12.866 | 10.135 | 7.839 | 2.911 | 1.564 | 0.570 | 0.151 | 0.098 | ||||||
| 1998 | 0.012 | 0.459 | 3.533 | 9.317 | 13.530 | 9.495 | 5.873 | 4.444 | 0.832 | 0.675 | 0.587 | 0.106 | 0.525 | 0.690 | ||||
| 1999 | 0.163 | 1.110 | 3.412 | 5.253 | 5.734 | 2.634 | 0.974 | 0.225 | 0.768 | 0.033 | 0.083 | |||||||
| 2000 | 0.023 | 0.368 | 2.708 | 5.928 | 7.447 | 10.068 | 8.850 | 3.148 | 2.040 | 0.714 | 0.343 | 0.322 | 0.042 | |||||
| 2001 | 0.001 | 0.202 | 1.940 | 4.520 | 7.163 | 5.798 | 5.105 | 3.435 | 1.292 | 0.213 | 0.453 | 0.516 | 0.078 | 0.275 | ||||
| 2002 | 0.004 | 0.207 | 1.324 | 4.145 | 10.772 | 12.037 | 15.280 | 7.214 | 2.094 | 0.325 | 0.688 | 0.066 | 0.403 | |||||
| 2003 | 0.044 | 0.232 | 0.878 | 2.892 | 5.256 | 4.996 | 5.326 | 2.982 | 2.183 | 1.278 | 0.216 | 0.008 | 0.288 | 0.404 | ||||
| 2004 | 0.031 | 0.286 | 1.059 | 3.022 | 6.128 | 5.124 | 4.709 | 2.130 | 1.265 | 0.479 | 1.015 | 0.046 | 0.025 | |||||
| 2005 | 0.001 | 0.132 | 0.724 | 3.068 | 5.706 | 5.325 | 3.886 | 1.927 | 0.906 | 0.745 | 0.378 | 1.061 | ||||||
| 2006 | 0.054 | 0.386 | 0.856 | 3.191 | 4.501 | 4.455 | 6.237 | 4.401 | 0.907 | 0.909 | 0.080 | 0.566 | 0.017 | |||||
| 2007 | 0.169 | 0.263 | 1.806 | 3.331 | 7.546 | 6.659 | 5.502 | 5.810 | 2.963 | 1.387 | 0.447 | 0.038 | 0.098 | |||||
| 2008 | 0.086 | 0.236 | 0.820 | 1.990 | 3.216 | 3.378 | 2.586 | 1.968 | 1.111 | 0.416 | 0.105 | 0.272 | 0.125 | 0.003 | 0.003 | |||
| 2009 | 0.018 | 0.295 | 0.779 | 3.265 | 6.285 | 4.643 | 2.904 | 2.071 | 2.668 | 1.144 | 0.153 | 0.254 | 0.005 | 0.002 | 0.015 | |||
| 2010 | 0.013 | 0.349 | 1.378 | 3.541 | 4.856 | 5.497 | 2.401 | 1.706 | 2.643 | 1.536 | 0.755 | 0.340 | 0.188 | 0.013 | 0.022 | 0.035 | ||
| 2011 | 0.004 | 0.263 | 1.323 | 3.126 | 6.611 | 6.104 | 6.308 | 2.243 | 2.143 | 0.960 | 0.491 | 0.070 | 0.498 | 0.060 | ||||
| 2012 | 0.001 | 0.268 | 0.833 | 4.370 | 4.211 | 4.133 | 3.423 | 2.566 | 1.428 | 0.688 | 0.866 | 0.233 | 0.120 | 0.129 | 0.043 | 0.012 | ||
| 2013 | 0.007 | 0.423 | 1.246 | 1.662 | 3.477 | 4.405 | 3.267 | 2.707 | 2.361 | 1.239 | 0.363 | 0.805 | 0.768 | 0.014 | 0.049 | 0.032 | 0.090 | |
| 2014 | 0.119 | 0.515 | 1.790 | 3.802 | 4.529 | 9.257 | 6.521 | 5.706 | 3.689 | 3.017 | 0.914 | 0.638 | 0.586 | 0.031 | 0.058 | 0.251 | 0.110 | 0.366 |
| 2015 | 0.001 | 0.372 | 2.001 | 3.673 | 5.571 | 4.061 | 5.054 | 2.655 | 2.078 | 2.252 | 0.970 | 0.335 | 0.257 | 0.031 | 0.118 | 0.015 | ||
| 2016 | 0.009 | 0.219 | 1.432 | 6.363 | 6.806 | 9.072 | 3.621 | 3.389 | 3.349 | 1.915 | 0.851 | 2.480 | 0.209 | 0.032 | 0.111 | 0.095 | ||
| 2017 | 0.024 | 0.084 | 1.782 | 3.530 | 5.057 | 5.635 | 4.825 | 2.249 | 1.998 | 1.168 | 0.337 | 0.902 | 0.102 | 0.213 | ||||
| 2018 | 0.004 | 0.257 | 1.541 | 2.341 | 5.458 | 5.214 | 4.334 | 2.817 | 1.598 | 1.406 | 0.572 | 0.233 | 0.065 | 0.113 | 0.079 | 0.007 | ||
| 2019 | 0.008 | 0.230 | 1.264 | 5.626 | 6.381 | 9.351 | 7.683 | 5.747 | 1.634 | 2.419 | 1.091 | 0.477 | 1.047 | 0.127 | 0.027 | 0.082 | 0.038 | |
| 2020 | 0.001 | 0.043 | 0.800 | 3.417 | 5.736 | 6.224 | 3.032 | 3.247 | 1.916 | 1.357 | 0.469 | 0.365 | 0.001 | 0.036 | 0.013 |
| Age 0 | Age 1 | Age 2 | Age 3 | Age 4 | Age 5 | Age 6 | Age 7 | Age 8 | Age 9 | Age 10 | Age 11 | Age 12 | Age 13 | Age 14 | Age 15 | Age 16 | Age 17 | |
| 1995 | 10.32 | 18.93 | 32.17 | 42.33 | 51.98 | 59.07 | 64.26 | 77.92 | 84.99 | 87.89 | 66.98 | 121.24 | ||||||
| 1996 | 9.36 | 16.66 | 28.83 | 42.12 | 52.28 | 58.17 | 64.66 | 75.70 | 86.68 | 99.18 | 117.56 | |||||||
| 1997 | 9.01 | 16.70 | 29.27 | 40.89 | 51.93 | 58.40 | 66.89 | 68.71 | 71.67 | 102.00 | 104.42 | 83.00 | ||||||
| 1998 | 10.62 | 18.05 | 32.04 | 44.30 | 52.03 | 60.09 | 68.11 | 75.99 | 85.28 | 83.72 | 108.43 | 105.00 | 121.00 | 135.00 | ||||
| 1999 | 19.52 | 31.19 | 44.18 | 54.57 | 59.18 | 65.77 | 75.68 | 89.32 | 101.33 | 59.00 | 118.00 | |||||||
| 2000 | 10.84 | 20.08 | 32.38 | 43.35 | 53.30 | 61.11 | 64.79 | 74.55 | 84.79 | 86.55 | 107.35 | 102.13 | 79.00 | |||||
| 2001 | 8.09 | 19.99 | 33.90 | 45.84 | 55.13 | 60.77 | 65.76 | 67.88 | 81.74 | 87.23 | 107.06 | 114.32 | 99.84 | 112.68 | ||||
| 2002 | 10.48 | 22.97 | 35.07 | 47.29 | 59.65 | 67.22 | 75.42 | 81.62 | 76.42 | 67.24 | 85.16 | 115.00 | 108.00 | |||||
| 2003 | 9.71 | 19.33 | 33.45 | 43.70 | 52.16 | 60.48 | 67.16 | 72.87 | 77.01 | 80.32 | 92.80 | 61.00 | 106.31 | 143.00 | ||||
| 2004 | 8.97 | 21.12 | 33.05 | 44.22 | 54.94 | 59.29 | 67.31 | 69.99 | 71.96 | 75.38 | 92.84 | 91.32 | 89.00 | |||||
| 2005 | 11.44 | 21.97 | 34.80 | 45.10 | 57.91 | 62.71 | 64.88 | 71.87 | 71.14 | 75.26 | 106.58 | 108.92 | ||||||
| 2006 | 9.43 | 20.68 | 34.66 | 46.28 | 55.04 | 60.34 | 68.05 | 71.02 | 77.35 | 85.28 | 86.00 | 125.00 | 76.00 | |||||
| 2007 | 9.20 | 21.46 | 36.33 | 47.10 | 56.90 | 62.92 | 67.66 | 74.15 | 84.14 | 100.71 | 113.68 | 63.01 | 123.00 | |||||
| 2008 | 9.28 | 22.26 | 35.87 | 48.72 | 58.44 | 68.49 | 69.09 | 76.16 | 75.58 | 72.09 | 71.91 | 100.25 | 75.56 | 100.00 | 89.00 | |||
| 2009 | 9.74 | 19.82 | 33.65 | 47.88 | 57.25 | 64.28 | 70.03 | 75.13 | 75.49 | 81.68 | 75.17 | 69.32 | 69.00 | 73.00 | 94.94 | |||
| 2010 | 10.64 | 18.92 | 37.04 | 48.18 | 57.32 | 64.39 | 70.61 | 76.38 | 77.12 | 82.07 | 83.16 | 80.18 | 88.20 | 61.58 | 104.00 | 89.97 | ||
| 2011 | 9.48 | 20.10 | 33.60 | 48.36 | 60.20 | 66.93 | 72.32 | 78.96 | 80.93 | 81.32 | 77.59 | 74.36 | 93.14 | 75.21 | ||||
| 2012 | 9.99 | 20.36 | 33.07 | 48.67 | 59.89 | 66.59 | 72.03 | 76.90 | 80.64 | 82.81 | 85.16 | 78.35 | 84.89 | 83.28 | 90.72 | 79.00 | ||
| 2013 | 11.56 | 20.96 | 34.05 | 45.15 | 56.49 | 66.80 | 70.65 | 72.89 | 78.61 | 82.37 | 74.51 | 90.29 | 100.75 | 69.54 | 88.38 | 113.00 | 125.00 | |
| 2014 | 9.24 | 21.05 | 34.56 | 48.92 | 58.22 | 66.93 | 73.29 | 77.90 | 79.88 | 82.14 | 97.37 | 86.29 | 84.18 | 81.05 | 85.00 | 91.11 | 93.45 | 132.00 |
| 2015 | 9.65 | 20.22 | 34.23 | 48.23 | 58.38 | 66.30 | 69.47 | 77.15 | 78.70 | 82.51 | 84.53 | 88.98 | 77.69 | 95.00 | 98.15 | 101.00 | ||
| 2016 | 9.36 | 20.33 | 33.67 | 50.29 | 60.03 | 69.24 | 72.51 | 75.06 | 84.08 | 89.09 | 82.44 | 97.85 | 80.52 | 76.64 | 96.75 | 96.00 | ||
| 2017 | 8.24 | 20.34 | 37.27 | 47.73 | 59.03 | 66.82 | 73.90 | 78.31 | 86.45 | 84.19 | 84.37 | 96.94 | 83.08 | 111.43 | ||||
| 2018 | 10.04 | 16.95 | 37.38 | 48.53 | 60.08 | 69.14 | 71.48 | 81.28 | 85.20 | 86.27 | 87.52 | 75.13 | 81.27 | 93.48 | 115.46 | 93.00 | ||
| 2019 | 10.11 | 19.89 | 33.35 | 49.27 | 59.27 | 67.46 | 73.53 | 77.35 | 79.47 | 82.90 | 85.52 | 91.33 | 96.75 | 99.46 | 96.00 | 109.00 | 96.00 | |
| 2020 | 10.72 | 20.60 | 36.52 | 49.67 | 58.02 | 67.85 | 70.46 | 80.90 | 83.33 | 89.49 | 83.05 | 86.92 | 84.00 | 91.19 | 97.00 |
| Age 0 | Age 1 | Age 2 | Age 3 | Age 4 | Age 5 | Age 6 | Age 7 | Age 8 | Age 9 | Age 10 | Age 11 | Age 12 | Age 13 | Age 14 | Age 15 | Age 16 | Age 17 | |
| 1995 | 9 | 59 | 310 | 730 | 1405 | 2118 | 2754 | 4733 | 6494 | 7359 | 3297 | 17869 | ||||||
| 1996 | 8 | 41 | 229 | 736 | 1385 | 1940 | 2702 | 4269 | 6627 | 10964 | 16213 | |||||||
| 1997 | 8 | 42 | 240 | 665 | 1384 | 1932 | 2947 | 3175 | 4264 | 9600 | 11387 | 5140 | ||||||
| 1998 | 10 | 53 | 332 | 869 | 1405 | 2229 | 3251 | 4432 | 5987 | 5884 | 16233 | 12260 | 19880 | 26100 | ||||
| 1999 | 64 | 278 | 828 | 1602 | 2059 | 2811 | 4567 | 7363 | 11535 | 2190 | 18340 | |||||||
| 2000 | 12 | 70 | 320 | 798 | 1508 | 2329 | 2848 | 4424 | 6726 | 8851 | 12330 | 12873 | 4220 | |||||
| 2001 | 5 | 74 | 390 | 953 | 1648 | 2300 | 3116 | 3386 | 5983 | 7187 | 11653 | 17035 | 8460 | 15001 | ||||
| 2002 | 9 | 114 | 460 | 1077 | 2248 | 3295 | 4674 | 6289 | 4656 | 3785 | 7783 | 21980 | 12350 | |||||
| 2003 | 9 | 68 | 366 | 821 | 1397 | 2225 | 3056 | 3965 | 5110 | 6049 | 8878 | 2030 | 12562 | 25600 | ||||
| 2004 | 7 | 89 | 353 | 883 | 1702 | 2175 | 3158 | 3735 | 4004 | 4500 | 9936 | 9078 | 7130 | |||||
| 2005 | 16 | 105 | 419 | 954 | 2103 | 2529 | 2952 | 4081 | 3466 | 4745 | 14164 | 15482 | ||||||
| 2006 | 8 | 84 | 424 | 1006 | 1673 | 2305 | 3380 | 3944 | 5151 | 6931 | 6530 | 25080 | 4220 | |||||
| 2007 | 7 | 103 | 508 | 1069 | 1889 | 2612 | 3238 | 4638 | 6497 | 11158 | 15891 | 2981 | 21100 | |||||
| 2008 | 6 | 100 | 453 | 1148 | 2046 | 3321 | 3392 | 4648 | 4869 | 4344 | 4077 | 10683 | 4730 | 9250 | 8520 | |||
| 2009 | 10 | 75 | 401 | 1127 | 1911 | 2668 | 3569 | 4374 | 4764 | 5720 | 4819 | 3817 | 3084 | 3122 | 9672 | |||
| 2010 | 10 | 64 | 507 | 1127 | 1927 | 2782 | 3545 | 4693 | 5714 | 6198 | 6336 | 6547 | 7962 | 2062 | 12154 | 7475 | ||
| 2011 | 8 | 69 | 374 | 1136 | 2195 | 3020 | 4096 | 5365 | 6040 | 6395 | 5275 | 3933 | 8509 | 4558 | ||||
| 2012 | 8 | 74 | 359 | 1170 | 2084 | 3086 | 3748 | 4717 | 5530 | 6291 | 7000 | 5018 | 7205 | 6444 | 7052 | 4630 | ||
| 2013 | 12 | 83 | 377 | 893 | 1773 | 2915 | 3432 | 3911 | 5284 | 5662 | 4216 | 8854 | 12081 | 4092 | 7780 | 16220 | 16300 | |
| 2014 | 7 | 80 | 399 | 1142 | 1935 | 2951 | 3804 | 4750 | 5282 | 5933 | 8898 | 7135 | 7062 | 4752 | 7920 | 9591 | 8282 | 24950 |
| 2015 | 8 | 76 | 395 | 1109 | 1956 | 2832 | 3397 | 4764 | 5073 | 6059 | 6231 | 8733 | 5427 | 10170 | 9930 | 11240 | ||
| 2016 | 7 | 74 | 367 | 1295 | 2230 | 3307 | 3777 | 4399 | 6283 | 7696 | 6307 | 10446 | 5020 | 4413 | 9411 | 8325 | ||
| 2017 | 4 | 83 | 519 | 1073 | 2006 | 2984 | 3990 | 4515 | 7030 | 6363 | 6225 | 9634 | 5089 | 14019 | ||||
| 2018 | 5 | 52 | 512 | 1169 | 2099 | 3305 | 3771 | 5424 | 5961 | 7088 | 7024 | 4283 | 5345 | 9367 | 15761 | 7350 | ||
| 2019 | 9 | 67 | 367 | 1176 | 2049 | 2959 | 3958 | 4696 | 5085 | 6396 | 6804 | 8025 | 10306 | 9786 | 9585 | 12345 | 7040 | |
| 2020 | 8 | 91 | 538 | 1313 | 1958 | 3318 | 3457 | 5706 | 6190 | 7737 | 6667 | 7430 | 5165 | 7911 | 9765 |
| Index_2plus | SD_2plus | CV_2plus | |
| 1995 | 40.034 | 2.670 | 0.067 |
| 1996 | 42.500 | 2.417 | 0.057 |
| 1997 | 56.823 | 5.676 | 0.100 |
| 1998 | 38.388 | 2.848 | 0.074 |
| 1999 | 15.451 | 1.184 | 0.077 |
| 2000 | 29.426 | 2.112 | 0.072 |
| 2001 | 19.437 | 2.667 | 0.137 |
| 2002 | 20.341 | 1.462 | 0.072 |
| 2003 | 15.111 | 1.527 | 0.101 |
| 2004 | 14.994 | 1.001 | 0.067 |
| 2005 | 12.075 | 0.766 | 0.063 |
| 2006 | 13.247 | 1.345 | 0.101 |
| 2007 | 16.833 | 1.429 | 0.085 |
| 2008 | 7.728 | 0.770 | 0.100 |
| 2009 | 12.012 | 0.886 | 0.074 |
| 2010 | 12.295 | 0.910 | 0.074 |
| 2011 | 13.958 | 0.921 | 0.066 |
| 2012 | 11.452 | 0.939 | 0.082 |
| 2013 | 11.204 | 0.992 | 0.089 |
| 2014 | 17.758 | 1.520 | 0.086 |
| 2015 | 15.744 | 0.858 | 0.054 |
| 2016 | 17.567 | 0.860 | 0.049 |
| 2017 | 13.501 | 1.118 | 0.083 |
| 2018 | 11.498 | 1.015 | 0.088 |
| 2019 | 18.706 | 1.279 | 0.068 |
| 2020 | 10.920 | 0.780 | 0.071 |
2.2 - Subarea A: North of 67°N
| Age 0 | Age 1 | Age 2 | Age 3 | Age 4 | Age 5 | Age 6 | Age 7 | Age 8 | Age 9 | Age 10 | Age 11 | Age 12 | Age 13 | Age 14 | Age 15 | Age 16 | Age 17 | |
| 1995 | 0.031 | 26.495 | 8.774 | 4.974 | 6.382 | 6.440 | 4.373 | 1.309 | 0.532 | 0.319 | 0.041 | 0.090 | ||||||
| 1996 | 21.458 | 17.580 | 9.025 | 8.592 | 4.576 | 5.306 | 2.723 | 1.022 | 0.213 | 0.032 | 0.024 | |||||||
| 1997 | 0.018 | 16.567 | 15.358 | 16.930 | 7.710 | 4.484 | 2.316 | 0.716 | 0.328 | 0.059 | 0.014 | 0.019 | ||||||
| 1998 | 1.260 | 8.360 | 6.757 | 8.524 | 8.261 | 3.717 | 1.530 | 0.700 | 0.102 | 0.122 | 0.037 | 0.009 | 0.000 | 0.000 | ||||
| 1999 | 2.494 | 3.486 | 3.387 | 2.788 | 2.498 | 0.751 | 0.172 | 0.030 | 0.022 | 0.015 | 0.005 | |||||||
| 2000 | 1.979 | 5.028 | 7.439 | 5.831 | 3.939 | 3.853 | 2.825 | 0.622 | 0.258 | 0.071 | 0.013 | 0.010 | 0.010 | |||||
| 2001 | 0.207 | 2.711 | 4.551 | 4.246 | 3.776 | 2.184 | 1.499 | 0.974 | 0.149 | 0.029 | 0.036 | 0.029 | 0.009 | 0.018 | ||||
| 2002 | 0.418 | 1.188 | 2.071 | 2.532 | 2.926 | 2.075 | 0.970 | 0.596 | 0.293 | 0.106 | 0.089 | 0.003 | 0.033 | |||||
| 2003 | 4.798 | 3.276 | 2.168 | 3.026 | 3.303 | 1.838 | 1.519 | 0.651 | 0.364 | 0.190 | 0.024 | 0.003 | 0.026 | 0.016 | ||||
| 2004 | 4.431 | 3.046 | 2.643 | 2.819 | 2.589 | 1.686 | 1.094 | 0.371 | 0.213 | 0.104 | 0.064 | 0.005 | 0.003 | |||||
| 2005 | 0.019 | 0.904 | 1.201 | 2.228 | 1.816 | 1.490 | 0.843 | 0.234 | 0.233 | 0.127 | 0.015 | 0.064 | ||||||
| 2006 | 6.231 | 4.981 | 1.836 | 2.587 | 2.210 | 1.453 | 1.612 | 1.046 | 0.130 | 0.089 | 0.000 | 0.023 | 0.004 | |||||
| 2007 | 26.051 | 2.458 | 3.037 | 2.778 | 3.794 | 2.437 | 1.632 | 1.215 | 0.441 | 0.120 | 0.023 | 0.014 | 0.005 | |||||
| 2008 | 13.853 | 2.344 | 1.739 | 1.684 | 1.511 | 0.985 | 0.761 | 0.399 | 0.225 | 0.097 | 0.026 | 0.023 | 0.024 | 0.000 | 0.000 | |||
| 2009 | 1.804 | 3.907 | 1.502 | 2.084 | 2.596 | 1.373 | 0.605 | 0.386 | 0.378 | 0.140 | 0.031 | 0.029 | 0.002 | 0.001 | 0.002 | |||
| 2010 | 1.170 | 5.509 | 2.503 | 2.853 | 2.240 | 1.679 | 0.583 | 0.309 | 0.432 | 0.229 | 0.113 | 0.052 | 0.023 | 0.002 | 0.002 | 0.004 | ||
| 2011 | 0.363 | 2.104 | 2.542 | 1.869 | 2.372 | 1.469 | 1.215 | 0.394 | 0.278 | 0.137 | 0.074 | 0.018 | 0.046 | 0.013 | ||||
| 2012 | 0.098 | 3.561 | 2.170 | 3.546 | 1.832 | 1.154 | 0.791 | 0.503 | 0.254 | 0.107 | 0.124 | 0.049 | 0.019 | 0.024 | 0.006 | 0.003 | ||
| 2013 | 0.421 | 4.694 | 3.084 | 1.597 | 1.770 | 1.287 | 0.838 | 0.657 | 0.430 | 0.216 | 0.083 | 0.089 | 0.062 | 0.004 | 0.006 | 0.002 | 0.006 | |
| 2014 | 16.680 | 6.030 | 4.171 | 3.066 | 2.137 | 2.904 | 1.609 | 1.151 | 0.429 | 0.462 | 0.089 | 0.087 | 0.082 | 0.007 | 0.007 | 0.025 | 0.013 | 0.015 |
| 2015 | 0.262 | 3.421 | 3.122 | 2.465 | 1.802 | 1.017 | 1.128 | 0.477 | 0.363 | 0.303 | 0.158 | 0.038 | 0.052 | 0.003 | 0.012 | 0.001 | ||
| 2016 | 1.272 | 2.921 | 3.341 | 3.667 | 2.349 | 2.308 | 0.841 | 0.669 | 0.452 | 0.222 | 0.115 | 0.123 | 0.041 | 0.004 | 0.013 | 0.011 | ||
| 2017 | 6.506 | 1.018 | 3.289 | 3.202 | 2.335 | 1.764 | 1.122 | 0.450 | 0.256 | 0.181 | 0.054 | 0.095 | 0.020 | 0.014 | ||||
| 2018 | 0.680 | 4.977 | 2.847 | 1.837 | 2.376 | 1.246 | 0.946 | 0.494 | 0.246 | 0.136 | 0.081 | 0.057 | 0.013 | 0.013 | 0.004 | 0.001 | ||
| 2019 | 0.305 | 2.607 | 2.992 | 3.724 | 2.221 | 2.149 | 1.272 | 0.656 | 0.212 | 0.262 | 0.106 | 0.040 | 0.092 | 0.013 | 0.003 | 0.007 | 0.005 | |
| 2020 | 0.162 | 0.475 | 1.039 | 1.743 | 2.204 | 1.329 | 0.674 | 0.363 | 0.246 | 0.074 | 0.075 | 0.047 | 0.000 | 0.004 | 0.001 |
| Age 0 | Age 1 | Age 2 | Age 3 | Age 4 | Age 5 | Age 6 | Age 7 | Age 8 | Age 9 | Age 10 | Age 11 | Age 12 | Age 13 | Age 14 | Age 15 | Age 16 | Age 17 | |
| 1995 | 1.007 | 0.168 | 0.130 | 0.090 | 0.124 | 0.136 | 0.211 | 0.194 | 0.395 | 0.505 | 0.412 | 0.328 | ||||||
| 1996 | 0.700 | 0.198 | 0.111 | 0.154 | 0.168 | 0.141 | 0.259 | 0.538 | 0.394 | 0.516 | 1.565 | |||||||
| 1997 | 0.970 | 0.239 | 0.246 | 0.160 | 0.156 | 0.142 | 0.250 | 0.259 | 0.470 | 0.903 | 0.815 | 1.060 | ||||||
| 1998 | 0.860 | 0.259 | 0.186 | 0.117 | 0.161 | 0.161 | 0.311 | 0.690 | 0.401 | 0.867 | 1.039 | 0.935 | ||||||
| 1999 | 0.243 | 0.105 | 0.114 | 0.198 | 0.173 | 0.229 | 0.193 | 0.472 | 0.402 | 0.923 | 0.917 | |||||||
| 2000 | 0.877 | 0.143 | 0.164 | 0.124 | 0.095 | 0.090 | 0.103 | 0.151 | 0.291 | 0.489 | 0.894 | 0.901 | 0.903 | |||||
| 2001 | 1.052 | 0.179 | 0.313 | 0.182 | 0.159 | 0.186 | 0.176 | 0.209 | 0.406 | 0.719 | 0.689 | 0.475 | 0.745 | 0.864 | ||||
| 2002 | 0.859 | 0.248 | 0.174 | 0.205 | 0.160 | 0.136 | 0.147 | 0.228 | 0.363 | 0.723 | 0.665 | 1.070 | 0.902 | |||||
| 2003 | 0.311 | 0.266 | 0.263 | 0.140 | 0.137 | 0.137 | 0.161 | 0.182 | 0.218 | 0.262 | 0.346 | 0.694 | 1.687 | 1.009 | ||||
| 2004 | 0.196 | 0.166 | 0.153 | 0.141 | 0.118 | 0.127 | 0.171 | 0.172 | 0.253 | 0.694 | 0.330 | 0.611 | 0.808 | |||||
| 2005 | 0.774 | 0.181 | 0.228 | 0.177 | 0.099 | 0.136 | 0.204 | 0.228 | 0.298 | 0.400 | 0.606 | 0.843 | ||||||
| 2006 | 0.559 | 1.079 | 0.677 | 0.149 | 0.145 | 0.153 | 0.275 | 0.221 | 0.228 | 0.311 | 0.841 | 0.992 | ||||||
| 2007 | 0.634 | 0.209 | 0.201 | 0.194 | 0.149 | 0.163 | 0.156 | 0.207 | 0.307 | 0.446 | 0.969 | 1.296 | 1.253 | |||||
| 2008 | 0.343 | 0.244 | 0.189 | 0.142 | 0.134 | 0.118 | 0.136 | 0.198 | 0.236 | 0.386 | 0.373 | 0.481 | 0.521 | 0.896 | 0.896 | |||
| 2009 | 1.160 | 0.217 | 0.197 | 0.146 | 0.118 | 0.168 | 0.139 | 0.183 | 0.192 | 0.314 | 0.246 | 0.442 | 0.863 | 1.097 | 0.601 | |||
| 2010 | 0.563 | 0.408 | 0.177 | 0.162 | 0.128 | 0.119 | 0.216 | 0.223 | 0.223 | 0.210 | 0.215 | 0.207 | 0.567 | 1.171 | 0.789 | 0.566 | ||
| 2011 | 1.075 | 0.218 | 0.170 | 0.159 | 0.146 | 0.147 | 0.155 | 0.268 | 0.205 | 0.195 | 0.347 | 0.510 | 0.443 | 0.866 | ||||
| 2012 | 0.598 | 0.205 | 0.197 | 0.129 | 0.141 | 0.147 | 0.113 | 0.190 | 0.163 | 0.238 | 0.179 | 0.415 | 0.465 | 0.559 | 0.572 | 0.795 | ||
| 2013 | 0.681 | 0.140 | 0.160 | 0.140 | 0.147 | 0.139 | 0.134 | 0.174 | 0.204 | 0.312 | 0.365 | 0.357 | 0.485 | 0.919 | 0.569 | 0.905 | 0.666 | |
| 2014 | 1.112 | 0.155 | 0.186 | 0.119 | 0.150 | 0.149 | 0.127 | 0.146 | 0.143 | 0.231 | 0.433 | 0.331 | 0.320 | 0.926 | 0.583 | 0.493 | 0.742 | 0.898 |
| 2015 | 0.706 | 0.211 | 0.157 | 0.114 | 0.100 | 0.118 | 0.121 | 0.160 | 0.157 | 0.163 | 0.267 | 0.360 | 0.424 | 0.804 | 0.554 | 1.010 | ||
| 2016 | 0.565 | 0.290 | 0.152 | 0.096 | 0.078 | 0.105 | 0.162 | 0.169 | 0.208 | 0.390 | 0.313 | 0.225 | 0.431 | 0.647 | 0.526 | 2.264 | ||
| 2017 | 0.635 | 0.341 | 0.158 | 0.123 | 0.163 | 0.142 | 0.179 | 0.227 | 0.282 | 0.432 | 0.246 | 0.410 | 0.522 | 0.746 | ||||
| 2018 | 0.420 | 0.177 | 0.165 | 0.171 | 0.162 | 0.180 | 0.087 | 0.184 | 0.604 | 0.204 | 0.345 | 0.428 | 0.603 | 0.503 | 0.515 | 1.528 | ||
| 2019 | 0.679 | 0.180 | 0.198 | 0.147 | 0.127 | 0.120 | 0.151 | 0.176 | 0.283 | 0.333 | 0.348 | 0.275 | 0.636 | 0.518 | 1.053 | 1.170 | 1.069 | |
| 2020 | 0.833 | 0.326 | 0.141 | 0.148 | 0.133 | 0.137 | 0.157 | 0.224 | 0.313 | 0.472 | 0.526 | 0.419 | 1.148 | 0.817 | 1.011 |
| Age 0 | Age 1 | Age 2 | Age 3 | Age 4 | Age 5 | Age 6 | Age 7 | Age 8 | Age 9 | Age 10 | Age 11 | Age 12 | Age 13 | Age 14 | Age 15 | Age 16 | Age 17 | |
| 1995 | 0.000 | 1.541 | 2.472 | 3.574 | 8.904 | 13.457 | 11.950 | 6.114 | 3.126 | 2.269 | 0.143 | 1.576 | ||||||
| 1996 | 0.146 | 0.709 | 1.947 | 5.779 | 6.165 | 10.249 | 7.685 | 4.485 | 1.401 | 0.368 | 0.474 | |||||||
| 1997 | 0.000 | 0.677 | 3.790 | 11.041 | 10.756 | 8.589 | 6.793 | 2.140 | 1.152 | 0.570 | 0.151 | 0.098 | ||||||
| 1998 | 0.012 | 0.410 | 1.751 | 7.160 | 11.622 | 8.458 | 4.866 | 3.312 | 0.527 | 0.674 | 0.587 | 0.106 | 0.000 | 0.000 | ||||
| 1999 | 0.155 | 0.947 | 2.695 | 4.204 | 4.894 | 2.062 | 0.733 | 0.217 | 0.144 | 0.033 | 0.083 | |||||||
| 2000 | 0.023 | 0.347 | 2.398 | 4.816 | 6.154 | 9.109 | 7.947 | 2.654 | 1.529 | 0.406 | 0.111 | 0.088 | 0.042 | |||||
| 2001 | 0.001 | 0.199 | 1.778 | 3.973 | 6.276 | 5.075 | 4.503 | 3.240 | 0.679 | 0.205 | 0.453 | 0.516 | 0.078 | 0.275 | ||||
| 2002 | 0.004 | 0.105 | 0.737 | 2.351 | 4.653 | 4.935 | 3.358 | 2.646 | 1.109 | 0.289 | 0.553 | 0.066 | 0.403 | |||||
| 2003 | 0.044 | 0.228 | 0.783 | 2.488 | 4.716 | 4.167 | 4.746 | 2.687 | 2.016 | 1.232 | 0.216 | 0.006 | 0.288 | 0.404 | ||||
| 2004 | 0.029 | 0.269 | 0.896 | 2.463 | 4.253 | 3.623 | 3.504 | 1.407 | 1.012 | 0.418 | 0.320 | 0.046 | 0.025 | |||||
| 2005 | 0.000 | 0.089 | 0.526 | 1.947 | 3.135 | 3.291 | 2.133 | 0.860 | 0.813 | 0.706 | 0.129 | 1.061 | ||||||
| 2006 | 0.050 | 0.368 | 0.695 | 2.558 | 3.643 | 3.235 | 5.626 | 4.119 | 0.575 | 0.714 | 0.000 | 0.566 | 0.017 | |||||
| 2007 | 0.169 | 0.239 | 1.469 | 2.959 | 7.057 | 6.266 | 5.159 | 5.471 | 2.811 | 1.347 | 0.400 | 0.038 | 0.098 | |||||
| 2008 | 0.086 | 0.225 | 0.742 | 1.869 | 2.978 | 3.285 | 2.581 | 1.807 | 1.097 | 0.402 | 0.105 | 0.272 | 0.123 | 0.003 | 0.003 | |||
| 2009 | 0.014 | 0.288 | 0.537 | 2.152 | 4.877 | 3.708 | 2.308 | 1.786 | 1.960 | 0.763 | 0.150 | 0.164 | 0.005 | 0.002 | 0.015 | |||
| 2010 | 0.013 | 0.329 | 1.270 | 3.110 | 4.191 | 4.605 | 2.075 | 1.445 | 2.195 | 1.434 | 0.723 | 0.340 | 0.188 | 0.004 | 0.022 | 0.035 | ||
| 2011 | 0.003 | 0.125 | 1.024 | 2.183 | 5.403 | 4.579 | 4.488 | 2.024 | 1.561 | 0.855 | 0.388 | 0.067 | 0.360 | 0.060 | ||||
| 2012 | 0.001 | 0.259 | 0.774 | 4.060 | 3.700 | 3.344 | 2.920 | 2.374 | 1.422 | 0.657 | 0.866 | 0.233 | 0.120 | 0.129 | 0.043 | 0.012 | ||
| 2013 | 0.005 | 0.399 | 1.184 | 1.469 | 3.215 | 3.913 | 2.883 | 2.593 | 2.101 | 1.239 | 0.350 | 0.805 | 0.768 | 0.014 | 0.049 | 0.032 | 0.090 | |
| 2014 | 0.107 | 0.480 | 1.497 | 3.446 | 4.057 | 8.515 | 5.938 | 5.346 | 2.390 | 2.572 | 0.845 | 0.638 | 0.586 | 0.031 | 0.058 | 0.251 | 0.110 | 0.366 |
| 2015 | 0.001 | 0.252 | 1.275 | 2.748 | 3.860 | 3.036 | 4.249 | 2.297 | 1.916 | 1.795 | 0.962 | 0.335 | 0.254 | 0.031 | 0.118 | 0.015 | ||
| 2016 | 0.009 | 0.213 | 1.151 | 4.034 | 4.465 | 7.685 | 3.293 | 3.123 | 2.677 | 1.632 | 0.793 | 1.262 | 0.209 | 0.019 | 0.111 | 0.095 | ||
| 2017 | 0.024 | 0.080 | 1.655 | 3.379 | 4.591 | 5.205 | 4.488 | 2.104 | 1.811 | 1.131 | 0.337 | 0.902 | 0.102 | 0.213 | ||||
| 2018 | 0.004 | 0.255 | 1.494 | 2.026 | 4.962 | 3.986 | 3.552 | 2.648 | 1.448 | 1.163 | 0.572 | 0.233 | 0.065 | 0.113 | 0.079 | 0.007 | ||
| 2019 | 0.002 | 0.163 | 1.112 | 4.212 | 4.414 | 6.413 | 4.854 | 3.382 | 1.272 | 1.623 | 0.840 | 0.392 | 1.042 | 0.127 | 0.027 | 0.082 | 0.038 | |
| 2020 | 0.001 | 0.041 | 0.384 | 1.749 | 4.414 | 3.853 | 2.271 | 1.786 | 1.643 | 0.652 | 0.466 | 0.342 | 0.001 | 0.029 | 0.013 |
| Age 0 | Age 1 | Age 2 | Age 3 | Age 4 | Age 5 | Age 6 | Age 7 | Age 8 | Age 9 | Age 10 | Age 11 | Age 12 | Age 13 | Age 14 | Age 15 | Age 16 | Age 17 | |
| 1995 | 10.32 | 18.86 | 31.39 | 42.05 | 51.83 | 58.77 | 64.27 | 77.55 | 82.36 | 87.08 | 67.02 | 123.50 | ||||||
| 1996 | 9.35 | 16.68 | 28.32 | 41.25 | 51.87 | 58.06 | 65.16 | 74.80 | 86.75 | 99.57 | 115.00 | |||||||
| 1997 | 9.01 | 16.61 | 29.56 | 40.75 | 51.99 | 58.11 | 66.89 | 66.80 | 68.62 | 102.00 | 104.42 | 83.00 | ||||||
| 1998 | 10.62 | 17.76 | 30.26 | 44.04 | 51.99 | 60.31 | 67.81 | 74.93 | 82.22 | 83.81 | 108.43 | 105.00 | ||||||
| 1999 | 19.41 | 31.17 | 44.06 | 54.06 | 58.69 | 65.44 | 74.00 | 88.95 | 88.21 | 59.00 | 118.00 | |||||||
| 2000 | 10.84 | 20.01 | 32.55 | 43.97 | 53.96 | 61.39 | 64.53 | 73.81 | 81.94 | 80.31 | 95.00 | 95.83 | 79.00 | |||||
| 2001 | 8.09 | 19.97 | 33.70 | 45.70 | 55.37 | 61.09 | 65.17 | 67.64 | 76.07 | 87.23 | 107.08 | 114.32 | 99.84 | 112.68 | ||||
| 2002 | 10.48 | 21.64 | 32.65 | 45.02 | 54.46 | 62.01 | 68.83 | 72.35 | 70.52 | 66.73 | 85.06 | 115.00 | 108.00 | |||||
| 2003 | 9.71 | 19.30 | 33.32 | 43.76 | 52.60 | 60.94 | 67.73 | 73.67 | 78.79 | 81.86 | 92.81 | 61.00 | 106.31 | 143.00 | ||||
| 2004 | 8.96 | 21.11 | 32.71 | 44.03 | 54.46 | 59.25 | 67.72 | 70.52 | 75.47 | 74.17 | 78.15 | 91.32 | 89.00 | |||||
| 2005 | 10.83 | 21.55 | 35.73 | 44.69 | 55.45 | 60.55 | 62.61 | 71.42 | 71.73 | 80.28 | 93.20 | 108.92 | ||||||
| 2006 | 9.36 | 20.55 | 34.08 | 46.19 | 54.99 | 59.98 | 68.76 | 71.39 | 74.57 | 89.02 | 125.00 | 76.00 | ||||||
| 2007 | 9.20 | 21.18 | 35.90 | 47.15 | 56.79 | 62.73 | 67.32 | 73.73 | 83.42 | 100.54 | 116.00 | 63.01 | 123.00 | |||||
| 2008 | 9.28 | 22.14 | 35.38 | 48.30 | 57.91 | 68.55 | 69.09 | 75.83 | 75.85 | 71.71 | 71.91 | 100.50 | 76.19 | 100.00 | 89.00 | |||
| 2009 | 9.31 | 19.77 | 32.91 | 46.75 | 57.08 | 64.72 | 71.36 | 76.56 | 76.92 | 81.20 | 75.56 | 77.44 | 69.00 | 73.00 | 94.94 | |||
| 2010 | 10.95 | 18.85 | 36.94 | 47.84 | 56.92 | 64.14 | 71.22 | 76.43 | 75.46 | 82.06 | 83.12 | 80.25 | 88.20 | 60.00 | 104.00 | 89.97 | ||
| 2011 | 9.48 | 19.13 | 34.62 | 48.69 | 61.02 | 67.55 | 71.22 | 78.14 | 80.80 | 80.53 | 78.30 | 74.68 | 91.37 | 75.21 | ||||
| 2012 | 9.99 | 20.30 | 32.93 | 48.26 | 59.32 | 65.46 | 71.40 | 76.44 | 80.72 | 82.21 | 85.18 | 78.35 | 84.89 | 83.28 | 90.72 | 79.00 | ||
| 2013 | 11.52 | 21.22 | 34.28 | 45.56 | 56.92 | 67.73 | 70.94 | 73.28 | 77.28 | 82.37 | 75.33 | 90.29 | 100.75 | 69.54 | 88.38 | 113.00 | 125.00 | |
| 2014 | 9.12 | 21.05 | 33.75 | 48.79 | 57.97 | 66.89 | 72.83 | 77.47 | 81.67 | 80.79 | 97.65 | 86.29 | 84.20 | 81.05 | 85.00 | 91.11 | 93.45 | 132.00 |
| 2015 | 9.65 | 19.89 | 34.64 | 48.32 | 60.32 | 67.78 | 72.64 | 77.88 | 79.92 | 82.17 | 84.77 | 88.98 | 77.76 | 95.00 | 98.15 | 101.00 | ||
| 2016 | 9.36 | 20.29 | 33.09 | 48.16 | 58.03 | 69.50 | 73.48 | 76.86 | 82.46 | 87.50 | 83.78 | 92.38 | 80.52 | 81.82 | 96.75 | 96.00 | ||
| 2017 | 8.24 | 20.30 | 36.98 | 47.56 | 58.69 | 66.70 | 73.97 | 79.48 | 85.96 | 83.97 | 84.37 | 96.94 | 83.08 | 111.43 | ||||
| 2018 | 10.03 | 16.97 | 37.62 | 48.03 | 60.12 | 68.65 | 71.49 | 81.07 | 84.73 | 92.15 | 87.52 | 75.13 | 81.27 | 93.48 | 115.46 | 93.00 | ||
| 2019 | 9.51 | 19.64 | 33.67 | 49.05 | 59.01 | 68.22 | 73.51 | 80.38 | 84.43 | 84.10 | 91.63 | 97.77 | 97.12 | 99.46 | 96.00 | 109.00 | 96.00 | |
| 2020 | 10.70 | 20.47 | 33.36 | 46.64 | 58.76 | 65.99 | 70.57 | 77.97 | 85.63 | 90.86 | 83.04 | 87.25 | 84.00 | 91.43 | 97.00 |
| Age 0 | Age 1 | Age 2 | Age 3 | Age 4 | Age 5 | Age 6 | Age 7 | Age 8 | Age 9 | Age 10 | Age 11 | Age 12 | Age 13 | Age 14 | Age 15 | Age 16 | Age 17 | |
| 1995 | 9 | 58 | 282 | 719 | 1395 | 2091 | 2767 | 4693 | 5905 | 7211 | 3300 | 17490 | ||||||
| 1996 | 8 | 41 | 216 | 672 | 1349 | 1939 | 2779 | 4223 | 6638 | 11146 | 20000 | |||||||
| 1997 | 8 | 41 | 244 | 655 | 1393 | 1914 | 2921 | 2988 | 3768 | 9600 | 11387 | 5140 | ||||||
| 1998 | 10 | 49 | 259 | 840 | 1406 | 2261 | 3173 | 4320 | 5275 | 5896 | 16233 | 12260 | ||||||
| 1999 | 63 | 272 | 793 | 1508 | 1964 | 2759 | 4257 | 7262 | 6561 | 2190 | 18340 | |||||||
| 2000 | 12 | 69 | 322 | 826 | 1561 | 2363 | 2811 | 4260 | 5977 | 6061 | 8736 | 9458 | 4220 | |||||
| 2001 | 5 | 74 | 377 | 933 | 1660 | 2320 | 2998 | 3338 | 4478 | 7193 | 11658 | 17035 | 8460 | 15001 | ||||
| 2002 | 9 | 88 | 357 | 918 | 1595 | 2377 | 3468 | 4415 | 3868 | 3588 | 8921 | 21980 | 12350 | |||||
| 2003 | 9 | 68 | 361 | 820 | 1427 | 2269 | 3127 | 4114 | 5493 | 6350 | 8881 | 2030 | 12562 | 25600 | ||||
| 2004 | 6 | 88 | 338 | 877 | 1646 | 2153 | 3197 | 3810 | 4656 | 4184 | 5102 | 9078 | 7130 | |||||
| 2005 | 14 | 99 | 436 | 878 | 1727 | 2205 | 2542 | 3666 | 3520 | 5562 | 8810 | 15482 | ||||||
| 2006 | 8 | 83 | 400 | 989 | 1649 | 2231 | 3502 | 3992 | 4445 | 8004 | 25080 | 4220 | ||||||
| 2007 | 7 | 97 | 486 | 1066 | 1865 | 2579 | 3168 | 4520 | 6363 | 11111 | 17480 | 2981 | 21100 | |||||
| 2008 | 6 | 97 | 427 | 1109 | 1971 | 3327 | 3393 | 4543 | 4921 | 4270 | 4077 | 10741 | 4962 | 9250 | 8520 | |||
| 2009 | 8 | 74 | 357 | 1032 | 1878 | 2695 | 3803 | 4599 | 5146 | 5349 | 4886 | 5474 | 3084 | 3122 | 9672 | |||
| 2010 | 11 | 63 | 502 | 1088 | 1872 | 2745 | 3586 | 4684 | 5096 | 6263 | 6448 | 6562 | 7962 | 2635 | 12154 | 7475 | ||
| 2011 | 8 | 59 | 401 | 1165 | 2279 | 3109 | 3702 | 5163 | 5593 | 6174 | 5325 | 3982 | 8151 | 4558 | ||||
| 2012 | 8 | 73 | 355 | 1141 | 2026 | 2907 | 3690 | 4688 | 5549 | 6118 | 7004 | 5018 | 7205 | 6444 | 7052 | 4630 | ||
| 2013 | 12 | 85 | 384 | 918 | 1817 | 3041 | 3438 | 3963 | 4926 | 5662 | 4340 | 8854 | 12081 | 4092 | 7780 | 16220 | 16300 | |
| 2014 | 7 | 80 | 359 | 1122 | 1894 | 2929 | 3690 | 4646 | 5562 | 5550 | 9029 | 7135 | 7066 | 4752 | 7920 | 9591 | 8282 | 24950 |
| 2015 | 8 | 73 | 406 | 1115 | 2145 | 2987 | 3774 | 4839 | 5299 | 5869 | 6281 | 8733 | 5443 | 10170 | 9930 | 11240 | ||
| 2016 | 7 | 73 | 347 | 1101 | 1904 | 3327 | 3928 | 4689 | 5885 | 7273 | 6709 | 10371 | 5020 | 5773 | 9411 | 8325 | ||
| 2017 | 4 | 83 | 504 | 1058 | 1969 | 2943 | 3997 | 4676 | 6985 | 6306 | 6225 | 9634 | 5089 | 14019 | ||||
| 2018 | 5 | 52 | 522 | 1109 | 2094 | 3206 | 3763 | 5391 | 5818 | 8438 | 7024 | 4283 | 5345 | 9367 | 15761 | 7350 | ||
| 2019 | 8 | 62 | 372 | 1131 | 1984 | 2983 | 3815 | 5141 | 5908 | 6420 | 7801 | 9778 | 10405 | 9786 | 9585 | 12345 | 7040 | |
| 2020 | 8 | 91 | 368 | 1002 | 2001 | 2904 | 3374 | 4938 | 6718 | 8514 | 6665 | 7555 | 5165 | 7984 | 9765 |
| Index_2plus | SD_2plus | CV_2plus | |
| 1995 | 33.395 | 2.667 | 0.080 |
| 1996 | 31.513 | 2.386 | 0.076 |
| 1997 | 47.938 | 5.599 | 0.117 |
| 1998 | 29.757 | 2.844 | 0.096 |
| 1999 | 13.154 | 1.183 | 0.090 |
| 2000 | 24.871 | 2.111 | 0.085 |
| 2001 | 17.500 | 2.666 | 0.152 |
| 2002 | 11.695 | 1.446 | 0.124 |
| 2003 | 13.128 | 1.526 | 0.116 |
| 2004 | 11.593 | 0.990 | 0.085 |
| 2005 | 8.253 | 0.766 | 0.093 |
| 2006 | 10.989 | 1.345 | 0.122 |
| 2007 | 15.494 | 1.420 | 0.092 |
| 2008 | 7.476 | 0.770 | 0.103 |
| 2009 | 9.128 | 0.883 | 0.097 |
| 2010 | 11.022 | 0.909 | 0.083 |
| 2011 | 10.425 | 0.917 | 0.088 |
| 2012 | 10.581 | 0.939 | 0.089 |
| 2013 | 10.131 | 0.993 | 0.098 |
| 2014 | 16.259 | 1.520 | 0.093 |
| 2015 | 10.942 | 0.857 | 0.078 |
| 2016 | 14.157 | 0.795 | 0.056 |
| 2017 | 12.782 | 1.118 | 0.087 |
| 2018 | 10.298 | 1.015 | 0.099 |
| 2019 | 13.753 | 1.271 | 0.092 |
| 2020 | 7.800 | 0.674 | 0.086 |
2.3 - Subarea B: Between 65° and 67°N
| Age 0 | Age 1 | Age 2 | Age 3 | Age 4 | Age 5 | Age 6 | Age 7 | Age 8 | Age 9 | Age 10 | Age 11 | Age 12 | Age 13 | Age 14 | Age 15 | Age 16 | |
| 1995 | 0.000 | 0.319 | 1.494 | 1.205 | 0.390 | 0.219 | 0.204 | 0.155 | 0.117 | 0.020 | 0.000 | 0.044 | |||||
| 1996 | 0.586 | 0.065 | 1.390 | 3.276 | 1.178 | 1.406 | 0.425 | 0.134 | 0.000 | 0.000 | 0.099 | ||||||
| 1997 | 0.000 | 0.934 | 1.928 | 2.312 | 1.023 | 0.383 | 0.094 | 0.036 | 0.005 | 0.000 | 0.000 | 0.000 | |||||
| 1998 | 0.000 | 0.264 | 1.216 | 0.903 | 0.846 | 0.406 | 0.070 | 0.053 | 0.039 | 0.000 | 0.000 | 0.000 | 0.026 | 0.026 | |||
| 1999 | 0.036 | 0.360 | 0.466 | 0.260 | 0.202 | 0.127 | 0.023 | 0.001 | 0.045 | 0.000 | 0.000 | ||||||
| 2000 | 0.000 | 0.236 | 0.976 | 1.511 | 0.814 | 0.350 | 0.244 | 0.089 | 0.049 | 0.016 | 0.016 | 0.016 | 0.000 | ||||
| 2001 | 0.000 | 0.110 | 0.315 | 0.358 | 0.382 | 0.399 | 0.162 | 0.064 | 0.065 | 0.005 | 0.000 | 0.000 | 0.004 | 0.000 | |||
| 2002 | 0.013 | 0.203 | 0.422 | 0.342 | 0.375 | 0.119 | 0.116 | 0.045 | 0.032 | 0.000 | 0.016 | 0.000 | 0.000 | ||||
| 2003 | 0.021 | 0.085 | 0.293 | 0.764 | 0.518 | 0.436 | 0.237 | 0.116 | 0.085 | 0.023 | 0.000 | 0.004 | 0.000 | 0.000 | |||
| 2004 | 0.061 | 0.163 | 0.499 | 0.708 | 0.955 | 0.648 | 0.364 | 0.169 | 0.111 | 0.011 | 0.038 | 0.000 | 0.000 | ||||
| 2005 | 0.018 | 0.126 | 0.464 | 0.730 | 0.445 | 0.432 | 0.240 | 0.188 | 0.035 | 0.027 | 0.015 | 0.000 | |||||
| 2006 | 0.060 | 0.153 | 0.246 | 0.512 | 0.301 | 0.292 | 0.195 | 0.075 | 0.012 | 0.029 | 0.000 | 0.000 | 0.000 | ||||
| 2007 | 0.049 | 0.086 | 0.540 | 0.325 | 0.162 | 0.123 | 0.166 | 0.052 | 0.011 | 0.000 | 0.000 | 0.001 | 0.000 | ||||
| 2008 | 0.323 | 0.140 | 0.098 | 0.028 | 0.028 | 0.020 | 0.006 | 0.014 | 0.013 | 0.002 | 0.000 | 0.004 | 0.001 | 0.000 | 0.000 | ||
| 2009 | 0.228 | 0.118 | 0.538 | 0.484 | 0.617 | 0.280 | 0.195 | 0.065 | 0.162 | 0.062 | 0.001 | 0.013 | 0.000 | 0.000 | 0.000 | ||
| 2010 | 0.014 | 0.488 | 0.343 | 0.282 | 0.211 | 0.258 | 0.113 | 0.064 | 0.010 | 0.021 | 0.022 | 0.000 | 0.003 | 0.005 | 0.000 | 0.000 | |
| 2011 | 0.155 | 1.784 | 1.046 | 0.828 | 0.553 | 0.425 | 0.178 | 0.028 | 0.069 | 0.004 | 0.014 | 0.001 | 0.012 | 0.000 | |||
| 2012 | 0.001 | 0.218 | 0.573 | 0.323 | 0.084 | 0.086 | 0.044 | 0.052 | 0.018 | 0.009 | 0.013 | 0.019 | 0.004 | 0.008 | 0.000 | 0.003 | |
| 2013 | 0.165 | 0.620 | 0.618 | 0.509 | 0.340 | 0.303 | 0.164 | 0.075 | 0.044 | 0.020 | 0.015 | 0.009 | 0.015 | 0.000 | 0.000 | 0.000 | 0.000 |
| 2014 | 1.136 | 0.357 | 0.392 | 0.158 | 0.062 | 0.080 | 0.052 | 0.065 | 0.235 | 0.114 | 0.010 | 0.000 | 0.012 | 0.005 | 0.000 | 0.000 | 0.000 |
| 2015 | 0.000 | 1.371 | 0.849 | 0.714 | 0.792 | 0.335 | 0.230 | 0.067 | 0.035 | 0.059 | 0.061 | 0.004 | 0.015 | 0.000 | 0.005 | 0.000 | |
| 2016 | 0.033 | 0.371 | 0.433 | 0.223 | 0.244 | 0.304 | 0.193 | 0.150 | 0.053 | 0.035 | 0.015 | 0.014 | 0.000 | 0.004 | 0.000 | 0.000 | |
| 2017 | 0.000 | 0.055 | 0.209 | 0.120 | 0.053 | 0.123 | 0.054 | 0.059 | 0.022 | 0.013 | 0.013 | 0.009 | 0.005 | 0.002 | |||
| 2018 | 0.010 | 0.289 | 0.158 | 0.173 | 0.094 | 0.093 | 0.109 | 0.068 | 0.042 | 0.021 | 0.012 | 0.004 | 0.002 | 0.006 | 0.000 | 0.000 | |
| 2019 | 0.631 | 0.874 | 0.616 | 1.017 | 0.850 | 0.681 | 0.191 | 0.237 | 0.066 | 0.087 | 0.054 | 0.027 | 0.004 | 0.000 | 0.000 | 0.000 | 0.000 |
| 2020 | 0.007 | 0.026 | 0.300 | 0.469 | 0.677 | 0.254 | 0.191 | 0.092 | 0.078 | 0.028 | 0.003 | 0.009 | 0.000 | 0.005 | 0.000 |
| Age 0 | Age 1 | Age 2 | Age 3 | Age 4 | Age 5 | Age 6 | Age 7 | Age 8 | Age 9 | Age 10 | Age 11 | Age 12 | Age 13 | Age 14 | Age 15 | Age 16 | |
| 1995 | 0.027 | 0.008 | 0.023 | 0.074 | 0.081 | 0.055 | 0.036 | 0.167 | 1.012 | 6.127 | 0.000 | ||||||
| 1996 | 0.355 | 0.635 | 0.011 | 0.010 | 0.054 | 0.055 | 0.115 | 0.174 | 0.000 | ||||||||
| 1997 | 0.234 | 0.174 | 0.060 | 0.092 | 0.137 | 0.353 | 0.501 | 2.629 | |||||||||
| 1998 | 0.145 | 0.075 | 0.100 | 0.080 | 0.104 | 0.464 | 0.240 | 0.443 | 8.401 | 0.000 | 0.000 | ||||||
| 1999 | 0.010 | 0.002 | 0.001 | 0.001 | 0.001 | 0.000 | 0.000 | 0.019 | 0.000 | ||||||||
| 2000 | 0.038 | 0.013 | 0.012 | 0.027 | 0.075 | 0.101 | 0.080 | 0.038 | 0.103 | 0.000 | 0.000 | ||||||
| 2001 | 0.682 | 0.384 | 0.257 | 0.110 | 0.156 | 0.164 | 0.255 | 0.176 | 0.968 | 1.159 | |||||||
| 2002 | 2.110 | 0.263 | 0.394 | 0.096 | 0.048 | 0.298 | 0.564 | 0.981 | 0.662 | 0.000 | |||||||
| 2003 | 0.522 | 0.324 | 0.099 | 0.061 | 0.092 | 0.074 | 0.090 | 0.129 | 0.156 | 0.284 | 1.032 | ||||||
| 2004 | 0.347 | 0.052 | 0.075 | 0.079 | 0.061 | 0.102 | 0.113 | 0.143 | 0.109 | 1.036 | 0.303 | ||||||
| 2005 | 1.591 | 0.255 | 0.046 | 0.033 | 0.028 | 0.034 | 0.039 | 0.084 | 0.283 | 0.000 | 0.148 | ||||||
| 2006 | 0.000 | 0.041 | 0.031 | 0.021 | 0.049 | 0.036 | 0.036 | 0.089 | 0.202 | 0.000 | |||||||
| 2007 | 1.071 | 0.366 | 0.157 | 0.144 | 0.154 | 0.151 | 0.206 | 0.208 | 0.960 | 5.384 | |||||||
| 2008 | 0.723 | 0.555 | 0.336 | 0.708 | 0.471 | 0.101 | 0.856 | 0.584 | 0.695 | 0.201 | 0.685 | 0.040 | |||||
| 2009 | 0.000 | 0.369 | 0.177 | 0.078 | 0.111 | 0.084 | 0.097 | 0.295 | 0.082 | 0.199 | 4.224 | 0.273 | |||||
| 2010 | 0.221 | 0.367 | 0.172 | 0.146 | 0.080 | 0.076 | 0.076 | 0.062 | 0.444 | 0.708 | 0.248 | 5.180 | 0.805 | 0.000 | |||
| 2011 | 0.712 | 0.078 | 0.098 | 0.087 | 0.103 | 0.080 | 0.144 | 0.736 | 0.111 | 1.824 | 1.206 | 3.159 | 0.000 | ||||
| 2012 | 1.698 | 0.213 | 0.507 | 0.524 | 0.318 | 0.305 | 0.457 | 0.434 | 0.408 | 0.442 | 0.369 | 0.656 | 0.769 | 0.807 | 0.795 | ||
| 2013 | 0.586 | 0.160 | 0.191 | 0.092 | 0.067 | 0.057 | 0.160 | 0.271 | 0.254 | 0.585 | 0.633 | 1.014 | 0.631 | ||||
| 2014 | 0.118 | 0.145 | 0.158 | 0.176 | 0.108 | 0.231 | 0.273 | 0.412 | 0.039 | 0.335 | 0.711 | 0.745 | 1.254 | ||||
| 2015 | 0.053 | 0.059 | 0.087 | 0.083 | 0.090 | 0.152 | 0.317 | 0.466 | 0.352 | 0.678 | 0.970 | 0.527 | 1.096 | ||||
| 2016 | 1.416 | 0.828 | 0.216 | 0.335 | 0.242 | 0.232 | 0.291 | 0.377 | 0.464 | 0.407 | 0.753 | 0.590 | 0.639 | ||||
| 2017 | 0.637 | 0.330 | 0.262 | 0.206 | 0.279 | 0.349 | 0.384 | 0.529 | 0.419 | 0.619 | 0.531 | 1.049 | 0.936 | ||||
| 2018 | 0.638 | 0.533 | 0.167 | 0.147 | 0.170 | 0.367 | 0.506 | 0.648 | 0.594 | 0.625 | 0.626 | 0.852 | 0.684 | 1.026 | |||
| 2019 | 0.056 | 0.097 | 0.145 | 0.075 | 0.077 | 0.076 | 0.192 | 0.108 | 0.183 | 0.117 | 0.097 | 0.195 | 1.579 | ||||
| 2020 | 3.801 | 0.853 | 0.400 | 0.222 | 0.162 | 0.337 | 0.310 | 0.350 | 0.471 | 0.519 | 1.056 | 1.242 | 1.369 |
| Age 0 | Age 1 | Age 2 | Age 3 | Age 4 | Age 5 | Age 6 | Age 7 | Age 8 | Age 9 | Age 10 | Age 11 | Age 12 | Age 13 | Age 14 | Age 15 | Age 16 | |
| 1995 | 0.000 | 0.029 | 0.528 | 0.814 | 0.573 | 0.469 | 0.517 | 0.822 | 1.037 | 0.188 | 0.001 | 0.811 | |||||
| 1996 | 0.005 | 0.001 | 0.404 | 2.548 | 1.454 | 2.479 | 0.939 | 0.622 | 0.000 | 0.000 | 1.546 | ||||||
| 1997 | 0.000 | 0.053 | 0.377 | 1.398 | 1.149 | 0.663 | 0.257 | 0.113 | 0.008 | 0.000 | 0.000 | 0.000 | |||||
| 1998 | 0.000 | 0.034 | 0.375 | 0.753 | 1.019 | 0.735 | 0.197 | 0.242 | 0.305 | 0.001 | 0.000 | 0.000 | 0.525 | 0.690 | |||
| 1999 | 0.004 | 0.088 | 0.302 | 0.306 | 0.384 | 0.325 | 0.107 | 0.008 | 0.624 | 0.000 | 0.000 | ||||||
| 2000 | 0.000 | 0.022 | 0.290 | 1.016 | 0.966 | 0.688 | 0.779 | 0.495 | 0.511 | 0.308 | 0.232 | 0.233 | 0.000 | ||||
| 2001 | 0.000 | 0.010 | 0.097 | 0.234 | 0.421 | 0.519 | 0.577 | 0.190 | 0.499 | 0.037 | 0.000 | 0.000 | 0.050 | 0.000 | |||
| 2002 | 0.000 | 0.019 | 0.117 | 0.437 | 0.880 | 0.217 | 0.194 | 0.076 | 0.088 | 0.000 | 0.135 | 0.000 | 0.000 | ||||
| 2003 | 0.000 | 0.006 | 0.104 | 0.466 | 0.540 | 0.775 | 0.590 | 0.321 | 0.283 | 0.054 | 0.000 | 0.008 | 0.000 | 0.000 | |||
| 2004 | 0.000 | 0.016 | 0.170 | 0.517 | 1.402 | 1.127 | 0.967 | 0.495 | 0.284 | 0.034 | 0.682 | 0.000 | 0.000 | ||||
| 2005 | 0.000 | 0.009 | 0.157 | 0.475 | 0.687 | 0.987 | 0.663 | 0.566 | 0.101 | 0.040 | 0.278 | 0.000 | |||||
| 2006 | 0.001 | 0.019 | 0.124 | 0.500 | 0.400 | 0.516 | 0.453 | 0.174 | 0.052 | 0.133 | 0.000 | 0.000 | 0.000 | ||||
| 2007 | 0.000 | 0.011 | 0.254 | 0.258 | 0.229 | 0.255 | 0.409 | 0.157 | 0.071 | 0.000 | 0.000 | 0.001 | 0.000 | ||||
| 2008 | 0.003 | 0.018 | 0.044 | 0.040 | 0.066 | 0.053 | 0.021 | 0.056 | 0.072 | 0.015 | 0.000 | 0.026 | 0.003 | 0.000 | 0.000 | ||
| 2009 | 0.004 | 0.009 | 0.192 | 0.577 | 1.041 | 0.696 | 0.529 | 0.167 | 0.593 | 0.386 | 0.003 | 0.026 | 0.000 | 0.000 | 0.000 | ||
| 2010 | 0.000 | 0.030 | 0.121 | 0.229 | 0.389 | 0.606 | 0.308 | 0.289 | 0.024 | 0.059 | 0.109 | 0.000 | 0.006 | 0.009 | 0.000 | 0.000 | |
| 2011 | 0.001 | 0.146 | 0.298 | 0.783 | 0.895 | 1.020 | 0.541 | 0.093 | 0.560 | 0.010 | 0.046 | 0.003 | 0.119 | 0.000 | |||
| 2012 | 0.000 | 0.021 | 0.192 | 0.181 | 0.104 | 0.183 | 0.105 | 0.165 | 0.078 | 0.057 | 0.056 | 0.096 | 0.016 | 0.036 | 0.000 | 0.012 | |
| 2013 | 0.002 | 0.037 | 0.147 | 0.321 | 0.393 | 0.675 | 0.400 | 0.231 | 0.199 | 0.085 | 0.038 | 0.031 | 0.061 | 0.000 | 0.000 | 0.000 | 0.000 |
| 2014 | 0.012 | 0.030 | 0.232 | 0.114 | 0.061 | 0.157 | 0.173 | 0.251 | 1.117 | 0.437 | 0.041 | 0.000 | 0.043 | 0.015 | 0.000 | 0.000 | 0.000 |
| 2015 | 0.000 | 0.106 | 0.233 | 0.759 | 1.233 | 0.793 | 0.522 | 0.207 | 0.127 | 0.460 | 0.228 | 0.019 | 0.066 | 0.000 | 0.036 | 0.000 | |
| 2016 | 0.000 | 0.031 | 0.133 | 0.197 | 0.331 | 0.701 | 0.550 | 0.462 | 0.251 | 0.357 | 0.072 | 0.086 | 0.000 | 0.012 | 0.000 | 0.000 | |
| 2017 | 0.000 | 0.005 | 0.073 | 0.104 | 0.101 | 0.309 | 0.173 | 0.190 | 0.084 | 0.077 | 0.058 | 0.040 | 0.020 | 0.024 | |||
| 2018 | 0.000 | 0.015 | 0.047 | 0.271 | 0.155 | 0.249 | 0.347 | 0.265 | 0.225 | 0.097 | 0.060 | 0.015 | 0.019 | 0.037 | 0.000 | 0.000 | |
| 2019 | 0.006 | 0.069 | 0.184 | 1.140 | 1.734 | 1.720 | 0.582 | 0.841 | 0.199 | 0.370 | 0.251 | 0.143 | 0.015 | 0.000 | 0.000 | 0.000 | 0.000 |
| 2020 | 0.000 | 0.002 | 0.118 | 0.505 | 1.165 | 0.630 | 0.605 | 0.420 | 0.328 | 0.126 | 0.013 | 0.056 | 0.000 | 0.025 | 0.000 |
| Age 0 | Age 1 | Age 2 | Age 3 | Age 4 | Age 5 | Age 6 | Age 7 | Age 8 | Age 9 | Age 10 | Age 11 | Age 12 | Age 13 | Age 14 | Age 15 | Age 16 | |
| 1995 | 21.94 | 33.66 | 41.58 | 52.72 | 60.33 | 64.29 | 80.92 | 94.71 | 99.01 | 60.00 | 117.00 | ||||||
| 1996 | 9.77 | 13.00 | 31.63 | 42.75 | 51.16 | 57.11 | 61.34 | 80.03 | 118.00 | ||||||||
| 1997 | 18.27 | 27.13 | 39.84 | 49.63 | 57.20 | 64.53 | 75.17 | 54.90 | |||||||||
| 1998 | 24.38 | 31.97 | 43.56 | 49.98 | 57.23 | 65.97 | 77.02 | 93.29 | 57.00 | 121.00 | 135.00 | ||||||
| 1999 | 23.93 | 29.19 | 40.33 | 49.29 | 57.53 | 64.02 | 79.87 | 97.41 | 107.50 | ||||||||
| 2000 | 21.57 | 31.06 | 40.66 | 49.45 | 58.17 | 67.45 | 79.64 | 98.84 | 109.64 | 114.00 | 105.00 | ||||||
| 2001 | 21.77 | 31.73 | 41.09 | 48.33 | 51.45 | 67.05 | 65.76 | 90.48 | 89.36 | 117.00 | |||||||
| 2002 | 10.00 | 21.90 | 30.75 | 48.87 | 60.98 | 55.74 | 53.59 | 54.19 | 64.97 | 97.00 | |||||||
| 2003 | 10.00 | 19.94 | 32.96 | 39.46 | 47.12 | 56.05 | 62.67 | 65.60 | 69.22 | 62.20 | 61.00 | ||||||
| 2004 | 8.77 | 21.73 | 32.25 | 42.14 | 51.94 | 55.44 | 63.72 | 65.75 | 64.19 | 72.07 | 119.47 | ||||||
| 2005 | 14.00 | 20.14 | 31.65 | 40.05 | 52.32 | 60.57 | 63.73 | 65.16 | 65.74 | 55.00 | 118.27 | ||||||
| 2006 | 11.67 | 23.74 | 36.59 | 45.65 | 51.04 | 55.71 | 61.58 | 62.43 | 77.27 | 75.96 | |||||||
| 2007 | 9.94 | 23.46 | 35.55 | 43.44 | 51.65 | 58.62 | 62.02 | 67.97 | 89.28 | 57.00 | |||||||
| 2008 | 10.73 | 25.27 | 36.20 | 53.57 | 62.11 | 63.98 | 69.17 | 71.80 | 79.42 | 88.53 | 88.78 | 69.99 | |||||
| 2009 | 12.11 | 20.79 | 32.27 | 48.34 | 54.21 | 61.43 | 64.91 | 63.54 | 71.00 | 81.67 | 59.00 | 59.22 | |||||
| 2010 | 12.04 | 19.15 | 32.56 | 42.28 | 55.82 | 60.52 | 64.49 | 74.88 | 61.81 | 66.77 | 81.14 | 58.00 | 60.00 | 62.00 | |||
| 2011 | 9.38 | 21.22 | 30.50 | 45.76 | 54.64 | 62.29 | 66.89 | 72.58 | 83.47 | 61.36 | 69.07 | 64.00 | 102.00 | ||||
| 2012 | 10.16 | 22.09 | 32.88 | 39.24 | 51.02 | 59.62 | 63.48 | 67.44 | 74.07 | 83.81 | 74.30 | 78.35 | 73.00 | 75.00 | 79.00 | ||
| 2013 | 11.77 | 19.05 | 30.12 | 40.89 | 49.69 | 62.10 | 64.29 | 68.26 | 76.04 | 76.13 | 64.04 | 69.00 | 74.35 | ||||
| 2014 | 10.74 | 21.22 | 38.24 | 42.25 | 47.29 | 58.78 | 70.43 | 73.78 | 76.04 | 74.19 | 81.04 | 72.99 | 75.00 | ||||
| 2015 | 20.63 | 30.34 | 47.34 | 54.38 | 61.30 | 60.63 | 68.91 | 71.92 | 88.58 | 74.42 | 77.00 | 76.03 | 95.00 | ||||
| 2016 | 9.90 | 21.41 | 32.22 | 42.52 | 51.41 | 60.40 | 65.69 | 66.74 | 77.77 | 96.51 | 75.68 | 83.88 | 73.00 | ||||
| 2017 | 22.31 | 33.68 | 44.75 | 57.05 | 63.09 | 69.05 | 68.58 | 73.69 | 85.70 | 78.01 | 75.94 | 81.30 | 99.00 | ||||
| 2018 | 10.43 | 17.57 | 32.07 | 50.93 | 54.46 | 63.45 | 66.72 | 72.57 | 77.50 | 77.15 | 78.02 | 74.66 | 98.00 | 80.03 | |||
| 2019 | 10.55 | 20.66 | 30.44 | 48.03 | 58.75 | 62.90 | 66.59 | 71.27 | 67.22 | 73.38 | 73.15 | 82.61 | 76.59 | ||||
| 2020 | 11.37 | 22.57 | 34.54 | 46.72 | 54.72 | 62.14 | 66.55 | 75.63 | 75.15 | 77.74 | 79.23 | 82.83 | 83.00 |
| Age 0 | Age 1 | Age 2 | Age 3 | Age 4 | Age 5 | Age 6 | Age 7 | Age 8 | Age 9 | Age 10 | Age 11 | Age 12 | Age 13 | Age 14 | Age 15 | Age 16 | |
| 1995 | 91 | 354 | 676 | 1470 | 2148 | 2538 | 5295 | 8844 | 9406 | 2400 | 18580 | ||||||
| 1996 | 8 | 17 | 291 | 778 | 1233 | 1763 | 2214 | 4688 | 15560 | ||||||||
| 1997 | 57 | 198 | 604 | 1124 | 1733 | 2787 | 3282 | 1506 | |||||||||
| 1998 | 128 | 309 | 835 | 1204 | 1809 | 2823 | 4634 | 7894 | 1655 | 19880 | 26100 | ||||||
| 1999 | 115 | 245 | 648 | 1175 | 1906 | 2556 | 4722 | 9728 | 13870 | ||||||||
| 2000 | 92 | 297 | 672 | 1186 | 1962 | 3185 | 5549 | 10436 | 18769 | 14266 | 14380 | ||||||
| 2001 | 96 | 316 | 670 | 1106 | 1305 | 3618 | 2991 | 7694 | 7230 | 12000 | |||||||
| 2002 | 8 | 93 | 281 | 1286 | 2350 | 1887 | 1755 | 1800 | 2999 | 8358 | |||||||
| 2003 | 9 | 67 | 354 | 610 | 1045 | 1780 | 2491 | 2787 | 3325 | 2370 | 2030 | ||||||
| 2004 | 6 | 100 | 341 | 732 | 1468 | 1741 | 2663 | 2936 | 2558 | 3377 | 18589 | ||||||
| 2005 | 25 | 75 | 340 | 652 | 1545 | 2286 | 2761 | 3002 | 2942 | 1456 | 18343 | ||||||
| 2006 | 13 | 125 | 506 | 976 | 1329 | 1769 | 2318 | 2308 | 4444 | 4608 | |||||||
| 2007 | 7 | 134 | 474 | 796 | 1421 | 2083 | 2516 | 3047 | 6673 | 1648 | |||||||
| 2008 | 10 | 165 | 456 | 1543 | 2445 | 2691 | 3419 | 4277 | 5767 | 7574 | 6239 | 2733 | |||||
| 2009 | 16 | 76 | 361 | 1194 | 1697 | 2487 | 2720 | 2575 | 3664 | 6374 | 2096 | 2034 | |||||
| 2010 | 14 | 62 | 355 | 822 | 1852 | 2355 | 2731 | 4539 | 2398 | 2842 | 4951 | 2128 | 2285 | 1910 | |||
| 2011 | 8 | 82 | 286 | 947 | 1620 | 2404 | 3064 | 4232 | 8231 | 2328 | 3590 | 2440 | 10116 | ||||
| 2012 | 9 | 96 | 338 | 581 | 1287 | 2206 | 2548 | 3215 | 4206 | 7036 | 4248 | 4862 | 3745 | 4325 | 4630 | ||
| 2013 | 13 | 60 | 241 | 631 | 1160 | 2225 | 2436 | 3071 | 4535 | 4334 | 2569 | 3425 | 4214 | ||||
| 2014 | 11 | 85 | 601 | 725 | 982 | 2003 | 3272 | 4015 | 4751 | 3973 | 4625 | 3634 | 3340 | ||||
| 2015 | 77 | 275 | 1061 | 1556 | 2373 | 2271 | 3186 | 3614 | 8353 | 3497 | 4310 | 4380 | 7785 | ||||
| 2016 | 9 | 87 | 307 | 860 | 1360 | 2292 | 2796 | 3035 | 4734 | 10174 | 4596 | 5961 | 3425 | ||||
| 2017 | 89 | 363 | 880 | 1901 | 2484 | 3206 | 3257 | 3827 | 6124 | 4306 | 4305 | 4379 | 10610 | ||||
| 2018 | 5 | 48 | 296 | 1587 | 1643 | 2592 | 3083 | 3993 | 5141 | 4668 | 4787 | 3684 | 8695 | 5988 | |||
| 2019 | 10 | 79 | 299 | 1121 | 2042 | 2529 | 3058 | 3557 | 3014 | 4284 | 4647 | 5383 | 4261 | ||||
| 2020 | 9 | 86 | 394 | 1073 | 1720 | 2512 | 3123 | 4707 | 4240 | 4690 | 3524 | 6025 | 5434 |
| Index_2plus | SD_2plus | CV_2plus | |
| 1995 | 3.848 | 0.030 | 0.008 |
| 1996 | 7.908 | 0.072 | 0.009 |
| 1997 | 5.782 | 0.365 | 0.063 |
| 1998 | 3.587 | 0.104 | 0.029 |
| 1999 | 1.483 | 0.001 | 0.000 |
| 2000 | 4.082 | 0.033 | 0.008 |
| 2001 | 1.753 | 0.309 | 0.176 |
| 2002 | 1.467 | 0.289 | 0.197 |
| 2003 | 2.474 | 0.049 | 0.020 |
| 2004 | 3.503 | 0.067 | 0.019 |
| 2005 | 2.576 | 0.025 | 0.010 |
| 2006 | 1.662 | 0.022 | 0.013 |
| 2007 | 1.379 | 0.090 | 0.066 |
| 2008 | 0.214 | 0.060 | 0.279 |
| 2009 | 2.416 | 0.197 | 0.081 |
| 2010 | 1.331 | 0.108 | 0.081 |
| 2011 | 3.157 | 0.150 | 0.048 |
| 2012 | 1.238 | 0.565 | 0.457 |
| 2013 | 2.113 | 0.138 | 0.065 |
| 2014 | 1.184 | 0.068 | 0.057 |
| 2015 | 3.167 | 0.147 | 0.046 |
| 2016 | 1.668 | 0.344 | 0.206 |
| 2017 | 0.682 | 0.189 | 0.277 |
| 2018 | 0.783 | 0.233 | 0.298 |
| 2019 | 3.830 | 0.106 | 0.028 |
| 2020 | 2.107 | 0.289 | 0.137 |
2.4 - Subarea C: Between 62°N and 65°N
| Age 0 | Age 1 | Age 2 | Age 3 | Age 4 | Age 5 | Age 6 | Age 7 | Age 8 | Age 9 | Age 10 | Age 11 | Age 12 | Age 13 | Age 14 | Age 15 | Age 16 | |
| 1995 | 0.000 | 0.147 | 0.748 | 1.075 | 0.435 | 0.364 | 0.042 | 0.097 | 0.029 | 0.001 | 0.000 | 0.000 | |||||
| 1996 | 0.004 | 0.118 | 0.333 | 0.816 | 0.966 | 0.761 | 0.249 | 0.113 | 0.000 | 0.002 | 0.000 | ||||||
| 1997 | 0.000 | 0.223 | 0.621 | 1.083 | 0.556 | 0.376 | 0.242 | 0.167 | 0.059 | 0.000 | 0.000 | 0.000 | |||||
| 1998 | 0.009 | 0.089 | 2.701 | 1.303 | 0.520 | 0.115 | 0.206 | 0.198 | 0.000 | 0.000 | 0.000 | 0.000 | 0.000 | 0.000 | |||
| 1999 | 0.031 | 0.145 | 0.259 | 0.235 | 0.094 | 0.062 | 0.019 | 0.000 | 0.000 | 0.000 | 0.000 | ||||||
| 2000 | 0.000 | 0.000 | 0.053 | 0.085 | 0.182 | 0.117 | 0.036 | 0.000 | 0.000 | 0.000 | 0.000 | 0.000 | 0.000 | ||||
| 2001 | 0.000 | 0.102 | 0.350 | 0.462 | 0.379 | 0.288 | 0.137 | 0.052 | 0.030 | 0.005 | 0.000 | 0.000 | 0.004 | 0.000 | |||
| 2002 | 0.013 | 0.604 | 0.930 | 0.969 | 1.552 | 1.570 | 2.387 | 0.604 | 0.167 | 0.004 | 0.000 | 0.000 | 0.000 | ||||
| 2003 | 0.000 | 0.037 | 0.063 | 0.314 | 0.146 | 0.096 | 0.044 | 0.027 | 0.031 | 0.010 | 0.000 | 0.003 | 0.000 | 0.000 | |||
| 2004 | 0.230 | 0.039 | 0.206 | 0.264 | 0.390 | 0.233 | 0.074 | 0.049 | 0.013 | 0.014 | 0.003 | 0.000 | 0.000 | ||||
| 2005 | 0.000 | 0.235 | 0.091 | 0.319 | 0.505 | 0.256 | 0.254 | 0.060 | 0.005 | 0.000 | 0.002 | 0.000 | |||||
| 2006 | 0.415 | 0.008 | 0.064 | 0.072 | 0.211 | 0.238 | 0.065 | 0.024 | 0.035 | 0.012 | 0.012 | 0.000 | 0.000 | ||||
| 2007 | 0.049 | 0.082 | 0.152 | 0.097 | 0.103 | 0.099 | 0.163 | 0.066 | 0.024 | 0.004 | 0.004 | 0.001 | 0.000 | ||||
| 2008 | 0.350 | 0.129 | 0.124 | 0.053 | 0.054 | 0.011 | 0.005 | 0.025 | 0.008 | 0.000 | 0.000 | 0.003 | 0.000 | 0.000 | 0.000 | ||
| 2009 | 0.000 | 0.063 | 0.241 | 0.446 | 0.258 | 0.093 | 0.019 | 0.041 | 0.032 | 0.005 | 0.000 | 0.023 | 0.000 | 0.000 | 0.000 | ||
| 2010 | 0.118 | 0.397 | 0.181 | 0.221 | 0.153 | 0.161 | 0.026 | 0.009 | 0.042 | 0.025 | 0.015 | 0.000 | 0.003 | 0.000 | 0.000 | 0.000 | |
| 2011 | 0.000 | 0.094 | 0.102 | 0.131 | 0.120 | 0.134 | 0.164 | 0.036 | 0.008 | 0.008 | 0.032 | 0.000 | 0.002 | 0.000 | |||
| 2012 | 0.000 | 0.130 | 0.440 | 0.381 | 0.187 | 0.181 | 0.151 | 0.083 | 0.020 | 0.007 | 0.013 | 0.019 | 0.004 | 0.008 | 0.000 | 0.003 | |
| 2013 | 0.003 | 0.172 | 0.396 | 0.249 | 0.150 | 0.095 | 0.108 | 0.052 | 0.065 | 0.020 | 0.010 | 0.009 | 0.015 | 0.000 | 0.000 | 0.000 | 0.000 |
| 2014 | 0.116 | 0.425 | 0.205 | 0.180 | 0.173 | 0.250 | 0.152 | 0.101 | 0.106 | 0.161 | 0.019 | 0.000 | 0.012 | 0.005 | 0.000 | 0.000 | 0.000 |
| 2015 | 0.000 | 0.149 | 1.109 | 0.183 | 0.338 | 0.094 | 0.200 | 0.034 | 0.053 | 0.058 | 0.058 | 0.004 | 0.015 | 0.000 | 0.005 | 0.000 | |
| 2016 | 0.030 | 0.301 | 0.341 | 1.122 | 0.557 | 0.336 | 0.103 | 0.080 | 0.104 | 0.023 | 0.032 | 0.133 | 0.000 | 0.000 | 0.000 | 0.000 | |
| 2017 | 0.000 | 0.098 | 0.209 | 0.086 | 0.176 | 0.147 | 0.112 | 0.085 | 0.042 | 0.009 | 0.013 | 0.009 | 0.005 | 0.002 | |||
| 2018 | 0.000 | 0.238 | 0.086 | 0.094 | 0.181 | 0.330 | 0.265 | 0.073 | 0.056 | 0.081 | 0.012 | 0.004 | 0.002 | 0.006 | 0.000 | 0.000 | |
| 2019 | 0.011 | 0.027 | 0.166 | 0.136 | 0.083 | 0.372 | 0.489 | 0.393 | 0.067 | 0.055 | 0.013 | 0.011 | 0.003 | 0.000 | 0.000 | 0.000 | 0.000 |
| 2020 | 0.000 | 0.003 | 0.277 | 0.554 | 0.137 | 0.403 | 0.113 | 0.136 | 0.011 | 0.101 | 0.003 | 0.005 | 0.000 | 0.003 | 0.000 |
| Age 0 | Age 1 | Age 2 | Age 3 | Age 4 | Age 5 | Age 6 | Age 7 | Age 8 | Age 9 | Age 10 | Age 11 | Age 12 | Age 13 | Age 14 | Age 15 | Age 16 | |
| 1995 | 0.139 | 0.050 | 0.040 | 0.094 | 0.103 | 0.707 | 0.112 | 0.455 | 5.064 | ||||||||
| 1996 | 1.121 | 0.313 | 0.202 | 0.129 | 0.116 | 0.160 | 0.440 | 0.349 | 5.506 | 2.545 | |||||||
| 1997 | 0.342 | 0.143 | 0.052 | 0.122 | 0.151 | 0.287 | 0.258 | 0.502 | |||||||||
| 1998 | 0.898 | 0.073 | 0.000 | 0.000 | 0.000 | 0.000 | 0.000 | 0.000 | |||||||||
| 1999 | 0.289 | 0.080 | 0.052 | 0.057 | 0.122 | 0.154 | 0.294 | ||||||||||
| 2000 | 0.000 | 0.000 | 0.000 | 0.000 | 0.000 | ||||||||||||
| 2001 | 0.737 | 0.345 | 0.200 | 0.116 | 0.222 | 0.244 | 0.418 | 0.494 | 0.903 | 9.960 | 1.159 | ||||||
| 2002 | 2.110 | 0.083 | 0.172 | 0.009 | 0.053 | 0.109 | 0.069 | 0.185 | 0.315 | 1.143 | |||||||
| 2003 | 0.741 | 0.325 | 0.108 | 0.205 | 0.188 | 0.222 | 0.273 | 0.370 | 0.452 | 2.311 | 0.694 | ||||||
| 2004 | 0.141 | 0.206 | 0.155 | 0.188 | 0.083 | 0.201 | 0.149 | 0.167 | 0.475 | 0.558 | 1.490 | ||||||
| 2005 | 0.000 | 0.030 | 0.022 | 0.012 | 0.039 | 0.013 | 0.060 | 0.741 | 0.918 | ||||||||
| 2006 | 0.000 | 0.617 | 0.044 | 0.000 | 0.037 | 0.019 | 0.060 | 0.096 | 0.000 | 0.000 | 0.000 | ||||||
| 2007 | 1.071 | 0.393 | 0.417 | 0.222 | 0.122 | 0.136 | 0.205 | 0.148 | 0.417 | 0.000 | 0.000 | 5.384 | |||||
| 2008 | 0.668 | 0.600 | 0.267 | 0.373 | 0.247 | 0.124 | 1.112 | 0.318 | 1.139 | 0.724 | |||||||
| 2009 | 0.689 | 0.396 | 0.078 | 0.229 | 0.059 | 0.234 | 0.261 | 0.153 | 0.991 | 5.898 | 0.000 | ||||||
| 2010 | 0.149 | 0.451 | 0.325 | 0.186 | 0.099 | 0.115 | 0.291 | 0.406 | 0.084 | 0.588 | 0.368 | 0.805 | |||||
| 2011 | 0.669 | 0.833 | 0.603 | 0.270 | 0.148 | 0.069 | 0.064 | 0.527 | 0.142 | 0.012 | 0.487 | 2.036 | 0.004 | 4.559 | |||
| 2012 | 0.358 | 0.661 | 0.444 | 0.141 | 0.145 | 0.132 | 0.274 | 0.371 | 0.587 | 0.371 | 0.656 | 0.769 | 0.807 | 0.795 | |||
| 2013 | 2.824 | 0.527 | 0.296 | 0.192 | 0.150 | 0.182 | 0.240 | 0.388 | 0.172 | 0.585 | 0.956 | 1.014 | 0.631 | ||||
| 2014 | 0.666 | 0.158 | 0.360 | 0.152 | 0.043 | 0.075 | 0.096 | 0.269 | 0.086 | 0.238 | 0.365 | 0.740 | 1.254 | ||||
| 2015 | 0.119 | 0.025 | 0.166 | 0.070 | 0.068 | 0.091 | 0.202 | 0.206 | 0.220 | 0.691 | 0.970 | 0.504 | 1.096 | ||||
| 2016 | 1.529 | 1.024 | 0.631 | 0.341 | 0.191 | 0.388 | 0.505 | 0.557 | 0.566 | 0.581 | 0.616 | 0.757 | |||||
| 2017 | 0.359 | 0.330 | 0.367 | 0.061 | 0.235 | 0.170 | 0.264 | 0.271 | 0.629 | 0.619 | 0.531 | 1.049 | 0.936 | ||||
| 2018 | 0.644 | 0.344 | 0.277 | 0.083 | 0.105 | 0.208 | 0.617 | 0.440 | 0.159 | 0.626 | 0.852 | 0.684 | 1.026 | ||||
| 2019 | 0.907 | 0.907 | 0.426 | 0.161 | 0.185 | 0.052 | 0.035 | 0.039 | 0.130 | 0.134 | 0.538 | 0.550 | 0.930 | ||||
| 2020 | 1.741 | 0.533 | 0.392 | 0.496 | 0.294 | 0.562 | 0.607 | 0.602 | 0.736 | 1.003 | 1.036 | 0.977 |
| Age 0 | Age 1 | Age 2 | Age 3 | Age 4 | Age 5 | Age 6 | Age 7 | Age 8 | Age 9 | Age 10 | Age 11 | Age 12 | Age 13 | Age 14 | Age 15 | Age 16 | |
| 1995 | 0.000 | 0.025 | 0.414 | 0.910 | 0.647 | 0.940 | 0.112 | 0.428 | 0.189 | 0.002 | 0.000 | 0.000 | |||||
| 1996 | 0.000 | 0.006 | 0.110 | 0.982 | 1.667 | 1.735 | 0.652 | 0.447 | 0.001 | 0.010 | 0.000 | ||||||
| 1997 | 0.000 | 0.012 | 0.168 | 1.030 | 0.961 | 0.883 | 0.790 | 0.658 | 0.403 | 0.000 | 0.000 | 0.000 | |||||
| 1998 | 0.000 | 0.015 | 1.406 | 1.404 | 0.889 | 0.302 | 0.809 | 0.890 | 0.000 | 0.000 | 0.000 | 0.000 | 0.000 | 0.000 | |||
| 1999 | 0.004 | 0.075 | 0.415 | 0.743 | 0.455 | 0.247 | 0.134 | 0.000 | 0.000 | 0.000 | 0.000 | ||||||
| 2000 | 0.000 | 0.000 | 0.020 | 0.096 | 0.328 | 0.270 | 0.125 | 0.000 | 0.000 | 0.000 | 0.000 | 0.000 | 0.000 | ||||
| 2001 | 0.000 | 0.009 | 0.167 | 0.455 | 0.595 | 0.593 | 0.305 | 0.158 | 0.250 | 0.036 | 0.000 | 0.000 | 0.050 | 0.000 | |||
| 2002 | 0.000 | 0.094 | 0.602 | 1.357 | 5.275 | 7.009 | 12.038 | 4.644 | 0.964 | 0.036 | 0.000 | 0.000 | 0.000 | ||||
| 2003 | 0.000 | 0.002 | 0.011 | 0.136 | 0.141 | 0.170 | 0.110 | 0.070 | 0.143 | 0.036 | 0.001 | 0.006 | 0.000 | 0.000 | |||
| 2004 | 0.002 | 0.002 | 0.055 | 0.196 | 0.697 | 0.545 | 0.298 | 0.256 | 0.030 | 0.084 | 0.013 | 0.000 | 0.000 | ||||
| 2005 | 0.000 | 0.034 | 0.048 | 0.663 | 1.934 | 1.134 | 1.108 | 0.527 | 0.008 | 0.000 | 0.030 | 0.000 | |||||
| 2006 | 0.003 | 0.001 | 0.042 | 0.133 | 0.486 | 0.761 | 0.219 | 0.133 | 0.280 | 0.062 | 0.080 | 0.000 | 0.000 | ||||
| 2007 | 0.000 | 0.017 | 0.107 | 0.162 | 0.306 | 0.319 | 0.518 | 0.372 | 0.214 | 0.041 | 0.047 | 0.001 | 0.000 | ||||
| 2008 | 0.003 | 0.012 | 0.097 | 0.115 | 0.201 | 0.042 | 0.017 | 0.152 | 0.058 | 0.000 | 0.000 | 0.026 | 0.000 | 0.000 | 0.000 | ||
| 2009 | 0.000 | 0.004 | 0.117 | 0.582 | 0.483 | 0.250 | 0.084 | 0.178 | 0.155 | 0.013 | 0.001 | 0.064 | 0.000 | 0.000 | 0.000 | ||
| 2010 | 0.001 | 0.028 | 0.045 | 0.279 | 0.341 | 0.458 | 0.109 | 0.028 | 0.470 | 0.119 | 0.076 | 0.000 | 0.006 | 0.000 | 0.000 | 0.000 | |
| 2011 | 0.000 | 0.007 | 0.028 | 0.188 | 0.339 | 0.517 | 1.286 | 0.233 | 0.021 | 0.095 | 0.145 | 0.000 | 0.019 | 0.000 | |||
| 2012 | 0.000 | 0.012 | 0.144 | 0.396 | 0.477 | 0.723 | 0.566 | 0.330 | 0.083 | 0.026 | 0.056 | 0.096 | 0.016 | 0.036 | 0.000 | 0.012 | |
| 2013 | 0.000 | 0.014 | 0.085 | 0.128 | 0.132 | 0.229 | 0.415 | 0.182 | 0.459 | 0.085 | 0.025 | 0.031 | 0.061 | 0.000 | 0.000 | 0.000 | 0.000 |
| 2014 | 0.001 | 0.031 | 0.102 | 0.278 | 0.445 | 0.762 | 0.742 | 0.517 | 0.430 | 0.882 | 0.109 | 0.000 | 0.043 | 0.015 | 0.000 | 0.000 | 0.000 |
| 2015 | 0.000 | 0.016 | 0.496 | 0.180 | 0.537 | 0.236 | 0.506 | 0.203 | 0.221 | 0.237 | 0.220 | 0.019 | 0.064 | 0.000 | 0.036 | 0.000 | |
| 2016 | 0.000 | 0.024 | 0.197 | 2.195 | 2.116 | 1.234 | 0.350 | 0.299 | 0.795 | 0.217 | 0.130 | 1.304 | 0.000 | 0.000 | 0.000 | 0.000 | |
| 2017 | 0.000 | 0.008 | 0.123 | 0.117 | 0.440 | 0.509 | 0.400 | 0.263 | 0.255 | 0.041 | 0.058 | 0.040 | 0.020 | 0.024 | |||
| 2018 | 0.000 | 0.013 | 0.025 | 0.097 | 0.426 | 1.272 | 1.005 | 0.326 | 0.348 | 0.340 | 0.060 | 0.015 | 0.019 | 0.037 | 0.000 | 0.000 | |
| 2019 | 0.000 | 0.002 | 0.032 | 0.309 | 0.281 | 1.281 | 2.282 | 1.752 | 0.294 | 0.495 | 0.057 | 0.077 | 0.012 | 0.000 | 0.000 | 0.000 | 0.000 |
| 2020 | 0.000 | 0.000 | 0.344 | 1.266 | 0.307 | 2.021 | 0.467 | 1.147 | 0.055 | 0.733 | 0.010 | 0.033 | 0.000 | 0.018 | 0.000 |
| Age 0 | Age 1 | Age 2 | Age 3 | Age 4 | Age 5 | Age 6 | Age 7 | Age 8 | Age 9 | Age 10 | Age 11 | Age 12 | Age 13 | Age 14 | Age 15 | Age 16 | |
| 1995 | 26.44 | 38.14 | 44.42 | 53.51 | 63.65 | 64.79 | 78.31 | 88.80 | 65.00 | ||||||||
| 1996 | 8.00 | 16.98 | 30.91 | 48.14 | 55.40 | 60.93 | 64.48 | 76.20 | 65.00 | 87.00 | |||||||
| 1997 | 16.88 | 29.03 | 45.38 | 55.34 | 63.09 | 67.60 | 75.88 | 90.63 | |||||||||
| 1998 | 10.78 | 25.15 | 36.44 | 46.50 | 55.90 | 62.52 | 71.00 | 77.88 | |||||||||
| 1999 | 23.52 | 36.75 | 52.54 | 66.26 | 75.73 | 73.44 | 86.23 | ||||||||||
| 2000 | 33.79 | 49.42 | 56.33 | 60.59 | 67.12 | ||||||||||||
| 2001 | 21.79 | 35.36 | 44.63 | 52.72 | 57.48 | 59.25 | 64.73 | 90.77 | 90.74 | 69.00 | 117.00 | ||||||
| 2002 | 10.00 | 25.10 | 39.62 | 52.40 | 68.57 | 73.74 | 77.28 | 88.77 | 85.79 | 89.00 | |||||||
| 2003 | 17.33 | 27.22 | 35.36 | 45.55 | 54.61 | 63.06 | 61.49 | 75.71 | 71.34 | 88.00 | 61.00 | ||||||
| 2004 | 9.30 | 16.31 | 28.85 | 41.21 | 54.47 | 58.08 | 70.35 | 76.20 | 63.76 | 86.18 | 72.27 | ||||||
| 2005 | 24.71 | 37.06 | 58.01 | 70.61 | 75.43 | 72.50 | 93.44 | 57.50 | 108.00 | ||||||||
| 2006 | 9.93 | 21.95 | 40.86 | 53.85 | 59.97 | 66.41 | 69.09 | 71.73 | 87.55 | 82.00 | 86.00 | ||||||
| 2007 | 9.94 | 26.64 | 39.20 | 53.10 | 63.56 | 65.87 | 66.06 | 77.01 | 99.99 | 102.00 | 110.00 | 57.00 | |||||
| 2008 | 9.81 | 22.77 | 42.89 | 60.65 | 70.68 | 71.54 | 71.69 | 82.27 | 100.17 | 99.00 | |||||||
| 2009 | 20.15 | 35.27 | 49.79 | 55.73 | 65.44 | 78.15 | 76.08 | 75.71 | 62.77 | 66.00 | 65.00 | ||||||
| 2010 | 8.22 | 19.64 | 28.89 | 47.25 | 58.83 | 64.62 | 71.71 | 67.04 | 90.71 | 80.03 | 79.43 | 60.00 | |||||
| 2011 | 9.10 | 20.22 | 33.14 | 53.10 | 64.73 | 73.65 | 84.34 | 87.10 | 64.73 | 103.35 | 73.70 | 67.26 | 82.97 | 74.00 | |||
| 2012 | 21.75 | 32.39 | 47.37 | 63.96 | 71.35 | 73.06 | 74.45 | 73.64 | 71.31 | 74.42 | 78.35 | 73.00 | 75.00 | 79.00 | |||
| 2013 | 11.72 | 20.98 | 29.72 | 38.97 | 46.18 | 64.47 | 72.53 | 72.98 | 85.58 | 76.13 | 64.02 | 69.00 | 74.35 | ||||
| 2014 | 10.89 | 21.03 | 34.50 | 51.93 | 63.01 | 66.43 | 77.65 | 79.30 | 74.98 | 80.31 | 86.90 | 72.94 | 75.00 | ||||
| 2015 | 23.27 | 35.78 | 46.08 | 53.44 | 64.92 | 61.78 | 80.40 | 73.82 | 75.44 | 74.67 | 77.00 | 76.22 | 95.00 | ||||
| 2016 | 10.00 | 21.11 | 37.34 | 57.67 | 70.65 | 71.52 | 69.98 | 69.99 | 87.03 | 96.91 | 74.71 | 97.06 | |||||
| 2017 | 21.74 | 38.28 | 50.20 | 63.62 | 68.17 | 71.30 | 67.80 | 85.38 | 81.71 | 78.01 | 75.94 | 81.30 | 99.00 | ||||
| 2018 | 19.07 | 32.02 | 47.30 | 61.82 | 72.74 | 71.57 | 78.07 | 84.51 | 74.02 | 78.02 | 74.66 | 98.00 | 80.03 | ||||
| 2019 | 14.17 | 19.07 | 28.08 | 55.60 | 66.71 | 69.89 | 76.19 | 74.94 | 74.76 | 91.90 | 77.99 | 92.20 | 76.83 | ||||
| 2020 | 18.35 | 47.79 | 57.70 | 60.23 | 76.12 | 71.63 | 88.75 | 79.70 | 87.56 | 79.00 | 83.00 | 83.00 |
| Age 0 | Age 1 | Age 2 | Age 3 | Age 4 | Age 5 | Age 6 | Age 7 | Age 8 | Age 9 | Age 10 | Age 11 | Age 12 | Age 13 | Age 14 | Age 15 | Age 16 | |
| 1995 | 171 | 555 | 846 | 1489 | 2590 | 2748 | 4417 | 6905 | 2996 | ||||||||
| 1996 | 5 | 59 | 330 | 1212 | 1730 | 2284 | 2632 | 3977 | 2970 | 5220 | |||||||
| 1997 | 58 | 275 | 952 | 1730 | 2359 | 3239 | 3982 | 7487 | |||||||||
| 1998 | 10 | 167 | 520 | 1078 | 1710 | 2620 | 3931 | 4494 | |||||||||
| 1999 | 120 | 517 | 1605 | 3163 | 4878 | 3958 | 7302 | ||||||||||
| 2000 | 376 | 1134 | 1799 | 2305 | 3429 | ||||||||||||
| 2001 | 96 | 499 | 1005 | 1580 | 2089 | 2210 | 3051 | 9206 | 7802 | 2808 | 12000 | ||||||
| 2002 | 8 | 156 | 658 | 1401 | 3400 | 4481 | 5053 | 7831 | 5977 | 8640 | |||||||
| 2003 | 41 | 166 | 436 | 977 | 1800 | 2509 | 2644 | 4551 | 4036 | 7366 | 2030 | ||||||
| 2004 | 9 | 44 | 267 | 762 | 1796 | 2407 | 4078 | 5302 | 2476 | 6949 | 3748 | ||||||
| 2005 | 144 | 523 | 2081 | 3833 | 4438 | 4361 | 8869 | 1676 | 12140 | ||||||||
| 2006 | 8 | 81 | 652 | 1839 | 2300 | 3198 | 3350 | 5670 | 7957 | 5035 | 6530 | ||||||
| 2007 | 7 | 244 | 844 | 1736 | 3018 | 3266 | 3246 | 5671 | 9142 | 11610 | 13370 | 1648 | |||||
| 2008 | 8 | 105 | 822 | 2259 | 3862 | 3886 | 3739 | 6215 | 10013 | 7675 | |||||||
| 2009 | 71 | 540 | 1313 | 1932 | 2698 | 4495 | 4400 | 4936 | 2729 | 2656 | 2730 | ||||||
| 2010 | 4 | 73 | 252 | 1301 | 2245 | 2869 | 4313 | 3162 | 11121 | 5156 | 5031 | 2285 | |||||
| 2011 | 7 | 66 | 386 | 1511 | 2859 | 3864 | 7854 | 7474 | 2569 | 11848 | 4739 | 2910 | 7858 | 3888 | |||
| 2012 | 93 | 336 | 1191 | 2578 | 4054 | 3779 | 4088 | 4066 | 3716 | 4266 | 4862 | 3745 | 4325 | 4630 | |||
| 2013 | 12 | 78 | 217 | 515 | 889 | 2398 | 3969 | 3546 | 7124 | 4334 | 2499 | 3425 | 4214 | ||||
| 2014 | 15 | 73 | 539 | 1565 | 2571 | 3057 | 4901 | 5286 | 4051 | 5676 | 6016 | 3631 | 3340 | ||||
| 2015 | 112 | 448 | 1002 | 1592 | 2534 | 2532 | 6045 | 4153 | 4084 | 3532 | 4310 | 4410 | 7785 | ||||
| 2016 | 9 | 82 | 494 | 1952 | 3856 | 3623 | 3407 | 3576 | 7134 | 9101 | 4101 | 8575 | |||||
| 2017 | 87 | 637 | 1473 | 2499 | 3535 | 3579 | 3084 | 6189 | 4555 | 4306 | 4305 | 4379 | 10610 | ||||
| 2018 | 55 | 301 | 1078 | 2353 | 3858 | 3817 | 4955 | 6558 | 4188 | 4787 | 3684 | 8695 | 5988 | ||||
| 2019 | 23 | 61 | 190 | 2317 | 3433 | 3443 | 4671 | 4456 | 4388 | 9163 | 4210 | 7453 | 4298 | ||||
| 2020 | 48 | 1169 | 2194 | 2153 | 4935 | 3913 | 7895 | 5101 | 6869 | 3386 | 6140 | 5434 |
| Index_2plus | SD_2plus | CV_2plus | |
| 1995 | 2.791 | 0.052 | 0.019 |
| 1996 | 3.241 | 0.168 | 0.052 |
| 1997 | 3.103 | 0.141 | 0.045 |
| 1998 | 5.044 | 0.000 | 0.000 |
| 1999 | 0.815 | 0.020 | 0.025 |
| 2000 | 0.474 | 0.000 | 0.000 |
| 2001 | 1.707 | 0.312 | 0.183 |
| 2002 | 8.183 | 0.353 | 0.043 |
| 2003 | 0.735 | 0.038 | 0.052 |
| 2004 | 1.246 | 0.038 | 0.031 |
| 2005 | 1.491 | 0.013 | 0.009 |
| 2006 | 0.735 | 0.018 | 0.025 |
| 2007 | 0.712 | 0.067 | 0.094 |
| 2008 | 0.282 | 0.060 | 0.211 |
| 2009 | 1.158 | 0.195 | 0.169 |
| 2010 | 0.835 | 0.108 | 0.130 |
| 2011 | 0.739 | 0.139 | 0.188 |
| 2012 | 1.498 | 0.565 | 0.377 |
| 2013 | 1.169 | 0.138 | 0.118 |
| 2014 | 1.363 | 0.079 | 0.058 |
| 2015 | 2.150 | 0.135 | 0.063 |
| 2016 | 2.832 | 0.597 | 0.211 |
| 2017 | 0.895 | 0.189 | 0.211 |
| 2018 | 1.191 | 0.236 | 0.198 |
| 2019 | 1.788 | 0.082 | 0.046 |
| 2020 | 1.743 | 0.341 | 0.196 |
11 - Appendix B Swept area abundance indices
3.1 - Total area
| Age 0 | Age 1 | Age 2 | Age 3 | Age 4 | Age 5 | Age 6 | Age 7 | Age 8 | Age 9 | Age 10 | Age 11 | Age 12 | Age 13 | Age 14 | Age 15 | Age 16 | |
| 2003 | 6.253 | 5.298 | 3.531 | 4.329 | 5.087 | 3.391 | 2.719 | 0.999 | 0.577 | 0.271 | 0.043 | 0.002 | 0.016 | 0.010 | |||
| 2004 | 5.077 | 2.987 | 2.495 | 2.885 | 3.852 | 2.109 | 1.079 | 0.560 | 0.238 | 0.054 | 0.072 | 0.006 | 0.006 | ||||
| 2005 | 0.030 | 0.906 | 1.319 | 2.469 | 1.892 | 1.508 | 0.949 | 0.293 | 0.137 | 0.088 | 0.016 | 0.038 | |||||
| 2006 | 6.846 | 1.914 | 2.500 | 3.237 | 3.351 | 2.146 | 1.328 | 1.108 | 0.277 | 0.146 | 0.008 | 0.015 | |||||
| 2007 | 6.561 | 0.746 | 1.935 | 1.730 | 1.710 | 1.233 | 0.636 | 0.534 | 0.137 | 0.082 | 0.004 | 0.023 | 0.002 | ||||
| 2008 | 18.407 | 3.291 | 2.689 | 3.568 | 2.550 | 1.912 | 1.271 | 0.758 | 0.436 | 0.200 | 0.068 | 0.030 | 0.032 | 0.005 | 0.005 | ||
| 2009 | 3.670 | 6.757 | 2.715 | 4.221 | 4.487 | 2.045 | 1.147 | 0.803 | 0.615 | 0.256 | 0.081 | 0.092 | 0.005 | 0.002 | 0.006 | ||
| 2010 | 0.957 | 7.954 | 2.777 | 3.931 | 4.038 | 3.054 | 1.019 | 0.518 | 0.735 | 0.378 | 0.167 | 0.138 | 0.018 | 0.014 | 0.004 | 0.015 | |
| 2011 | 0.477 | 3.763 | 4.715 | 3.812 | 4.001 | 2.977 | 1.828 | 0.374 | 0.435 | 0.256 | 0.118 | 0.056 | 0.149 | 0.008 | |||
| 2012 | 0.400 | 5.463 | 3.970 | 5.075 | 3.391 | 2.092 | 1.341 | 1.001 | 0.504 | 0.225 | 0.210 | 0.046 | 0.029 | 0.043 | 0.017 | 0.002 | |
| 2013 | 0.944 | 7.727 | 4.770 | 2.383 | 3.144 | 2.867 | 2.217 | 1.493 | 0.685 | 0.297 | 0.121 | 0.184 | 0.107 | 0.004 | 0.006 | 0.003 | 0.005 |
| 2014 | 20.339 | 7.671 | 5.936 | 5.326 | 3.630 | 4.146 | 2.149 | 1.530 | 0.532 | 0.384 | 0.059 | 0.161 | 0.084 | 0.006 | 0.009 | 0.016 | 0.004 |
| 2015 | 0.383 | 6.573 | 6.861 | 5.286 | 4.975 | 2.616 | 2.173 | 0.986 | 0.543 | 0.481 | 0.122 | 0.053 | 0.041 | 0.002 | 0.006 | 0.002 | |
| 2016 | 3.288 | 4.156 | 5.075 | 5.112 | 3.051 | 2.384 | 0.908 | 0.876 | 0.494 | 0.259 | 0.093 | 0.093 | 0.017 | 0.013 | 0.020 | 0.006 | |
| 2017 | 6.268 | 0.849 | 3.209 | 2.733 | 1.805 | 1.395 | 0.882 | 0.395 | 0.254 | 0.171 | 0.043 | 0.090 | 0.018 | 0.006 | |||
| 2018 | 0.147 | 4.355 | 3.451 | 2.099 | 2.116 | 1.371 | 0.945 | 0.355 | 0.207 | 0.159 | 0.089 | 0.045 | 0.022 | 0.005 | 0.004 | 0.003 | |
| 2019 | 0.439 | 2.571 | 2.269 | 2.949 | 1.956 | 1.964 | 1.144 | 0.818 | 0.224 | 0.215 | 0.101 | 0.083 | 0.040 | 0.022 | 0.003 | 0.002 | 0.007 |
| 2020 | 0.081 | 0.616 | 1.372 | 1.819 | 1.736 | 1.137 | 0.589 | 0.323 | 0.208 | 0.076 | 0.026 | 0.041 | 0.004 | 0.003 |
| Age 0 | Age 1 | Age 2 | Age 3 | Age 4 | Age 5 | Age 6 | Age 7 | Age 8 | Age 9 | Age 10 | Age 11 | Age 12 | Age 13 | Age 14 | Age 15 | Age 16 | |
| 2003 | 0.286 | 0.229 | 0.219 | 0.147 | 0.133 | 0.107 | 0.104 | 0.220 | 0.282 | 0.232 | 0.684 | 1.760 | 0.886 | 0.867 | |||
| 2004 | 0.240 | 0.257 | 0.128 | 0.154 | 0.169 | 0.192 | 0.227 | 0.211 | 0.349 | 0.384 | 0.397 | 0.922 | 0.970 | ||||
| 2005 | 0.684 | 0.243 | 0.226 | 0.248 | 0.208 | 0.158 | 0.216 | 0.206 | 0.281 | 0.377 | 0.579 | 0.718 | |||||
| 2006 | 0.216 | 0.185 | 0.285 | 0.200 | 0.224 | 0.153 | 0.116 | 0.198 | 0.247 | 0.306 | 0.867 | 0.830 | |||||
| 2007 | 0.275 | 0.233 | 0.400 | 0.353 | 0.232 | 0.201 | 0.169 | 0.216 | 0.269 | 0.411 | 0.867 | 0.956 | 0.806 | ||||
| 2008 | 0.245 | 0.163 | 0.234 | 0.161 | 0.126 | 0.097 | 0.161 | 0.138 | 0.186 | 0.338 | 0.282 | 0.419 | 0.462 | 0.850 | 0.794 | ||
| 2009 | 0.621 | 0.157 | 0.137 | 0.176 | 0.126 | 0.123 | 0.150 | 0.136 | 0.214 | 0.234 | 0.334 | 0.340 | 1.282 | 1.353 | 0.477 | ||
| 2010 | 0.537 | 0.087 | 0.163 | 0.151 | 0.183 | 0.140 | 0.164 | 0.225 | 0.271 | 0.247 | 0.181 | 0.374 | 0.548 | 0.752 | 0.831 | 0.440 | |
| 2011 | 0.483 | 0.342 | 0.221 | 0.268 | 0.178 | 0.193 | 0.176 | 0.236 | 0.194 | 0.265 | 0.344 | 0.610 | 0.364 | 0.628 | |||
| 2012 | 0.620 | 0.128 | 0.297 | 0.211 | 0.138 | 0.181 | 0.164 | 0.165 | 0.223 | 0.220 | 0.197 | 0.258 | 0.429 | 0.564 | 0.652 | 0.771 | |
| 2013 | 0.519 | 0.123 | 0.145 | 0.177 | 0.218 | 0.205 | 0.225 | 0.282 | 0.177 | 0.307 | 0.353 | 0.477 | 0.405 | 0.872 | 0.641 | 0.806 | 0.682 |
| 2014 | 0.326 | 0.164 | 0.291 | 0.188 | 0.152 | 0.150 | 0.243 | 0.139 | 0.156 | 0.207 | 0.389 | 0.392 | 0.349 | 0.774 | 0.685 | 0.463 | 0.574 |
| 2015 | 0.620 | 0.154 | 0.127 | 0.192 | 0.244 | 0.265 | 0.200 | 0.286 | 0.185 | 0.182 | 0.236 | 0.400 | 0.274 | 0.897 | 0.448 | 1.203 | |
| 2016 | 0.495 | 0.198 | 0.122 | 0.122 | 0.095 | 0.087 | 0.131 | 0.153 | 0.201 | 0.205 | 0.287 | 0.315 | 0.420 | 0.669 | 0.564 | 1.066 | |
| 2017 | 0.512 | 0.271 | 0.183 | 0.152 | 0.139 | 0.087 | 0.159 | 0.178 | 0.261 | 0.270 | 0.273 | 0.391 | 0.534 | 0.731 | |||
| 2018 | 0.789 | 0.144 | 0.187 | 0.145 | 0.138 | 0.121 | 0.121 | 0.149 | 0.254 | 0.236 | 0.186 | 0.303 | 0.420 | 0.549 | 0.630 | 0.842 | |
| 2019 | 0.381 | 0.127 | 0.157 | 0.143 | 0.123 | 0.149 | 0.142 | 0.194 | 0.286 | 0.274 | 0.361 | 0.297 | 0.513 | 0.511 | 0.970 | 0.897 | 0.797 |
| 2020 | 0.740 | 0.260 | 0.118 | 0.121 | 0.116 | 0.127 | 0.144 | 0.144 | 0.220 | 0.387 | 0.381 | 0.276 | 0.837 | 0.813 |
| Age 0 | Age 1 | Age 2 | Age 3 | Age 4 | Age 5 | Age 6 | Age 7 | Age 8 | Age 9 | Age 10 | Age 11 | Age 12 | Age 13 | Age 14 | Age 15 | Age 16 | |
| 2003 | 0.059 | 0.444 | 1.422 | 3.546 | 6.782 | 7.575 | 9.209 | 4.858 | 3.188 | 1.839 | 0.460 | 0.003 | 0.280 | 0.257 | |||
| 2004 | 0.035 | 0.300 | 0.976 | 2.731 | 7.157 | 4.948 | 3.832 | 2.296 | 1.214 | 0.248 | 0.609 | 0.042 | 0.045 | ||||
| 2005 | 0.000 | 0.105 | 0.554 | 2.360 | 3.563 | 3.724 | 2.409 | 1.335 | 0.540 | 0.524 | 0.130 | 0.600 | |||||
| 2006 | 0.047 | 0.197 | 1.352 | 3.706 | 6.120 | 5.268 | 4.683 | 4.184 | 1.369 | 0.960 | 0.201 | 0.061 | |||||
| 2007 | 0.046 | 0.095 | 1.237 | 2.218 | 3.615 | 3.344 | 2.253 | 2.656 | 1.094 | 0.856 | 0.078 | 0.077 | 0.041 | ||||
| 2008 | 0.129 | 0.325 | 1.560 | 4.785 | 5.534 | 6.240 | 4.478 | 3.679 | 2.084 | 0.891 | 0.308 | 0.147 | 0.124 | 0.042 | 0.039 | ||
| 2009 | 0.026 | 0.497 | 1.027 | 4.394 | 8.242 | 5.397 | 4.156 | 3.320 | 2.575 | 1.197 | 0.402 | 0.511 | 0.015 | 0.005 | 0.053 | ||
| 2010 | 0.007 | 0.484 | 1.157 | 4.367 | 7.776 | 8.335 | 3.848 | 2.243 | 3.385 | 2.313 | 1.000 | 1.206 | 0.149 | 0.029 | 0.054 | 0.101 | |
| 2011 | 0.005 | 0.246 | 1.723 | 4.247 | 8.519 | 8.424 | 7.248 | 2.316 | 2.197 | 1.935 | 0.683 | 0.197 | 1.123 | 0.041 | |||
| 2012 | 0.003 | 0.425 | 1.349 | 5.044 | 6.842 | 6.441 | 4.708 | 4.271 | 2.868 | 1.501 | 1.468 | 0.197 | 0.178 | 0.254 | 0.121 | 0.008 | |
| 2013 | 0.011 | 0.638 | 1.868 | 2.284 | 6.150 | 8.462 | 9.972 | 6.377 | 4.333 | 1.699 | 0.700 | 1.331 | 1.302 | 0.020 | 0.050 | 0.042 | 0.086 |
| 2014 | 0.179 | 0.614 | 2.634 | 6.209 | 6.622 | 11.656 | 7.820 | 6.943 | 3.019 | 2.252 | 0.406 | 1.182 | 0.641 | 0.034 | 0.075 | 0.120 | 0.036 |
| 2015 | 0.002 | 0.517 | 3.110 | 6.432 | 10.737 | 7.299 | 7.537 | 4.454 | 3.416 | 2.772 | 0.841 | 0.545 | 0.180 | 0.023 | 0.065 | 0.019 | |
| 2016 | 0.022 | 0.280 | 1.891 | 5.894 | 6.053 | 7.885 | 3.441 | 3.994 | 3.241 | 1.915 | 0.566 | 0.888 | 0.090 | 0.055 | 0.184 | 0.054 | |
| 2017 | 0.031 | 0.074 | 1.561 | 2.963 | 3.482 | 4.457 | 3.505 | 1.721 | 1.842 | 1.152 | 0.250 | 0.976 | 0.097 | 0.085 | |||
| 2018 | 0.001 | 0.249 | 1.779 | 2.333 | 4.184 | 4.289 | 3.516 | 2.017 | 1.285 | 1.218 | 0.623 | 0.212 | 0.098 | 0.039 | 0.074 | 0.023 | |
| 2019 | 0.004 | 0.170 | 0.836 | 3.480 | 4.190 | 6.171 | 4.676 | 3.822 | 1.039 | 1.523 | 0.680 | 0.712 | 0.357 | 0.168 | 0.027 | 0.028 | 0.047 |
| 2020 | 0.001 | 0.045 | 0.545 | 1.897 | 3.305 | 3.578 | 2.051 | 1.805 | 1.296 | 0.548 | 0.158 | 0.376 | 0.023 | 0.024 |
| Age 0 | Age 1 | Age 2 | Age 3 | Age 4 | Age 5 | Age 6 | Age 7 | Age 8 | Age 9 | Age 10 | Age 11 | Age 12 | Age 13 | Age 14 | Age 15 | Age 16 | |
| 2003 | 9.69 | 19.86 | 34.62 | 44.13 | 51.43 | 60.37 | 69.24 | 77.02 | 77.79 | 83.29 | 95.32 | 61.06 | 118.78 | 143.00 | |||
| 2004 | 8.97 | 21.32 | 33.97 | 44.88 | 56.38 | 60.30 | 69.51 | 72.16 | 76.45 | 74.73 | 85.78 | 87.83 | 88.94 | ||||
| 2005 | 10.97 | 22.58 | 34.77 | 45.23 | 56.19 | 61.91 | 62.55 | 73.38 | 73.35 | 79.01 | 90.27 | 107.44 | |||||
| 2006 | 9.38 | 21.82 | 37.77 | 48.09 | 56.62 | 61.73 | 69.12 | 69.81 | 75.40 | 85.66 | 125.00 | 76.00 | |||||
| 2007 | 9.20 | 22.55 | 39.17 | 49.46 | 58.43 | 63.90 | 69.13 | 75.48 | 89.59 | 95.22 | 116.00 | 65.07 | 123.00 | ||||
| 2008 | 9.16 | 21.76 | 38.19 | 51.09 | 59.41 | 68.28 | 69.74 | 75.52 | 74.14 | 72.32 | 74.63 | 75.35 | 72.40 | 100.00 | 89.00 | ||
| 2009 | 8.66 | 19.63 | 33.16 | 46.77 | 56.59 | 64.32 | 70.88 | 73.50 | 72.55 | 75.67 | 76.48 | 77.81 | 68.97 | 72.98 | 94.96 | ||
| 2010 | 9.59 | 18.17 | 34.72 | 47.50 | 56.93 | 63.86 | 71.93 | 73.91 | 74.50 | 82.06 | 82.01 | 88.38 | 87.68 | 61.46 | 104.00 | 85.23 | |
| 2011 | 10.24 | 19.25 | 33.54 | 48.18 | 59.34 | 65.19 | 71.74 | 82.77 | 77.55 | 85.42 | 80.34 | 73.91 | 88.09 | 75.38 | |||
| 2012 | 9.39 | 20.46 | 32.48 | 46.80 | 59.04 | 66.77 | 70.76 | 74.60 | 80.30 | 84.34 | 85.31 | 76.60 | 82.78 | 85.38 | 90.46 | 79.00 | |
| 2013 | 10.94 | 20.52 | 34.29 | 46.17 | 58.60 | 67.36 | 75.98 | 75.66 | 83.17 | 83.43 | 80.71 | 86.66 | 102.07 | 74.29 | 88.25 | 113.00 | 125.00 |
| 2014 | 10.05 | 20.36 | 35.64 | 49.14 | 56.94 | 65.78 | 71.85 | 77.13 | 81.66 | 81.48 | 84.80 | 87.93 | 85.79 | 83.56 | 85.01 | 86.50 | 93.40 |
| 2015 | 8.42 | 20.25 | 35.43 | 49.97 | 60.45 | 66.47 | 70.53 | 76.83 | 83.94 | 79.66 | 85.60 | 89.93 | 72.35 | 95.00 | 98.40 | 101.56 | |
| 2016 | 9.30 | 19.09 | 33.58 | 48.49 | 58.81 | 69.78 | 73.30 | 76.15 | 85.26 | 88.16 | 83.07 | 90.66 | 81.80 | 78.15 | 97.36 | 96.42 | |
| 2017 | 8.05 | 21.43 | 36.63 | 47.83 | 58.27 | 68.42 | 73.93 | 76.04 | 87.70 | 84.72 | 82.68 | 98.12 | 84.10 | 110.37 | |||
| 2018 | 10.11 | 17.66 | 37.16 | 48.17 | 58.95 | 68.27 | 71.52 | 82.27 | 85.86 | 89.11 | 88.21 | 78.40 | 77.58 | 86.91 | 120.15 | 93.00 | |
| 2019 | 9.97 | 19.70 | 33.51 | 49.13 | 59.79 | 68.59 | 74.86 | 77.86 | 78.44 | 85.97 | 86.19 | 93.47 | 92.04 | 92.37 | 96.34 | 109.00 | 96.04 |
| 2020 | 10.87 | 20.08 | 33.69 | 46.58 | 57.53 | 67.30 | 70.99 | 80.67 | 83.40 | 87.60 | 84.22 | 91.99 | 83.98 | 93.41 |
| Age 0 | Age 1 | Age 2 | Age 3 | Age 4 | Age 5 | Age 6 | Age 7 | Age 8 | Age 9 | Age 10 | Age 11 | Age 12 | Age 13 | Age 14 | Age 15 | Age 16 | |
| 2003 | 9 | 80 | 400 | 819 | 1332 | 2233 | 3379 | 4761 | 5346 | 6805 | 9921 | 2033 | 17080 | 25600 | |||
| 2004 | 7 | 98 | 391 | 945 | 1852 | 2350 | 3563 | 4100 | 5035 | 4538 | 7973 | 7865 | 7130 | ||||
| 2005 | 14 | 115 | 417 | 955 | 1884 | 2462 | 2553 | 4462 | 3959 | 5552 | 8077 | 14845 | |||||
| 2006 | 7 | 103 | 537 | 1140 | 1819 | 2457 | 3528 | 3824 | 4901 | 6596 | 25080 | 4220 | |||||
| 2007 | 7 | 125 | 659 | 1321 | 2135 | 2714 | 3540 | 4935 | 7953 | 10119 | 17480 | 3485 | 21100 | ||||
| 2008 | 7 | 99 | 575 | 1339 | 2167 | 3265 | 3524 | 4849 | 4770 | 4493 | 4541 | 5040 | 4114 | 9250 | 8520 | ||
| 2009 | 9 | 74 | 379 | 1040 | 1838 | 2638 | 3629 | 4138 | 4190 | 4700 | 5112 | 5553 | 3082 | 3122 | 9681 | ||
| 2010 | 7 | 61 | 418 | 1111 | 1924 | 2730 | 3772 | 4343 | 4720 | 6084 | 5958 | 8337 | 7793 | 2120 | 12154 | 6475 | |
| 2011 | 10 | 64 | 366 | 1123 | 2139 | 2853 | 3957 | 6170 | 5047 | 7495 | 5668 | 4111 | 7567 | 4653 | |||
| 2012 | 7 | 78 | 335 | 995 | 2013 | 3064 | 3499 | 4275 | 5585 | 6622 | 6957 | 4411 | 6173 | 6953 | 7006 | 4630 | |
| 2013 | 12 | 83 | 389 | 960 | 1962 | 2954 | 4424 | 4270 | 6290 | 5632 | 5543 | 7587 | 12149 | 5104 | 7738 | 16220 | 16300 |
| 2014 | 9 | 80 | 442 | 1168 | 1825 | 2813 | 3629 | 4533 | 5684 | 5840 | 6604 | 7543 | 7420 | 5313 | 7920 | 8237 | 8263 |
| 2015 | 4 | 78 | 453 | 1212 | 2149 | 2818 | 3480 | 4558 | 6243 | 5795 | 6695 | 9301 | 4334 | 10170 | 10132 | 11296 | |
| 2016 | 7 | 68 | 371 | 1152 | 1982 | 3309 | 3793 | 4555 | 6535 | 7434 | 6152 | 9403 | 5218 | 4791 | 9660 | 8325 | |
| 2017 | 5 | 88 | 486 | 1086 | 1932 | 3193 | 3975 | 4369 | 7099 | 6769 | 5913 | 10482 | 5300 | 13790 | |||
| 2018 | 6 | 57 | 512 | 1109 | 1975 | 3125 | 3719 | 5692 | 6216 | 7726 | 6947 | 4781 | 4564 | 8512 | 18477 | 7350 | |
| 2019 | 9 | 66 | 368 | 1181 | 2139 | 3130 | 4085 | 4660 | 4640 | 7008 | 6731 | 8592 | 8869 | 7996 | 9585 | 12345 | 7040 |
| 2020 | 7 | 75 | 397 | 1041 | 1901 | 3140 | 3482 | 5579 | 6216 | 7095 | 6372 | 9186 | 5165 | 8589 |
| Index_2plus | SD_2plus | CV_2plus | |
| 2003 | 20.974 | 2.403 | 0.115 |
| 2004 | 13.357 | 1.682 | 0.126 |
| 2005 | 8.710 | 1.572 | 0.180 |
| 2006 | 14.114 | 2.250 | 0.159 |
| 2007 | 8.027 | 2.061 | 0.257 |
| 2008 | 13.522 | 1.587 | 0.117 |
| 2009 | 16.474 | 1.656 | 0.101 |
| 2010 | 16.805 | 2.140 | 0.127 |
| 2011 | 18.730 | 3.101 | 0.166 |
| 2012 | 17.947 | 2.661 | 0.148 |
| 2013 | 18.286 | 2.434 | 0.133 |
| 2014 | 23.973 | 4.084 | 0.170 |
| 2015 | 24.148 | 3.592 | 0.149 |
| 2016 | 18.404 | 1.537 | 0.084 |
| 2017 | 11.001 | 1.331 | 0.121 |
| 2018 | 10.871 | 1.211 | 0.111 |
| 2019 | 11.798 | 1.076 | 0.091 |
| 2020 | 7.335 | 0.567 | 0.077 |
3.2 - Subarea A: North of 67°N
| Age 0 | Age 1 | Age 2 | Age 3 | Age 4 | Age 5 | Age 6 | Age 7 | Age 8 | Age 9 | Age 10 | Age 11 | Age 12 | Age 13 | Age 14 | Age 15 | Age 16 | |
| 2003 | 6.238 | 5.254 | 3.268 | 3.763 | 4.521 | 2.700 | 2.319 | 0.863 | 0.489 | 0.220 | 0.042 | 0.001 | 0.016 | 0.010 | |||
| 2004 | 4.997 | 2.837 | 2.201 | 2.396 | 2.602 | 1.463 | 0.722 | 0.359 | 0.181 | 0.046 | 0.050 | 0.006 | 0.006 | ||||
| 2005 | 0.026 | 0.665 | 1.042 | 1.988 | 1.478 | 1.268 | 0.746 | 0.157 | 0.107 | 0.068 | 0.016 | 0.038 | |||||
| 2006 | 5.896 | 1.802 | 2.156 | 2.623 | 2.946 | 1.554 | 1.026 | 0.941 | 0.171 | 0.107 | 0.008 | 0.015 | |||||
| 2007 | 6.561 | 0.446 | 0.911 | 0.853 | 1.071 | 0.789 | 0.465 | 0.394 | 0.114 | 0.075 | 0.004 | 0.022 | 0.002 | ||||
| 2008 | 15.128 | 2.463 | 1.822 | 2.795 | 1.883 | 1.419 | 1.145 | 0.580 | 0.348 | 0.161 | 0.052 | 0.011 | 0.021 | 0.005 | 0.005 | ||
| 2009 | 3.454 | 6.642 | 2.251 | 3.570 | 3.716 | 1.584 | 0.868 | 0.712 | 0.466 | 0.204 | 0.076 | 0.072 | 0.004 | 0.002 | 0.006 | ||
| 2010 | 0.424 | 7.412 | 2.353 | 3.268 | 3.385 | 2.397 | 0.784 | 0.383 | 0.733 | 0.317 | 0.151 | 0.137 | 0.018 | 0.002 | 0.004 | 0.015 | |
| 2011 | 0.308 | 2.322 | 3.471 | 2.498 | 2.866 | 2.095 | 1.445 | 0.292 | 0.315 | 0.213 | 0.116 | 0.055 | 0.130 | 0.008 | |||
| 2012 | 0.388 | 4.299 | 3.218 | 4.485 | 2.784 | 1.537 | 1.042 | 0.930 | 0.411 | 0.200 | 0.209 | 0.046 | 0.029 | 0.043 | 0.017 | 0.002 | |
| 2013 | 0.486 | 6.382 | 4.101 | 1.706 | 2.666 | 1.887 | 1.575 | 0.890 | 0.578 | 0.297 | 0.110 | 0.184 | 0.107 | 0.004 | 0.006 | 0.003 | 0.005 |
| 2014 | 9.259 | 5.696 | 5.448 | 4.026 | 3.034 | 3.521 | 2.016 | 1.388 | 0.465 | 0.364 | 0.059 | 0.159 | 0.083 | 0.006 | 0.009 | 0.016 | 0.004 |
| 2015 | 0.381 | 4.298 | 4.733 | 4.154 | 3.727 | 2.068 | 1.818 | 0.902 | 0.506 | 0.397 | 0.119 | 0.053 | 0.040 | 0.002 | 0.006 | 0.002 | |
| 2016 | 3.233 | 3.944 | 4.433 | 4.522 | 2.610 | 1.995 | 0.746 | 0.735 | 0.413 | 0.203 | 0.067 | 0.093 | 0.017 | 0.005 | 0.020 | 0.006 | |
| 2017 | 6.268 | 0.768 | 2.891 | 2.407 | 1.563 | 1.151 | 0.715 | 0.308 | 0.200 | 0.147 | 0.043 | 0.090 | 0.018 | 0.006 | |||
| 2018 | 0.135 | 4.070 | 3.197 | 1.916 | 1.879 | 1.049 | 0.748 | 0.323 | 0.183 | 0.128 | 0.089 | 0.045 | 0.022 | 0.005 | 0.004 | 0.003 | |
| 2019 | 0.148 | 2.234 | 2.114 | 2.470 | 1.508 | 1.460 | 0.839 | 0.490 | 0.148 | 0.129 | 0.075 | 0.069 | 0.035 | 0.021 | 0.003 | 0.002 | 0.007 |
| 2020 | 0.066 | 0.571 | 1.149 | 1.520 | 1.367 | 0.861 | 0.499 | 0.210 | 0.129 | 0.042 | 0.025 | 0.040 | 0.004 | 0.003 |
| Age 0 | Age 1 | Age 2 | Age 3 | Age 4 | Age 5 | Age 6 | Age 7 | Age 8 | Age 9 | Age 10 | Age 11 | Age 12 | Age 13 | Age 14 | Age 15 | Age 16 | |
| 2003 | 0.287 | 0.231 | 0.230 | 0.159 | 0.140 | 0.120 | 0.116 | 0.244 | 0.319 | 0.245 | 0.691 | 0.941 | 0.886 | 0.867 | |||
| 2004 | 0.240 | 0.274 | 0.158 | 0.158 | 0.161 | 0.209 | 0.205 | 0.234 | 0.344 | 0.399 | 0.374 | 0.922 | 0.970 | ||||
| 2005 | 0.611 | 0.208 | 0.282 | 0.295 | 0.220 | 0.160 | 0.248 | 0.241 | 0.254 | 0.452 | 0.579 | 0.718 | |||||
| 2006 | 0.248 | 0.199 | 0.336 | 0.242 | 0.257 | 0.174 | 0.129 | 0.244 | 0.299 | 0.339 | 0.867 | 0.830 | |||||
| 2007 | 0.275 | 0.226 | 0.276 | 0.295 | 0.180 | 0.170 | 0.153 | 0.238 | 0.306 | 0.443 | 0.867 | 0.915 | 0.806 | ||||
| 2008 | 0.192 | 0.150 | 0.263 | 0.214 | 0.126 | 0.109 | 0.169 | 0.152 | 0.202 | 0.365 | 0.356 | 0.346 | 0.586 | 0.850 | 0.794 | ||
| 2009 | 0.658 | 0.160 | 0.160 | 0.182 | 0.144 | 0.135 | 0.179 | 0.147 | 0.207 | 0.244 | 0.273 | 0.407 | 0.682 | 0.844 | 0.477 | ||
| 2010 | 0.476 | 0.087 | 0.157 | 0.192 | 0.212 | 0.163 | 0.180 | 0.258 | 0.271 | 0.213 | 0.161 | 0.373 | 0.518 | 0.872 | 0.831 | 0.440 | |
| 2011 | 0.408 | 0.203 | 0.242 | 0.267 | 0.186 | 0.230 | 0.173 | 0.246 | 0.230 | 0.232 | 0.353 | 0.597 | 0.366 | 0.628 | |||
| 2012 | 0.631 | 0.091 | 0.374 | 0.237 | 0.132 | 0.116 | 0.127 | 0.160 | 0.174 | 0.230 | 0.196 | 0.258 | 0.429 | 0.564 | 0.652 | 0.771 | |
| 2013 | 0.663 | 0.137 | 0.170 | 0.148 | 0.231 | 0.199 | 0.213 | 0.164 | 0.172 | 0.307 | 0.385 | 0.477 | 0.405 | 0.872 | 0.641 | 0.806 | 0.682 |
| 2014 | 0.411 | 0.166 | 0.303 | 0.166 | 0.165 | 0.172 | 0.262 | 0.141 | 0.154 | 0.221 | 0.389 | 0.394 | 0.348 | 0.774 | 0.685 | 0.453 | 0.574 |
| 2015 | 0.624 | 0.188 | 0.174 | 0.184 | 0.271 | 0.294 | 0.220 | 0.300 | 0.190 | 0.188 | 0.230 | 0.402 | 0.174 | 0.897 | 0.448 | 1.203 | |
| 2016 | 0.499 | 0.197 | 0.126 | 0.134 | 0.104 | 0.093 | 0.130 | 0.158 | 0.237 | 0.202 | 0.196 | 0.315 | 0.420 | 0.527 | 0.564 | 1.066 | |
| 2017 | 0.512 | 0.297 | 0.195 | 0.169 | 0.155 | 0.092 | 0.174 | 0.184 | 0.385 | 0.297 | 0.273 | 0.391 | 0.534 | 0.731 | |||
| 2018 | 0.805 | 0.146 | 0.186 | 0.156 | 0.151 | 0.125 | 0.109 | 0.153 | 0.269 | 0.189 | 0.185 | 0.303 | 0.420 | 0.545 | 0.630 | 0.842 | |
| 2019 | 0.595 | 0.149 | 0.155 | 0.161 | 0.128 | 0.102 | 0.094 | 0.122 | 0.173 | 0.247 | 0.304 | 0.220 | 0.418 | 0.437 | 0.970 | 0.897 | 0.797 |
| 2020 | 0.814 | 0.271 | 0.131 | 0.139 | 0.124 | 0.152 | 0.148 | 0.151 | 0.234 | 0.329 | 0.375 | 0.267 | 0.823 | 0.706 |
| Age 0 | Age 1 | Age 2 | Age 3 | Age 4 | Age 5 | Age 6 | Age 7 | Age 8 | Age 9 | Age 10 | Age 11 | Age 12 | Age 13 | Age 14 | Age 15 | Age 16 | |
| 2003 | 0.059 | 0.441 | 1.309 | 2.981 | 5.981 | 5.664 | 7.962 | 4.249 | 2.840 | 1.442 | 0.453 | 0.002 | 0.280 | 0.257 | |||
| 2004 | 0.035 | 0.287 | 0.834 | 2.192 | 4.133 | 3.134 | 2.433 | 1.425 | 1.066 | 0.177 | 0.214 | 0.042 | 0.045 | ||||
| 2005 | 0.000 | 0.067 | 0.455 | 1.676 | 2.424 | 2.851 | 1.689 | 0.577 | 0.441 | 0.467 | 0.130 | 0.600 | |||||
| 2006 | 0.039 | 0.181 | 1.157 | 3.060 | 5.387 | 3.748 | 3.916 | 3.379 | 0.683 | 0.752 | 0.201 | 0.061 | |||||
| 2007 | 0.046 | 0.042 | 0.583 | 1.135 | 2.270 | 2.186 | 1.667 | 2.111 | 0.942 | 0.812 | 0.078 | 0.075 | 0.041 | ||||
| 2008 | 0.105 | 0.243 | 0.865 | 3.573 | 3.734 | 4.699 | 3.993 | 2.929 | 1.845 | 0.743 | 0.246 | 0.043 | 0.095 | 0.042 | 0.039 | ||
| 2009 | 0.023 | 0.482 | 0.744 | 3.412 | 6.385 | 4.067 | 3.210 | 2.919 | 2.026 | 0.854 | 0.387 | 0.428 | 0.013 | 0.005 | 0.053 | ||
| 2010 | 0.004 | 0.423 | 0.937 | 3.410 | 6.240 | 6.423 | 3.067 | 1.606 | 3.382 | 1.945 | 0.926 | 1.204 | 0.149 | 0.006 | 0.054 | 0.101 | |
| 2011 | 0.003 | 0.133 | 1.312 | 2.732 | 6.143 | 5.850 | 5.185 | 1.517 | 1.607 | 1.519 | 0.679 | 0.194 | 0.933 | 0.041 | |||
| 2012 | 0.003 | 0.309 | 1.105 | 4.272 | 5.579 | 4.475 | 3.593 | 3.946 | 1.939 | 1.145 | 1.466 | 0.197 | 0.178 | 0.254 | 0.121 | 0.008 | |
| 2013 | 0.005 | 0.534 | 1.662 | 1.713 | 5.321 | 5.893 | 5.866 | 3.591 | 3.093 | 1.699 | 0.673 | 1.331 | 1.302 | 0.020 | 0.050 | 0.042 | 0.086 |
| 2014 | 0.074 | 0.454 | 2.257 | 4.761 | 5.729 | 9.852 | 7.328 | 6.114 | 2.715 | 2.126 | 0.406 | 1.179 | 0.639 | 0.034 | 0.075 | 0.119 | 0.036 |
| 2015 | 0.002 | 0.337 | 2.282 | 5.151 | 8.598 | 5.904 | 6.803 | 4.167 | 3.300 | 2.186 | 0.831 | 0.544 | 0.176 | 0.023 | 0.065 | 0.019 | |
| 2016 | 0.021 | 0.263 | 1.669 | 5.006 | 5.353 | 6.663 | 3.002 | 3.617 | 2.682 | 1.347 | 0.476 | 0.888 | 0.090 | 0.027 | 0.184 | 0.054 | |
| 2017 | 0.031 | 0.067 | 1.339 | 2.470 | 2.994 | 3.707 | 2.883 | 1.438 | 1.415 | 0.961 | 0.250 | 0.976 | 0.097 | 0.085 | |||
| 2018 | 0.001 | 0.242 | 1.694 | 2.127 | 3.711 | 3.143 | 2.776 | 1.840 | 1.115 | 1.096 | 0.623 | 0.211 | 0.098 | 0.039 | 0.074 | 0.023 | |
| 2019 | 0.001 | 0.143 | 0.790 | 2.681 | 2.890 | 4.449 | 3.301 | 2.317 | 0.724 | 0.883 | 0.553 | 0.641 | 0.337 | 0.162 | 0.027 | 0.028 | 0.047 |
| 2020 | 0.000 | 0.042 | 0.352 | 1.419 | 2.627 | 2.548 | 1.726 | 1.055 | 0.832 | 0.317 | 0.157 | 0.372 | 0.022 | 0.023 |
| Age 0 | Age 1 | Age 2 | Age 3 | Age 4 | Age 5 | Age 6 | Age 7 | Age 8 | Age 9 | Age 10 | Age 11 | Age 12 | Age 13 | Age 14 | Age 15 | Age 16 | |
| 2003 | 9.69 | 19.86 | 34.52 | 43.95 | 51.38 | 59.50 | 69.59 | 77.30 | 78.67 | 82.01 | 95.43 | 61.05 | 118.78 | 143.00 | |||
| 2004 | 8.98 | 21.36 | 33.66 | 44.33 | 54.01 | 59.14 | 68.71 | 71.61 | 79.70 | 71.48 | 73.81 | 87.83 | 88.94 | ||||
| 2005 | 10.96 | 21.73 | 35.51 | 44.17 | 54.42 | 60.43 | 60.45 | 71.41 | 74.38 | 83.28 | 90.27 | 107.44 | |||||
| 2006 | 9.29 | 21.60 | 37.56 | 48.50 | 56.86 | 61.62 | 70.83 | 69.49 | 71.54 | 87.71 | 125.00 | 76.00 | |||||
| 2007 | 9.20 | 20.57 | 38.99 | 50.03 | 58.86 | 63.84 | 69.77 | 76.79 | 89.42 | 95.97 | 116.00 | 65.20 | 123.00 | ||||
| 2008 | 9.21 | 21.88 | 36.48 | 50.50 | 58.37 | 68.79 | 69.74 | 76.98 | 76.30 | 74.10 | 75.26 | 71.91 | 74.37 | 100.00 | 89.00 | ||
| 2009 | 8.31 | 19.55 | 32.28 | 45.69 | 55.67 | 64.07 | 71.00 | 73.52 | 72.96 | 73.82 | 76.91 | 79.39 | 69.00 | 73.00 | 94.96 | ||
| 2010 | 10.54 | 17.93 | 34.24 | 46.78 | 56.25 | 63.65 | 73.25 | 73.24 | 74.52 | 81.68 | 81.95 | 88.49 | 87.77 | 60.09 | 104.00 | 85.23 | |
| 2011 | 10.39 | 18.66 | 34.05 | 48.06 | 59.55 | 65.11 | 70.59 | 78.70 | 79.45 | 83.87 | 80.60 | 74.00 | 86.43 | 75.38 | |||
| 2012 | 9.35 | 19.99 | 32.61 | 46.25 | 58.88 | 65.58 | 70.11 | 74.24 | 76.02 | 81.24 | 85.38 | 76.60 | 82.78 | 85.38 | 90.46 | 79.00 | |
| 2013 | 10.64 | 20.68 | 34.70 | 46.99 | 59.21 | 68.33 | 73.12 | 74.04 | 80.24 | 83.43 | 82.22 | 86.66 | 102.07 | 74.29 | 88.25 | 113.00 | 125.00 |
| 2014 | 9.28 | 20.37 | 34.99 | 49.60 | 57.77 | 65.93 | 71.85 | 76.62 | 82.41 | 81.31 | 84.80 | 88.16 | 85.85 | 83.56 | 85.01 | 86.51 | 93.40 |
| 2015 | 8.41 | 20.00 | 36.42 | 50.33 | 62.01 | 67.46 | 72.79 | 77.52 | 85.01 | 79.01 | 85.87 | 90.02 | 72.48 | 95.00 | 98.40 | 101.56 | |
| 2016 | 9.26 | 19.08 | 33.66 | 48.12 | 59.56 | 70.51 | 74.95 | 78.42 | 85.00 | 85.34 | 86.21 | 90.66 | 81.80 | 81.11 | 97.36 | 96.42 | |
| 2017 | 8.05 | 21.43 | 36.14 | 47.20 | 58.11 | 68.93 | 74.45 | 78.57 | 86.22 | 83.86 | 82.68 | 98.12 | 84.10 | 110.37 | |||
| 2018 | 10.09 | 18.05 | 37.50 | 48.27 | 59.09 | 67.72 | 71.64 | 82.25 | 85.73 | 92.34 | 88.22 | 78.41 | 77.58 | 86.93 | 120.15 | 93.00 | |
| 2019 | 9.35 | 19.56 | 33.76 | 48.32 | 58.51 | 68.48 | 74.41 | 78.87 | 80.57 | 86.10 | 89.59 | 95.89 | 92.88 | 92.56 | 96.34 | 109.00 | 96.04 |
| 2020 | 10.63 | 19.97 | 31.82 | 45.34 | 57.86 | 66.46 | 71.26 | 79.10 | 84.74 | 88.11 | 84.37 | 92.13 | 84.00 | 93.58 |
| Age 0 | Age 1 | Age 2 | Age 3 | Age 4 | Age 5 | Age 6 | Age 7 | Age 8 | Age 9 | Age 10 | Age 11 | Age 12 | Age 13 | Age 14 | Age 15 | Age 16 | |
| 2003 | 9 | 80 | 397 | 791 | 1322 | 2098 | 3421 | 4774 | 5559 | 6519 | 9954 | 2033 | 17080 | 25600 | |||
| 2004 | 7 | 98 | 378 | 913 | 1588 | 2154 | 3373 | 3942 | 5693 | 3751 | 4183 | 7865 | 7130 | ||||
| 2005 | 14 | 101 | 431 | 843 | 1649 | 2249 | 2277 | 3662 | 4139 | 6331 | 8077 | 14845 | |||||
| 2006 | 7 | 100 | 529 | 1162 | 1816 | 2410 | 3822 | 3645 | 4026 | 7059 | 25080 | 4220 | |||||
| 2007 | 7 | 94 | 629 | 1312 | 2113 | 2762 | 3581 | 5277 | 8139 | 10381 | 17480 | 3523 | 21100 | ||||
| 2008 | 7 | 99 | 470 | 1272 | 1985 | 3314 | 3489 | 5036 | 5253 | 4742 | 4719 | 3796 | 4960 | 9250 | 8520 | ||
| 2009 | 8 | 73 | 331 | 953 | 1719 | 2567 | 3703 | 4102 | 4347 | 4217 | 5204 | 5874 | 3084 | 3122 | 9681 | ||
| 2010 | 9 | 57 | 399 | 1043 | 1840 | 2685 | 3902 | 4217 | 4724 | 6131 | 6111 | 8362 | 7813 | 2635 | 12154 | 6475 | |
| 2011 | 10 | 57 | 377 | 1091 | 2153 | 2814 | 3589 | 5181 | 5110 | 7083 | 5714 | 4122 | 7288 | 4653 | |||
| 2012 | 7 | 72 | 336 | 954 | 2004 | 2911 | 3449 | 4248 | 4712 | 5714 | 6970 | 4411 | 6173 | 6953 | 7006 | 4630 | |
| 2013 | 12 | 84 | 402 | 1004 | 2003 | 3119 | 3724 | 4042 | 5371 | 5632 | 5803 | 7587 | 12149 | 5104 | 7738 | 16220 | 16300 |
| 2014 | 8 | 80 | 411 | 1179 | 1887 | 2802 | 3623 | 4402 | 5840 | 5812 | 6604 | 7585 | 7436 | 5313 | 7920 | 8240 | 8263 |
| 2015 | 4 | 78 | 480 | 1232 | 2287 | 2891 | 3756 | 4679 | 6466 | 5492 | 6759 | 9330 | 4369 | 10170 | 10132 | 11296 | |
| 2016 | 7 | 67 | 375 | 1104 | 2049 | 3340 | 4025 | 4916 | 6451 | 6672 | 7009 | 9403 | 5218 | 5602 | 9660 | 8325 | |
| 2017 | 5 | 88 | 462 | 1027 | 1919 | 3218 | 4031 | 4685 | 6872 | 6553 | 5913 | 10482 | 5300 | 13790 | |||
| 2018 | 6 | 60 | 526 | 1106 | 1974 | 2996 | 3712 | 5699 | 6147 | 8461 | 6949 | 4782 | 4564 | 8517 | 18477 | 7350 | |
| 2019 | 10 | 64 | 373 | 1085 | 1918 | 3053 | 3936 | 4721 | 4906 | 6788 | 7312 | 9241 | 9115 | 8042 | 9585 | 12345 | 7040 |
| 2020 | 7 | 75 | 307 | 931 | 1918 | 2942 | 3455 | 5006 | 6451 | 7429 | 6405 | 9235 | 5165 | 8634 |
| Index_2plus | SD_2plus | CV_2plus | |
| 2003 | 18.212 | 2.288 | 0.126 |
| 2004 | 10.031 | 1.221 | 0.122 |
| 2005 | 6.908 | 1.427 | 0.207 |
| 2006 | 11.547 | 2.317 | 0.201 |
| 2007 | 4.700 | 0.828 | 0.176 |
| 2008 | 10.247 | 1.417 | 0.138 |
| 2009 | 13.530 | 1.397 | 0.103 |
| 2010 | 13.947 | 2.003 | 0.144 |
| 2011 | 13.505 | 2.247 | 0.166 |
| 2012 | 14.952 | 2.514 | 0.168 |
| 2013 | 14.120 | 1.813 | 0.128 |
| 2014 | 20.602 | 3.586 | 0.174 |
| 2015 | 18.528 | 2.987 | 0.161 |
| 2016 | 15.865 | 1.324 | 0.083 |
| 2017 | 9.540 | 1.262 | 0.132 |
| 2018 | 9.591 | 1.087 | 0.113 |
| 2019 | 9.368 | 0.877 | 0.094 |
| 2020 | 5.848 | 0.493 | 0.084 |
3.3 - Subarea B: Between 65° and 67°N
| Age 0 | Age 1 | Age 2 | Age 3 | Age 4 | Age 5 | Age 6 | Age 7 | Age 8 | Age 9 | Age 10 | Age 11 | Age 12 | Age 13 | Age 14 | Age 15 | Age 16 | |
| 2003 | 0.015 | 0.054 | 0.235 | 0.479 | 0.344 | 0.296 | 0.161 | 0.073 | 0.049 | 0.013 | 0.000 | 0.002 | 0.000 | 0.000 | |||
| 2004 | 0.026 | 0.094 | 0.315 | 0.350 | 0.567 | 0.345 | 0.207 | 0.095 | 0.061 | 0.004 | 0.021 | 0.000 | 0.000 | ||||
| 2005 | 0.004 | 0.049 | 0.186 | 0.275 | 0.153 | 0.152 | 0.075 | 0.073 | 0.013 | 0.020 | 0.001 | 0.000 | |||||
| 2006 | 0.106 | 0.119 | 0.248 | 0.499 | 0.275 | 0.317 | 0.254 | 0.159 | 0.035 | 0.038 | 0.000 | 0.000 | |||||
| 2007 | 0.008 | 0.245 | 0.912 | 0.696 | 0.500 | 0.309 | 0.183 | 0.069 | 0.002 | 0.001 | 0.000 | 0.001 | 0.000 | ||||
| 2008 | 0.443 | 0.341 | 0.517 | 0.574 | 0.376 | 0.369 | 0.105 | 0.119 | 0.086 | 0.030 | 0.015 | 0.012 | 0.011 | 0.000 | 0.000 | ||
| 2009 | 0.216 | 0.131 | 0.457 | 0.440 | 0.548 | 0.250 | 0.202 | 0.058 | 0.148 | 0.053 | 0.003 | 0.012 | 0.000 | 0.000 | 0.000 | ||
| 2010 | 0.031 | 0.595 | 0.514 | 0.484 | 0.442 | 0.527 | 0.225 | 0.141 | 0.008 | 0.024 | 0.026 | 0.001 | 0.002 | 0.012 | 0.000 | 0.000 | |
| 2011 | 0.170 | 1.487 | 1.216 | 1.124 | 0.871 | 0.562 | 0.221 | 0.017 | 0.045 | 0.011 | 0.006 | 0.001 | 0.019 | 0.000 | |||
| 2012 | 0.012 | 1.248 | 1.001 | 0.509 | 0.396 | 0.359 | 0.107 | 0.055 | 0.013 | 0.030 | 0.010 | 0.011 | 0.002 | 0.005 | 0.000 | 0.002 | |
| 2013 | 0.326 | 1.070 | 0.669 | 0.689 | 0.462 | 0.604 | 0.212 | 0.078 | 0.009 | 0.005 | 0.012 | 0.001 | 0.003 | 0.000 | 0.000 | 0.000 | 0.000 |
| 2014 | 10.944 | 1.749 | 0.341 | 1.019 | 0.350 | 0.242 | 0.048 | 0.071 | 0.049 | 0.039 | 0.003 | 0.000 | 0.007 | 0.001 | 0.000 | 0.000 | 0.000 |
| 2015 | 0.002 | 2.208 | 1.299 | 0.966 | 1.030 | 0.454 | 0.286 | 0.087 | 0.028 | 0.076 | 0.025 | 0.002 | 0.007 | 0.000 | 0.002 | 0.000 | |
| 2016 | 0.067 | 0.358 | 0.621 | 0.258 | 0.303 | 0.321 | 0.187 | 0.158 | 0.058 | 0.052 | 0.008 | 0.009 | 0.000 | 0.008 | 0.000 | 0.000 | |
| 2017 | 0.000 | 0.038 | 0.289 | 0.272 | 0.116 | 0.166 | 0.079 | 0.067 | 0.061 | 0.027 | 0.006 | 0.004 | 0.001 | 0.001 | |||
| 2018 | 0.012 | 0.405 | 0.226 | 0.172 | 0.145 | 0.118 | 0.099 | 0.056 | 0.036 | 0.009 | 0.011 | 0.005 | 0.001 | 0.003 | 0.000 | 0.000 | |
| 2019 | 0.318 | 0.348 | 0.239 | 0.335 | 0.291 | 0.229 | 0.053 | 0.087 | 0.024 | 0.035 | 0.018 | 0.012 | 0.001 | 0.000 | 0.000 | 0.000 | 0.000 |
| 2020 | 0.015 | 0.019 | 0.139 | 0.240 | 0.302 | 0.119 | 0.091 | 0.048 | 0.033 | 0.012 | 0.002 | 0.003 | 0.000 | 0.002 |
| Age 0 | Age 1 | Age 2 | Age 3 | Age 4 | Age 5 | Age 6 | Age 7 | Age 8 | Age 9 | Age 10 | Age 11 | Age 12 | Age 13 | Age 14 | Age 15 | Age 16 | |
| 2003 | 1.511 | 0.545 | 0.626 | 0.405 | 0.460 | 0.420 | 0.456 | 0.528 | 0.580 | 0.821 | 1.754 | ||||||
| 2004 | 0.899 | 0.653 | 0.302 | 0.312 | 0.308 | 0.363 | 0.658 | 0.613 | 0.612 | 1.755 | 0.926 | ||||||
| 2005 | 2.970 | 0.637 | 0.452 | 0.486 | 0.407 | 0.369 | 0.451 | 0.466 | 0.818 | 0.524 | 0.867 | ||||||
| 2006 | 0.935 | 0.460 | 0.463 | 0.305 | 0.405 | 0.356 | 0.284 | 0.355 | 0.638 | 0.567 | |||||||
| 2007 | 0.965 | 0.642 | 0.850 | 0.873 | 0.766 | 0.706 | 0.433 | 0.642 | 0.909 | 6.516 | 6.592 | ||||||
| 2008 | 0.558 | 0.251 | 0.458 | 0.392 | 0.301 | 0.262 | 0.487 | 0.262 | 0.361 | 0.591 | 0.767 | 0.781 | 0.831 | ||||
| 2009 | 0.686 | 0.500 | 0.423 | 0.515 | 0.406 | 0.440 | 0.494 | 0.569 | 0.475 | 0.560 | 2.956 | 0.880 | 10.913 | 16.653 | |||
| 2010 | 0.927 | 0.366 | 0.378 | 0.347 | 0.306 | 0.336 | 0.358 | 0.443 | 0.885 | 0.599 | 0.582 | 6.463 | 1.592 | 0.823 | |||
| 2011 | 0.928 | 0.680 | 0.556 | 0.831 | 0.625 | 0.572 | 0.535 | 1.064 | 0.621 | 1.927 | 1.273 | 5.298 | 0.903 | ||||
| 2012 | 2.247 | 0.475 | 0.315 | 0.235 | 0.395 | 0.397 | 0.360 | 0.397 | 0.620 | 0.787 | 0.757 | 0.670 | 0.778 | 0.835 | 0.771 | ||
| 2013 | 0.811 | 0.531 | 0.260 | 0.371 | 0.403 | 0.504 | 0.417 | 0.487 | 0.069 | 0.460 | 0.686 | 0.776 | 0.395 | ||||
| 2014 | 0.455 | 0.405 | 0.307 | 0.548 | 0.467 | 0.445 | 0.479 | 0.683 | 0.493 | 0.702 | 0.520 | 0.979 | 0.803 | ||||
| 2015 | 4.653 | 0.354 | 0.318 | 0.523 | 0.522 | 0.416 | 0.426 | 0.517 | 0.717 | 0.701 | 0.675 | 1.683 | 1.217 | 0.791 | |||
| 2016 | 1.410 | 0.538 | 0.315 | 0.434 | 0.344 | 0.289 | 0.387 | 0.376 | 0.584 | 0.593 | 0.700 | 0.403 | 0.944 | ||||
| 2017 | 0.655 | 0.293 | 0.339 | 0.313 | 0.304 | 0.338 | 0.305 | 0.511 | 0.369 | 0.678 | 0.198 | 0.697 | 0.859 | ||||
| 2018 | 1.958 | 0.624 | 0.467 | 0.323 | 0.321 | 0.297 | 0.271 | 0.263 | 0.362 | 0.441 | 0.468 | 0.620 | 0.806 | 0.657 | |||
| 2019 | 0.475 | 0.482 | 0.358 | 0.354 | 0.471 | 0.382 | 0.405 | 0.359 | 0.459 | 0.430 | 0.662 | 0.601 | 1.141 | ||||
| 2020 | 1.198 | 1.020 | 0.374 | 0.392 | 0.465 | 0.594 | 0.551 | 0.503 | 0.633 | 0.548 | 1.342 | 1.212 | 10.862 | 1.097 |
| Age 0 | Age 1 | Age 2 | Age 3 | Age 4 | Age 5 | Age 6 | Age 7 | Age 8 | Age 9 | Age 10 | Age 11 | Age 12 | Age 13 | Age 14 | Age 15 | Age 16 | |
| 2003 | 0.000 | 0.004 | 0.090 | 0.324 | 0.371 | 0.537 | 0.406 | 0.212 | 0.146 | 0.031 | 0.000 | 0.003 | 0.000 | 0.000 | |||
| 2004 | 0.000 | 0.009 | 0.140 | 0.273 | 0.995 | 0.635 | 0.561 | 0.283 | 0.156 | 0.011 | 0.394 | 0.000 | 0.000 | ||||
| 2005 | 0.000 | 0.004 | 0.060 | 0.168 | 0.197 | 0.303 | 0.191 | 0.214 | 0.038 | 0.057 | 0.014 | 0.000 | |||||
| 2006 | 0.001 | 0.016 | 0.115 | 0.444 | 0.349 | 0.539 | 0.593 | 0.690 | 0.205 | 0.207 | 0.000 | 0.000 | |||||
| 2007 | 0.000 | 0.043 | 0.441 | 0.596 | 0.772 | 0.702 | 0.570 | 0.304 | 0.012 | 0.003 | 0.000 | 0.002 | 0.000 | ||||
| 2008 | 0.005 | 0.029 | 0.267 | 0.765 | 0.764 | 1.071 | 0.397 | 0.398 | 0.237 | 0.125 | 0.061 | 0.044 | 0.029 | 0.000 | 0.000 | ||
| 2009 | 0.003 | 0.011 | 0.170 | 0.533 | 0.960 | 0.626 | 0.561 | 0.149 | 0.546 | 0.345 | 0.010 | 0.025 | 0.001 | 0.000 | 0.000 | ||
| 2010 | 0.000 | 0.041 | 0.235 | 0.479 | 0.870 | 1.313 | 0.628 | 0.657 | 0.021 | 0.067 | 0.125 | 0.002 | 0.005 | 0.023 | 0.000 | 0.000 | |
| 2011 | 0.001 | 0.116 | 0.366 | 1.045 | 1.418 | 1.285 | 0.583 | 0.044 | 0.420 | 0.026 | 0.019 | 0.004 | 0.190 | 0.000 | |||
| 2012 | 0.000 | 0.123 | 0.306 | 0.376 | 0.619 | 1.033 | 0.304 | 0.183 | 0.053 | 0.372 | 0.038 | 0.056 | 0.009 | 0.021 | 0.000 | 0.008 | |
| 2013 | 0.004 | 0.057 | 0.181 | 0.513 | 0.672 | 1.361 | 0.465 | 0.214 | 0.043 | 0.021 | 0.031 | 0.005 | 0.014 | 0.000 | 0.000 | 0.000 | 0.000 |
| 2014 | 0.104 | 0.146 | 0.187 | 0.825 | 0.341 | 0.532 | 0.133 | 0.382 | 0.228 | 0.150 | 0.013 | 0.000 | 0.024 | 0.003 | 0.000 | 0.000 | 0.000 |
| 2015 | 0.000 | 0.171 | 0.344 | 1.004 | 1.628 | 1.025 | 0.628 | 0.287 | 0.086 | 0.570 | 0.091 | 0.010 | 0.029 | 0.000 | 0.013 | 0.000 | |
| 2016 | 0.001 | 0.029 | 0.184 | 0.169 | 0.426 | 0.759 | 0.499 | 0.470 | 0.269 | 0.520 | 0.038 | 0.052 | 0.000 | 0.028 | 0.000 | 0.000 | |
| 2017 | 0.000 | 0.003 | 0.130 | 0.280 | 0.213 | 0.393 | 0.283 | 0.228 | 0.453 | 0.208 | 0.024 | 0.017 | 0.003 | 0.014 | |||
| 2018 | 0.000 | 0.014 | 0.073 | 0.172 | 0.226 | 0.287 | 0.295 | 0.238 | 0.173 | 0.046 | 0.050 | 0.018 | 0.008 | 0.019 | 0.000 | 0.000 | |
| 2019 | 0.003 | 0.028 | 0.063 | 0.373 | 0.598 | 0.565 | 0.158 | 0.309 | 0.074 | 0.152 | 0.082 | 0.065 | 0.005 | 0.000 | 0.000 | 0.000 | 0.000 |
| 2020 | 0.000 | 0.002 | 0.055 | 0.254 | 0.524 | 0.289 | 0.294 | 0.219 | 0.153 | 0.052 | 0.006 | 0.015 | 0.000 | 0.009 |
| Age 0 | Age 1 | Age 2 | Age 3 | Age 4 | Age 5 | Age 6 | Age 7 | Age 8 | Age 9 | Age 10 | Age 11 | Age 12 | Age 13 | Age 14 | Age 15 | Age 16 | |
| 2003 | 10.00 | 19.86 | 34.38 | 40.64 | 47.42 | 56.53 | 63.37 | 66.45 | 68.28 | 64.26 | 61.05 | ||||||
| 2004 | 9.00 | 22.14 | 35.01 | 43.03 | 54.24 | 56.32 | 61.95 | 65.45 | 63.70 | 72.18 | 120.83 | ||||||
| 2005 | 10.63 | 20.97 | 31.37 | 39.79 | 50.01 | 58.34 | 62.15 | 64.65 | 63.88 | 64.78 | 108.00 | ||||||
| 2006 | 11.67 | 24.94 | 35.74 | 44.65 | 49.84 | 55.38 | 61.70 | 69.45 | 81.23 | 80.26 | |||||||
| 2007 | 9.97 | 25.38 | 34.29 | 43.01 | 52.39 | 60.32 | 65.77 | 74.05 | 91.00 | 60.77 | 58.38 | ||||||
| 2008 | 11.68 | 21.15 | 37.10 | 50.48 | 57.89 | 65.43 | 69.66 | 65.79 | 65.10 | 70.71 | 72.87 | 70.87 | 69.97 | ||||
| 2009 | 11.49 | 21.64 | 32.15 | 47.96 | 54.65 | 61.33 | 66.52 | 63.82 | 70.60 | 80.70 | 65.61 | 59.17 | 67.40 | 70.00 | |||
| 2010 | 12.00 | 19.44 | 35.12 | 44.92 | 56.90 | 61.39 | 64.88 | 75.02 | 61.25 | 66.95 | 81.66 | 60.93 | 60.01 | 62.00 | |||
| 2011 | 9.83 | 20.16 | 30.42 | 43.37 | 55.75 | 61.78 | 64.03 | 65.15 | 87.65 | 60.71 | 69.19 | 62.05 | 102.00 | ||||
| 2012 | 10.65 | 22.32 | 31.60 | 42.93 | 54.93 | 67.05 | 67.09 | 68.26 | 73.69 | 93.93 | 74.17 | 78.31 | 73.00 | 74.94 | 79.00 | ||
| 2013 | 11.44 | 17.74 | 30.70 | 42.83 | 52.60 | 61.46 | 62.94 | 65.93 | 76.37 | 76.09 | 63.67 | 69.00 | 74.70 | ||||
| 2014 | 10.73 | 20.46 | 38.23 | 42.69 | 46.62 | 58.93 | 67.47 | 77.68 | 75.01 | 74.64 | 81.28 | 71.69 | 75.00 | ||||
| 2015 | 10.88 | 20.51 | 29.80 | 46.53 | 54.35 | 60.63 | 60.50 | 70.40 | 71.33 | 85.50 | 74.51 | 76.85 | 75.82 | 95.00 | |||
| 2016 | 10.35 | 20.58 | 31.65 | 39.51 | 52.06 | 60.54 | 64.65 | 66.41 | 77.25 | 97.35 | 75.60 | 83.76 | 73.00 | ||||
| 2017 | 22.16 | 36.00 | 47.14 | 56.71 | 62.37 | 70.89 | 69.08 | 87.12 | 88.21 | 76.19 | 76.05 | 78.00 | 99.00 | ||||
| 2018 | 10.66 | 15.21 | 32.88 | 45.33 | 53.87 | 61.84 | 66.36 | 73.71 | 77.41 | 78.04 | 78.23 | 75.19 | 98.00 | 80.87 | |||
| 2019 | 10.62 | 20.29 | 29.52 | 47.40 | 58.30 | 62.36 | 65.12 | 71.49 | 68.09 | 73.51 | 73.95 | 86.65 | 76.97 | ||||
| 2020 | 11.94 | 22.83 | 34.55 | 46.89 | 55.10 | 62.06 | 66.73 | 75.66 | 77.61 | 77.43 | 78.48 | 82.85 | 81.80 | 82.97 |
| Age 0 | Age 1 | Age 2 | Age 3 | Age 4 | Age 5 | Age 6 | Age 7 | Age 8 | Age 9 | Age 10 | Age 11 | Age 12 | Age 13 | Age 14 | Age 15 | Age 16 | |
| 2003 | 10 | 69 | 383 | 667 | 1070 | 1831 | 2592 | 2876 | 3172 | 2627 | 2033 | ||||||
| 2004 | 6 | 107 | 440 | 772 | 1737 | 1823 | 2484 | 2861 | 2519 | 3396 | 19004 | ||||||
| 2005 | 14 | 85 | 329 | 617 | 1278 | 1964 | 2527 | 2941 | 2671 | 2873 | 12140 | ||||||
| 2006 | 13 | 139 | 457 | 887 | 1257 | 1693 | 2336 | 4269 | 5914 | 5353 | |||||||
| 2007 | 7 | 160 | 422 | 806 | 1518 | 2250 | 3138 | 4143 | 6804 | 2281 | 1485 | ||||||
| 2008 | 11 | 85 | 526 | 1322 | 2058 | 2916 | 3785 | 3412 | 2749 | 4571 | 3955 | 3716 | 2737 | ||||
| 2009 | 14 | 86 | 354 | 1152 | 1734 | 2474 | 2848 | 2605 | 3606 | 6205 | 3050 | 2022 | 3084 | 3122 | |||
| 2010 | 14 | 69 | 445 | 978 | 1973 | 2469 | 2793 | 4551 | 2362 | 2856 | 4925 | 2825 | 2285 | 1915 | |||
| 2011 | 9 | 75 | 285 | 818 | 1683 | 2361 | 2681 | 2839 | 9183 | 2343 | 3580 | 2440 | 10116 | ||||
| 2012 | 9 | 100 | 311 | 736 | 1555 | 2912 | 2804 | 3312 | 4149 | 9801 | 4212 | 4856 | 3745 | 4318 | 4630 | ||
| 2013 | 12 | 52 | 272 | 760 | 1460 | 2193 | 2240 | 2739 | 4584 | 4326 | 2554 | 3425 | 4262 | ||||
| 2014 | 10 | 86 | 534 | 739 | 973 | 2161 | 2876 | 4915 | 4475 | 4035 | 4659 | 3635 | 3340 | ||||
| 2015 | 19 | 77 | 263 | 1000 | 1554 | 2278 | 2241 | 3392 | 3418 | 7843 | 3516 | 4276 | 4335 | 7785 | |||
| 2016 | 9 | 84 | 294 | 661 | 1411 | 2376 | 2678 | 3003 | 4680 | 10566 | 4579 | 5951 | 3425 | ||||
| 2017 | 92 | 444 | 1020 | 1844 | 2366 | 3567 | 3390 | 6677 | 7467 | 4049 | 4314 | 3935 | 10610 | ||||
| 2018 | 5 | 40 | 327 | 1010 | 1585 | 2468 | 2987 | 4217 | 4882 | 4988 | 4720 | 3535 | 8695 | 6416 | |||
| 2019 | 11 | 77 | 267 | 1100 | 2005 | 2497 | 2973 | 3577 | 3220 | 4252 | 4282 | 6269 | 4317 | ||||
| 2020 | 7 | 88 | 393 | 1056 | 1735 | 2463 | 3166 | 4680 | 4637 | 4613 | 3372 | 6073 | 5165 | 5434 |
| Index_2plus | SD_2plus | CV_2plus | |
| 2003 | 1.650 | 0.655 | 0.397 |
| 2004 | 1.965 | 0.651 | 0.332 |
| 2005 | 0.949 | 0.377 | 0.398 |
| 2006 | 1.826 | 0.508 | 0.278 |
| 2007 | 2.673 | 2.045 | 0.765 |
| 2008 | 2.215 | 0.620 | 0.280 |
| 2009 | 2.171 | 0.888 | 0.409 |
| 2010 | 2.406 | 0.727 | 0.302 |
| 2011 | 4.092 | 2.531 | 0.619 |
| 2012 | 2.500 | 0.574 | 0.230 |
| 2013 | 2.745 | 0.718 | 0.262 |
| 2014 | 2.170 | 0.680 | 0.313 |
| 2015 | 4.262 | 1.573 | 0.369 |
| 2016 | 1.982 | 0.561 | 0.283 |
| 2017 | 1.088 | 0.270 | 0.248 |
| 2018 | 0.883 | 0.233 | 0.263 |
| 2019 | 1.323 | 0.401 | 0.303 |
| 2020 | 0.990 | 0.415 | 0.419 |
3.4 - Subarea C: Between 62°N and 65°N
| Age 0 | Age 1 | Age 2 | Age 3 | Age 4 | Age 5 | Age 6 | Age 7 | Age 8 | Age 9 | Age 10 | Age 11 | Age 12 | Age 13 | Age 14 | Age 15 | Age 16 | |
| 2003 | 0.000 | 0.010 | 0.058 | 0.260 | 0.284 | 0.429 | 0.254 | 0.077 | 0.055 | 0.042 | 0.001 | 0.001 | 0.000 | 0.000 | |||
| 2004 | 0.054 | 0.065 | 0.074 | 0.235 | 0.781 | 0.355 | 0.161 | 0.110 | 0.004 | 0.009 | 0.000 | 0.000 | 0.000 | ||||
| 2005 | 0.000 | 0.191 | 0.107 | 0.230 | 0.285 | 0.122 | 0.135 | 0.069 | 0.022 | 0.000 | 0.001 | 0.000 | |||||
| 2006 | 0.844 | 0.007 | 0.115 | 0.116 | 0.157 | 0.324 | 0.073 | 0.024 | 0.071 | 0.000 | 0.000 | 0.000 | |||||
| 2007 | 0.008 | 0.073 | 0.146 | 0.198 | 0.149 | 0.155 | 0.031 | 0.083 | 0.025 | 0.006 | 0.000 | 0.000 | 0.000 | ||||
| 2008 | 2.836 | 0.487 | 0.349 | 0.199 | 0.291 | 0.125 | 0.021 | 0.058 | 0.001 | 0.009 | 0.000 | 0.006 | 0.000 | 0.000 | 0.000 | ||
| 2009 | 0.000 | 0.083 | 0.226 | 0.289 | 0.340 | 0.215 | 0.083 | 0.049 | 0.011 | 0.005 | 0.002 | 0.007 | 0.000 | 0.000 | 0.000 | ||
| 2010 | 0.503 | 0.451 | 0.092 | 0.306 | 0.286 | 0.234 | 0.035 | 0.006 | 0.007 | 0.051 | 0.010 | 0.000 | 0.002 | 0.000 | 0.000 | 0.000 | |
| 2011 | 0.000 | 0.047 | 0.120 | 0.241 | 0.286 | 0.326 | 0.170 | 0.083 | 0.075 | 0.031 | 0.004 | 0.000 | 0.000 | 0.000 | |||
| 2012 | 0.000 | 0.083 | 0.308 | 0.374 | 0.261 | 0.229 | 0.231 | 0.077 | 0.104 | 0.004 | 0.009 | 0.011 | 0.002 | 0.005 | 0.000 | 0.002 | |
| 2013 | 0.131 | 0.318 | 0.183 | 0.120 | 0.087 | 0.408 | 0.470 | 0.545 | 0.116 | 0.005 | 0.001 | 0.001 | 0.003 | 0.000 | 0.000 | 0.000 | 0.000 |
| 2014 | 0.155 | 0.354 | 0.217 | 0.302 | 0.258 | 0.411 | 0.126 | 0.110 | 0.038 | 0.060 | 0.003 | 0.002 | 0.007 | 0.001 | 0.000 | 0.000 | 0.000 |
| 2015 | 0.000 | 0.086 | 0.839 | 0.184 | 0.250 | 0.098 | 0.095 | 0.005 | 0.024 | 0.027 | 0.022 | 0.002 | 0.006 | 0.000 | 0.002 | 0.000 | |
| 2016 | 0.012 | 0.147 | 0.122 | 0.393 | 0.197 | 0.196 | 0.074 | 0.070 | 0.074 | 0.021 | 0.035 | 0.009 | 0.000 | 0.000 | 0.000 | 0.000 | |
| 2017 | 0.000 | 0.108 | 0.163 | 0.107 | 0.143 | 0.143 | 0.124 | 0.068 | 0.007 | 0.004 | 0.006 | 0.004 | 0.001 | 0.001 | |||
| 2018 | 0.000 | 0.120 | 0.082 | 0.068 | 0.113 | 0.259 | 0.193 | 0.042 | 0.049 | 0.039 | 0.011 | 0.005 | 0.001 | 0.003 | 0.000 | 0.000 | |
| 2019 | 0.028 | 0.012 | 0.084 | 0.183 | 0.177 | 0.296 | 0.256 | 0.271 | 0.064 | 0.061 | 0.015 | 0.012 | 0.006 | 0.001 | 0.000 | 0.000 | 0.000 |
| 2020 | 0.000 | 0.025 | 0.140 | 0.133 | 0.100 | 0.198 | 0.036 | 0.077 | 0.055 | 0.032 | 0.001 | 0.002 | 0.000 | 0.001 |
| Age 0 | Age 1 | Age 2 | Age 3 | Age 4 | Age 5 | Age 6 | Age 7 | Age 8 | Age 9 | Age 10 | Age 11 | Age 12 | Age 13 | Age 14 | Age 15 | Age 16 | |
| 2003 | 0.712 | 0.779 | 0.483 | 0.829 | 0.529 | 0.715 | 0.860 | 0.934 | 0.813 | 5.884 | 0.830 | ||||||
| 2004 | 1.250 | 0.998 | 0.463 | 0.415 | 0.407 | 0.389 | 0.429 | 0.549 | 0.936 | 0.790 | 7.491 | ||||||
| 2005 | 0.636 | 0.609 | 0.530 | 0.448 | 0.570 | 0.478 | 0.658 | 0.798 | 0.867 | ||||||||
| 2006 | 0.627 | 0.411 | 0.387 | 0.641 | 0.394 | 0.548 | 0.571 | 0.615 | 0.645 | ||||||||
| 2007 | 0.965 | 0.654 | 0.486 | 0.403 | 0.551 | 0.475 | 0.342 | 0.674 | 0.673 | 0.885 | |||||||
| 2008 | 0.913 | 0.852 | 0.454 | 0.475 | 0.491 | 0.435 | 0.922 | 0.733 | 4.512 | 0.893 | 8.656 | 0.928 | |||||
| 2009 | 0.465 | 0.289 | 0.611 | 0.588 | 0.786 | 0.926 | 0.803 | 1.817 | 2.604 | 5.625 | 0.996 | 13.536 | |||||
| 2010 | 0.971 | 0.530 | 0.216 | 0.520 | 0.592 | 0.556 | 0.409 | 0.421 | 0.573 | 0.837 | 0.342 | 0.742 | |||||
| 2011 | 0.185 | 0.575 | 0.459 | 0.452 | 0.453 | 0.531 | 0.474 | 0.553 | 0.893 | 0.509 | |||||||
| 2012 | 0.287 | 0.636 | 0.361 | 0.496 | 0.694 | 0.577 | 0.534 | 0.818 | 0.461 | 0.350 | 0.670 | 0.778 | 0.835 | 0.771 | |||
| 2013 | 0.859 | 0.867 | 0.418 | 0.491 | 0.574 | 0.843 | 0.713 | 0.692 | 0.556 | 0.460 | 0.772 | 0.776 | 0.395 | ||||
| 2014 | 1.145 | 0.840 | 0.464 | 0.571 | 0.698 | 0.580 | 0.502 | 0.698 | 0.613 | 0.619 | 0.520 | 5.910 | 1.159 | 0.803 | 22.361 | ||
| 2015 | 0.849 | 0.559 | 0.447 | 0.479 | 0.555 | 0.656 | 0.909 | 0.652 | 0.587 | 0.554 | 0.774 | 0.102 | 0.791 | ||||
| 2016 | 0.791 | 0.414 | 0.549 | 0.406 | 0.429 | 0.346 | 0.436 | 0.547 | 0.483 | 0.614 | 0.701 | 0.403 | |||||
| 2017 | 0.719 | 0.416 | 0.417 | 0.493 | 0.378 | 0.457 | 0.406 | 0.222 | 0.345 | 0.678 | 0.198 | 0.697 | 0.859 | ||||
| 2018 | 0.418 | 0.629 | 0.384 | 0.454 | 0.370 | 0.355 | 0.259 | 0.422 | 0.716 | 0.469 | 0.614 | 0.806 | 0.653 | ||||
| 2019 | 0.958 | 0.850 | 0.371 | 0.406 | 0.659 | 0.733 | 0.548 | 0.563 | 0.905 | 0.692 | 1.559 | 1.565 | 2.276 | 5.787 | |||
| 2020 | 0.956 | 0.413 | 0.422 | 0.413 | 0.245 | 0.471 | 0.391 | 0.555 | 0.771 | 0.834 | 0.799 | 0.836 |
| Age 0 | Age 1 | Age 2 | Age 3 | Age 4 | Age 5 | Age 6 | Age 7 | Age 8 | Age 9 | Age 10 | Age 11 | Age 12 | Age 13 | Age 14 | Age 15 | Age 16 | |
| 2003 | 0.000 | 0.000 | 0.028 | 0.299 | 0.469 | 1.401 | 0.872 | 0.424 | 0.274 | 0.380 | 0.006 | 0.002 | 0.000 | 0.000 | |||
| 2004 | 0.000 | 0.004 | 0.019 | 0.308 | 2.092 | 1.227 | 0.853 | 0.595 | 0.009 | 0.075 | 0.001 | 0.000 | 0.000 | ||||
| 2005 | 0.000 | 0.034 | 0.043 | 0.525 | 0.966 | 0.611 | 0.538 | 0.557 | 0.070 | 0.000 | 0.014 | 0.000 | |||||
| 2006 | 0.006 | 0.001 | 0.085 | 0.202 | 0.408 | 1.043 | 0.235 | 0.138 | 0.481 | 0.000 | 0.000 | 0.000 | |||||
| 2007 | 0.000 | 0.012 | 0.218 | 0.495 | 0.581 | 0.490 | 0.116 | 0.273 | 0.164 | 0.041 | 0.000 | 0.000 | 0.000 | ||||
| 2008 | 0.019 | 0.053 | 0.427 | 0.448 | 1.036 | 0.471 | 0.088 | 0.352 | 0.002 | 0.022 | 0.000 | 0.059 | 0.000 | 0.000 | 0.000 | ||
| 2009 | 0.000 | 0.009 | 0.158 | 0.480 | 0.969 | 0.710 | 0.397 | 0.299 | 0.029 | 0.013 | 0.005 | 0.058 | 0.001 | 0.000 | 0.000 | ||
| 2010 | 0.002 | 0.048 | 0.016 | 0.523 | 0.720 | 0.736 | 0.210 | 0.020 | 0.018 | 0.337 | 0.052 | 0.000 | 0.004 | 0.000 | 0.000 | 0.000 | |
| 2011 | 0.000 | 0.003 | 0.061 | 0.488 | 0.973 | 1.296 | 1.484 | 0.808 | 0.170 | 0.391 | 0.014 | 0.000 | 0.000 | 0.000 | |||
| 2012 | 0.000 | 0.008 | 0.121 | 0.555 | 0.687 | 0.995 | 0.905 | 0.339 | 0.976 | 0.016 | 0.037 | 0.056 | 0.009 | 0.021 | 0.000 | 0.008 | |
| 2013 | 0.002 | 0.050 | 0.064 | 0.125 | 0.213 | 1.277 | 3.744 | 2.639 | 1.283 | 0.021 | 0.004 | 0.005 | 0.014 | 0.000 | 0.000 | 0.000 | 0.000 |
| 2014 | 0.002 | 0.024 | 0.202 | 0.632 | 0.564 | 1.326 | 0.489 | 0.593 | 0.150 | 0.276 | 0.013 | 0.004 | 0.026 | 0.003 | 0.000 | 0.000 | 0.000 |
| 2015 | 0.000 | 0.010 | 0.485 | 0.283 | 0.533 | 0.372 | 0.192 | 0.021 | 0.103 | 0.110 | 0.084 | 0.009 | 0.025 | 0.000 | 0.013 | 0.000 | |
| 2016 | 0.000 | 0.012 | 0.064 | 0.754 | 0.331 | 0.811 | 0.272 | 0.253 | 0.528 | 0.190 | 0.129 | 0.052 | 0.000 | 0.000 | 0.000 | 0.000 | |
| 2017 | 0.000 | 0.009 | 0.128 | 0.248 | 0.301 | 0.522 | 0.446 | 0.211 | 0.026 | 0.017 | 0.024 | 0.017 | 0.003 | 0.014 | |||
| 2018 | 0.000 | 0.007 | 0.026 | 0.067 | 0.282 | 1.054 | 0.773 | 0.182 | 0.297 | 0.168 | 0.050 | 0.018 | 0.008 | 0.019 | 0.000 | 0.000 | |
| 2019 | 0.001 | 0.001 | 0.016 | 0.439 | 0.726 | 1.185 | 1.232 | 1.298 | 0.295 | 0.523 | 0.071 | 0.072 | 0.024 | 0.006 | 0.000 | 0.000 | 0.000 |
| 2020 | 0.000 | 0.002 | 0.156 | 0.267 | 0.204 | 0.841 | 0.144 | 0.580 | 0.355 | 0.233 | 0.005 | 0.011 | 0.000 | 0.008 |
| Age 0 | Age 1 | Age 2 | Age 3 | Age 4 | Age 5 | Age 6 | Age 7 | Age 8 | Age 9 | Age 10 | Age 11 | Age 12 | Age 13 | Age 14 | Age 15 | Age 16 | |
| 2003 | 17.31 | 33.13 | 44.67 | 52.18 | 66.76 | 68.29 | 75.08 | 77.81 | 93.01 | 84.42 | 61.04 | ||||||
| 2004 | 9.16 | 16.91 | 28.55 | 48.68 | 63.18 | 66.87 | 77.57 | 79.22 | 62.80 | 88.52 | 63.44 | ||||||
| 2005 | 26.78 | 33.20 | 59.22 | 68.01 | 74.51 | 72.93 | 81.79 | 66.42 | 108.00 | ||||||||
| 2006 | 9.98 | 21.96 | 41.84 | 53.82 | 60.92 | 66.50 | 68.23 | 66.22 | 86.82 | ||||||||
| 2007 | 9.97 | 23.65 | 50.34 | 60.55 | 68.31 | 69.03 | 67.63 | 70.49 | 91.31 | 89.00 | |||||||
| 2008 | 8.33 | 21.34 | 48.25 | 60.00 | 68.10 | 70.79 | 71.94 | 78.57 | 61.38 | 59.05 | 62.00 | 87.89 | |||||
| 2009 | 22.22 | 38.04 | 51.59 | 61.81 | 70.70 | 75.86 | 79.22 | 62.77 | 62.25 | 66.95 | 91.73 | 67.00 | |||||
| 2010 | 8.02 | 20.70 | 27.14 | 50.94 | 59.27 | 63.95 | 78.94 | 66.91 | 61.27 | 81.12 | 79.67 | 60.00 | |||||
| 2011 | 20.51 | 34.19 | 56.06 | 68.10 | 70.66 | 89.96 | 95.59 | 63.83 | 106.00 | 69.52 | |||||||
| 2012 | 21.72 | 33.95 | 51.94 | 63.37 | 70.99 | 72.63 | 74.78 | 90.09 | 71.36 | 74.33 | 78.31 | 73.00 | 74.94 | 79.00 | |||
| 2013 | 11.00 | 24.25 | 32.75 | 44.82 | 55.34 | 71.04 | 88.43 | 79.79 | 95.79 | 76.09 | 63.00 | 69.00 | 74.70 | ||||
| 2014 | 11.70 | 21.12 | 43.63 | 58.48 | 59.96 | 67.83 | 73.87 | 79.82 | 74.50 | 77.93 | 81.28 | 61.71 | 71.66 | 75.00 | 70.00 | ||
| 2015 | 22.25 | 38.86 | 53.28 | 57.32 | 70.80 | 61.01 | 71.05 | 75.34 | 76.42 | 74.87 | 77.00 | 76.15 | 95.00 | ||||
| 2016 | 10.00 | 21.14 | 36.26 | 56.79 | 54.97 | 72.89 | 71.14 | 69.90 | 84.50 | 97.40 | 74.29 | 83.76 | |||||
| 2017 | 21.85 | 40.91 | 58.32 | 61.16 | 68.15 | 70.64 | 66.42 | 73.92 | 81.74 | 76.19 | 76.05 | 78.00 | 99.00 | ||||
| 2018 | 19.52 | 32.19 | 45.60 | 63.57 | 74.71 | 72.80 | 74.12 | 82.67 | 75.60 | 78.26 | 75.22 | 98.00 | 80.88 | ||||
| 2019 | 11.83 | 19.97 | 28.09 | 59.05 | 70.49 | 71.02 | 78.73 | 77.01 | 76.47 | 90.06 | 77.19 | 92.56 | 76.89 | 81.69 | |||
| 2020 | 21.00 | 47.03 | 54.73 | 59.39 | 73.19 | 70.63 | 86.06 | 83.71 | 86.60 | 79.00 | 83.00 | 83.00 |
| Age 0 | Age 1 | Age 2 | Age 3 | Age 4 | Age 5 | Age 6 | Age 7 | Age 8 | Age 9 | Age 10 | Age 11 | Age 12 | Age 13 | Age 14 | Age 15 | Age 16 | |
| 2003 | 40 | 365 | 1101 | 1436 | 3168 | 3272 | 5072 | 5062 | 8818 | 6215 | 2033 | ||||||
| 2004 | 7 | 48 | 254 | 1247 | 2604 | 3510 | 5123 | 5797 | 2414 | 7569 | 2473 | ||||||
| 2005 | 188 | 402 | 2201 | 3380 | 4439 | 3947 | 6824 | 2778 | 12140 | ||||||||
| 2006 | 8 | 81 | 718 | 1798 | 2558 | 3228 | 3171 | 4489 | 7765 | ||||||||
| 2007 | 7 | 169 | 1478 | 2435 | 3582 | 3182 | 3570 | 3952 | 7115 | 7500 | |||||||
| 2008 | 7 | 99 | 1169 | 2282 | 3468 | 3720 | 4226 | 5348 | 2369 | 2334 | 2475 | 9590 | |||||
| 2009 | 99 | 663 | 1468 | 2691 | 3455 | 4183 | 5423 | 2703 | 2687 | 2746 | 7945 | 2870 | |||||
| 2010 | 4 | 95 | 175 | 1551 | 2360 | 3011 | 5553 | 3154 | 2369 | 5343 | 5091 | 2285 | |||||
| 2011 | 65 | 423 | 1909 | 3336 | 3730 | 8552 | 9298 | 2319 | 12482 | 3640 | |||||||
| 2012 | 93 | 424 | 1487 | 2530 | 3851 | 3712 | 4126 | 7459 | 3729 | 4235 | 4856 | 3745 | 4318 | 4630 | |||
| 2013 | 13 | 129 | 330 | 923 | 1976 | 3183 | 7125 | 4835 | 10222 | 4326 | 2400 | 3425 | 4262 | ||||
| 2014 | 14 | 74 | 905 | 2078 | 2133 | 3194 | 4110 | 5267 | 3894 | 4804 | 4659 | 2441 | 3634 | 3340 | 4400 | ||
| 2015 | 97 | 629 | 1491 | 2113 | 3576 | 2284 | 3228 | 4368 | 4328 | 3560 | 4310 | 4395 | 7785 | ||||
| 2016 | 9 | 83 | 452 | 1899 | 1624 | 4040 | 3585 | 3558 | 6659 | 9035 | 3961 | 5951 | |||||
| 2017 | 90 | 758 | 2215 | 2137 | 3506 | 3509 | 3183 | 3885 | 4583 | 4049 | 4314 | 3935 | 10610 | ||||
| 2018 | 61 | 305 | 953 | 2558 | 4136 | 3965 | 4332 | 5991 | 4510 | 4724 | 3539 | 8695 | 6419 | ||||
| 2019 | 23 | 67 | 195 | 2364 | 4053 | 3666 | 4952 | 4771 | 4592 | 8250 | 4122 | 7605 | 4331 | 5340 | |||
| 2020 | 78 | 1075 | 1866 | 2050 | 4258 | 3767 | 7391 | 6500 | 6694 | 3386 | 6140 | 5434 |
| Index_2plus | SD_2plus | CV_2plus | |
| 2003 | 1.461 | 0.803 | 0.550 |
| 2004 | 1.728 | 0.590 | 0.341 |
| 2005 | 0.970 | 0.358 | 0.369 |
| 2006 | 0.880 | 0.271 | 0.308 |
| 2007 | 0.792 | 0.254 | 0.321 |
| 2008 | 1.060 | 0.362 | 0.341 |
| 2009 | 1.227 | 0.690 | 0.562 |
| 2010 | 1.029 | 0.429 | 0.417 |
| 2011 | 1.336 | 0.487 | 0.364 |
| 2012 | 1.616 | 0.622 | 0.385 |
| 2013 | 1.940 | 1.033 | 0.533 |
| 2014 | 1.533 | 0.739 | 0.482 |
| 2015 | 1.553 | 0.665 | 0.428 |
| 2016 | 1.191 | 0.285 | 0.239 |
| 2017 | 0.771 | 0.219 | 0.284 |
| 2018 | 0.864 | 0.244 | 0.283 |
| 2019 | 1.426 | 0.700 | 0.491 |
| 2020 | 0.776 | 0.135 | 0.174 |
12 - Appendix C
R-script to produce the time series tables and figures from Stocks bootstrap output files. This is a version for acoustic time series.
# espen.johnsen@hi.no, September 2019
######################################
# Coastal cod by harald@hi.no and johanna.fall@hi.no sept 2020
# Oppdatert 01.11.2021 med 2020 indeks. Hele serien kjørt ut på nytt til
# //delphi/Felles/421-Bunnfisk/Kysttorsk/Acoustics/N67/, Tot, S65, osv.
# Oppdatert 27.01.2021 med SSB estimat
# Oppdatert 12.03.2021 med linje 51-55 for ? legge til nullverdier i beregningene.
# All non-coastal cod (otolithtype > 2) are stripped from the dataset, so that all output is for coastal cod only
rm(list=ls())
library(data.table)
library(Hmisc)
library(Rstox)
library(xlsx)
## Coastal cod
#path1 <- "C:Users//harald//workspace//stox//project//Varanger Stad cod acoustic index in autumn "
#path1 <- "C:Users//harald//workspace//stox//project//Varanger Stad coastal cod swept area "
path1 <- "//delphi/Felles/421-Bunnfisk/Kysttorsk/Akustikk stox/Varanger Stad cod acoustic index in autumn "
#path2 <- "D://Documents//OwnCloud//Softwarespesifikk//R//Projects//Kysttorsk//Swept area//Tot//"
#path2 <- "D://Documents//OwnCloud//Softwarespesifikk//R//Projects//Kysttorsk//Acoustics//Tot//"
# path2 <- "//delphi/Felles/421-Bunnfisk/Kysttorsk/Acoustics/N67//"
# path2 <- "//delphi/Felles/421-Bunnfisk/Kysttorsk/Acoustics/65-67//"
# path2 <- "//delphi/Felles/421-Bunnfisk/Kysttorsk/Acoustics/S65//"
#for SSB calcs - management plan
#Correction of indices - adding zeros at age for iterations with zeroes (were NA)
# path2 <- "//delphi/Felles/421-Bunnfisk/Kysttorsk/Acoustics/N-WIPaddzeroes//"
# path2 <- "//delphi/Felles/421-Bunnfisk/Kysttorsk/Acoustics/Tot-WIPaddzeroes//"
# path2 <- "//delphi/Felles/421-Bunnfisk/Kysttorsk/Acoustics/65-67-WIPaddzeroes//"
path2 <- "//delphi/Felles/421-Bunnfisk/Kysttorsk/Acoustics/S65-WIPaddzeroes//"
out <- list()
for(y in 1:26){
year <- 1994+y
print(year)
load(paste0(path1,year," N67\\output\\r\\data\\bootstrapImpute.RData"))
bootstrapVariable.out <- eval(parse(text="bootstrapImpute"))
DT <- rbindlist(bootstrapVariable.out[[2]],idcol=TRUE)
DT <- DT[DT$otolithtype <= 2] # Only coastal cod (otolithtype 1 and 2) included
## Some SuperINd may miss weight. Generate weight from a length weight relation
id1 <- DT$weight > 0
lm.wl <- lm(log(DT$weight[id1]) ~ log(DT$length[id1]))
a <- exp(as.numeric(lm.wl$coeff[1]))
b <- as.numeric(lm.wl$coeff[2])
DT$weight[is.na(DT$weight) | DT$weight == 0] <- a*(DT$length[is.na(DT$weight) | DT$weight == 0] )^b
#plot(DT$weight ~ DT$length)
#Create zero values for ages not observed in an iteration
setkey(DT, Stratum, age, .id)
DT <- DT[CJ(Stratum, age, .id, unique=TRUE)]
DT$Abundance[is.na(DT$Abundance)] <- 0
DT$weight[is.na(DT$weight)] <- 0 #to include zeroes in biomass calc
## Output by age and by sum over age 2 to maxage
strata <- unique(DT[,c("Stratum", "includeintotal")])
# strata.incl <- strata[strata$includeintotal=="TRUE",]
#manually remove strata so we only have area N67 left
# strata.incl <- strata[!Stratum %in% c("Helgeland indre", "Helgeland ytre",
# "Stad Halten indre", "Stad Halten ytre",
# "Vestfjord ost"),]
#manually remove strata so we only have area 6567 left
strata.incl <- strata[!Stratum %in% c("Alta","Andfjord Vaagsfjord",
"Fugloybanken","Hjelmsoy indre",
"Hjelmsoy Loppa","Kvenangen",
"Laksefjord","Malangen","Osthavet",
"Porsangen","Soroya indre",
"Stad Halten indre","Stad Halten ytre",
"Tana","Ullsfjord Lyngen","Varangerfjord",
"Vesteralen","Vestfjord indre","Vestfjord ost",
"Vestfjord vest"),]
#manually remove strata so we only have area S65 left
strata.incl <- strata[!Stratum %in% c("Alta","Andfjord Vaagsfjord",
"Fugloybanken","Helgeland indre",
"Helgeland ytre","Hjelmsoy indre",
"Hjelmsoy Loppa","Kvenangen",
"Laksefjord","Malangen","Osthavet",
"Porsangen","Soroya indre",
"Tana","Ullsfjord Lyngen","Varangerfjord",
"Vesteralen","Vestfjord indre","Vestfjord ost",
"Vestfjord vest"),]
#manually remove strata so we have Total area left
# strata.incl <- strata[!Stratum %in% c("Vestfjord ost"),]
byGrp1 <- c(".id")
byGrp2 <- c("age", ".id")
tmp1 <- DT[!age %in% c(0,1) & Stratum %in% strata.incl$Stratum,.(Ab.Sum =sum(Abundance)),by=byGrp1]
tmp2 <- DT[Stratum %in% strata.incl$Stratum,.(Ab.Sum =sum(Abundance)),by=byGrp2]
tmp3 <- DT[Stratum %in% strata.incl$Stratum,.(Tonnes =sum(Abundance * (weight))/1000000),by=byGrp2] # Tonnes
#For SSB calculation
tmp3b <- DT[Stratum %in% strata.incl$Stratum & stage %in% c(2,3,4),.(Tonnes =sum(Abundance * (weight))/1000000),by=byGrp2] # Tonnes
tmp4 <- DT[Stratum %in% strata.incl$Stratum,.(ind.weight = weighted.mean(weight,Abundance)),by=byGrp2]
tmp5 <- DT[Stratum %in% strata.incl$Stratum,.(ind.length = weighted.mean(length,Abundance)),by=byGrp2]
#Maturity at age
tmp6 <- DT[Stratum %in% strata.incl$Stratum,
.(maturity = length(stage[stage %in% c(2,3,4)])/length(stage[stage %in% c(1,2,3,4)])),by=byGrp2]
tsnTotWithout01 <- tmp1[, .("Ab.Sum.5%" = quantile(Ab.Sum, probs = .05),
"Ab.Sum.50%" = quantile(Ab.Sum, probs = .50),
"Ab.Sum.95%" = quantile(Ab.Sum, probs = .95),
Ab.Sum.mean = mean(Ab.Sum),
Ab.Sum.sd = sd(Ab.Sum),
Ab.Sum.cv = sd(Ab.Sum)/mean(Ab.Sum))]
tsnByAge <- tmp2[, .("Ab.Sum.5%" = quantile(Ab.Sum, probs = .05),
"Ab.Sum.50%" = quantile(Ab.Sum, probs = .50),
"Ab.Sum.95%" = quantile(Ab.Sum, probs = .95),
Ab.Sum.mean = mean(Ab.Sum),
Ab.Sum.sd = sd(Ab.Sum),
Ab.Sum.cv = sd(Ab.Sum)/mean(Ab.Sum))
, by = c("age")]
tsbByAge <- tmp3[, .("Ton.5%" = quantile(Tonnes, probs = .05),
"Ton.50%" = quantile(Tonnes, probs = .50),
"Ton.95%" = quantile(Tonnes, probs = .95),
Ton.mean = mean(Tonnes),
Ton.sd = sd(Tonnes),
Ton.cv = sd(Tonnes)/mean(Tonnes))
, by = c("age")]
ssbByAge <- tmp3b[, .("Ton.5%" = quantile(Tonnes, probs = .05),
"Ton.50%" = quantile(Tonnes, probs = .50),
"Ton.95%" = quantile(Tonnes, probs = .95),
Ton.mean = mean(Tonnes),
Ton.sd = sd(Tonnes),
Ton.cv = sd(Tonnes)/mean(Tonnes))
, by = c("age")]
ind.weight.by.age <- tmp4[, .("Ind.weight.age.5%" = quantile(ind.weight, probs = .05,na.rm=T),
"Ind.weight.age.50%" = quantile(ind.weight, probs = .50,na.rm=T),
"ind.weight.age.95%" = quantile(ind.weight, probs = .95,na.rm=T),
ind.weight.age.mean = mean(ind.weight,na.rm=T),
ind.weight.age = sd(ind.weight,na.rm=T),
ind.weight.age.cv = sd(ind.weight,na.rm=T)/mean(ind.weight,na.rm=T))
, by = c("age")]
ind.length.by.age <- tmp5[, .("Ind.length.age.5%" = quantile(ind.length, probs = .05,na.rm=T),
"Ind.length.age.50%" = quantile(ind.length, probs = .50,na.rm=T),
"ind.length.age.95%" = quantile(ind.length, probs = .95,na.rm=T),
ind.length.age.mean = mean(ind.length,na.rm=T),
ind.length.age = sd(ind.length,na.rm=T),
ind.length.age.cv = sd(ind.length,na.rm=T)/mean(ind.length,na.rm=T))
, by = c("age")]
maturity.by.age <- tmp6[, .("Maturity.age.5%" = quantile(maturity, probs = .05,na.rm=T),
"Maturity.age.50%" = quantile(maturity, probs = .50,na.rm=T),
"Maturity.age.95%" = quantile(maturity, probs = .95,na.rm=T),
maturity.age.mean = mean(maturity,na.rm=T),
maturity.age.sd = sd(maturity,na.rm=T),
maturity.age.cv = sd(maturity,na.rm=T)/mean(maturity,na.rm=T))
, by = c("age")]
## Output by stratum----
byGrp3 <- c("Stratum", ".id")
tmp2 <- DT[ ,.(Ab.Sum =sum(Abundance)),by=byGrp3]
tmp3 <- DT[ ,.(Tonnes =sum(Abundance * (weight))/1000000),by=byGrp3] # Tonnes
tsnByStratum <- tmp2[, .("Ab.Sum.5%" = quantile(Ab.Sum, probs = .05),
"Ab.Sum.50%" = quantile(Ab.Sum, probs = .50),
"Ab.Sum.95%" = quantile(Ab.Sum, probs = .95),
Ab.Sum.mean = mean(Ab.Sum),
Ab.Sum.sd = sd(Ab.Sum),
Ab.Sum.cv = sd(Ab.Sum)/mean(Ab.Sum))
, by = c("Stratum")]
tsbByStratum <- tmp3[, .("Ton.5%" = quantile(Tonnes, probs = .05),
"Ton.50%" = quantile(Tonnes, probs = .50),
"Ton.95%" = quantile(Tonnes, probs = .95),
Ton.mean = mean(Tonnes),
Ton.sd = sd(Tonnes),
Ton.cv = sd(Tonnes)/mean(Tonnes))
, by = c("Stratum")]
#
out[[y]] <- list(year=year,
a = a,
b = b,
tsnByAge = tsnByAge,
tsnTotWithout01 = tsnTotWithout01,
ind.weight.by.age = ind.weight.by.age,
ind.length.by.age = ind.length.by.age,
maturity.by.age = maturity.by.age,
tsbByAge = tsbByAge,
ssbByAge = ssbByAge,
tsbByStratum = tsbByStratum,
tsnByStratum = tsnByStratum)
}
# If you want to save output
save(out, file = (paste0(path2,"ProduceAllFiguresCoastalCod_12-03-filtfromN.Rdata")))
out.acu <- out # I rename the object, as the "out" is in conflict with results of other codes
## Figures to be made
# Figure 1: Number by age in time series: Age1-Age17. Age 17 is the oldest observed coastal cod.
## Tables to be made
# Table 1: Abundance indices (mean bootstrap)
# Table 2: CV of abundance indices
# Table 3: Biomass indices (mean bootstrap)
# Table 4: Mean length by age (cm)
# Table 5: Mean weight by age (g)
# Table 6: Abundance and CV of abundance for sum over ages 2+
## Number by age in time series For Table 1 and Figure 1
mat.num <- matrix(NA,ncol=18,nrow=length(1995:2020))
colnames(mat.num) <- 0:17
rownames(mat.num) <- 1995:2020
for(y in 1:26){
tmp <- (as.data.frame(out.acu[[y]]$tsnByAge)[,c("age","Ab.Sum.mean")])
for(a in 1:18){
age <- a-1
if(!any(tmp$age[!is.na(tmp$age)] == age)) {
next
}
mat.num[y,a] <- tmp$`Ab.Sum.mean`[tmp$age == age & !is.na(tmp$age)]
}
}
## Biomass by age in time series. For Table 3
mat.biom <- matrix(NA,ncol=18,nrow=length(1995:2020))
colnames(mat.biom) <- 0:17
rownames(mat.biom) <- 1995:2020
for(y in 1:26){
tmp <- (as.data.frame(out.acu[[y]]$tsbByAge)[,c("age","Ton.mean")])
for(a in 1:18){
age <- a-1
if(!any(tmp$age[!is.na(tmp$age)] == age)) {
next
}
mat.biom[y,a] <- tmp$`Ton.mean`[tmp$age == age & !is.na(tmp$age)]
}
}
#SSB by age (management plan)
mat.ssb <- matrix(NA,ncol=18,nrow=length(1995:2020))
colnames(mat.ssb) <- 0:17
rownames(mat.ssb) <- 1995:2020
for(y in 1:26){
tmp <- (as.data.frame(out.acu[[y]]$ssbByAge)[,c("age","Ton.mean")])
for(a in 1:18){
age <- a-1
if(!any(tmp$age[!is.na(tmp$age)] == age)) {
next
}
mat.ssb[y,a] <- tmp$`Ton.mean`[tmp$age == age & !is.na(tmp$age)]
}
}
## Figure 1: Number by age in time series ----
plot.cohort.year <- function(mat, age=1:17, survey.year=1995:2020, start.coh = 1995, stop.coh=2016,col1=1,col2=1, addPlot=F){
## Define first cohort: start.co
## Does the matrix include year and age information? Add if not
mat <- mat[ ,colnames(mat) %in% age]
mat[mat == 1] <- NA
if(!is.null(rownames(mat))) survey.year <- as.numeric(rownames(mat))
mat <- mat[row.names(mat) %in% survey.year,]
age.mat <- matrix(age,nrow=nrow(mat),ncol=ncol(mat), byrow=T)
sur.mat <- matrix(survey.year,nrow=nrow(mat),ncol=ncol(mat), byrow=F)
coh.mat <- sur.mat - age.mat ###
if(addPlot == F) plot(sur.mat, mat, type="n", xlab="Survey year", ylab = "Log10 (abundance index)")
for(i.y in start.coh:stop.coh){
lines(sur.mat[coh.mat== i.y], mat[coh.mat == i.y], col=i.y, lwd=1.5)
text(sur.mat[coh.mat== i.y], mat[coh.mat == i.y], age.mat[coh.mat == i.y], col=i.y) ## M? skrive inn alder
}
}
## Plot cohort
fil1 <- paste0(path2,"Figure_1_Log10Number_by_age_in_time_series_CoastalCod.jpg")
jpeg(filename = fil1 , width = 18, height = 12, units = "cm",res=300)
plot.cohort.year(log10(mat.num), survey.year =1995:2020, age=1:17, start.coh=1995,stop.coh=2016)
dev.off()
# End
# Table 1: Abundance indices (mean bootstrap) ----
mat1.num <- as.data.frame(mat.num/(1e+6))
names(mat1.num) <- paste("Age", 0:(ncol(mat1.num)-1))
write.xlsx(mat1.num, file=paste0(path2,"Table_1_Abundance_indices_Coastal cod_Tot_millions.xlsx" ))
# # Table 2: CV of abundance indices ----
mat.cv <- matrix(NA,ncol=18,nrow=length(1995:2020))
colnames(mat.cv) <- 0:17
rownames(mat.cv) <- 1995:2020
for(y in 1:26){
tmp <- (as.data.frame(out.acu[[y]]$tsnByAge)[,c("age","Ab.Sum.cv")])
for(a in 1:18){
age <- a-1
if(!any(tmp$age[!is.na(tmp$age)] == age)) {
next
}
mat.cv[y,a] <- tmp$`Ab.Sum.cv`[tmp$age == age & !is.na(tmp$age)]
}
}
mat.cv1 <- as.data.frame(mat.cv)
names(mat.cv1) <- paste("Age", 0:(ncol(mat.cv1)-1))
write.xlsx(mat.cv1, file=paste0(path2,"Table_2_CV_Abundance_CoastalCod.xlsx" ))
# Table 3: Biomass indices (mean bootstrap) ----
mat1.tonn <- as.data.frame(mat.biom/(1e+3))
names(mat1.tonn) <- paste("Age", 0:(ncol(mat1.tonn)-1))
write.xlsx(mat1.tonn, file=paste0(path2,"Table_3_Biomass_indices_CoastalCod_kilotonnes.xlsx" ))
#SSB indices
mat1.tonn <- as.data.frame(mat.ssb/(1e+3))
names(mat1.tonn) <- paste("Age", 0:(ncol(mat1.tonn)-1))
write.xlsx(mat1.tonn, file=paste0(path2,"SSB_indices_CoastalCod_kilotonnes.xlsx" ))
# Table 4: Mean length by age (cm)
mat.len.age <- matrix(NA,ncol=18,nrow=length(1995:2020))
colnames(mat.len.age) <- 0:17
rownames(mat.len.age) <- 1995:2020
for(y in 1:26){
tmp <- (as.data.frame(out.acu[[y]]$ind.length.by.age)[,c("age","ind.length.age.mean")])
for(a in 1:18){
age <- a-1
if(!any(tmp$age[!is.na(tmp$age)] == age)) {
next
}
mat.len.age[y,a] <- tmp$`ind.length.age.mean`[tmp$age == age & !is.na(tmp$age)]
}
}
mat.len.age1 <- as.data.frame(mat.len.age)
names(mat.len.age1) <- paste("Age", 0:(ncol(mat.len.age1)-1))
write.xlsx(mat.len.age1, file=paste0(path2,"Table_4_Length_By_Age_By_Survey_CoastalCod.xlsx" ))
# Table 5: Mean weight by age (g)
mat.weight.age <- matrix(NA,ncol=18,nrow=length(1995:2020))
colnames(mat.weight.age) <- 0:17
rownames(mat.weight.age) <- 1995:2020
for(y in 1:26){
tmp <- (as.data.frame(out.acu[[y]]$ind.weight.by.age)[,c("age","ind.weight.age.mean")])
for(a in 1:18){
age <- a-1
if(!any(tmp$age[!is.na(tmp$age)] == age)) {
next
}
mat.weight.age[y,a] <- tmp$`ind.weight.age.mean`[tmp$age == age & !is.na(tmp$age)]
}
}
mat.weight.age1 <- as.data.frame(mat.weight.age)
names(mat.weight.age1) <- paste("Age", 0:(ncol(mat.weight.age1)-1))
write.xlsx(mat.weight.age1, file=paste0(path2,"Table_5_Weight_By_Age_By_Survey_CoastalCod.xlsx" ))
#For assessment - maturity at age
mat.maturity.age <- matrix(NA,ncol=18,nrow=length(1995:2020))
colnames(mat.maturity.age) <- 0:17
rownames(mat.maturity.age) <- 1995:2020
for(y in 1:26){
tmp <- (as.data.frame(out.acu[[y]]$maturity.by.age)[,c("age","maturity.age.mean")])
for(a in 1:18){
age <- a-1
if(!any(tmp$age[!is.na(tmp$age)] == age)) {
next
}
mat.maturity.age[y,a] <- tmp$`maturity.age.mean`[tmp$age == age & !is.na(tmp$age)]
}
}
mat.maturity.age1 <- as.data.frame(mat.maturity.age)
names(mat.maturity.age1) <- paste("Age", 0:(ncol(mat.maturity.age1)-1))
write.xlsx(mat.maturity.age1, file=paste0(path2,"Maturity_By_Age_Acoustic_CoastalCod.xlsx" ))
#Table 6
mat.age2plus <- matrix(NA, ncol=3,nrow=length(1995:2020))
colnames(mat.age2plus) <- c( "Index_2plus" ,"SD_2plus", "CV_2plus")
rownames(mat.age2plus) <- 1995:2020
for(y in 1:26){
mat.age2plus[y,1] <- (as.data.frame(out.acu[[y]]$tsnTotWithout01)[,c("Ab.Sum.mean")]/(1e+6))
mat.age2plus[y,2] <- (as.data.frame(out.acu[[y]]$tsnTotWithout01)[,c("Ab.Sum.sd")]/(1e+6))
mat.age2plus[y,3] <- (as.data.frame(out.acu[[y]]$tsnTotWithout01)[,c("Ab.Sum.cv")])
}
write.xlsx(mat.age2plus, file=paste0(path2,"Table_6_Index2+_w_sd-and-sv_CoastalCod.xlsx" ))
## End