Cruise med RV G.O. Sars, 6.–18. desember 2025 og 2.–12. mars 2026 ved Hywind Tampen (HT). Hovedmål: (1) undersøke mulig wake-effekt på hydrografi og planktonfordeling ved hjelp av ADCP-rigger og transekter med CTD- og planktonstasjoner, (2) vurdere støyforurensning og utbredelsen av denne ved hjelp av hydrofonfortøyninger, (3) kartlegge pelagisk fiskefordeling ved akustiske transekter, og "ground-truthing" ved tråling med DeepVision (kamera i trål, med åpen sekk) og eDNA, (4) undersøke rev-effekt rundt sugeankre og kjettinger ved å gjennomføre ROV-transekter, (5) utplassere landere (instrument rigger plasert på bunnen) i de to åpne havvindområdene (OW) Vestavind F og Sørvest F.
Hovedaktiviteter: Utplassere og hente inn 3 ADCP rigger: én inne i HT (mellom turbin Hy03 og Hy02), én ca. 5 km sør, og én ca. 5 km nordøst for HT. Utplassere 2 hydrofonfortøyninger på henholdsvis ca. 600 m og ca. 2 km fra HY10. Riggene ble satt ut under toktet i desember og hentet inn igjen under toktene i mars, med unntak av den ene hydrofonriggen ca. 600 m fra turbin HY10. Videre gjennomførte vi flere CTD-transekter (tvers over sokkelen og gjennom HT), hvor vi tok næringssalter, klorofyll på alle stasjoner, plankton på 15 stasjoner og eDNA på 10 stasjoner. Vi gjennomførte akustiske transekter rundt HT (blomstermønster), igjennom og på tvers av HT med G.O. Sars. Hvor vi brukte fartøyets multifrekvente akustikksystem og ADCP for å undersøke fiskefordeling i forhold til strøm og turbinstruktur. Rev-effekt ble undersøkt ved å gjennomføre ROV transekter rundt sugeankrene og langs turbinenes ankrekjettinger i tillegg til kontrolltransekter. Vi brukte også ROV for å hente opp en landerramme som vi mistet på et tidligere tokt ved HT, en ADCP-rigg inne i HT, samt for å hente opp en tapt trål i Korsfjorden nær Bergen.
Foreløpige resultat: Oseanografi og plankton: De foreløpige resultatene viste at vannsøylen ved HT var godt omblandet både inne i og rundt HT i desember og mars. Sjiktning forekom kun ved den dypeste stasjonen, ca. 400 m (kalde, svakt saltere bunnvannsmasser). Det var en høyere biomasse av plankton i de øverste 100 m, uten tydelige romlige trender i dette begrensede datasettet; artsbestemmelse pågår. Generelt var zooplanktonbiomassen signifikant lavere i mars enn i desember, noe som viser at våroppblomstringen ennå ikke hadde startet. Rev-effekt: ROV-transektene viste at pigghuder og kalkrørsorm dominerte, men var mye mer vanlig langs kontrolltransektene sammenlignet med kjettingtransektene. Noen virvelløse dyr, spesielt hummer, eremittkreps og sjøanemone, var derimot mye vanligere langs kjetting - kontra kontrolltransektene. Stedvis var det rikelig med lange langs kjettingtransektene, mens disse var mer eller mindre fraværende fra på kontroll transektene. Likeledes ble brosme bare observert på kjettingtransektene og ved sugeanker. Sei ble observert på både kontroll- og kjedetransektene (noe mer hyppig på kontroll), men denne arten tiltrekkes av kameralyset fra ROVen. Dataene er begrenset – bare syv av de tolv planlagte transektene ble utført. Fiskefordeling: I desember viste de akustiske transektene på tvers av HT redusert tetthet av fisk inne i parken (reduksjoner på ca. 0,3–1,7 dB), mens andre transekter viste akkumulering/“edge effects” inne i parken. Dette mønsteret ble ikke observert under toktet i mars; den foreløpige analysen viser dermed ingen klar tiltrekkende eller frastøtende effekt av havvindparken (OWF).
Vi måtte dessverre forlate HT uten å få hentet opp én av hydrofonriggene (den på 600 m fra turbin Hy10) på grunn av dårlige værforhold. Vi håper å kunne hente denne opp i november 2026.
Summary
Cruise with RV G.O. Sars, 6–18 December 2025 and 2-12 March 2026 at Hywind Tampen (HT). Main aims: (1) look for possible wake-effect on hydrography and plankton distribution, by ADCP moorings and transect with CTD and plankton stations, (2) asses sound pollution and its propagation, by hydrophone moorings, (3) assess pelagic fish distribution by acoustics transect, fish ground-truthing by trawling with DeepVision (camera in trawls, open cod-end) and eDNA, (4) look for reef-effect around suction anchors and chains, by conducting ROV transects, (5) deploying Landers (bottom-sat instrument riggs) in the two opened offshore wind (OW) area Vestavind F and Sørvest F.
Major activities: Deploy and retrieve 3 ADCP moorings: one inside HT (between turbine Hy03 and Hy02), one ~5 km South, one ~5 km North-East of HT. Deploy 2 hydrophone moorings on a ~600 m and ~2 km from HY10. The moorings were deployed during the December survey and retrieved during the March survey, except for the hydrophone mooring at ~600 m from turbine HY10. Further, we conducted multiple CTD transects (across-shelf and through HT), sampled nutrients and chlorophyll at all stations, plankton at 15 and eDNA at 10 stations. We performed acoustic transects around (flower) and across HT using the vessels multifrequency acoustics and ADCP, to look at fish distribution related to current and turbine structure. Reef-effect was studied by conducting transects around suction anchors and along the turbines anchor chains in addition to control transects. We further used the ROV to recover a lander frame lost on a previous cruise at HT, recover a ADCP rigg inside HT and to recover a lost trawl in Korsfjorden close to Bergen.
Preliminary results: Oceanography and plankton: prelimminary results unveil that the water column at HT was well-mixed inside and around HT. Stratification appears only at the deepest station ~400 m (colder, slightly saltier bottom water). A higher biomass of plankton in the upper 100 m, and no clear spatial trend in the limited dataset, species ID is pending. Overall, there zooplankton biomass was significantly lower in March compared to the December, proving that the spring blume had not yet started or effected the zooplankton. Reef-effect: The ROV transects showed that echinoderms and calcareous bristle worms dominated, but where much more common along the controle compared to the chain transects. Some invertebrates in particular squat lobster, hermit crabs, sea anemone where much more common along chain versus control transects. In general, demersal fish (tusk and ling) were abundant along the chain transect and more or less absent from the camera view at control transects. Saith was observed on both control and chain transects, as they are highly attracted to the camera light. Data is limited only seven out of the twelve planed transects was conducted. Fish distribution: In December the acoustics transects across HT showed reduced density/backscatter inside the farm (reductions ~0.3–1.7 dB), others showed accumulation/edge effects inside. This pattern was not seen during the March cruise, thus the preliminary study shows no clear attraction or repel effect to the OWF.
We unfortunately had to leave HT without one of the Hydrophone riggs (the on at 600 m from turbine Hy10), due to bad weather conditions. We hope to be able to pick this up in Nowember 2026.
Hywind Tampen is the first floating windfarm in Norwegian waters. With its 11 turbines it is among the biggest, floating wind farms in the world. It is built and operated by Equinor and supports oil and gas installations
Gullfaks and Snorre with renewable energy. It was constructed during 2022-2023 and holds a
total capacity of 88 MW. For more details on Hywind Tampen, structure and design look at (rapport Equinor,
2019).
1.1. The Hywind Tampen turbine structure
(text and figures taken from Equinor report: Hywind Tampen PUD del II – Konsekvensutredning).
The wind turbines are standard offshore wind turbines placed on a floating concrete base (Fig. 1). The blades are produced in fiberglass/epoxy. The turbines have a total height of approximately 190 meters from the bottom of the chassis to the centre of the nacelle. The distance between the sea surface and the blade tip is approx. 23 meters. The rotor has a diameter of 167 metres. Each wind turbine is anchored to the seabed with three anchor lines consisting of steel wire and chain (138 mm). Each of the anchor lines extend approximately 800 meters from the installations and is moored to suction anchors on the seabed. A total of 19 suction anchors of which 9 act as common anchors for 2 or 3 turbines.
The wind turbines are linked together with power cables that run between the turbines (internal cables). The power cables hit the seabed 400 - 500 meters from the turbine. Where the power cables hit the seabed, a small anchor will be installed to hold the cables in place. The internal cables that link two wind turbines together will be around 2 km long. The export cables are static cables that are buried.
Figure 1: Illustration of anchoring of Hywind Tampen turbine copied from Equinor report: Hywind Tampen PUD del II –Konsekvensutredning 2019.
1.2. Aim of cruises
These two cruises are following ups of previous yearly cruises in 2023 (Utne-Palm et al. 2023) and in 2024 (Utne-Palm et al. 2024). There is little knowledge related to how floating wind farms effect the marine environment, as this technology is still relatively new, and HT being the largest floating OW in the world. Thus, data gathered on these cruises is novel. Further, sixteen of the twenty selected OW sites in Norway are in deep water area where floating turbines are needed. Thus, any knowledge we can get from HT regarding environmental effects is of great value to the development of offshore wind in Norway. Offshore wind impacts the maritime environment, primarily through underwater noise from constructions and turbine operation, changes to wind-driven ocean currents (wake-effect), electromagnetic fields from subsea cables, habitat alterations (reef-effect), and chemical and solid discharges, from corrosion (microplastic from turbine blades) and the continuous leaching of heavy metals from anti-fouling and galvanic protection systems. We have aimed at covering as many as possible of these factors on our cruises.
Wake-effect: The windfarm removes wind, causing a wake, that may affect the water stratification and current system in the area around HT. That in turn might affect plankton distribution. To study this effect, we conducted several CTD transects across the windfarm and shelf area. On selected stations (15 in total), we also took water-bottle samples for nutrients and chlorophyll a as well as plankton samples (WP2 plankton net), on the March cruise eDNA was also taken at these 10 stations. Throughout the cruise, we collected current measurements using the vessel-mounted ADCP. We further deployed and retrieved 3 ADCP moorings; one within HT, one south and one north of HT.
Underwater noise: We deploy two hydrophone moorings one at 600 m and on at 2 km distance to turbine 10 (Hy10). The hydrophone data from these two moorings will be used to evaluate sound propagation models for HT (part of the NFR project WindSys). All moorings were deployed on the December cruise and was to be picked up on the March cruise.
Fish distribution: Thus, to look at possible attraction or avoidance effects on pelagic fish distribution, we conducted several acoustics transects through and around the wind farm with RV G.O. Sars aiming at completing several transect from ~5 nm outside and through HT following the same flower-like transect that we used in previous years.
For ground truthing of acoustic findings we use a trawl with an open cod-end equipped with a camera (DeepVision), and we sample eDNA from different depths.
Reef-effect: Our aim was to gain more knowledge about the effects of floating offshore wind farms on the bottom environment. The wind turbines at Hywind Tampen are secured to the soft bottom by suction anchors and chains. All subsea hard structure: the anchors, chains and the submerged part (90 m) of the turbine pilar, introduce a new type of habitat in this softbottom area. A habitat that we expect will be colonized by hard bottom species, resulting in additional food sources and shelter for higher trophic levels (Lindboom et al. 2011). Studies have shown that ecosystem processes and properties can be sensitive to changes in food web generated by OWF installations (Burkhard et al., 2011).
G.O. Sars is not allowed closer then 500m to the turbines, thus, in 2023 we used an acoustic kayak drone within the 500 m range to the wind turbines. With the kayak drone we managed to get as close as ca 20 m to the turbines, however, this was not close enough for the acoustic to cover the fundament and the area close by where we expect to find fish aggregations (Reef-effect). In 2023 we also conducted ROV transects along six anchor chains and 3 suction-anchors including control transect (no structure), to look for possible reef effect around the bottom mounted structure. During the 2025 and 2026 cruise we aimed at repeating these transects to look for possible changes in fauna around the structure after three years of operation.
As part of the WindSys project we have deployed what we call an ObsFAD at HT, an observation rigg holding an echosounder, CTD, hydrophone, telemetry and a Fish Aggregation Device (set of underwater buoys at ~25 m depth). Hopefully this device will aggregate pelagic fish, and allow behavioural studies related to the temporal variations in windfarm noise. For the WindSys project, where Equinor is a collaborator, we have also deployed a Lander at HT. This lander holds, a bottom mounted multibeam echosounder, ADCP, hydrophones, CTD, oxygen – and turbidity sensors. Thus, the Lander will give us the possibility to observe fish behaviour related to sound and other environmental factors. Data is downloaded once a year from these to platforms, next time is November 2026.
2. Activity
2.1. Hywind Tampen (7 to 17th of December)
A detailed logbook of all activities during the cruise is available in Appendix (6. All stations).
Given bad weather predictions, with only a narrow window of less strong wind, over the next 1-2 days, we steamed directly to HT to deploy ADCP’s and hydrophones, hoping for the sea to calm down for ROV deployment. Or plan 1 was to conduct the follow up ROV transect along the chain and suction anchors at HT, and to retrieve a Lander frame that we had left on the bottom inside HT on a previous cruise. To be able to use ROV Freyja we need calm weather (< 2m waves). The Tampen area is known for its rough seas and wind, so we had to use any calmer window efficiently.
2.1.1 Deployment of Hydrophones and ADCP moorings
Before entering Hywind Tampen we contacted Equinor to open our working licences at HT. We started with deploying the two hydrophone moorings. Hydrophone mooring 1 was sat at 600 m from Hywind Turbine 10 (Hy10). Hydrophone mooring 2 was placed at 1400 m from Hydrophone 1 and 2000 m from Hy10at (positions are given in Table 1). This was followed by the deployment of the three ADCP moorings. ADCP1 was deployed within HT between Hy02 and Hy03, close to suction anchor no. 7 (SA07). ADCP2 was deployed ~5km south of turbine no. 6 (Hy06), and ADCP3 was deployed ~5km north-east of turbine no. 1 (Hy01). Positions of the ADCP moorings corresponded to our earlier deployments in March 2023.
After deployment all 5 moorings were added to Barentswatch, and information on position and type of equipment was sent to Equinor, and fishers organisations.
Hydrophone mooring design
The hydrophone mooring consisted of two hydrophones and CTD mounted in a float and attached by rope to an acoustic release which is attached by chain to a bottom anchor in form of two train wheels (Appendix fig. 4 and 5). Hydrophone mooring 1 holds two Aural M3 hydrophones, while Hydrophone mooring 2 holds two SoundTrap hydrophones.
ADCP mooring design
The moorings consisted of a Signature250 ADCP mounted in a float and attached by rope to an acoustic release which is attached by chain to a bottom anchor in form of train wheels (see Appendix 1, 2 and 3). ADCP’s have a CTD on their mooring, clamped onto the rope below the ADCP. The mooring is equipped with an acoustic release. The acoustic triggers act as transponders. When desired, we can send a signal from G.O. Sars and measure distances.
Table1. ADCP and Hydrophone mooring positions.
Mooring
Latitude
(DDM)
Longitude
(DDM)
~ bottom depth (m)
Comment
ADCP1
61° 20.79'N
2° 15.61'E
292
Close to suction-anchor no. 7 (SA07)
ADCP2
61° 15.38'N
2° 17.35'E
250
5km south of turbine no. 6 (HY06)
ADCP3
61° 23.35'N
2° 20.07'E
315
5km north-east of turbine no. 1 (Hy01)
Hydrophone 1
two Aural M3
61° 20.56'N
2° 13.67'E
287
~ 600 m from turbine no. 10 (Hy10)
Hydrophone 2
Two sound-traps
61°20.36' N
2° 12.17' E
282
~2000 m from turbine no. 10 (Hy10)
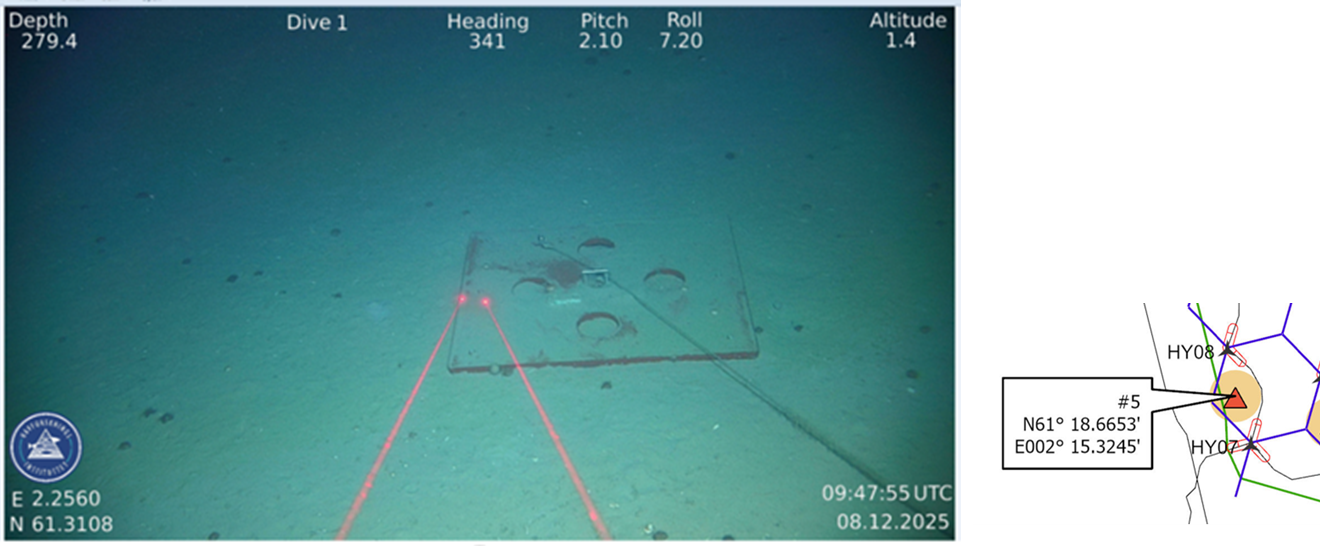
Figure 2. Left: Picture of Lander bottom frame, taken by ROV Freyja during pick up at Hywind Tampen. Right: Position of Lander at Hywind Tampen, depth is 280 m.
2.1.2. Retrieve Lander frame with Dyneema rope
A Lander’s bottom plate and Dyneema rope (300m long) were lost when retrieving the Lander in summer 2025 (Fig. 2). The Lander frame was within HT between Hy08 and Hy07. Followed by asking Equinor Kokstad to open or working licences we deployed ROV Freyja.
Method: We used a detailed map of underwater structure (provided by Equinor) to keep >250m away from HT cables and chains in our search. Before deploying ROV we also considered current direction, given that there was a 300 m long rope attached to the lander bottom plate. We used the ROV to connect a rope from the aft winch to the lander bottom plate, while paying attention to the current we could lift in the ROV while also lifting lander bottom plate.
Lost the ROV: The tether tired off when latching the ROV on board, due to one big swell. We asked Equinor for permission to use the mob boat to pick up the ROV as it was drifting towards turbine Hy08. Using the mob boat to tow it back out of the 500 m restriction zone, where GO Sars could pick it up.
2.1.3. CTD transects, with water sampling and plankton net
After asking Equinor Kokstad to open licences we conducted a CTD station transect across HT starting at the Tampen plateau and down the slope (from South-West to North-East). We also did two control transects over the same depth range across the shelf north and south of Hywind Tampen (Fig. 3, left). At every CTD station on the cross shelf transects (Fig. 3 left) we also took water samples for nutrients and chlorophyll a as well as plankton net (WP2) hauls.
When we were within HT we always stopped the CTD or WP2 net at 20 m above seabed due to underwater structure (e.g. floated cables, anchor, chains).
A CTD transects with nutrients only were also conducted running through HT from South-West to North-East and from North-West to South-East (see Fig. 3 mid). Furthermore, we did an extended cross shelf CTD transect (Fig. 3 right), that was an extended version of the central Mid cross shelf transect (Fig. 3 left).
Nutrients
We used IMR’s standard sampling depths: 5, 10, 20, 30, 50, 75, 100, 125, 150, 200, 250 and 300 m.
Chlorophyl
We sampled chlorophyl a from surface to 100 m depth in the same standard intervals as for the nutrients (see above).
Zooplankton sampling
Plankton samples were always taken by two net hauls. First from 100 m to surface and then from bottom to surface using WP2 net. Our plan was to take from the pycnocline to surface, but as the water column was so well mixed by all the bad weather conditions, we could not see a clear pycnocline and decided to sample upper 100 m as standard. Plankton samples were only taken at the 15 stations in the cross shelf transect (Fig. 3 left).
Figure 3. CTD transects conducted on this cruise: Left: Cross shelf CTD transect with water samples, nutrients, chlorophyll a and WP2 net at all 15 stations. Mid: CTD transects trough HT, South-West to North-East and North-West to South-East transect. Right: Long cross shelf transect. On the same line as the middle transect in far-left figure, but with one extra station added in the shallow end - and two extra stations at the deeper end.
2.1.4. Studying Reef effect along subsea installation – by ROV
On a cruise to HT in March 2023, ca one year after the building of HT started, we conducted 12 ROV transects, around suction-anchor 6, 9 and 12 (SA06, SA09, SA12). In 2023 we used REEV Oceans ROV “Aurora”. On these cruises we aimed at repeating the 12 video-transects, see Fig. 4 for position related to HT structure, and Table 2 for more detailed transect position.
Followed by asking Equinor Kokstad to open licence we revisited two of the suction anchors (no. 6 and 9, SA06 and SA09).
In 2025 we conducted three ROV (Freyja) transect starting at the control transect going from North-West towards SA06. In the same dive we also did the transect along the chain from SA06 towards turbine Hy10, and the control transect from South-West towards SA06, before we had to surface due to bad weather coming in.
Method: During the ROV transect G.O. Sars positioned outside the safety zone (> 500 m from any turbine) close to the suction anchor. The ROV enters at the suction anchor and either follows the anchor chain 350-500 m towards the turbine Hy10 or 350-500 m along the control line (Fig. 4). This is the same method and procedures that we used in 2023. We used detailed map of underwater structure to keep >500 m away from cables and chains.
Figure 4. Map of the area. ROV investigations that was conducted in 2023 are marked with a red circle. Dashed red lines are transect /video lines along the anchor chains. Dashed yellow lines are video control lines. The Red circle is 500m in radius. Green circles are core stations, yellow cross turbine positions.
Due to bad weather (swells > 2m) we only managed to conduct transect line 2, 3 and 4 (Table 2). That included three control lines and one chain line around suction anchor 6 (SA06).
Table 2. Start and stop position for the planed ROV video transect (the transect conducted in 2023)
Anchor
Lat
Long
Transect
line_id 2023
Lat_Deg
Lat_Decmin
Long_Deg
Long_Decmin
SA06
61.35263473
2.2208763
SA06
1
61
21.1580838
2
13.252578
Strat Chain Hy11
SA06
61.34944191
2.2274465
SA06
1
61
20.9665146
2
13.64679
Stop Chain Hy11
SA06
61.35375949
2.2299206
SA06
2
61
21.2255694
2
13.795236
Start Chain Hy12
SA06
61.34942927
2.2274593
SA06
2
61
20.9657562
2
13.647558
Stop Chain Hy12
SA06
61.34504478
2.2250276
SA06
3
61
20.7026868
2
13.501656
Start Control
SA06
61.34938577
2.2274723
SA06
3
61
20.9631462
2
13.648338
Stop Control
SA06
61.34619263
2.2340412
SA06
4
61
20.7715578
2
14.042472
Start Control
SA06
61.34937505
2.2274882
SA06
4
61
20.962503
2
13.649292
Stop Control
SA09
61.33957884
2.2279873
SA09
5
61
20.3747304
2
13.679238
Start Chain Hy09
SA09
61.33637235
2.2345517
SA09
5
61
20.182341
2
14.073102
Stop Chain Hy09
SA09
61.3331341
2.2411412
SA09
8
61
19.988046
2
14.468472
Start Chain Hy10
SA09
61.33632953
2.2345799
SA09
8
61
20.1797718
2
14.074794
Stop Chain Hy10
SA09
61.34070092
2.2370246
SA09
6
61
20.4420552
2
14.221476
Start Control
SA09
61.33638374
2.23455
SA09
6
61
20.1830244
2
14.073
Stop Control
SA09
61.33198798
2.23212
SA09
7
61
19.9192788
2
13.9272
Start Control
SA09
61.3363166
2.2345923
SA09
7
61
20.178996
2
14.075538
Stop Control
SA12
61.32651995
2.2350869
SA12
9
61
19.591197
2
14.105214
Start Chain Hy08
SA12
61.32331441
2.2416445
SA12
9
61
19.3988646
2
14.49867
Stop Chain Hy08
SA12
61.31893016
2.2392128
SA12
11
61
19.1358096
2
14.352768
Start Chain Hy09
SA12
61.32327029
2.241676
SA12
11
61
19.3962174
2
14.50056
Stop Chain Hy09
SA12
61.32764222
2.2441221
SA12
10
61
19.6585332
2
14.647326
Start Control
SA12
61.32332517
2.2416476
SA12
10
61
19.3995102
2
14.498856
Stop Control
SA12
61.32007517
2.2482353
SA12
12
61
19.2045102
2
14.894118
Start Control
SA12
61.32325802
2.2416898
SA12
12
61
19.3954812
2
14.501388
2.1.5 Core samples for bacteria and pollutants
Running ROV transects gave us the possibility to take sediment samples in accurate positions in a gradient design from the wind turbines, to look at bacteria and pollutants. Our plan was to take a push core at the beginning and end of each ROV transect (12 transect, 24 core samples).
Method: 8. We used sterile equipment, cleaned knife and core tube with alcohol between samples. We slice off top 5 cm of core sample, placed it in a sterile plastic bag and stored it in -80°C freezer.
2.1.5. Acoustic study – and trawling with DeepVision
Hywind Tampen might attract fish to the added structures, or it might scare fish away by noise and activity. We therefore want to look at any possible attraction or avoidance effect by conducting an acoustic transect within Hywind Tampen to 5 nm from the farm using vessel mounted broadband echosounders (Kongsberg Discovery EK80; 18, 38, 70, 120, 200, 333 kHz). We did acoustic transects through HT (yellow line) from North to South and the opposite way (direction based on current and wind), and in a flower shape (blue lines) around and across HT as well as across (red lines) and along (green arrows) (Fig. 5).
Figure 5. Acoustic transects taken around (blue Flower) and through (yellow) and across (red) at Hywind Tampen.
DeepVision
To identify organisms in the major scattering layers observed by the acoustics we used an open-ended pelagic trawl with the DeepVision camera system in several trawl hauls along the park, taking pictures of the catch as it passes through the trawl.
2.1.6 Continuous underway measurements
Throughout the cruises, currents throughout the water column were monitored using the research vessel-mounted ADCPs (Teledyne RDI Ocean Surveyor at 75 kHz and a Kongsberg EC150 (150kHz)), this was synchronised with the scientific echosounder and controlled using UHDAS.
Likewise, was G.O.Sars bottom mounted broadband echosounders (Kongsberg Discovery EK80; 18, 38, 70, 120, 200, 333 kHz) on throughout the cruise.
2.2. Activity Cruise 2 to 12 March 2026
A detailed logbook of all activities during the cruise is available in Appendix (6). This cruise started off with deployment of Landers in two areas in the North Sea where Norway is planning offshore wind in the near future (Sørvest F and Vestavind F). After deploying the Landers we continued to Hywind Tampen.
2.2.1. Deploy Lander’s at offshore wind sites
Five Landers were deployed: three in Southern North Sea (Sørvest F), and two in the Utsira area (Vestavind F). Two Landers were deployed inside the OW area “Sørvest F” and on in a control area south-west of Sørvest F. Further were on lander deployed inside the OW area “Vestavind F” and one in a control area south-west of Vestavind F.
Lander details
The lander is built by Develogic. It holds three hydrophones type HTI-99 UHF, ADCP (Acoustic Doppler Current Profiler) Nortek Signature100, CTD (Conductivity, Temperature and Depth) Seabird SBE37-SMP MicroCAT, oxygen sensor (Aanderaa Oxygen Optode 4330) and transmissometer, WBAT (Wide Band Autonomous Transceiver) Simrad, with two T218 transducers, Simrad ES70-7CD split-beam transducer and Simrad ES120-7CD split-beam transducer, data logging system and batteries (Fig. 6 and Table 4).
Method: Deployment was done from the ship hangar traverse beam block winch. Position was monitored by the HIPAP system. When retrieving the Lander: The Lander housing (in titanium) is connected to a steel platform that functions as a weight. The Lander holds a built-in acoustic release system, that releases the Lander from its platform. A connection wire between the Lander and the platform makes it possible to pick up the entire device without using an ROV. Unfortunately, these five landers delivered without such a connecting wire, therefore this must be added on before next deployment.
Figure 6. Four of the five Landers on deck before deployment.
Figure 7. The figure above shows the position of the Landers in relation to the offshore wind areas. The depth at which they are located is given in the table to the left of the figure. Coordinates are given in Table 3.
Table 3. Position coordinates of the 5 Landers deployed in Sørvest F and Vestavind F. ID corresponds to table in Figure 7.
Offshore Wind area
ID in map (Fig. 7)
Decimal Degrees
Degrees, Decimal Minutes
Depth
DD (N)
DD (E)
DDM (N)
DDM (E)
Map / measurement (m)
Vestavind F
4-6033
59.1320933828
4.53456538831
59° 7.9256’
4° 32.0739’
261 / 259
Control Vestavind F
5-6034
58.50659
4.83946648394
58° 30.3954’
4° 50.3679’
281 / 278
Sørvest F
3-6032
56.8234816597
5.28552992048
56° 49.4089'
5° 17.1318'
57 / 57
Sørvest F
2-6031
56.7791654519
5.13800087149
56° 46.74993'
5° 8.28005'
60 / 61
Control Sørvest
1-6030
56.3738137118
3.77664391682
56° 22.42882'
3° 46.59864'
66 / 66
Table 4. Offshore wind landers sensors.
ADCP
CTD
Hydrophone
Echosounder
Transmissometer
Oxygen
Nortek Signature 100
RBR Concerto3
3x SubMares w/ 3xHTI-99 UHF
Kongsberg Discovery WBAT w/ ES70-7CD, ES120-7CD
Seabird CST-25-DR
AADI 4831 IW
2.2.2. Activity at Hywind Tampen 2026.
The planed activity at HT, was to repeat the hydrographic, plankton and acoustic studies conducted on our December 2025 cruise (see section 2.1). Conduct the rest of the ROV transects (see section 2.1.4). Retrieve the three ADCP rigs, and the two hydrophone rigs deployed on the last cruise (see section 2.1.1). Further we took eDNA, to ground through what we saw on the acoustics. On this cruise we had asked for ROV Ægir, as it is able to work in rougher sea than ROV Freyja. With Ægir on board we could not trawl, and we did therefor not get any DeepVision data. However, Ægir was chosen as we wanted to prioritise finishing the ROV transect along the chain and suction anchors and to retrieve our ADCP and hydrophone rigs.
2.2.2.1. CTD transects, with water sampling eDNA and plankton net
CTD transects
Due to bad weather conditions ahead we prioritize conducting the cross-shelf transects (Fig. 3 left), as this was the transect where also plankton and eDNA were going to be collected. Furter, we sampled station 3 to 6 on this transect passing through the park going from South-West to North-East (Fig. 3 central).
Zooplankton
Zooplankton community sampling was extended during the 2026 cruise, to assess samples for DNA studies. At each station, four WP2 net hauls were conducted: two hauls from 100 m to the surface and two hauls from near bottom to the surface. Due to vessel drift and the time required for each haul, sampling was performed in two stages: one full-depth haul and one 100 m haul were completed first, after which the vessel was repositioned before conducting the remaining two hauls.
Initial sampling design targeted the pycnocline-to-surface layer; however, as the water column was well mixed and no distinct pycnocline was observed during the survey, the upper 100 m was adopted as a standardized sampling depth for the shallow hauls. Zooplankton samples were collected at 15 stations along the cross-shelf transects (Fig. 3 left).
The first two hauls at each station were processed onboard according to standard IMR protocols (Appendix 8). Material from the remaining two hauls was preserved directly in approximately 80% ethanol for subsequent genetic analyses, including DNA metabarcoding of genomic DNA. Genetic analysis and taxonomic identification of specimens to the highest possible resolution is ongoing. The integration and comparison of genomic DNA data, eDNA metabarcoding results, and taxonomic identifications will enable a more comprehensive characterization of plankton community composition.
eDNA sampling
Environmental DNA (eDNA) analysis provides a non-invasive approach for assessing species presence in marine environments through the collection and analysis of water samples. Water samples for eDNA analysis were collected along three cross-shelf CTD transects, in addition to a supplementary station located within the wind farm (Fig. 3 left and mid). Furthermore, an additional sample was obtained from the onboard water system during transit between Sørlige Nordsjø II and Hywind Tampen.
At each station, triplicate water samples (5 L each) were collected from three discrete depths: near-surface, mid-water column, and near-bottom. Surface samples were obtained at approximately 10 m depth, while bottom samples were collected approximately 20 m above the sea floor. Sampling closer to the seabed was restricted due to the presence of wind farm infrastructure. Prior to water sampling, a CTD cast was conducted to assess vertical stratification, including the presence of a pycnocline. As the water column was generally well mixed during the sampling period, the mid-water depth was selected to represent intermediate conditions.
A total of 82 samples were collected across 10 stations (3 stations per transect + one additional inside HT), corresponding to 8–9 samples per station. At the two stations located within Hywind Tampen, all nine samples were obtained. At stations outside the wind farm, one of the three near-bottom replicates was omitted due to a limited number of available filters. In addition to environmental samples, multiple controls were included: one air control, freshwater controls collected before and after cleaning of sampling equipment (four in total), and three additional near-surface samples collected from a hose during transit to Hywind Tampen.
Filtration was conducted onboard using three 500 mL filter holders (Nalge Nunc International Corporation, Rochester, USA) connected to an EZ-Stream peristaltic pump (Merck KGaA, Darmstadt, Germany). Water samples were filtered onto 2.0 µm glass fiber filters (Merck KGaA). Immediately following filtration, filters were preserved in ATL buffer (Qiagen GmbH, Hilden, Germany) and stored until subsequent DNA extraction. Between samples, all filtration equipment was decontaminated using a bleach solution followed by rinsing with freshwater to minimize the risk of cross-contamination.
Figure 8. The map shows the CTD transects where eDNA was sampled marked with yellow circle.
2.2.2.2. Studying Reef effect along subsea installation – by ROV “Ægir”
In 2026 we conducted four ROV transects starting on a control transect from North-West towards SA09, continuing with transect from SA09 along the chain towards Hy09 (Fig. 4). Followed by a control transect from South-West towards SA09, continuing with a chain transect from SA09 towards Hy10 (line 5, 6, 7 and 8, Table 2, start stop positions on this cruise is given in Appendix 7). With a core sample next to the suction anchor (SA09). We also tried to get a core sample at the end of the chain transect (closest to the turbine), but something was wrong with the corer, so we only got one core sample.
Technical problems with the ROV stopped us from continuing and finalising our transect study.
2.2.2.3. Acoustic study
Like in December 2025 we did acoustic transects through HT from North to South and the opposite way (direction based on current and wind), and in a flower shape around and across HT as well as along HT (Fig. 5). Having ROV Ægir onboard we could not trawl, as part of its equipment covers the trawl deck. Thus, on this cruise we must use the eDNA samples, to ground through what we see on the acoustics.
3. Results
3.1. Hydrography
3.1.1. Hydrographic data from 2025 cruise
Preliminary results from the CTD transects across the shelf and from north to south through the wind farm (Fig. 9 and 10) indicate a well-mixed water column within and around HT. Signs of stratification are related to the circulation in Norskerenna at the deep ends of the transects. They include colder and slightly more saline bottom waters and surface elevated salinities. This is confirmed in the E-W transect that extends the mid transect into the deepest part of the trough (Fig. 11).
Vessel-mounted ADCP data are currently being processed.
Figure 9. CTD transects cross shelf: Conservative temperature (top row) and absolute salinity (bottom row) along the three cross-shelf transects (Fig. 3, left). Grey vertical dashed lines indicate CTD station positions. The CTD station within HT on the mid transect is marked in black.
Figure 10. CTD transects North-South: Conservative temperature (top row) and absolute salinity (bottom row) along the N-S transects (Fig. 3, mid panels). Grey vertical dashed lines indicate CTD station positions. The CTD stations within HT are marked in black.Figure 11. CTD transect East-West transect: Conservative temperature (top row) and absolute salinity (bottom row) along the E-W transect (Fig. 3, right). Grey vertical dashed lines indicate CTD station positions. The CTD station within HT is marked in black. Note different clour scale to Fig. 9 and 10.
3.1.2. Hydrographic data from 2026 cruise
Figure 12. Northern transect (Fig. 3 left). Vertical temperature (°C; upper panel) and practical salinity (PSU; lower panel) profiles from a CTD transect across the continental shelf in the Hywind Tampen region. The transect includes five stations extending from shallow shelf waters toward deeper offshore conditions. The dashed line marks the CTD station obtained within the wind farm.Figure 13. Mid transect (Fig. 3 left) Vertical temperature (°C; upper panel) and practical salinity (PSU; lower panel) profiles from the Northwest CTD control transect across the continental shelf in the Hywind Tampen region. The transect includes five stations extending from shallow shelf waters toward deeper offshore conditions, north of the wind farm.Figure 14. Vertical temperature (°C; upper panel) and practical salinity (PSU; lower panel) profiles from the Southeast CTD control transect across the continental shelf in the Hywind Tampen region. The transect includes five stations extending from shallow shelf waters toward deeper offshore conditions, south of the wind farm.
Preliminary CTD transects across the shelf and from north to south of Hywind Tampen (Fig. 12, 13 og 14) show a largely well-mixed water column within and around the wind farm when expressed in terms of practical salinity (PSU) and temperature (℃).
Salinity profiles show minimal vertical variability across all transects, with changes confined to small decimal-scale variations. Temperature exhibits a weak decrease with depth, particularly in the deeper portions of the transects. This vertical temperature structure is most pronounced along the mid-shelf transect and likely reflects larger-scale circulation in Norskerenna.
3.2. Plankton biomass 2025 and 2026
Plankton samples were taken at each station on the cross shelf transect (Fig. 3. Left). The biomass of different size groups of plankton caught in the WP2 from bottom – 0 m or from 100 – 0 m, during the cruise in December 2025 and March 2026 is shown in Figure 15. There was a higher biomass in the upper 100 m as expected, and the biomass was, however, significantly larger in December compared to March (Fig.16). Otherwise, there were now clear trends in the biomass distribution related to HT Species composition has not yet been looked at.
Figure 15. Biomass of different size groups of plankton caught by WP2-net. (a) Net-haul from bottom to surface, during the 2025 and 2026 cruise (b) Net hauls upper 100 m.
Figure 16. Comparing zooplankton biomass by station between 2025 and 2026, using pared t-test.
3.3. ROV study of possible Reef and structure effect 2025 and 2026
The Station overview of the ROV transects follows the transect names used in 2023 cruise report (Table 2).
The benthos biologists made annotations of animals as they appaired on the video during transects. Number of organisms within some organisms’ groups were counted during the control transects and the chain transect as well as around the suction anchor (SA06), and this is given in Table 5. In 2026 they aditionaly made a descriptive annotation of biotope and the organism most frequently observed (see below).
Table 5. Noted organisms’ groups along the ROV transects in 2025 (HT01-HT04) and 2026 (HT05-HT08). Transect HT01: was a transect from suction anchor 06 (SA06) along the chain towards turbine HY10; Transect HT02: control transect from SA06 towards north-west; Transect HT03: control transect from SA06 towards south-west; HT04: video observations around suction anchor SA06; Transect HT05: control transect from SA09 to north-west; Transect HT06: from SA09 south-east along chain towards Hy09 (Hywind Turbine 9); Transect HT07: control transect from SA09 towards north-west; Transect HT08: chain transect from SA09 going north-east to Hy10 (Hywind turbine 10). Taxon are given when possible to determin, also common name in English and Norwegian are given.
2025
2026
Chain
Control
Control
Suction anchor
Control
Chain
Control
Chain
Taxon
Common names
Norwegian
Species group
HT01
HT02
HT03
HT04
HT05
HT06
HT07
HT08
Actiniaria
sea anemone
anemone
sea anemone
1
1
1
Amphipoda
amphipod
amphipode
amphipod
1
3
1
1
Aporrhais sp.
pelican’s foot (whelk)
snegl
whelk
3
Argentina sp.
argentine smelt
vasssild /strømsild
fish
1
1
1
Astarte sp.
astartid clam
bivalv
Bivalve
11
2
4
1
Asterias rubens
common starfish
vanlig korstroll
sea star
4
1
1
14
3
8
Asteriidae
asteriid sea star
sjøstjerne
sea star
1
5
3
16
Asteroidea
sea star
sjøstjerne
sea star
44
13
12
7
9
5
8
Balanidae
acorn barnacle
rur / rankefotinger
barnacle
1
6
Bolocera tuediae
deeplet sea anemone
mudderbunnsjørose
sea anemone
1
2
Brachyura
true crab
krabbe
crab
3
Brosme brosme
tusk
brosme
fish
4
6
5
Buccinoidea
whelks and allie
snegl
whelk
3
1
Buccinum sp.
whelk
snegl
whelk
2
1
1
5
Burrow cave
hule
1
3
2
1
2
Burrows
gravehull
2
22
8
40
12
Caridea
true shrimp
reke
shrimp
75
32
28
2
Cephalopoda benthic
benthic cephalopod
blekksprut
Cephalopod
1
Chimaera monstrosa
rabbitfish / ratfish
havmus
fish
1
Colus sp.
whelk (genus Colus)
snegl
whelk
2
14
7
1
Crangonidae
sand shrimp
reke
shrimp
3
2
Ditrupa tubes
calcareous bristle worm
kalkrørsorm
bristle worm
204
1132
1040
1463
135
1505
5
Epizoanthus sp.
colonial zoanthid
anemone
sea anemone
2
Filograna implexa
bristle worm
børstemark
bristle worm
2
1
1
Flabellum macandrewi
solitary cup coral
steinkorall
coral
1
Flustridae
flustrid bryozoan
mosdyr
Bryozoa
2
Gadiculus argenteus
silvery codling
sølvtorsk
fish
9
2
7
14
19
4
Galatheoidea
squat lobster
trollhummer
squat lobster
2
Glyptocephalus cynoglossus
witch flounder
smørflyndre
fish
1
1
1
2
Gracilechinus acutus
regular sea urchin
kråkebolle
sea urchin
815
681
1035
853
1053
1785
1133
Helicolenus dactylopterus
bluemouth rockfish
blåkjeft
fish
4
1
1
1
2
Henricia sp.
henricia sea star
blodsjøstjerne
sea star
1
Hormathiidae
hormathiid sea anemone
anemone
sea anemone
20
7
150
10
50
Hydrozoa
hydroid
hydroider
Hydrozoa
6
1
1
7
2
Lebensspuren feces
feces
ekskrement
3
6
Lebensspuren tracks
trace mark
spor
1
1
1
1
Lepidorhombus boscii
four-spot megrim
fireflekket var
fish
1
3
1
3
1
Lophius sp.
monkfish / anglerfish
breiflabb
fish
1
1
Merlangius merlangus
whiting
hvitting
fish
1
Mesothuria intestinalis
sea cucumber
tarmpølse
sea cucumber
1
Metridium senile
plumose anemone
sjønellik
sea anemone
1
Micromesistius poutassou
blue whiting
kolmule
fish
2
Molva molva
ling
lange
fish
13
1
21
2
17
4
25
Munida sp.
squat lobsters
trollhummer
squat lobster
95
1
11
5
384
Nephrops cave
Norway lobster burrow
sjøkreps hule
2
4
2
Neptunea sp.
whelks
snegl
whelk
1
1
Ophiuroidea
brittle star
slangestjerne
brittle star
27
3
1
6
3
6
Paguridae
hermit crab
eremittkreps
hermit crab
29
1
2
1
225
4
80
Pandalidae
pandalid shrimp
reke
shrimp
2
3
18
12
30
Parastichopus tremulus
sea cucumber
rødpølse
sea cucumber
23
12
11
7
12
20
9
Phycis blennoides
greater forkbeard
skjellbrosme
fish
2
2
1
2
Pleuronectiformes
flatfish
flyndre
fish
2
5
2
3
2
Pollachius virens
saithe
sei
fish
6
12
12
19
11
8
Pontaster tenuispinus
sea star
sjøstjerne
sea star
31
2
6
61
51
27
14
Porania pulvillus
cushion star
sjøstjerne
sea star
2
1
2
Porifera
sponge
svamp
sponge
2
1
Prosobranchia
snail
snegl
snail
1
3
2
Psilaster andromeda
sea star
andromedasjøstjerne
sea star
1
Sabellidae
fan worm
påfuglmark
bristle worm
7
6
1
54
2
16
2
Scalpellidae
stalked barnacle
rur /rankfotinger
barnacle
3
Seaweed fragments
seaweed fragments
tang / tare
9
1
1
7
4
10
Serpulidae
tube-dwelling polychaete
kalkrørsorm
bristle worm
5
1
2
1
1
Spatangus sp.
irregular sea urchin
irregulær sjøpinsvin
irregular sea urchin
1721
1900
2420
1101
1413
2775
1070
Stichastrella rosea
rose star
rødstjerne
sea star
1
Suberites sp.
sponge
svamp
sponge
6
Teleostei
teleost / bony fish
fisk, beinfisk udefinert
fish
6
8
3
1
5
3
2
Trisopterus sp.
poor cods
sypike /øyepål
fish
25
6
1
1
2
1
Annotations from ROV transect 2026
HT05 (06.03.26 at 15:42 UTC)
Control transect starting in North-West moving South-East 500m off the chaintowards suction anchor SA09.
Muddy sand with some burrows. Tracks from burrowing sea urchins all the way.
The sea urchins Gracilechinus and Spatangus dominated the transect in addition to Ditrupa tubes. The sea star Pontaster tenuispinus and Sabellidae tubes were also frequently observed.
Some saithe (Pollachius virens) were following the ROV along the video line, and several flatfish were observed, including Glyptocephalus cynoglossus and Lepidorhombus boscii. Ling (Molva molva), and greater forkbeard (Physcis blennoides) were also seen.
Transect starting from suction anchor SA09, continuing South-East along the anchor chain.
Filming the suction anchor before the video line. Several ling (Molva molva) at the anchor. Also tusk (Brosme brosme) and saithe (Pollachius virens) swimming around. Some sea stars, hydroids and barnacles.
Muddy sand with some burrows along the video line. Tracks from burrowing sea urchins all the way.
The sea urchins Gracilechinus and Spatangus were dominating. Hermit crabs with Hormathiidae anemones were frequently observed. Ditrupa tubes and the sea stars Pontaster tenuispinus and Asterias rubens were common. Also, several Molva, Colus, Gadiculus, Parastichopus and Munida were seen in the video line.
The transect stopped 480 m in the line when the chain rose above the sea floor.
Attempt to take push core at the end of the line failed, due to problems with the core.
HT07 (07.03.26 at 08:05 UTC)
Control transect in North East direction 500 m off chain towards suction anchor SA09.
A push core was taken at the start of the video line approximately 500 m from SA 09.
Muddy sand with some burrows. Tracks from burrowing sea urchins all the way.
The sea urchins Gracilechinus and Spatangus were very abundant. High densities of Ditrupa tubes were also observed.
Common species along the transect were the sea cucumber, Parastichopus tremulus and the sea star Pontaster tenuispinus. Sabellidae tubes, shrimps (Pandalidae), Hormathiidae and Colus snails were also common, in addition to saithe (Pollachius virens) and silvery pout (Gadiculus argenteus). A few Astarte shells, ling, squat lobsters and hermit crabs were also seen.
HT08 (07.03.26 at 09:08 UTC)
Transect from suction anchor (SA09) on chain North East direction towards Hy10.
Started at the suction anchor, but more detailed filming of this area was done in the previous dive.
Muddy sand with some burrows. Tracks from burrowing sea urchins all the way along the video line.
The sea urchins Gracilechinus and Spatangus dominated, and Squat lobsters (Munida), were also abundant along the chain. Hermit crabs with Hormathiidae anemones were frequently observed, in addisjon to ling (Molva molva), sea stars (Asterias rubens, Pontaster tenuispinus and shrimps (Pandalidae).
Some sea cucumbers (Parastichopus tremulus), brittle stars, sponges, seaweed fragments, tusk (Brosme brosme) and silvery pout (Gadiculus argenteus).
Poor visibility towards the end of the line due to movement from the chains and the videoline was stopped after approx. 350m
Attempt to take a pushcore at the end of the line failed, due to problems with the core.
Litter observed: A part of a loading strap on the chain.
Preliminary results indicate a lower number of irregular sea urchins and bristle worms along the chain, compared to the control (Fig 17a), while most of the other species’ groups where higher in number along the chain. In particular squat lobster, hermit crabs, sea anemone, shrimp, sea star, brittle star and Hydrozoa where much more abundant along the chai (Fig 17b), but also sea cucumber, whelk and fish where more common along the chain transect.
a)
b)
Figure 17. Counts of individuals by species groups: red columns are number of individuals seen along the control transect. Blue columns are number seen along chain transect. Topp figure (a) is showing all counts, while bottom figure (b) is zooming in cutting off the most common species groups, to give a better resolution on the rest of the groups. The data have been corrected for number of transects conducted.
3.4. Push cores’
We aimed at taking a core at each end of the ROV transect lines (12 transect lines 24 core), however the cores were not closing properly, so the sediment seeped out. Position of the two core samples taken are given in table 6.
Table 6. Information on core position.
Core #
Date
Transect #
Direction of transect
Suction anchor
Lat (N)
Lon (E)
Remark
1
6.3.2026
HT05
South East
SA 09
61.336402
2.234497
At SA 09
2
7.3.2026
HT07
North East
SA09
61.331860
2.232052
Start of control line
3.4. Acoustic study – and trawling with DeepVision transects
A total of 19 acoustic transects were performed, one through the park and 18 outside. Acoustic data was continuously collected along the transects using Kongsberg Discovery EK80 scientific echosounders operating in broadband mode (Table 7). All echosounders transmitted simultaneously.
The 18 transects outside Hywind Tampen, “flower transects”, started at 500 m distance to the turbines and conduct transects outwards to 5.4 nm from Hywind Tampen (or in opposite direction). The transect design is a compromise between design for quantity calculation (more or less homogeneous coverage) and gradient study from the windfarm. Total length of transect is ca 105 nm. The transects are shown in (Fig. 18).
Figure 18. Flower transect, Acoustic transects performed on the 2026 cruise.
This flower-transect has been used on all previous cruises (Figure 15., Utne Palm et al., 2023). In addition, several transects were performed across the park to capture potential edge effects, such as potential accumulation of biomass near the edges of the park (see Fig. 5). Below are examples of data from acoustic transects outside, through and across the Hywind Tampen (38 kHz) (Fig. 19, 20 amd 21). Vertical lines indicate the start and end of the polygon covering the wind park. In this initial analysis, this polygon is used to describe the boundaries of the park which is an artificial boundary.
Acoustic backscatter data (Sv) from EK80 transects crossing the Hywind area were preprocessed by removing low-quality samples, block-averaging in range and time, and computing cumulative along-track distance. From the echograms we derived a set of integrative indices (center of mass, abundance, density, spread, etc.) and defined “inside” the wind farm using a time window mapped to along-track distance. For each transect, we compared conditions inside this window to nearby “outside” conditions restricted to a local corridor (±5 km from the window) to avoid bias from distant parts of the transect. Differences in density index D and depth averaged Sv (10–300 m) between inside and outside were assessed using permutation tests on the mean and median, which do not rely on distributional assumptions. A complete and more detailed analysis will be carried out when the full dataset is available.
Figure 19. Example acoustic transect outside Hywind Tampen (transect T1).
Figure 20. Example acoustic transects across Hywind Tampen (a) transects T2 and (b) transect T5).
Figure 21. Example acoustic transects along (through) Hywind Tampen (a) transects T3 and (b) Transect T4).
The example echograms show the effect of time on the distribution of organisms within the wind park, which is most clearly visible when comparing T3 and T4. T3 was performed as the mesopelagic layer, a dominating feature within the park in addition to demersal fish, ascended to the surface and backscattering became evenly distributed throughout the water column.
Very preliminary analysis of the limited dataset showed that across the two independent transects crossing the wind farm (T2 and T5), we found consistent but transect specific patterns. In T2, the density index D did not differ significantly between inside and local outside, although a pronounced peak in D was observed in the edge zone immediately adjacent to the boundary. In contrast, T5 showed a clear and statistically significant increase in D inside the wind farm relative to the local outside both in time and along track distance. Depth integrated Sv (10–300 m) tended to be slightly lower inside than outside in both transects, but this reduction was small (order 0.3–1 dB) and more evident in the mean than in the median, indicating subtle changes in the distribution of scatterers rather than a uniform shift. Together, these preliminary results suggest that the across farm structure of scatterers can vary between crossings, likely influenced by time of day and background conditions, with T5 showing a more pronounced accumulation inside the wind farm than T2.
Along-transect (through HT) preliminary analyses for T3 and T4 show a consistent pattern of reduced density and backscatter inside the wind farm compared to the local outside corridor. For both transects, the density index D is significantly lower inside than outside in both time and distance domains. Depth integrated Sv over 10–300 m is also significantly lower inside than outside in both T3 and T4, with a larger reduction in T3 (mean and median differences of about 1–1.7 dB) and a somewhat weaker but still significant reduction in T4 (mean difference ≈ 0.3 dB, median ≈ 2.4 dB). Edge regions in T3 do not differ from the local outside, whereas in T4 the edges already show a modest but significant decrease inDrelative to outside, suggesting a broader transition zone. The initial analysis of the 2025 acoustics showed a tendency of a systematically lower backscatter within the wind farm than in the adjacent local surroundings.
However, this pattern was not seen in the 2026 acoustics data. Example transects from the 2026 data are shown in the figure 22 (38 kHz data). Figure 22 shows transect T19 through the park. G. O. Sars entered the park from the south at approximately 16:01, just before the onset of diel vertical migration (as seen from approximately 8 km (along-track distance).
No conclusions can be drawn from this initial analysis, a full analysis of all crossings will be performed and compiled with data from previous cruises.
Figure 22. Transect through Hywind Tampen (T19). Vertical lines indicate start and end of the Hywind Tampen polygon.
3.5. Pelagic trawling with DeepVision
In total we conducted seven trawl hauls (Table 7). The preliminary results from the pelagic trawling with DeepVision, show that mesopelagic fish as well as gelatinous plankton is dominating in the area (Fig. 23), this corresponds with our findings from previous years (Utne Palm et al., 2023 and 2024).
Table 7. Time and position of start and stop for the seven pelagic trawl stations with DeepVision, conducted in 2025.
Date
Time
Longitude
Latitude
Station
2025-12-07
15:33:27
2.36
61.41
Pelagic trawl start
2025-12-07
15:43:30
2.36
61.42
Pelagic trawl stop
2025-12-08
14:40:04
2.23
61.39
Pelagic trawl start
2025-12-08
17:47:55
2.31
61.24
Pelagic trawl stop
2025-12-15
12:04:50
2.26
61.40
Pelagic trawl start
2025-12-15
15:01:51
2.34
61.24
Pelagic trawl stop
2025-12-16
08:42:40
2.33
61.27
Pelagic trawl start
2025-12-16
11:10:24
2.26
61.40
Pelagic trawl stop
2025-12-16
12:36:44
2.17
61.38
Pelagic trawl start
2025-12-16
15:22:57
2.24
61.24
Pelagic trawl stop
2025-12-16
16:45:11
2.33
61.27
Pelagic trawl start
2025-12-16
20:15:00
2.25
61.42
Pelagic trawl stop
2025-12-16
21:47:05
2.17
61.37
Pelagic trawl start
2025-12-16
23:48:21
2.23
61.27
Pelagic trawl stop
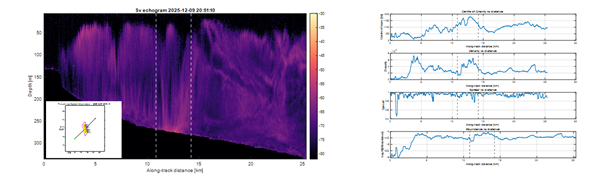
Figure 23. acoustic transect through the park from south to north. (a) the echogram shows the acoustic sound scattering layers (at 38 kHz), as displayed in LSSS when merged with DeepVision data. Black line shows the trawl path. The yellow bubbles show that something is seen in DeepVision the size of the bubble indicates the amount. The camera view displays what is seen in DeepVision when the trawl passes the area marked with a black square on the trawl track. In this case it is the mesopelagic fish Pearlside (Maurolicus muelleri) that dominated together with some gelatinous plankton (white bobbles /pearls).
3.6. eDNA
The eDNA data from the March cruise has not yet been analyzed.
4. Referances
Burkhard B, Opitz S, Lenhart H, Ahrendt K, Garthe S, Mendel B, Windhorst W. 2011. Ecosystem based modeling and indication of ecological integrity in the German North Sea—Case study offshore wind parks. Ecological Indicators 11(1):168-174. https://doi.org/10.1016/j.ecolind.2009.07.004
Lindeboom HJ, Kouwenhoven HJ, Bergman MJN, Bouma S, Brasseur SMJM, Daan R, Dirken S, van Hal R, Hille Ris Lambers R, ter Hofstede R, Leopold MF, Scheidat M. 2011. Short-term ecological effects of an offshore wind farm in the Dutch coastal zone; a compilation. Environmental Research Letters 6. https://iopscience.iop.org/article/10.1088/1748-9326/6/3/035101
Utne-Palm AC, de Jong K, Pedersen G, Saltskår J, Hovland T, Renner A, Mihaljevic M, Wilhelmsen JF, Drivenes L, Bergamasco A, Falcieri F, Majaneva M, Critchley MJ, Kühn S, Viotti F, Akkaş K. Cruise report Hywind Tampen 19 to 26 October 2024. Toktrapport No. 7 2025. https://www.hi.no/hi/nettrapporter/toktrapport-en-2025-7
Utne-Palm AC, Søiland H, Sveistrup AK, Renner A, Ross R, Moy F, Bakhoday Paskyabi M, Totland A, Hannaas S, de Jong K, Gonzalez-Mirelis G, Hovland T, Pedersen P, Wilhelmsen JF, Majaneva MA, Heum SW, Skjold W, Vågenes S, Skaret G, Corus F, Voronkov A, Vågenes P, Kielland L. Cruise report Hywind tampen 13 to 28 March 2023. Toktrapport No. 10, 2023. https://www.hi.no/hi/nettrapporter/toktrapport-en-2023-10
5. Abbreviation and word explanatio
ADCP: is an Acoustic Doppler Current Profiler. It is a hydroacoustic current meter similar to a sonar, used to measure water current velocities over a depth range using the Doppler effect of sound waves scattered back from particles within the water column.
Acoustic releaser: is for the deployment and subsequent recovery of instrumentation from the sea floor, in which the recovery is triggered remotely by an acoustic command signal.
CTD: is an oceanography instrument used to measure the electrical conductivity, temperature, and pressure of seawater. Conductivity is used to determine salinity and depth is calculated from pressure.
Hydrophone: is a microphone designed to be used underwater for recording or listening to underwater sound. Most hydrophones are based on a piezoelectric transducer that generates an electric potential when subjected to a pressure change, such as a sound wave.
Multi-frequency echosounder: Recent research has shown that simultaneous use of several discrete echo sounder frequencies (multifrequency) not only improves fish stock estimates but can also be used to identify species. This is because each specie has a unique acoustic frequency response. This new and growing understanding greatly improves the value of hydroacoustics to obtain information about marine resources. For more information see: https://www.kongsberg.com/maritime/support/themes/simrad-content-s/scientificapplications/multifrequency-echo-sounder-operation/
ROV: stands for remote operating vehicle. ROVs are unmanned, highly manoeuvrable underwater machines that can be used to explore ocean depths while being operated by someone at the water surface. For more details see: https://www.revocean.org/vessel/rov/
DeepVision: is a camera system that is mounted at the cod-end entrance of the trawl. Here it takes pictures of the catch as it passes through the trawl. It is used to sample fish without having to land or injure the fish, as the fish passes through the open trawl cod-end. For more details see: https://www.deepvision.no/deep-vision-formarine-research
6. Appendix
1. ADCP mooring 1
2. ADCP mooring 2
3. ADCP mooring 3
4. Hydrophone mooring 1
5. Hydrophone mooring 2
6. All stations
All stations conducted during the 2025 cruise
Station type
Info
Date
Time
Loc.St.No
Latitude
Longitude
Depth
Mooring out
Hydrophone rig 1 UiB
07.12.2025
08:43:34
4059
6120.564085 N
00213.671738 E
285.39
Mooring out
Hydrophone rig 2 UiB
07.12.2025
09:46:50
4060
6120.358255 N
00212.150341 E
281.02
Mooring out
ADCP 1 (between Hy02-03
07.12.2025
12:46:53
4061
6120.790360 N
00215.611615 E
292.97
Mooring out
ADCP 3 (north of HT)
07.12.2025
13:50:38
4062
6115.384290 N
00217.352266 E
254.53
Mooring out
ADCP 2 (south of HT)
07.12.2025
15:02:04
4063
6123.357208 N
00220.066101 E
315.63
Start Cross shelf transect (see Fig.3,left)
CTD with watersample start
Line North of HT, Nutrients, Chlorophyl a
07.12.2025
17:04:01
834
6129.101065 N
00218.121698 E
344.24
CTD with watersample stop
07.12.2025
17:19:15
834
6129.101364 N
00218.121525 E
344.36
Håv-trekk stasjon.start
WP2-net (100-0m)
07.12.2025
17:20:25
834
6129.100564 N
00218.122050 E
344.62
Håv-trekk stasjon.stop
07.12.2025
17:27:35
834
6129.100994 N
00218.121148 E
344.71
Håv-trekk stasjon.start
WP2-net (bottom-0m)
07.12.2025
17:31:12
835
6129.101302 N
00218.122434 E
344.58
Håv-trekk stasjon.stop
07.12.2025
17:52:50
835
6129.104090 N
00218.128642 E
343.80
CTD with watersample start
Line North of HT, Nutrients, Chlorophyl a
07.12.2025
18:49:06
835
6124.301600 N
00208.270164 E
291.73
CTD with watersample stop
07.12.2025
18:58:27
835
6124.306522 N
00208.313814 E
291.98
Håv-trekk stasjon.start
WP2-net (100-0m)
07.12.2025
19:00:49
836
6124.306313 N
00208.313506 E
291.74
Håv-trekk stasjon.stop
07.12.2025
19:08:27
836
6124.305525 N
00208.315217 E
291.72
Håv-trekk stasjon.start
WP2-net (bottom-0m)
07.12.2025
19:10:04
837
6124.305398 N
00208.315061 E
292.09
Håv-trekk stasjon.stop
07.12.2025
19:27:45
837
6124.305548 N
00208.314209 E
292.50
CTD with watersample start
Line North of HT, Nutrients, Chlorophyl a
07.12.2025
19:55:17
836
6121.635248 N
00202.846828 E
247.35
CTD with watersample stop
07.12.2025
20:15:15
836
6121.633370 N
00202.844230 E
247.64
Håv-trekk stasjon.start
WP2-net (100-0m)
07.12.2025
20:15:20
838
6121.633313 N
00202.844607 E
248.26
Håv-trekk stasjon.stop
07.12.2025
20:23:00
838
6121.632530 N
00202.844232 E
247.64
Håv-trekk stasjon.start
WP2-net (bottom-0m)
07.12.2025
20:39:45
839
6121.669266 N
00202.918170 E
248.96
Håv-trekk stasjon.stop
07.12.2025
20:39:47
839
6121.669323 N
00202.918298 E
248.96
CTD with watersample start
Line North of HT, Nutrients, Chlorophyl a
07.12.2025
21:02:22
837
6120.288116 N
00200.709577 E
201.21
CTD with watersample stop
07.12.2025
21:14:51
837
6120.287624 N
00200.709458 E
200.34
Håv-trekk stasjon.start
WP2-net (100-0m)
07.12.2025
21:15:06
840
6120.287166 N
00200.709535 E
200.70
Håv-trekk stasjon.stop
07.12.2025
21:23:20
840
6120.291981 N
00200.734741 E
200.82
Håv-trekk stasjon.start
WP2-net (bottom-0m)
07.12.2025
21:24:34
841
6120.292023 N
00200.735528 E
201.75
Håv-trekk stasjon.stop
07.12.2025
21:37:27
841
6120.289617 N
00200.753171 E
201.98
CTD with watersample start
Line North of HT, Nutrients, Chlorophyl a
07.12.2025
22:02:57
838
6118.812366 N
00157.225438 E
144.31
CTD with watersample stop
07.12.2025
22:11:16
838
6118.810822 N
00157.224752 E
144.34
Håv-trekk stasjon.start
WP2-net (100-0m)
07.12.2025
22:12:24
842
6118.810932 N
00157.224621 E
144.05
Håv-trekk stasjon.stop
07.12.2025
22:20:07
842
6118.811654 N
00157.226289 E
144.46
Håv-trekk stasjon.start
WP2-net (bottom-0m)
07.12.2025
22:21:27
843
6118.811326 N
00157.224787 E
144.15
Håv-trekk stasjon.stop
07.12.2025
22:32:14
843
6118.837985 N
00157.298462 E
144.58
CTD with watersample start
Line Mid of HT, Nutrients, Chlorophyl a
07.12.2025
23:14:30
839
6115.069791 N
00205.287018 E
141.77
CTD with watersample stop
07.12.2025
23:25:41
839
6115.069275 N
00205.287371 E
142.02
Håv-trekk stasjon.start
WP2-net (100-0m)
07.12.2025
23:27:42
844
6115.068761 N
00205.288731 E
142.23
Håv-trekk stasjon.stop
07.12.2025
23:34:44
844
6115.068535 N
00205.288978 E
141.90
Håv-trekk stasjon.start
WP2-net (bottom-0m)
07.12.2025
23:37:07
845
6115.069187 N
00205.288708 E
142.01
Håv-trekk stasjon.stop
07.12.2025
23:46:13
845
6115.069228 N
00205.288490 E
142.48
CTD with watersample start
Line Mid of HT, Nutrients, Chlorophyl a
08.12.2025
00:17:26
840
6117.625596 N
00210.867169 E
247.52
CTD with watersample stop
08.12.2025
00:30:01
840
6117.628309 N
00210.868562 E
247.08
Håv-trekk stasjon.start
WP2-net (100-0m)
08.12.2025
00:32:27
846
6117.629415 N
00210.868161 E
247.08
Håv-trekk stasjon.stop
08.12.2025
00:39:07
846
6117.628907 N
00210.866795 E
247.01
Håv-trekk stasjon.start
WP2-net (bottom-0m)
08.12.2025
00:41:47
847
6117.628367 N
00210.868183 E
246.72
Håv-trekk stasjon.stop
08.12.2025
00:57:20
847
6117.628594 N
00210.867165 E
246.60
CTD with watersample start
Line Mid of HT, Nutrients, Chlorophyl a
08.12.2025
01:26:03
841
6119.747819 N
00215.590557 E
284.21
CTD with watersample stop
08.12.2025
01:40:12
841
6119.749270 N
00215.591105 E
284.28
Håv-trekk stasjon.start
WP2-net (100-0m)
08.12.2025
01:42:20
848
6119.749872 N
00215.591317 E
284.45
Håv-trekk stasjon.stop
08.12.2025
01:49:28
848
6119.749140 N
00215.590511 E
284.50
Håv-trekk stasjon.start
WP2-net (bottom-0m)
08.12.2025
01:52:03
849
6119.750259 N
00215.591862 E
284.73
Håv-trekk stasjon.stop
08.12.2025
02:09:35
849
6119.750199 N
00215.590917 E
284.13
CTD with watersample start
Line Mid of HT, Nutrients, Chlorophyl a
08.12.2025
02:30:20
842
6120.985429 N
00218.133501 E
295.15
CTD with watersample stop
08.12.2025
02:44:04
842
6120.986577 N
00218.135799 E
295.02
Håv-trekk stasjon.start
WP2-net (100-0m)
08.12.2025
02:46:14
850
6120.986301 N
00218.134279 E
295.14
Håv-trekk stasjon.stop
08.12.2025
02:53:55
850
6120.986114 N
00218.134270 E
295.06
Håv-trekk stasjon.start
WP2-net (bottom-0m)
08.12.2025
02:56:11
851
6120.986957 N
00218.134464 E
295.06
Håv-trekk stasjon.stop
08.12.2025
03:14:01
851
6120.986226 N
00218.134743 E
295.23
CTD with watersample start
Line Mid of HT, Nutrients, Chlorophyl a
08.12.2025
04:01:23
843
6124.986149 N
00226.146032 E
346.25
CTD with watersample stop
08.12.2025
04:15:20
843
6124.986889 N
00226.146456 E
346.44
Håv-trekk stasjon.start
WP2-net (100-0m)
08.12.2025
04:17:47
852
6124.985338 N
00226.146989 E
346.58
Håv-trekk stasjon.stop
08.12.2025
04:25:11
852
6124.986540 N
00226.146437 E
346.66
Håv-trekk stasjon.start
WP2-net (bottom-0m)
08.12.2025
04:30:52
853
6124.985886 N
00226.147069 E
346.53
Håv-trekk stasjon.stop
08.12.2025
04:49:06
853
6124.985762 N
00226.147266 E
346.20
CTD with watersample start
Line South of HT, Nutrients, Chlorophyl a
08.12.2025
05:34:22
844
6120.652776 N
00233.573729 E
344.86
CTD with watersample stop
08.12.2025
05:49:13
844
6120.653869 N
00233.575617 E
344.88
Håv-trekk stasjon.start
WP2-net (100-0m)
08.12.2025
05:51:18
854
6120.654112 N
00233.575393 E
344.47
Håv-trekk stasjon.stop
08.12.2025
05:59:32
854
6120.653488 N
00233.574613 E
344.36
Håv-trekk stasjon.start
WP2-net (bottom-0m)
08.12.2025
06:01:47
855
6120.653152 N
00233.575329 E
344.39
Håv-trekk stasjon.stop
08.12.2025
06:22:34
855
6120.653649 N
00233.575460 E
344.49
Stop Cross shelf transekt after one station on southern line
ROV station start
Pick up Lander bottom frame
08.12.2025
08:50:53
1
6118.681794 N
00215.315277 E
277.90
ROV station stop
08.12.2025
11:57:10
1
6117.984123 N
00215.712634 E
273.08
Pelagic trawl start (through HT from N to S)
DeepVision pelagik trawl through HT
08.12.2025
14:40:04
680
6123.640424 N
00213.684338 E
298.94
Pelagic trawl stop
08.12.2025
17:47:55
680
6114.417183 N
00218.420828 E
245.22
CTD with watersample start Line South continues
Repeet: S, Nutrients, Chlorophyl a, deepest st.
08.12.2025
19:03:47
845
6120.712037 N
00233.590141 E
345.65
CTD with watersample stop
08.12.2025
19:19:12
845
6120.711655 N
00233.590203 E
346.00
CTD with watersample start
Line South of HT, Nutrients, Chlorophyl a
08.12.2025
19:54:45
846
6117.206081 N
00226.521762 E
292.68
CTD with watersample stop
08.12.2025
20:08:13
846
6117.205643 N
00226.521136 E
293.12
Håv-trekk stasjon.start
WP2-net (100-0m)
08.12.2025
20:09:08
856
6117.205373 N
00226.520951 E
292.87
Håv-trekk stasjon.stop
08.12.2025
20:18:12
856
6117.205382 N
00226.521019 E
292.69
Håv-trekk stasjon.start
WP2-net (bottom-0m)
08.12.2025
20:18:27
857
6117.205340 N
00226.521081 E
292.71
Håv-trekk stasjon.stop
08.12.2025
20:36:37
857
6117.205201 N
00226.520653 E
292.89
CTD with watersample start
Line South of HT, Nutrients, Chlorophyl a
08.12.2025
21:10:49
847
6113.830295 N
00219.930163 E
245.46
CTD with watersample stop
08.12.2025
21:23:23
847
6113.830349 N
00219.928506 E
245.13
Håv-trekk stasjon.start
WP2-net (100-0m)
08.12.2025
21:25:07
858
6113.830207 N
00219.928940 E
245.34
Håv-trekk stasjon.stop
08.12.2025
21:32:05
858
6113.830450 N
00219.928938 E
245.93
Håv-trekk stasjon.start
WP2-net (bottom-0m)
08.12.2025
21:34:13
859
6113.829615 N
00219.928449 E
245.46
Håv-trekk stasjon.stop
08.12.2025
21:49:16
859
6113.830799 N
00219.928359 E
245.64
CTD with watersample start
Line South of HT, Nutrients, Chlorophyl a
08.12.2025
22:09:59
848
6112.068243 N
00216.609236 E
200.37
CTD with watersample stop
08.12.2025
22:20:57
848
6112.072675 N
00216.606317 E
200.83
Håv-trekk stasjon.start
WP2-net (100-0m)
08.12.2025
22:22:48
860
6112.072654 N
00216.606409 E
200.11
Håv-trekk stasjon.stop
08.12.2025
22:29:36
860
6112.073215 N
00216.605661 E
200.65
Håv-trekk stasjon.start
WP2-net (bottom-0m)
08.12.2025
22:32:37
861
6112.072088 N
00216.607000 E
200.47
Håv-trekk stasjon.stop
08.12.2025
22:45:15
861
6112.070562 N
00216.621949 E
201.28
CTD with watersample start
Line South of HT, Nutrients, Chlorophyl a
08.12.2025
23:05:28
849
6110.818876 N
00214.143056 E
149.36
CTD with watersample stop
08.12.2025
23:13:45
849
6110.818097 N
00214.144411 E
149.84
Håv-trekk stasjon.start
WP2-net (100-0m)
08.12.2025
23:15:47
862
6110.818400 N
00214.144640 E
149.46
Håv-trekk stasjon.stop
08.12.2025
23:22:41
862
6110.818102 N
00214.144352 E
150.14
Håv-trekk stasjon.start
WP2-net (bottom-0m)
08.12.2025
23:25:14
863
6110.818238 N
00214.143636 E
150.03
Håv-trekk stasjon.stop
08.12.2025
23:34:38
863
6110.817866 N
00214.144918 E
150.05
CTD transekt trough HT from SW to NE, see Fig. 3. midle)
CTD with watersample start
SW-NE through HT, only Nutrients
09.12.2025
00:05:32
850
6113.674880 N
00209.380974 E
141.83
CTD with watersample stop
09.12.2025
00:15:07
850
6113.675091 N
00209.381383 E
141.48
CTD with watersample start
SW-NE through HT, only Nutrients
09.12.2025
00:36:11
851
6115.739333 N
00212.303759 E
226.95
CTD with watersample stop
09.12.2025
00:47:19
851
6115.739053 N
00212.302275 E
226.84
CTD with watersample start
SW-NE through HT, only Nutrients
09.12.2025
01:08:30
852
6117.799834 N
00215.293231 E
269.08
CTD with watersample stop
09.12.2025
01:21:19
852
6117.800114 N
00215.290767 E
269.17
CTD with watersample start
South st. inside HT
09.12.2025
01:39:23
853
6118.769734 N
00216.154437 E
280.89
CTD with watersample stop
09.12.2025
01:52:55
853
6118.770273 N
00216.153186 E
281.36
CTD with watersample start
Mid st. inside HT
09.12.2025
02:07:38
854
6119.788460 N
00215.626143 E
284.57
CTD with watersample stop
09.12.2025
02:21:37
854
6119.788274 N
00215.625192 E
284.32
CTD with watersample start
North st. inside HT
09.12.2025
02:38:07
855
6121.136747 N
00214.908841 E
293.38
CTD with watersample stop
09.12.2025
02:51:38
855
6121.136619 N
00214.906183 E
293.36
CTD with watersample start
SW-NE through HT, only Nutrients
09.12.2025
03:08:09
856
6122.136001 N
00216.057879 E
302.02
CTD with watersample stop
09.12.2025
03:21:06
856
6122.136018 N
00216.056443 E
301.86
CTD with watersample start
SW-NE through HT, only Nutrients
09.12.2025
03:42:06
857
6124.101386 N
00219.350175 E
322.18
CTD with watersample stop
09.12.2025
03:55:08
857
6124.100537 N
00219.347679 E
321.93
CTD with watersample start
SW-NE through HT, only Nutrients
09.12.2025
04:14:42
858
6126.045559 N
00222.675796 E
345.94
CTD with watersample stop
09.12.2025
04:28:55
858
6126.044836 N
00222.676519 E
346.10
CTD on acoustic Flower transect (Fig. 5)
CTD with watersample start
Flower transect, only Nutrients
09.12.2025
05:28:01
859
6122.408988 N
00214.379796 E
298.42
CTD with watersample stop
09.12.2025
05:40:40
859
6122.400116 N
00214.382320 E
298.54
CTD with watersample start
Flower transect, only Nutrients
09.12.2025
05:53:43
860
6121.774252 N
00213.065102 E
290.27
CTD with watersample stop
09.12.2025
06:04:57
860
6121.771319 N
00213.078154 E
290.46
CTD with watersample start
Flower transect, only Nutrients
09.12.2025
07:00:54
861
6126.262376 N
00208.462791 E
306.78
CTD with watersample stop
09.12.2025
07:15:01
861
6126.262763 N
00208.461759 E
306.80
ROV video-transect SA06
ROV station start
SA06: both cont. transects, one chain towards Hy10
09.12.2025
08:58:32
2
6121.168250 N
00213.323548 E
288.80
ROV station stop
09.12.2025
14:21:44
2
6120.947673 N
00213.699473 E
289.09
CTD transekt trough HT from NW to SE, see Fig. 3. midle)
CTD with watersample start
NW-SE through HT, only Nutrients
09.12.2025
15:00:58
862
6124.414527 N
00211.389371 E
302.36
CTD with watersample stop
09.12.2025
15:14:35
862
6124.415052 N
00211.392741 E
302.13
CTD with watersample start
NW-SE through HT, only Nutrients
09.12.2025
15:40:27
863
6122.391181 N
00214.352864 E
299.34
CTD with watersample stop
09.12.2025
15:52:10
863
6122.391967 N
00214.354532 E
299.22
CTD with watersample start
North st. inside HT
09.12.2025
16:10:22
864
6121.142279 N
00214.875649 E
292.97
CTD with watersample stop
09.12.2025
16:22:55
864
6121.142735 N
00214.877456 E
292.62
CTD with watersample start
Mid st. inside HT
09.12.2025
16:52:05
865
6119.789487 N
00215.633426 E
287.57
CTD with watersample stop
09.12.2025
17:03:43
865
6119.789067 N
00215.632704 E
287.72
CTD with watersample start
South st. inside HT
09.12.2025
17:17:59
866
6118.756903 N
00216.080535 E
284.64
CTD with watersample stop
09.12.2025
17:29:50
866
6118.768308 N
00216.138508 E
284.02
CTD with watersample start
NW-SE through HT, only Nutrients
09.12.2025
17:43:40
867
6117.565687 N
00216.827283 E
277.39
CTD with watersample stop
09.12.2025
18:13:16
867
6115.722322 N
00219.480307 E
266.34
CTD with watersample start
NW-SE through HT, only Nutrients
09.12.2025
18:21:51
868
6115.464930 N
00219.756929 E
264.47
CTD with watersample stop
09.12.2025
18:44:56
868
6114.002297 N
00221.949896 E
258.57
CTD with watersample start
NW-SE through HT, only Nutrients
09.12.2025
18:57:42
869
6113.368927 N
00222.654479 E
255.06
CTD with watersample stop
09.12.2025
19:10:09
869
6113.369670 N
00222.654459 E
255.61
Acoustic transect start (fron SW-to NE diagornaly through the park centre)
Acoustic transect start
09.12.2025
20:15:02
1
6115.190759 N
00205.254246 E
143.35
Acoustic transect stop
09.12.2025
21:39:30
1
6124.992488 N
00226.117598 E
350.41
ROV finding trawl in Bjørnefjorden
ROV station start
10.12.2025
12:05:37
3
6011.213972 N
00514.042295 E
0.00
ROV station stop
10.12.2025
15:58:58
3
6011.197347 N
00514.110575 E
677.81
Release of ADCP 1
Did not releas proparly
11.12.2025
20:00:00
6120.790360 N
00215.611615 E
292.97
Acoustic transect across HT: with CTD at 5nm W, Mid and 5nm E of HT
CTD with watersample start
5 nm West of HT
11.12.2025
22:47:49
870
6122.996679 N
00226.409092 E
337.46
CTD with watersample stop
11.12.2025
23:04:13
870
6122.994384 N
00226.408224 E
338.76
Acoustic transect
11.12.2025
22:54:27
2
6122.995436 N
00226.408005 E
337.92
CTD with watersample start
Midle of HT
11.12.2025
23:50:46
871
6121.547244 N
00214.688935 E
294.40
CTD with watersample stop
12.12.2025
00:05:35
871
6121.548248 N
00214.687855 E
294.14
CTD with watersample start
5 nm East of HT
12.12.2025
00:53:07
872
6120.124055 N
00203.151111 E
227.95
CTD with watersample stop
12.12.2025
01:06:07
872
6120.123137 N
00203.155589 E
228.66
Acoustic transect (crossing HT)
Crossing HT
12.12.2025
05:08:38
2
6118.153094 N
00229.035692 E
312.74
Acoustic transect (crossing HT)
12.12.2025
05:54:10
3
6114.427485 N
00218.362176 E
248.73
Acoustic transect (crossing HT)
12.12.2025
07:00:04
3
6125.413703 N
00212.806195 E
311.05
Acoustic transect (crossing HT)
12.12.2025
09:27:11
4
6121.762503 N
00213.000958 E
290.79
Acoustic transect (crossing HT)
12.12.2025
15:19:07
4
6121.123510 N
00225.029456 E
318.20
Acoustic transect (crossing HT)
12.12.2025
17:40:44
5
6121.034815 N
00224.490381 E
316.20
Acoustic transect (crossing HT)
12.12.2025
22:27:34
5
6118.077761 N
00218.206839 E
281.24
Acoustic transect (crossing HT)
12.12.2025
23:01:46
6
6121.703430 N
00213.087695 E
290.28
Acoustic transect (crossing HT)
13.12.2025
04:19:47
6
6118.136917 N
00218.235618 E
283.71
Acoustic transect (crossing HT)
13.12.2025
07:15:56
7
6121.339420 N
00227.204445 E
326.76
Acoustic transect (crossing HT)
13.12.2025
09:52:56
7
6122.980405 N
00226.351804 E
337.06
ROV in Bjørnefjorden to retrive lost trawl
ROV station start - to bring up trawl
14.12.2025
07:28:31
4
6011.176916 N
00514.099746 E
677.67
ROV station stop - to bring up trawl
14.12.2025
11:01:13
4
6011.159303 N
00513.962857 E
676.18
Acoustic transect (to compleate the star across HT)
15.12.2025
03:20:02
8
6119.706728 N
00228.029302 E
318.16
Acoustic transect stop
15.12.2025
11:27:32
8
6125.313751 N
00214.893654 E
319.84
Pelagic trawl DeepVision along HT
along HT ca 1 km East of HT
15.12.2025
12:04:50
681
6123.901156 N
00215.546341 E
309.49
Pelagic trawl stop
15.12.2025
15:01:51
681
6114.691523 N
00220.516461 E
260.06
CTD with watersample Long
across shelf 8 st. only nutrients (see Fig.3 left)
15.12.2025
19:59:47
873
6146.730361 N
00310.008005 E
402.01
CTD with watersample stop
15.12.2025
20:19:06
873
6146.678155 N
00310.237983 E
401.87
CTD with watersample start
15.12.2025
21:22:01
874
6141.262800 N
00258.731799 E
405.65
CTD with watersample stop
15.12.2025
21:43:05
874
6141.161821 N
00259.030724 E
405.39
CTD with watersample start
15.12.2025
22:48:03
875
6135.923667 N
00247.772492 E
390.73
CTD with watersample stop
15.12.2025
23:08:21
875
6135.910678 N
00247.841594 E
392.00
CTD with watersample start
16.12.2025
00:05:37
876
6130.445423 N
00237.052049 E
372.99
CTD with watersample stop
16.12.2025
00:24:12
876
6130.443900 N
00237.052594 E
373.16
CTD with watersample start
16.12.2025
01:20:16
877
6124.990287 N
00226.144697 E
350.89
CTD with watersample stop
16.12.2025
01:38:11
877
6124.974309 N
00226.208459 E
351.26
CTD with watersample start
16.12.2025
02:32:44
878
6119.760471 N
00215.568529 E
288.61
CTD with watersample stop
16.12.2025
02:48:14
878
6119.760270 N
00215.569995 E
287.46
CTD with watersample start
16.12.2025
03:38:35
879
6115.022658 N
00205.442913 E
143.17
CTD with watersample stop
16.12.2025
03:46:11
879
6115.002583 N
00205.493346 E
143.23
CTD with watersample start
16.12.2025
04:38:15
880
6110.302165 N
00154.912255 E
142.50
CTD with watersample stop
16.12.2025
04:45:19
880
6110.290142 N
00154.942871 E
142.88
Repeet: Pelagic trawl DeepVision along HT
ca 1 km East of HT, from S to N
16.12.2025
08:42:40
682
6116.487002 N
00219.700671 E
276.46
Repeat: Pelagic trawl stop
16.12.2025
11:10:24
682
6123.935486 N
00215.570196 E
309.69
Pelagic trawl start
ca 1 km West of HT, from N to S
16.12.2025
12:36:44
683
6122.847246 N
00209.931384 E
291.01
Pelagic trawl stop
16.12.2025
15:22:57
683
6114.362725 N
00214.371669 E
225.27
Pelagic trawl start
ca 1 km East of HT, from S to N
16.12.2025
16:45:11
684
6115.934807 N
00219.882062 E
270.18
Pelagic trawl stop
16.12.2025
20:15:00
684
6125.193890 N
00214.855761 E
318.20
Pelagic trawl start
ca 1 km West of HT, from N to S
16.12.2025
21:47:05
685
6122.040947 N
00210.094658 E
286.91
Pelagic trawl stop
16.12.2025
23:48:21
685
6116.044452 N
00213.543376 E
245.62
All stations 2026 cruise
Station type
Info
Date
Time
Loc.St.No
Latitude
Longitude
Depth
Acoustic lander
Sørvest F
Control
03.03.2026
23:08:43
1
5622.439105 N
00346.596112 E
65.85
Acoustic lander
Sørvest F
04.03.2026
05:42:03
2
5646.748939 N
00508.288463 E
60.34
Acoustic lander
Sørvest F
04.03.2026
07:17:36
3
5649.409533 N
00517.132350 E
56.60
Acoustic lander
Vestav. F
Control
04.03.2026
18:15:47
4
5830.392097 N
00450.367759 E
277.39
CTD with watersample start
Test
04.03.2026
18:28:51
252
5830.384398 N
00450.393454 E
277.56
CTD with watersample stop
Test
04.03.2026
18:43:13
252
5830.384305 N
00450.393204 E
277.43
Håv-trekk stasjon.start
Test
04.03.2026
18:43:18
252
5830.384482 N
00450.392500 E
277.44
Håv-trekk stasjon.stop
Test
04.03.2026
19:04:44
252
5830.384357 N
00450.393445 E
277.56
Acoustic lander
Vestav. F
04.03.2026
23:21:29
5
5907.926004 N
00432.073923 E
258.41
Acoustic transect
At HT
05.03.2026
20:00
Acoustic transect
At HT
06.03.2026
06:20
ROV station start
Retrive ADCP1
06.03.2026
08:49:43
1
6120.768410 N
00215.493450 E
290.17
ROV station stop
Retrive ADCP1
06.03.2026
12:49:18
1
6120.642256 N
00215.324129 E
290.84
CTD start
calibrate ROV
06.03.2026
13:44:09
253
6120.369081 N
00213.621999 E
284.49
CTD stop
calibrate ROV
06.03.2026
14:07:52
253
6120.368353 N
00213.622646 E
285.04
ROV station start
ROV SA09
06.03.2026
15:17:03
2
6120.369726 N
00213.621413 E
284.77
ROV station stop
ROV SA09
06.03.2026
18:47:03
2
6120.053566 N
00214.294078 E
285.15
Cross shelf transect
CTD with watersample start
Midle line
06.03.2026
21:00:07
254
6115.083905 N
00205.093315 E
143.28
CTD with watersample stop
Midle line
06.03.2026
21:11:59
254
6115.084228 N
00205.093328 E
142.75
CTD with watersample start
Midle line eDNA
06.03.2026
21:33:20
255
6115.084146 N
00205.093206 E
142.64
CTD with watersample stop
Midle line eDNA
06.03.2026
21:45:09
255
6115.084006 N
00205.093740 E
143.11
Håv-trekk stasjon.start
4xWP2 Midle line
06.03.2026
21:47:18
254
6115.084219 N
00205.092711 E
142.81
Håv-trekk stasjon.stop
4xWP2 Midle line
06.03.2026
22:30:11
254
6115.084295 N
00205.093609 E
143.37
CTD with watersample start
Midle line
06.03.2026
23:00:52
256
6117.623744 N
00210.814709 E
248.33
CTD with watersample stop
Midle line
06.03.2026
23:15:04
256
6117.623678 N
00210.814651 E
248.65
Håv-trekk stasjon.start
4xWP2 Midle line
06.03.2026
23:18:43
256
6117.623930 N
00210.813499 E
247.71
Håv-trekk stasjon.stop
4xWP2 Midle line
07.03.2026
00:11:02
256
6117.623761 N
00210.814502 E
248.67
CTD with watersample start
Midle line
07.03.2026
00:37:35
257
6119.728969 N
00215.577098 E
287.68
CTD with watersample stop
Midle line
07.03.2026
00:51:21
257
6119.728018 N
00215.575129 E
286.77
CTD with watersample start
Midle line eDNA
07.03.2026
01:08:02
258
6119.728126 N
00215.575841 E
286.92
CTD with watersample stop
Midle line eDNA
07.03.2026
01:25:29
258
6119.728186 N
00215.576891 E
287.16
Håv-trekk stasjon.start
4xWP2 Midle line
07.03.2026
01:27:23
257
6119.727624 N
00215.576550 E
286.98
Håv-trekk stasjon.stop
4xWP2 Midle line
07.03.2026
02:23:23
257
6119.728347 N
00215.575173 E
286.38
CTD with watersample start
Midle line
07.03.2026
02:52:04
259
6120.984468 N
00218.134488 E
298.21
CTD with watersample stop
Midle line
07.03.2026
03:08:14
259
6120.985375 N
00218.132312 E
298.11
Håv-trekk stasjon.start
4xWP2 Midle line
07.03.2026
03:09:39
259
6120.985336 N
00218.131699 E
297.88
Håv-trekk stasjon.stop
4xWP2 Midle line
07.03.2026
04:08:16
259
6120.985382 N
00218.132611 E
297.81
CTD with watersample start
Midle line
07.03.2026
04:57:03
260
6124.985567 N
00226.146814 E
349.78
CTD with watersample stop
Midle line
07.03.2026
05:10:43
260
6124.985804 N
00226.147290 E
349.57
CTD with watersample start
Midle line eDNA
07.03.2026
05:25:01
261
6124.985664 N
00226.148631 E
349.67
CTD with watersample stop
Midle line eDNA
07.03.2026
05:40:23
261
6124.985305 N
00226.147201 E
349.77
Håv-trekk stasjon.start
1xWP2 Midle line
07.03.2026
05:42:43
260
6124.985836 N
00226.145543 E
349.93
Håv-trekk stasjon.stop
1xWP2 Midle line
07.03.2026
06:02:56
260
6124.986199 N
00226.147382 E
349.86
Transects SA09
ROV station start
SA09
07.03.2026
07:57:17
3
6119.908264 N
00213.908660 E
282.29
ROV station stop
1 Core sample
07.03.2026
11:21:51
3
6120.344725 N
00214.170336 E
287.49
Cross shelf transect
CTD with watersample start
Northern line
07.03.2026
12:53:53
262
6118.826232 N
00157.368694 E
0.00
CTD with watersample stop
Northern line
07.03.2026
13:02:57
262
6118.818025 N
00157.463162 E
146.09
CTD with watersample start
North line eDNA
07.03.2026
13:18:51
263
6118.793899 N
00157.673445 E
145.51
CTD with watersample stop
North line eDNA
07.03.2026
13:30:20
263
6118.768502 N
00157.982432 E
146.77
Håv-trekk stasjon.start
4xWP2 Northern line
07.03.2026
13:45:00
262
6118.740282 N
00158.172663 E
146.22
Håv-trekk stasjon.stop
4xWP2 Northern line
07.03.2026
14:47:24
262
6118.724160 N
00157.825882 E
145.12
CTD with watersample start
Northern line
07.03.2026
15:17:45
264
6120.300455 N
00200.865495 E
0.00
CTD with watersample stop
Northern line
07.03.2026
15:31:58
264
6120.273327 N
00201.139540 E
209.33
Håv-trekk stasjon.start
4xWP2 Northern line
07.03.2026
15:39:49
264
6120.257876 N
00201.289187 E
210.95
Håv-trekk stasjon.stop
4xWP2 Northern line
07.03.2026
16:50:53
264
6120.300521 N
00201.422364 E
213.24
CTD with watersample start
Northern line
07.03.2026
17:15:17
265
6121.614976 N
00202.931196 E
250.66
CTD with watersample stop
Northern line
07.03.2026
17:27:48
265
6121.587539 N
00203.058968 E
252.07
Håv-trekk stasjon.start
2xWP2 Northern line
07.03.2026
17:47:36
265
6121.634924 N
00202.925719 E
251.21
Håv-trekk stasjon.stop
2xWP2 Northern line
07.03.2026
18:15:07
265
6121.672437 N
00202.861473 E
250.69
Håv-trekk stasjon.start
2xWP2 Northern line
07.03.2026
20:32:48
265
6121.650904 N
00202.884489 E
251.43
Håv-trekk stasjon.stop
2xWP2 Northern line
07.03.2026
21:21:13
265
6124.237472 N
00207.458475 E
294.13
CTD with watersample start
Northern line
07.03.2026
21:32:50
266
6124.335855 N
00208.192180 E
295.60
CTD with watersample stop
Northern line
07.03.2026
21:46:59
266
6124.335520 N
00208.200045 E
295.64
CTD with watersample start
North line eDNA
08.03.2026
17:36:04
267
6124.292140 N
00208.337945 E
295.29
CTD with watersample stop
North line eDNA
08.03.2026
17:53:06
267
6124.290093 N
00208.354708 E
295.24
Håv-trekk stasjon.start
4xWP2 Northern line
08.03.2026
18:17:31
266
6124.308522 N
00208.256575 E
295.88
Håv-trekk stasjon.stop
4xWP2 Northern line
08.03.2026
19:37:05
266
6124.856810 N
00209.318020 E
299.03
CTD with watersample start
Northern line
08.03.2026
20:24:54
268
6129.134160 N
00218.156200 E
348.47
CTD with watersample stop
Northern line
08.03.2026
20:42:33
268
6129.133476 N
00218.138273 E
347.64
CTD with watersample start
North line eDNA
08.03.2026
20:59:05
269
6129.104851 N
00218.113908 E
347.61
CTD with watersample stop
North line eDNA
08.03.2026
21:19:24
269
6129.104336 N
00218.114430 E
347.89
Håv-trekk stasjon.start
4xWP2 Northern line
08.03.2026
21:47:40
268
6129.136971 N
00217.932848 E
347.93
Håv-trekk stasjon.stop
4xWP2 Northern line
08.03.2026
23:00:32
268
6129.109676 N
00218.196104 E
350.33
CTD with watersample start
Southern line
08.03.2026
23:47:20
270
6125.108060 N
00225.954249 E
350.53
CTD with watersample stop
Southern line
09.03.2026
00:06:06
270
6125.102391 N
00226.043332 E
352.44
Håv-trekk stasjon.start
4xWP2 Southern line
09.03.2026
00:23:50
270
6125.119239 N
00225.926683 E
350.91
Håv-trekk stasjon.stop
4xWP2 Southern line
09.03.2026
01:29:10
270
6125.126937 N
00226.146352 E
353.16
CTD with watersample start
Southern line
09.03.2026
02:32:10
271
6120.646879 N
00233.607437 E
349.08
CTD with watersample stop
Southern line
09.03.2026
02:52:20
271
6120.647021 N
00233.727078 E
349.39
CTD with watersample start
Southern eDNA
09.03.2026
03:08:02
272
6120.665800 N
00233.593132 E
349.59
CTD with watersample stop
Southern eDNA
09.03.2026
03:26:28
272
6120.665738 N
00233.663570 E
348.27
Håv-trekk stasjon.start
4xWP2 Southern line
09.03.2026
03:47:20
271
6120.684487 N
00233.614113 E
348.92
Håv-trekk stasjon.stop
4xWP2 Southern line
09.03.2026
04:49:38
271
6120.678361 N
00234.213963 E
352.26
CTD with watersample start
Southern line
09.03.2026
05:52:39
273
6117.223788 N
00226.523007 E
297.00
CTD with watersample stop
Southern line
09.03.2026
06:09:47
273
6117.227574 N
00226.503388 E
295.79
CTD with watersample start
Southern eDNA
09.03.2026
07:15:02
274
6117.222963 N
00226.579206 E
296.82
CTD with watersample stop
Southern eDNA
09.03.2026
07:30:10
274
6117.224518 N
00226.656135 E
297.00
Håv-trekk stasjon.start
4xWP2 Southern line
09.03.2026
07:55:36
273
6117.228464 N
00226.591683 E
297.15
Håv-trekk stasjon.stop
4xWP2 Southern line
09.03.2026
08:58:14
273
6117.258368 N
00227.160119 E
299.79
CTD with watersample start
Southern line
09.03.2026
13:22:35
275
6113.857123 N
00219.721794 E
250.34
CTD with watersample stop
Southern line
09.03.2026
13:36:21
275
6113.830931 N
00219.989526 E
248.00
Håv-trekk stasjon.start
4xWP2 Southern line
09.03.2026
13:59:39
275
6113.832738 N
00220.025442 E
247.95
Håv-trekk stasjon.stop
4xWP2 Southern line
09.03.2026
15:04:37
275
6113.785099 N
00220.260337 E
249.56
CTD with watersample start
Southern line
09.03.2026
15:40:29
276
6112.074498 N
00216.787266 E
0.00
CTD with watersample stop
Southern line
09.03.2026
15:52:03
276
6112.054458 N
00217.038721 E
208.19
Håv-trekk stasjon.start
4xWP2 Southern line
09.03.2026
16:11:24
276
6112.071546 N
00216.976633 E
207.94
Håv-trekk stasjon.stop
4xWP2 Southern line
09.03.2026
17:15:37
276
6112.029852 N
00217.160054 E
209.26
CTD with watersample start
Southern line
09.03.2026
17:45:16
277
6110.820869 N
00214.046393 E
143.57
CTD with watersample stop
Southern line
09.03.2026
17:53:40
277
6110.818759 N
00214.103772 E
146.95
CTD with watersample start
Southern eDNA
09.03.2026
18:06:32
278
6110.814299 N
00214.264730 E
162.85
CTD with watersample stop
Southern eDNA
09.03.2026
18:17:08
278
6110.820921 N
00214.251849 E
161.35
Håv-trekk stasjon.start
4xWP2 Southern line
09.03.2026
18:40:03
277
6110.828898 N
00214.186581 E
156.01
Håv-trekk stasjon.stop
4xWP2 Southern line
09.03.2026
19:22:16
277
6110.822765 N
00214.397027 E
172.70
CTD with watersample start
North inside HT
10.03.2026
10:58:19
279
6121.161319 N
00214.854176 E
292.73
CTD with watersample stop
North inside HT
10.03.2026
11:14:36
279
6121.160489 N
00214.856129 E
293.36
CTD with watersample start
North inside HT eDNA
10.03.2026
11:34:25
280
6121.160178 N
00214.854698 E
292.81
CTD with watersample stop
North inside HT eDNA
10.03.2026
11:53:00
280
6121.137539 N
00214.862614 E
293.11
CTD with watersample start
South inside HT eDNA
10.03.2026
13:46:43
281
6118.786591 N
00216.092073 E
284.69
CTD with watersample stop
South inside HT eDNA
10.03.2026
14:05:00
281
6118.779687 N
00216.104642 E
284.52
7. Strat and stop positions for ROV transects
Start and stop positions for ROV video transect conducted by Freyja December 2025
Anchor
Lat
Long
Transect
line_id 2025
Lat_Deg
Lat_Decmin
Long_Deg
Long_Decmin
SA06
61.35375949
2.2299206
SA06
1
61
21.2255694
2
13.795236
Start Chain HY10
SA06
61.34942927
2.2274593
SA06
1
61
20.9657562
2
13.647558
Stop Chain HY10
SA06
61.34504478
2.2250276
SA06
2
61
20.7026868
2
13.501656
Start Control
SA06
61.34938577
2.2274723
SA06
2
61
20.9631462
2
13.648338
Stop Control
SA06
61.34619263
2.2340412
SA06
3
61
20.7715578
2
14.042472
Start Control
SA06
61.34937505
2.2274882
SA06
3
61
20.962503
2
13.649292
Stop Control
Start and stop positions for ROV video transect conducted by Ægir, March 2026.