Summary
This annual monitoring programme on fish feed and feed ingredients is performed on behalf of the Norwegian Food Safety Authority. In 2024, IMR received 99 samples of fish feed, 9 fish meals, 9 fish oils, 19 plant meals and 10 plant oils. In addition several novel feed materials were included: 5 algae oils, 4 insect meals, 1 insect oil, 1 prebiotic yeast and 1 krill meal. Of the 99 fish feeds, 15 were starter feeds, 13 were smolt feeds and 71 were growth feeds all intended for salmonids, primarily Atlantic salmon (Salmo salar). Samples were analyzed for undesirable substances, processed animal proteins, microbial quality and selected feed additives. The results from 2024 were compliant for those organic and inorganic contaminants which are regulated according to Directive EC 2002/32 on undesirable substances in animal feed. Samples were analysed for a range of undesirable substances, including per- and polyfluoroalkyl substances (PFAS), brominated flame retardants and pesticides, to document the occurrence in samples of fish feed and feed materials where maximum levels (MLs) are not established.
Analyses of microbial quallity showed no presence of Salmonella or Listeria monocytogenes in the samples analysed. One sample of fishmeal contained Enterobacteriaceae at a level of 200 CFU/g. Processed animal proteins (PAP) of ruminant origin were not detected in any of the fishmeal samples analysed.
Two samples of corn gluten meal contained the highest levels of ochratoxin A observed since mycotoxin analyses were included in this monitoring programme in 2015 (25 and 140 μg/kg). These samples had also elevated levels of several other mycotoxins, in particular beauvericin.
Levels of cadmium, mercury, and arsenic were higher in starter- and smolt feed than in growth feeds, but well below the MLs for these substances in feed. This may be due to a higher inclusion of marine ingredients in starter feeds.
In fish feed, the PFAS FOSA was detected in 73% of the starter feeds, in 54% of the smolt feeds and in 27% of the growth feeds. Of other PFAS compounds, PFNA, PFOA, PFOS, PFBS and PFDS were detected in some samples (<20% of the samples). Of the feed materials analysed, more samples of fishmeals had PFAS levels above the LOQ than the other feed materials. FOSA was found at levels above the Level of Quantification (LOQ) in 88% of the fishmeal samples. There are no MLs for PFAS in feed or feed materials. Most samples of plant meal, insect meal, insect oil, krill meal, algae oil and yeast had levels of PFAS below the LOQ.
Of the pesticides analysed in fish feed, beta HCH, trans nonachlor, HCB, mirex, toxaphene, diedrin, endosulphan, heptachlor, chlordane, DDT, cypermetrin, deltametrin, chlorpyrifos, primifos-methyl, glyphosate, and the metabolite of glyphosinate aminomethylphosphonic acid (AMPA) were detected above the LOQ. The highest levels of both cypermetrin and deltametrin were found in a sample of plant meal, specifically wheat gluten.The pesticide chlorpyrifos is no longer authorised in the EU but was present in all feeds, allbeit at low concentrations.
Novel brominated flame retardants, polychlorinated naphthalenes, and dechloranes were analysed in this monitoring programme for the first time in 2024. The only substance above the LOQ in fish feed was 2,4,6-tribromoanisole a metabolite of 2,4,5-tribromophenol, which has been used as a flame retardant and other applications, including as a fungicide. Polychlorinated naphthalenes were not found at quantifiable levels in the feed samples analysed. There is a call for data on bromophenols and polychlorinated naphthalenes in feed and food.
In contrast to previous years, none of the feed samples contained ethoxyquin, a synthetic antioxidant no longer authorized as a feed additive.
Several of the feeds had concentrations of the trace elements selenium, zinc, molybdum and iron above the upper limit given in the legislation for feed additives. It is not known whether the feeds have been supplemented with these minerals or they originate from the feed materials.
These monitoring data on contaminants in fish feed and feed materials are important for risk assessment authorities, and for generating occurrence data which is required for setting future MLs for unregulated contaminants in feed materials and fish feed.
1. Background
The monitoring programme for fish feed is performed on behalf of the Norwegian Food Safety Authority as part of Norway's follow-up of national and European regulations on animal feed. The programme is carried out to obtain an overview of feed with regard to potential risk factors for public health, animal health and the environment. The programme has been carried out annually since 1996.
In 2024, the Institute of Marine Research (IMR) received 99 samples of fish feeds, 9 fish meals, 9 fish oils, 19 plant meals, 10 plant oils, 4 insect meals and 8 new feed materials (5 algae oils, 1 insect oil, 1 prebiotic yeast and 1 krill meal) in this programme. Of the 99 fish feeds, 15 were starter feeds, 13 were smolt feeds and 71 were growth feeds all intended for salmonids, mainly salmon. Selected samples were analyzed for several undesirable substances, Processed Animal Proteins (PAP), microbial quality and synthetic antioxidants.
The data generated in this programme are reported thoroughout the year directly to the Norwegian Food Safety Authority (NFSA). In addition, data on levels of contaminants in feed and feed materials obtained in this programme are reported to the European Food Safety Authority (EFSA).
The NFSA was responsible for taking representative samples. The samples were collected by inspectors from the NFSA from factories that produce fish feed and feed materials in Norway. The factories have different geographical distribution and the samples were taken at different times of the year. The goal is to have a representative selection of fish feed and feed materials used in Norwegian fish feed production.
The samples were sent to the IMR where they were registered and anonymized before analysis. The laboratories at IMR are accredited by Norwegian Accreditation according to the ISO-EN 17025 standard for many chemical and microbiological methods. IMR is the national reference laboratory (NRL) for several areas including Persistent Organic Pollutants, Metals and Nitrogenous Compounds, Residues of Pesticides and Feed Additives. A sub-contractor was used for some of the analyses and this laboratory is also accredited according to ISO-EN 17025.
Some of the results in this report are given as "<LOQ", which means that the concentrations are below the quantification limit of the method (LOQ; «Limit of Quantification»). LOQ is the concentrations of a substance that can be quantified with a given measurement uncertainty, and depends, among other things, on the type of sample. In order to be able to include these samples in the calculations of averages or sums, concentrations which are "<LOQ" are set equal to the LOQ level. This principle is called "upper-bound LOQ" and is the standard procedure for calculating total dioxins.1, 2. In this report, the "upper-bound" principle is used for calculating averages for all substance groups, with the exception of some substance groups (e.g. mycotoxins and PFAS) where this is required by legislation (this is specified in the relevant tables).
2. Results and discussion
2.1 Processed animal proteins
Prohibited processed animal proteins (PAP), i.e. meat, bone and offal meal, blood meal and ruminant blood products were analysed in 9 fishmeal samples. Ruminant DNA was not detected in any of the samples analysed by quantitiative Polymerase Chain Reaction (qPCR), and PAP of vertebrate origin other than fish was not detected using the light microscopy method. Gill tissue, and parts of otoliths and scales from fish were found in several of the fishmeal samples.
2.2 Microbiological quality and toxins
2.2.1 Microbiological analyses
The presence of the bacteria Listeria monocytogenes was analysed in 20 growth feeds and the presence of bacteria Enterobacteriaceae and Salmonella were analysed in fishmeal, plant meals and insect meals. Enterobacteriaceae was present above the LOQ in one fishmeal sample, which contained 200 CFU/g. The sample was compliant with the regulation regarding animal by-products (Regulation (EC) No 1069/2009) which states that numbers above 300 CFU of Enterobacteraceae/g in one or more samples is unsatisfatory. No Salmonella or Listeria monocytogenes were detected in any of the samples analysed in 2024.
2.2.2 Mycotoxins
The mycotoxins aflatoxins (B1, B2, G1 and G2), deoxynivalenol, nivalenol, zearalenone, ochratoxin A, fumonisins (B1 and B2), T-2 toxin, and HT-2 toxin were analysed in 19 plant meals, 9 fish meals and 4 insect meals (Table 1). Results for mycotoxins showed no exceedance of the ML for aflatoxin or guidance values for deoxynivalenol, zearalenone, ochratoxin A or fumonisins in the samples from 2024. Two samples of corn gluten meal contained the highest levels of ochratoxin A observed since mycotoxin analyses were included in this monitoring programme in 2015 (25 and 140 μg/kg). These samples had also elevated levels of several other mycotoxins, in particular beauvericin.The more lipophilic mycotoxins (beauvericin and enniatins) were analysed in 48 samples of fish feeds, 10 plant oils, 19 plant meals and 4 insect meals (Table 2). Enniatin B was found at concentrations above the limit of quantification (LOQ) in some fish feed (24% of the samples, comparable to results in 2023: 28% of the samples), but lower than prevalence seen for the years 2015-2021 (pesent in about 80% of the samples), and at relatively low concentrations (Table 2). Concentrations of beauvericin and enniatin B were very variable in plant meals with concentrations from below the LOQ to 220 μg/kg and 410 μg/kg, respectively. High levels have also been observed in the past in some samples of wheat gluten.3 Enniatin B was measurable (above LOQ) in 70 % of the plant samples in 2024 compared with 43% of the plant oils analysed in 2023. No ML or guidance values have been established for enniatins in feed or feed materials. However, a study in Atlantic salmon showed that high levels of enniatin B in feed (considerably higher than those observed in this monitoring programme) may cause reduced growth.4
2.3 Undesirable substances
2.3.1 Metals
Inorganic contaminants, including arsenic (As), cadmium (Cd), mercury (Hg), lead (Pb) and nickel (Ni) were analysed in 15 starter feeds, 13 smolt feeds and 71 growth feeds (in total 99 fish feeds), 9 fishmeal and 12 new feed materials (insect meal, insect oil, prebiotic yeast, algae oil and krill meal) in 2024 (Table 3).
In the fish feeds, the metal concentrations were similar to those found last year5, with levels of Cd ranging from 0.05 to 0.41 mg/kg, Ni ranging from 0.32 to 3.1 mg/kg, Pb ranging from <0.02 to 0.09 mg/kg, Hg ranging from <0.007 to 0.100 mg/kg and As ranging from 0.62 to 7.6 mg/kg. Starter feeds had significantly higher concentrations of Cd, Hg and As than the growth feeds, whereas the concentrations of Pb and Ni were not significantly different for the feed types (p < 0.05; Kruskal-Wallis and Dunn’s post-hoc test).
Methyl mercury (MeHg) and inorganic arsenic (iAs) were analysed in all feeds and in insect meals (n=4), and iAs was analysed in fishmeals. Inorganic As accounted for up to 7% of the total amount of As, while MeHg accounted for more than 60% of Hg in all feeds, with the exception of one growth feed where only 20% of total Hg was in the form of MeHg. The levels of Hg and MeHg were below the LOQ in three of the four insect meals analysed. Inorganic As was the major form of As in the insect meals (>46% of the total As). The total As levels are well below the ML of 2 mg/kg in feed materials of terrestrial origin, with concentrations up to 0.05 mg/kg in insect meals.
The organic arsenic species arsenobetaine (AB), arsenocholine (AC), dimethylarsinate (DMA), tetramethylarsoniumion (TETRA) and trimethylarsinoxide (TMAO) were analysed in 20 growth feeds (Table 3). The organic As form AB was the major As species identified in the feeds, and accounted for 8-45% of total As. DMA ranged from 0.006 to 0.030 mg/kg ww, and accounted for up to 1.5% of total As. The As species AC, TETRA and TMAO were present at low concentrations, and below the LOQ in most samples. A large fraction of As was not identified in the feeds (up to 70%) with this method and can be explained by the presence of other As species not analysed (e.g. arsenolipids).
2.3.2 Dioxins and PCB
Dioxins (sum PCDD/PCDF), dioxin-like (dl)PCBs, as well as six non-dioxin-like PCBs (PCB6) were analysed in 48 fish feeds, 19 plant meals and 12 samples of other feed materials (insect meal, insect oil, krill meal, algae oil and prebiotic yeast) in 2024 (Table 4 and Table 5). The dioxin levels in fish feed ranged from 0.09 to 0.46 ng TEQ/kg, and the levels of sum dioxins and dl-PCBs ranged from 0.22 to 1.2 ng TEQ/kg, which are below the MLs in fish feed of 1.75 ng TEQ/kg and 5.5 ng TEQ/kg, respectively (Table 5). The levels were comparable with last year’s survey.5 In fish feed, the levels of PCB6 varied between 0.64 and 8.6 μg/kg (Table 4) and the mean concentrations of 3.4 to 3.8 μg/kg for all tyes of feed (start-, smolt- and growth feed) were similar to the average in previous years.5 All samples had levels below the ML of 40 μg/kg for sum PCB6 in fish feed. The MLs for dioxins, dlPCBs and PCB6 in feed are to be reduced in the future, following the reduction in Tolerable Weekly Intake for dioxins and dlPCBs by EFSA.6
2.3.3 Other organochlorine compounds
Samples of fish feed (growth feeds, n=10) were analysed for 8 different compounds of dechloranes in 2024 (Table 6). Dechloranes are a group of organochlorine compounds that are used as flame retardants, and are persistent, and can bioaccumulate in the environment. Dechlorane plus is listed as a Persistent Organic Pollutant (POP) under the Stockholm Convention. None of the dechloranes analysed were detected in fish feeds (<LOQ) in 2024.
Samples of fish feed (growth feeds, n=10) were analysed for chlorinated naphthalenes in 2024 (Table 7). Chlorinated naphthalenes are organochlorine compounds based on naphthalene ring systems, previously used as lubricants, electrical insulation and plasticisers. Chlorinated naphthalenes are ubiquitous in the environment and are listed as POPs in the Stockholm Convention. EFSA recently performed a risk assessment of chlorinated naphthalenes, which focused on hexachlorinated naphthalenes (hexaCNs).13 It was concluded that dietary exposure to hexaCNs does not raise health concerns, but due to major limitations in the available data, no assessment was possible for genotoxic effects or for health risks of chlorinated naphthalenes other than hexaCNs. EFSA highlighted the need for data in food and feed. None of the chlorinated naphthalenes analysed were detected in fish feeds (<LOQ) in 2024.
2.3.4 Organochlorine pesticides
Organochlorine pesticides including hexachlorocyclohexane (HCH: alpha, beta and gamma forms), cis- and trans-nonachlor, hexachlorobenzene (HCB), isodrin, mirex, toxaphene, dieldrin/aldrin, endosulfan, heptachlor, and DDT (and its metabolites) were analysed in 48 fish feeds (15 starter feeds, 13 smolt feeds and 20 growth feeds) and 19 plant meals in 2024 (Tables 8 and 9). Organochlorine pesticides are persistent pollutants that are no longer used in most countries but are still detectable in the marine environment. The levels of these POPs were similar to those found in fish feed analysed in previous years in this programme.5 All concentrations were below the maximum levels for organochlorine pesticides in fish feed (Table 8 and 9). The metabolites of DDT, p,p'-DDE and p.p' DDD were the most prevalent of the chlorinated pesticides and were detected in all feed samples (Figure 1).
2.3.5 Herbicides and insecticides
Non-chlorinated pesticides used as herbicides were analysed in 43 fish feeds (15 starter feeds, 13 smolt feeds and 15 growth feeds), 10 plant oils, 19 plant meals and 4 insect meals in 2024. Glyphosate was detected at levels above the LOQ in fish feeds, plant oils and plant meals, but not in insect meal (Table 11). The health effects of glyphosate on salmon are not fully elucidated, but studies indicate that it may have negative effects on kidney and liver function in fish following aquatic exposure.7, 8 Glufosinate was not detected in any of the samples. Amino-methyl-phosphonic acid (AMPA), a metabolite of glyphosate, was present at levels above the LOQ in fish feed, plant meals, and insect meal, but not in plant oil (Table 11). The insecticides bifentrin, cyfluthrin, cypermethrin, deltamethrin, fenvalerate, chlorpyrifos, chlorpyrifos-methyl, lambda-cyhalothrin, permathrin and pirimiphos-methyl and the fungicide pentachlorobenzene (PeCB) were analysed in 48 fish feeds (15 starter feeds, 13 smolt feeds and 20 growth feeds) and 19 plant meals in 2024 (Table 10). PeCB which has been used to make the fungicide pentachloronitrobenzene, was not present at concentrations above the LOQ in any of the samples. Levels of bifentrin, cyfluthrin, fenvalerate chlorpyrifos-methyl and lambda-cyhalothrin were below the LOQ in all samples, and permethrin was only present in one smolt feed (at a concentration of 14 µg/kg). Cypermetrin, deltamethrin, chlorpyrifos and primiphos-methyl were present in fish feeds and plant meals (Table 10). There are no specific maximum residue levels (MRLs) for herbicides in feed, but there are MRLs for pesticides in raw materials and food products, but not for seafood. The renewal of the authorisation for chlorpyrifos and chlorpyrifos-methyl was not approved in the EU in 2020, and a Limit of analytical determination of 0.01 mg/kg has been established for this pesticide. All 48 feed samples analysed in 2024 contained levels of chlorpyrifos between 0.1 and 9.7 µg/kg and five of the 19 plant meals (guar meal, wheat gluten meal and corn gluten meal) contained levels between 0.1 and 9.9 µg/kg (Table 10). A newly developed, more sensitive method was used to analyse the samples collected in 2024, which may explain the high prevalence of chlorpyrifos in the feeds and feed materials compared to previous years.
2.3.6 Brominated flame retardants
Polybrominated diphenyl ethers (PBDEs), are a class of organobromine compounds that have been widely used as flame retardants in applications such as textiles, plastics and electronic equipment. PBDEs (11 congeners) were analysed in 48 fish feeds (15 starter feeds, 13 smolt feeds and 20 growth feeds) 19 plant meals and 12 samples of other feed materials including insect meal, insect oil, krill meal, algae oil and prebiotic yeast in 2024 (Table 12). There are eight congeners of PBDE that have been defined by EFSA as being of particular interest in terms of food safety, namely BDE-28, -47, -99, -100, -153, -154, -183 and -209.9 Previously in this monitoring programme, the first seven of these have been combined as sum PBDE7, while BDE 209 has only been monitored since 2021. In order to be able to compare with results from previous years, PBDE 7 is also presented in this report. The mean concentration of PBDE7 was 0.3 μg/kg in fish feed, which is comparable with previous years.5 The mean concentrations of PBDE7 in plant meals and other feed materials were 0.02 and 0.08 μg/kg, respectively. No MLs for PBDEs have been established for feed or feed materials. A recent risk assessment by the EFSA concluded that it is likely that current dietary exposure to PBDEs in the European population raises a health concern.9
HBCD and TBBPA were analysed in 20 fish feeds, 10 plant oils, 19 plant meals and 4 insect meals in 2024 (Table 13). HBCD was present in most samples of fish feed mainly as α- HBCD, whereas levels of HBCD in plant oils and meals and insect meals were below the LOQ (Table 13). HBCD can be transferred from feed to fish, but at current margins of exposure, EFSA concluded that the levels in food do not pose a health risk.10 Tetrabromobisphenol A (TBBPA) was detected in 25% of the fish feeds with levels ranging from <0.04 to 0.75 μg/kg, slightly lower than the maximum concentration found in fish feed in 2022. Three of the four insect meals contained TPPBA, ranging between <0.09 to 0.22 μg/kg. No MLs for HBCD or TBBP-A have been established for feed or feed materials. A recent risk assessment on TBBPA by the EFSA established a Tolerable Daily Intake (TDI) of 0.7 μg/kg body weight per day. The exposure estimates to TBBPA were all below the TDI, and the Contam Panel concluded that the current dietary exposure to TBBPA does not raise a health concern.11
In 2024, samples of fish feed (growth feeds, n=10) were analysed for novel BFRs (Table 14). None of the BFRs were detected in the feeds (<LOQs), except for 2,4,6-Tribromoanisole which was detected in 90% of the samples, with concentrations from <515 to 1180 ng/kg ww. Tribromoanisole is a metabolite of 2,4,5-tribromophenol, which is brominated phenol that has been used since the 1920s as a flame retardant and other applications including as a fungicide. In 2023, EFSA published an updated risk assessment on brominated phenols and their derivatives in food, and it was concluded that the current dietary exposure to 2,4,6-tribromophenol does not raise a health concern, however, there is a call for data on brominated phenols in food and feed.
The presence of naturally occurring brominated phenols in food has been shown to cause an unpleasant taste in several seafoods, such as crustaceans and fish.12
2.3.7 Per- and polyfluoroalkyl substances
Per- and polyfluoroalkyl substances (PFAS) were analysed in 99 fish feeds, 9 fish oils, 9 fishmeal, 18 plant meals and 8 other feed materials (insect meal, yeast and algae oil) in 2024. The results show that most samples have levels of PFAS below the method's LOQ (Tables 15A and 15B). In fish feed, perfluorooctane sulfonamide (FOSA) was detected in 73% of the starter feeds, in 54% of the smolt feeds and in 27% of the growth feeds. Perfluorononanoic acid (PFNA) was detected above the LOQ in 20% of the starter feeds, and also in smolt feeds (8%) and growth feeds (6%). Of other PFAS compounds, perfluorooctanoic acid (PFOA), perfluorooctane sulfonic acid (PFOS), perfluorobutane sulfonic acid (PFBS) and perfluorodecane sulfonic acid (PFDS) were detected in some samples (<20% of the samples).
Fishmeals had PFAS levels above the LOQ more frequently than the other feed materials. FOSA was found at levels above the LOQ in 88% of the fishmeal samples, with concentrations ranging from <0.1 to 0.69 µg/kg (Table 15B). Several other PFAS were detected in 1-2 fishmeal samples analysed in 2024, including PFOA, PFOS, PFBS, perfluorodecanoic acid (PFDA) and PFNA (Table 15B). Levels of PFNA and PFOS in fishmeal ranged from <0.1 to 2.5 µg/kg and <0.5 to 7.2 µg/kg, respectively. In the plant meals, only perfluorohexanoic acid (PFHxA) was detected above the LOQ in a sample of soy protein concentrate, with a concentration of 0.84 µg/kg. PFAS were not detected above the LOQ in the category “other feed materials”, with the exception of prebiotic yeast, where perfluoroheptanoic acid (PFHpA; 1.8 µg/kg), PFPeS (0.19 µg/kg) and perfluoroundecanoic acid (PFUnDA ; 0.63 µg/kg) were detected (Table 15A).
EU MLs have been established for PFAS in food and seafood products, but not for feed and feed materials. The MLs are set for four individual PFAS (PFOS, PFOA, PFNA and perfluorohexane sulfonic acid (PFHxS)), and the sum of these 4 PFAS, the latter is 2 µg/kg in muscle meat of most fish species (Commission Regulation (EU) 2023/915). The sum of PFAS4 (lower bound, LB) was up to 1.2 µg/kg in the fish feeds analysed in 2024. Fishmeal is recognized as a source of PFAS in aquafeeds,14-16 but also fish oil and plant feed materials can be a source of PFAS in fish feed.17 In Denmark, PFAS were reported in organic eggs, which were further traced to the use of fishmeal in the feed.18 Studies have shown that different fish species contain different levels of PFAS.19
2.3.8 Polycyclic aromatic hydrocarbons
The processing contaminants polyaromatic hydrocarbons (PAHs) were analysed in 19 plant meals and 4 insect meals in 2024. The concentrations of sum PAH4 ranged from 0.3 to 4.0 μg/kg in plant meals and between 0.3 and 0.4 μg/kg in insect meals (Table 16). The levels in plant meals were comparable to the concentrations measured in previous years, and the highest concentration (4 μg/kg) was found in both guar meal and corn gluten meal. There are EU MLs established for the PAH benzo[a]pyrene and for the sum of four PAHs (PAH4: benzo[a]pyrene, benz[a]anthracene, benzo[b]fluoranthene and chrysene) in smoked foods including fish, but not in feed materials or fish feed.
2.4 Additives
2.4.1 Synthetic antioxidants
The antioxidant ethoxyquin (EQ) and the main degradation product ethoxyquin-dimer (EQDM) were analysed in 15 growth feeds and 9 fishmeals in 2024 (Table 17). The use of EQ as an additive has been phased out in the EU and in Norway. In 2022, the European Commission implemented a regulation denying the authorisation of EQ as a feed additive (Commission Implementing Regulation (EU) 2022/1375). In contrast to previous years, analyses of fish feed and fishmeals in 2024 showed that EQ concentrations were below the LOQ (0.009 mg/kg) in all samples. None of the samples analysed contained EQDM levels above the LOQ (0.07 mg/kg).
The synthetic antioxidants butylated hydroxytoluene (BHT), butylated hydroxyanisole (BHA) and propyl gallate were analysed in 43 fish feeds, 9 fishmeals, 19 plant meals, 9 fish oils and 4 insect meals in 2024 (Table 17). The levels of BHA and BHT in fish feed varied between <0.2 to 19 mg/kg and <0.2 and 70 mg/kg, respectively. The levels of propyl gallate were below the LOQ in all feeds, as in previous years, and was only quantifiable in one plant meal sample. In contrast to previous years, none of the fishmeals had levels of propyl gallate above the LOQ. None of the feeds exceeded the maximum level for synthetic antioxidants of 150 mg/kg.
Fish oil had large variations in concentrations of synthetic antioxidants, from < 0.2 to 220 mg/kg for BHA (n=9) and from <0.2 to 270 mg/kg for BHT (n=4). The results show that these antioxidants are added to fish oils to varying degrees. Fish meals contained low levels of BHA (between <0.2 - 8.2 mg/kg) whereas levels of BHT in fishmeal varied considerably (< 0.2 to 310 mg/kg). Insect meals did not have quantifiable levels of any of the synthetic antioxidants measured, and plant meals did not contain BHA or BHT.
2.4.2 Nutrients
2.4.2.1 Minerals
The macrominerals phosphorus (P), calcium (Ca), and magnesium (Mg), potassium (K) and sodium (Na) were analysed in 15 starter feeds, 13 smolt feeds, and 20 growth feeds in 2024 (Table 18). For all minerals, the average concentration was highest in starter feeds, followed by smolt feeds, while growth feeds had the lowest concentration levels. The concentration of P varied from 11 to 21 g/kg in starter feeds, from 11 to 15 g/kg in smolt feeds, and from 8.4 to 14 g/kg in growth feeds. The requirement for P in salmon is estimated to be at least 8 g/kg of bioavailable P. Generally, not all P in current salmon feed is considered bioavailable.
Microminerals, or trace elements, were analysed in 99 feeds (15 starter feeds, 13 smolt feeds, 71 growth feeds), 9 fishmeal, 4 insect meal and 8 other feed materials in 2024 (Table 19). Several of the essential minerals are regulated as feed additives in the EU, and the levels in fish feed must comply with the maximum allowable content set in EU regulations for feed additives, when the substance has been added. The maximum allowable content for these minerals, if they have been added as feed additives, for iron (Fe) is 750 mg/kg, manganese (Mn) is 100 mg/kg, molybdenum (Mo) is 2.5 mg/kg, selenium (Se) is 0.5 mg/kg and zinc (Zn) is 180 mg/kg for feed for salmonids. Several of the feeds surveyed in 2024 may indicate that the levels were above the maximum allowable content, this applies to Se (87% of feeds), Zn (24% of feeds) and Mo (41% of feeds). This has also been observed in previous years in this surveillance programme.5 It is not known whether the feeds have been supplemented with these minerals or they originate from the feed materials. Iron (Fe), copper (Cu), cobalt (Co), manganese (Mn), and iodine (I) levels in all feeds were below the maximum allowable content.
The concentrations of Se were significantly higher in the starter feeds (average 1.0 mg/kg ww) and smolt feed (0.87 mg/kg ww) compared to the growth feeds (0.68 mg/kg ww) (p < 0.05; Kruskal-Wallis and Dunn’s post-hoc test). The concentrations of Fe were significantly higher in the growth feeds (average 71 mg/kg) than starter feeds (average 15 mg/kg) and smolt feeds (average 13 mg/kg). For Zn, Mo, Mn, Cu and Co no significant differences in concentrations were observed between the feed types analysed in 2024. Iodine was only analysed in 20 growth feeds, and the levels were well below the maximum content for salmonid feeds (Table 19).
Microminerals can be supplemented to fish feeds but can also originate from feed ingredients. Fishmeal is a source of Se (1.9-3.3 mg/kg), Zn (50-100 mg/kg) and Fe (85-250 mg/kg), whereas the results show that insect meal is a source of Mn (410-470 mg/kg), Zn (160-220 mg/kg) and Fe (150-190 mg/kg) (Table 18). Of the other feed materials analysed in 2024, krill meal (n=1) had high levels of Se (4.7 mg/kg), Zn (51 mg/kg) and Cu (25 mg/kg). Algae oil has not previously been analysed in this programme, and the results for the microminerals in algae oil (n=5) showed variable levels of Fe (0.9-56 mg/kg), Zn (0.5-26 mg/kg) and Cu (<0.05-10 mg/kg), whereas yeast (n=1) seems to be a good source of Zn (51 mg/kg), Mo (9.6 mg/kg), Fe (30 mg/kg) and Cu (16 mg/kg).
2.4.2.2 Vitamins
Vitamin E was analysed in 9 fish meals, 19 plant meals and 4 insect meals in 2024 (Table 20). There was a large variation in the levels of sum tocopherols in fishmeals, as seen in previous years, with levels between 9 and 204 mg/kg, and a mean concentration of 73 mg/kg. Levels of sum tocotrienols were between 0.3 and 20 mg/kg, and a mean concentration of 3 mg/kg, which is also similar to previous findings in this programme.5 Concentrations of sum tocopherols and sum tocotrienols in plant meals varied between 2.4 to 137 mg/kg, and 0.28 to 110 mg/kg, respectively. The highest levels of sum tocopherols were found in insect meal and these varied between 168 and 512 mg/kg, whereas levels of sum tocotrienols were between 3.5 and 28 mg/kg (Table 20). Vitamin E has an antioxidant function, and the addition of vitamin E may therefore be important to prevent the oxidation of feed and feed materials, but it also has several important biological and metabolic functions.20
3. Conclusions
The results for 2024 show no exceedances of established MLs for undesirable substances in fish feed or feed materials. The results of this year's monitoring programme show detectable levels of chlorpyrifos in fish feed, which is a pesticide no longer authorised in the EU. For several of the undesirable substances analysed, including PFAS and pesticides, no maximum limits have been established for fish feed and feed materials, but the European Food Safety Authority has published calls for data.
These monitoring data on contaminants in fish feed and feed materials are important for risk assessment authorities, and for generating occurrence data which is required for setting future MLs for unregulated contaminants in feed materials and fish feed.
4. Tables
Table 1. Mycotoxins
Mean and range (min-max) of mycotoxin levels (µg/kg wet weight) in plant- fish- and insect meals in 2024. Mean is given when 20% or more of the results were over LOQ, using "lower-bound LOQ"). [Gjennomsnitt og konsentrasjonsområde (min-maks) for mykotoksiner (µg/kg våtvekt) i plantemel, fiskemel og insektmel i 2024. Snittverdier er gitt der 20% eller mer av prøvesvarene er over LOQ, snitt gitt som "lower-bound LOQ"].
| |
AFB11)
|
AFB2
|
AFG1
|
AFG2
|
Sum AF
|
DON 2)
|
ZEN 3)
|
NIV
|
OTA
|
FB1
|
FB2
|
Sum FB4)
|
T2-toxin
|
HT2-toxin
|
sum T2 + HT-2
|
|
Plant meals
|
|
|
|
|
|
|
|
|
|
|
|
|
|
|
|
|
n = 19
|
|
|
|
|
|
|
|
|
|
|
|
|
|
|
|
|
Mean (LB)
|
0.92
|
<LOQ
|
<LOQ
|
<LOQ
|
<LOQ
|
<LOQ
|
<LOQ
|
<LOQ
|
9.2
|
<LOQ
|
<LOQ
|
<LOQ
|
<LOQ
|
<LOQ
|
<LOQ
|
|
Min
|
<0.1
|
<0.1
|
<0.1
|
<0.1
|
<0.4
|
<20
|
<10
|
<20
|
<0.2
|
<20
|
<20
|
<40
|
<7.5
|
<7.5
|
<15
|
|
Max
|
6.4
|
0.95
|
1.6
|
0.24
|
8.3
|
490
|
60
|
|
140
|
166
|
288
|
362
|
14
|
12
|
26
|
|
Samples >LOQ
|
4 (21%)
|
3 (16%)
|
1 (5%)
|
1 (5%)
|
3 (16%)
|
1 (5%)
|
2 (11%)
|
0
|
6 (32%)
|
1 (5%)
|
2 (11%)
|
2 (11%)
|
2 (11%)
|
2 (11%)
|
2 (12%)
|
|
Fishmeals
|
|
|
|
|
|
|
|
|
|
|
|
|
|
|
|
|
n = 9
|
|
|
|
|
|
|
|
|
|
|
|
|
|
|
|
|
Mean (LB)
|
<LOQ
|
<LOQ
|
<LOQ
|
<LOQ
|
<LOQ
|
<LOQ
|
<LOQ
|
<LOQ
|
<LOQ
|
<LOQ
|
<LOQ
|
<LOQ
|
<LOQ
|
<LOQ
|
<LOQ
|
|
Min
|
<0.1
|
<0.1
|
<0.1
|
<0.1
|
<0.4
|
<20
|
<10
|
<20
|
<0.2
|
<20
|
<20
|
<40
|
<7.5
|
<7.5
|
<15
|
|
Max
|
0.33
|
|
|
|
|
|
12
|
|
|
|
|
|
|
|
|
|
Samples >LOQ
|
1 (11%)
|
0
|
0
|
0
|
0
|
0
|
1 (11%)
|
0
|
0
|
0
|
0
|
0
|
0
|
0
|
0
|
|
Insect meals
|
|
|
|
|
|
|
|
|
|
|
|
|
|
|
|
|
n = 4
|
|
|
|
|
|
|
|
|
|
|
|
|
|
|
|
|
Mean (LB)
|
<LOQ
|
<LOQ
|
<LOQ
|
<LOQ
|
<LOQ
|
<LOQ
|
<LOQ
|
<LOQ
|
<LOQ
|
<LOQ
|
<LOQ
|
<LOQ
|
<LOQ
|
<LOQ
|
<LOQ
|
|
Min
|
<0.1
|
<0.1
|
<0.1
|
<0.1
|
<0.4
|
<20
|
<10
|
<20
|
<0.2
|
<20
|
<20
|
<40
|
<7.5
|
<7.5
|
<15
|
|
Max
|
|
|
|
|
|
|
|
|
|
|
|
|
|
|
|
|
Samples >LOQ
|
0
|
0
|
0
|
0
|
0
|
0
|
0
|
0
|
0
|
0
|
0
|
0
|
0
|
0
|
0
|
AF: Aflatoxin; DON: Deoxynivalenol; NIV: Nivalenol; OTA: Ochratoxin A; ZEN: Zearalenone; FB1: Fumonisin B1; FB2: Fumonisin B2 1) The EU maximum limit for aflatoxin B1 in feed materials is 20 µg/kg 2) The EU guidance value for DON in cereals and cereal products is 8000 µg/kg and 12000 µg/kg in maize by-products, and in Norway the guidance value for DON is 2 000 µg/kg. 3)The guidance value for zearalenone in cereals and cereal products for feed is 2000 µg/kg and 3000 µg/kg in maize by-products. 4) The guidance value for fumonisin in feed materials is 60 000 µg/kg (for the sum of FB1 and FB2).
Table 2. Mycotoxins – Beavericin and enniatins
Mean and range (min-max) of beauvericin (BEA) and enniatin (ENN) levels (µg/kg wet weight) in fish feed, plant meals, plant oils and insect meals in 2024. Mean is given when 20% or more of the results are over LOQ, using "lower-bound LOQ").[Gjennomsnitt og konsentrasjonsområde (min-maks) for beauvericin og enniatin (µg/kg våtvekt) i fullfôr, plantemel og planteoljer i 2024. Snittverdier er gitt der 20% eller mer av prøvesvarene er over LOQ, gitt som "lower-bound LOQ"].
| |
BEA
|
ENN A
|
ENN A1
|
ENN B
|
ENN B1
|
|
Start feed
|
|
|
|
|
|
| n = 15 |
|
|
|
|
|
|
Mean (LB)
|
<LOQ
|
<LOQ
|
<LOQ
|
3.7
|
<LOQ
|
|
Min
|
<10
|
<10
|
<10
|
<10
|
<10
|
|
Max
|
21
|
|
|
19
|
|
|
Samples >LOQ
|
1 (7%)
|
0
|
0
|
4 (27%)
|
0
|
|
Smolt feed
|
|
|
|
|
|
| n = 13 |
|
|
|
|
|
|
Mean (LB)
|
<LOQ
|
<LOQ
|
<LOQ
|
<LOQ
|
<LOQ
|
|
Min
|
<10
|
<10
|
<10
|
<10
|
<10
|
|
Max
|
|
|
|
16
|
|
|
Samples >LOQ
|
0
|
0
|
0
|
2 (15%)
|
0
|
|
Growth feed
|
|
|
|
|
|
| n = 20 |
|
|
|
|
|
|
Mean (LB)
|
<LOQ
|
<LOQ
|
<LOQ
|
3.1
|
<LOQ
|
|
Min
|
<10
|
<10
|
<10
|
<10
|
<10
|
|
Max
|
|
|
|
14
|
|
|
Samples >LOQ
|
0
|
0
|
0
|
5 (25%)
|
0
|
|
Plant oils
|
|
|
|
|
|
| n = 10 |
|
|
|
|
|
|
Mean (LB)
|
<LOQ
|
<LOQ
|
<LOQ
|
20
|
6.8
|
|
Min
|
<10
|
<10
|
<10
|
<10
|
<10
|
|
Max
|
|
|
11
|
38
|
18
|
|
Samples >LOQ
|
0
|
0
|
1 (10%)
|
7 (70%)
|
5 (50%)
|
|
Plant meals
|
|
|
|
|
|
| n = 19 |
|
|
|
|
|
|
Mean (LB)
|
<LOQ
|
<LOQ
|
<LOQ
|
<LOQ
|
<LOQ
|
|
Min
|
<10
|
<10
|
<10
|
<10
|
<10
|
|
Max
|
220
|
|
20
|
410
|
99
|
|
Samples >LOQ
|
2 (11%)
|
0
|
1 (5%)
|
3 (16%)
|
3 (16%)
|
|
Insect meals
|
|
|
|
|
|
| n = 4 |
|
|
|
|
|
|
Mean (LB)
|
<LOQ
|
<LOQ
|
<LOQ
|
<LOQ
|
<LOQ
|
|
Min
|
<10
|
<10
|
<10
|
<10
|
<10
|
|
Max
|
|
|
|
|
|
|
Samples >LOQ
|
0
|
0
|
0
|
0
|
0
|
Table 3. Metals and element species
Mean and range (min-max) of metal and element species levels in fish feed, fishmeal and other feed materials (mg/kg wet weight) in 2024. Mean is given as "upper-bound LOQ". The maximum levels (MLs) are given in the rows below the results (based on 88% dry matter). [Gjennomsnitt og konsentrasjonsområde (min-maks) av metaller og element spesier (kjemiske former) (mg/kg våtvekt) i fullfôr, fiskemel, og andre fôrmidler i 2024. Snitt gitt som "upper-bound LOQ". Øvre grenseverdier (MLs) er gitt under de analyserte verdiene, bassert på 88% tørrstoff].
| |
Cd
|
Pb
|
Ni
|
Hg
|
MeHg
|
As
|
iAs
|
AB
|
AC
|
DMA
|
TETRA
|
TMAO
|
|
Starter feed
|
|
|
|
|
|
|
|
|
|
|
|
|
|
n =
|
15
|
15
|
15
|
15
|
15
|
15
|
15
|
0
|
0
|
0
|
0
|
0
|
|
Mean (UB)
|
0.17
|
0.04
|
1.1
|
0.043
|
0.043
|
3.9
|
0.028
|
|
|
|
|
|
|
Min
|
0.08
|
0.02
|
0.4
|
0.022
|
0.021
|
2.6
|
<0.007
|
|
|
|
|
|
|
Max
|
0.32
|
0.06
|
2.5
|
0.10
|
0.10
|
7.6
|
0.064
|
|
|
|
|
|
|
Samples >LOQ
|
15 (100%)
|
15 (100%)
|
15 (100%)
|
15 (100%)
|
15 (100%)
|
15 (100%)
|
14 (93%)
|
|
|
|
|
|
|
Smolt feed
|
|
|
|
|
|
|
|
|
|
|
|
|
|
n =
|
13
|
13
|
13
|
13
|
13
|
13
|
13
|
0
|
0
|
0
|
0
|
0
|
|
Mean (UB)
|
0.13
|
0.04
|
0.7
|
0.027
|
0.026
|
3.0
|
0.022
|
|
|
|
|
|
|
Min
|
0.07
|
0.03
|
0.4
|
0.010
|
0.009
|
1.4
|
0.009
|
|
|
|
|
|
|
Max
|
0.41
|
0.08
|
1.8
|
0.041
|
0.039
|
4.7
|
0.041
|
|
|
|
|
|
|
Samples >LOQ
|
13 (100%)
|
13 (100%)
|
13 (100%)
|
13 (100%)
|
13 (100%)
|
13 (100%)
|
13 (100%)
|
|
|
|
|
|
|
Growth feed
|
|
|
|
|
|
|
|
|
|
|
|
|
|
n =
|
71
|
71
|
71
|
71
|
71
|
71
|
71
|
20
|
20
|
20
|
20
|
20
|
|
Mean (UB)
|
0.10
|
0.03
|
0.8
|
0.020
|
0.019
|
2.1
|
0.019
|
0.60
|
<LOQ
|
0.013
|
<LOQ
|
0.004
|
|
Min
|
0.05
|
<0.02
|
0.3
|
<0.007
|
0.003
|
0.62
|
<0.007
|
0.10
|
<0.008
|
0.006
|
<0.009
|
<0.004
|
|
Max
|
0.28
|
0.09
|
3.1
|
0.064
|
0.058
|
5.5
|
0.045
|
2.0
|
0.02
|
0.03
|
|
0.01
|
|
Samples >LOQ
|
71 (100%)
|
59 (83%)
|
71 (100%)
|
63 (89%)
|
71 (100%)
|
71 (100%)
|
63 (89%)
|
20 (100%)
|
2 (10%)
|
20 (100%)
|
0
|
5 (25%)
|
|
MLs* – Feed for salmonids
|
1
|
5
|
-
|
0.2
|
-
|
10
|
2
|
-
|
-
|
-
|
-
|
-
|
|
Fishmeals
|
|
|
|
|
|
|
|
|
|
|
|
|
|
n =
|
9
|
9
|
9
|
9
|
0
|
9
|
9
|
0
|
0
|
0
|
0
|
0
|
|
Mean (UB)
|
0.45
|
0.06
|
0.6
|
0.10
|
|
7.9
|
0.010
|
|
|
|
|
|
|
Min
|
0.2
|
<0.02
|
<0.3
|
0.021
|
|
4.1
|
<0.007
|
|
|
|
|
|
|
Max
|
1.4
|
0.2
|
3.0
|
0.16
|
|
15
|
0.019
|
|
|
|
|
|
|
Samples >LOQ
|
9 (100%)
|
7 (78%)
|
4 (44%)
|
9 (100%)
|
|
9 (100%)
|
3 (33%)
|
|
|
|
|
|
|
MLs – Fishmeal
|
2
|
10
|
-
|
0.5
|
-
|
25
|
2
|
-
|
-
|
-
|
-
|
-
|
|
Other feed materials**
|
|
|
|
|
|
|
|
|
|
|
|
|
|
n =
|
12
|
12
|
12
|
12
|
4
|
12
|
4
|
0
|
0
|
0
|
0
|
0
|
|
Mean (UB)
|
0.23
|
0.02
|
<LOQ
|
<LOQ
|
<LOQ
|
0.64
|
0.022
|
|
|
|
|
|
|
Min
|
<0.002
|
<0.01
|
<0.1
|
<0.003
|
<0.003
|
<0.005
|
0.012
|
|
|
|
|
|
|
Max
|
0.74
|
0.20
|
3.0
|
0.07
|
|
4.2
|
0.046
|
|
|
|
|
|
|
Samples >LOQ
|
6 (50%)
|
4 (33%)
|
2 (17%)
|
1 (8%)
|
0
|
9 (75%)
|
4 (100%)
|
|
|
|
|
|
|
MLs – Feed materials
|
2 1)
|
10
|
-
|
0.1 2)
|
-
|
2 3)
|
2 4)
|
-
|
-
|
-
|
-
|
-
|
Cd: cadmium, Pb: lead, Ni: nickel, Hg: mercury MeHg: methyl mercury, As: arsenic, iAs: inorganic As, AB: arsenobetaine, AC: arsenocholine, DMA(V): dimethylarsinate, TETRA: tetramethylarsoniumion, TMAO: trimethylarsinoxide * MLs in complete feed are set for 88% DM. ** Other feed materials include: insect meal, insect oil, prebiotic.yeast, algae oil and krill meal.1) ML for Cd in feed materials of animal origin is 2 mg/kg, and ML for plant origin is 1 mg/kg. MLs for yeast is not defined in EC2002/32 and amendments.2) ML for Hg in feed material of fish and other aquatic animal is 0.5 mg/kg. 3) ML for As in feed material of fish and other aquatic animal is 25 mg/kg.4) ML for iAs in feed material of fish and other aquatic animal.
Table 4. PCBs
Mean and range (min-max) of PCB-28, PCB-52, PCB-101, PCB-138, PCB-153 and PCB-180 and sum PCB6 (µg/kg wet weight) in fish feed, plant meal and other feed ingredients in 2024. Mean and sum PCB6 are given as "upper-bound LOQ". The maximum level (ML) is for sum PCB6 (µg/kg) [Gjennomsnitt og konsentrasjonsområde (min-maks) av kongenerne PCB-28, PCB-52, PCB-101, PCB-138, PCB-153 og PCB-180 og sum PCB6 (µg/kg våtvekt) i fullfôr, fiskemel og fiskeolje i 2024. Snitt av kongenere og sum PCB6 er gitt som "upper-bound LOQ". Øvre grenseverdi er gitt for sum PCB6 (µg/kg)].
| |
PCB-101
|
PCB-138
|
PCB-153
|
PCB-180
|
PCB-28
|
PCB-52
|
Sum PCB6
|
|
Starter feed
|
|
|
|
|
|
|
|
|
n = 15
|
|
|
|
|
|
|
|
|
Mean (UB)
|
0.66
|
0.91
|
1.5
|
0.31
|
0.12
|
0.34
|
3.8
|
|
Min
|
0.35
|
0.47
|
0.74
|
0.14
|
<0.09
|
0.19
|
2.0
|
|
Max
|
1.1
|
1.4
|
2.5
|
0.50
|
0.20
|
0.60
|
6.2
|
|
Samples > LOQ
|
15 (100%)
|
15 (100%)
|
15 (100%)
|
15 (100%)
|
12 (80%)
|
15 (100%)
|
15 (100%)
|
|
Smolt feed
|
|
|
|
|
|
|
|
|
n = 13
|
|
|
|
|
|
|
|
|
Mean (UB)
|
0.56
|
0.82
|
1.3
|
0.30
|
0.13
|
0.29
|
3.4
|
|
Min
|
0.08
|
0.09
|
0.20
|
<0.07
|
<0.1
|
<0.1
|
0.64
|
|
Max
|
1.0
|
1.6
|
2.2
|
0.60
|
0.20
|
0.50
|
6.0
|
|
Samples > LOQ
|
13 (100%)
|
13 (100%)
|
13 (100%)
|
11 (85%)
|
7 (54%)
|
11 (85%)
|
13 (100%)
|
|
Growth feed
|
|
|
|
|
|
|
|
|
n = 20
|
|
|
|
|
|
|
|
|
Mean (UB)
|
0.59
|
0.78
|
1.3
|
0.33
|
0.12
|
0.31
|
3.5
|
|
Min
|
0.09
|
0.10
|
0.20
|
<0.07
|
<0.1
|
<0.1
|
0.67
|
|
Max
|
1.5
|
2.1
|
3.4
|
0.70
|
0.30
|
0.70
|
8.6
|
|
Samples > LOQ
|
20 (100%)
|
20 (100%)
|
20 (100%)
|
18 (90%)
|
11 (55%)
|
18 (90%)
|
20 (100%)
|
|
ML in fish feed*
|
-
|
-
|
-
|
-
|
-
|
-
|
40
|
|
Plant meals
|
|
|
|
|
|
|
|
|
n = 19
|
|
|
|
|
|
|
|
|
Mean (UB)
|
<LOQ
|
<LOQ
|
<LOQ
|
<LOQ
|
<LOQ
|
<LOQ
|
0.32
|
|
Min
|
<0.03
|
<0.03
|
<0.04
|
<0.03
|
<0.04
|
<0.04
|
0.22
|
|
Max
|
|
|
|
|
|
|
0.40
|
|
Samples > LOQ
|
0
|
0
|
0
|
0
|
0
|
0
|
19 (100%)
|
|
Other feed materials**
|
|
|
|
|
|
|
|
|
n = 12
|
|
|
|
|
|
|
|
|
Mean (UB)
|
<LOQ
|
<LOQ
|
<LOQ
|
<LOQ
|
<LOQ
|
<LOQ
|
1.0
|
|
Min
|
<0.05
|
<0.05
|
<0.07
|
<0.05
|
<0.07
|
<0.07
|
0.35
|
|
Max
|
|
|
|
|
|
|
2.1
|
|
Samples > LOQ
|
0
|
0
|
0
|
0
|
0
|
0
|
12 (100%)
|
* ML in complete feed are set for 88% DM.** Other feed materials include: insect meal, insect oil, krill meal, algae oil and prebiotic yeast
Table 5. Dioxins and dioxin-like PCBs
Mean and range (min-max) of sum dioxins (PCDD and PCDF), sum dioxin-like (dl)-PCB and sum dioxins and dl-PCB levels in fish feed, plant meal and other feed ingredients in 2024. Mean and sums are given using «upper-bound LOQ» and in ng TEQ2005/kg wet weight1). The maximum levels are given in the rows below the results (ng TEQ/kg). [Gjennomsnitt og konsentrasjonsområde (min-maks) av sum dioksiner (sum PCDD og PCDF), sum dioksinlignende (dl)-PCB og sum dioksiner og dl-PCB i fullfôr, plantemel og andre fôrvarer i 2024. Snitt og summer er gitt som «upper-bound LOQ», og gitt i ng TEQ/kg våtvekt1)].
| |
Sum PCDD+PCDF
|
Sum dl-PCB2)
|
Sum dioxins and dl-PCB3)
|
|
Starter feed
|
|
|
|
|
n = 15
|
|
|
|
|
Mean (UB)
|
0.23
|
0.34
|
0.57
|
|
Min
|
0.13
|
0.19
|
0.34
|
|
Max
|
0.34
|
0.70
|
1.0
|
|
Samples > LOQ
|
15 (100%)
|
15 (100%)
|
15 (100%)
|
|
Smolt feed
|
|
|
|
|
n = 13
|
|
|
|
|
Mean (UB)
|
0.20
|
0.30
|
0.50
|
|
Min
|
0.09
|
0.06
|
0.23
|
|
Max
|
0.37
|
0.60
|
0.83
|
|
Samples > LOQ
|
13 (100%)
|
13 (100%)
|
13 (100%)
|
|
Growth feed
|
|
|
|
|
n = 20
|
|
|
|
|
Mean (UB)
|
0.22
|
0.24
|
0.47
|
|
Min
|
0.15
|
0.05
|
0.22
|
|
Max
|
0.46
|
0.83
|
1.2
|
|
Samples > LOQ
|
20 (100%)
|
20 (100%)
|
20 (100%)
|
| ML in fish feed |
1.75 |
|
5.5 |
|
Plant meals
|
|
|
|
|
n = 19
|
|
|
|
|
Mean (UB)
|
0.13
|
0.02
|
0.15
|
|
Min
|
0.03
|
0.003
|
0.04
|
|
Max
|
0.81
|
0.12
|
0.86
|
|
Samples > LOQ
|
19 (100%)
|
19 (100%)
|
19 (100%)
|
|
Other feed material*
|
|
|
|
|
n = 12
|
|
|
|
|
Mean (UB)
|
0.14
|
0.05
|
0.20
|
|
Min
|
0.05
|
0.01
|
0.05
|
|
Max
|
0.34
|
0.33
|
0.67
|
|
Samples > LOQ
|
12 (100%)
|
12 (100%)
|
12 (100%)
|
1) ng TEQ (WHO 2005)/kg (concentration multiplied by toxic equivalency factor (TEF)).2) Non-ortho PCB congeners (IUPAC code PCB 77, 81, 126 and 169) and mono-ortho PCB congeners (IUPAC code PCB 105, 114, 118, 123, 156, 157, 167 and 189).3) The sum of dioxins (PCDD/F) and dl-PCB given as sum total toxic equivalents (sum TEQ) using WHO TEFs from 2005.* Other feed materials include: insect meal, insect oil, krill meal, algae oil and prebiotic yeast
Table 6. Dechloranes
Mean and range (min-max) of dechlorane levels (ng/kg wet weight) in fish feed in 2024. Mean is given when 20% or more of the results are over LOQ. [Gjennomsnitt og konsentrasjonsområde (min-maks) av dekloraner (ng/kg våtvekt) i fiskefôr (vekstfôr) i 2024. Snittverdier er gitt der 20% eller mer av prøvesvarene er over LOQ].
| |
1,5-Dechlorane Plus mono addduct
|
anti-Dechlorane Plus
|
Cl10-Dechlorane Plus
|
Cl11-Dechlorane Plus
|
Dechlorane 602
|
Dechlorane 603
|
Dechlorane 604
|
syn-Dechlorane Plus
|
|
Growth feed
|
|
|
|
|
|
|
|
|
|
n = 10
|
|
|
|
|
|
10
|
10
|
10
|
|
Mean (UB)
|
<LOQ
|
<LOQ
|
<LOQ
|
<LOQ
|
<LOQ
|
<LOQ
|
<LOQ
|
<LOQ
|
|
Min
|
<8.8
|
<26.3
|
<8.8
|
<8.8
|
<87.7
|
<8.8
|
<26.3
|
<87.7
|
|
Max
|
|
|
|
|
|
|
|
|
|
Samples >LOQ
|
0
|
0
|
0
|
0
|
0
|
0
|
0
|
0
|
Table 7. Polychlorinated naphthalenes
Mean and range (min-max) of polychlorinated naphthalene (PCN) levels (mg/kg wet weight) in fish feeds in 2024. [Gjennomsnitt og konsentrasjonsområde (min-maks) av klorerte naftalener (CN, mg/kg våtvekt) i vekstfôr i 2024].
| |
Sum of diCNs
|
Sum of heptaCNs
|
Sum of hexaCNs
|
Sum of monoCNs
|
Sum of octaCNs
|
Sum of pentaCNs
|
Sum of tetraCNs
|
Sum of trichloronaphtalenes
|
|
Growth feed
|
|
|
|
|
|
|
|
|
|
n = 10
|
|
|
|
|
|
10
|
10
|
10
|
|
Mean (UB)
|
<LOQ
|
<LOQ
|
<LOQ
|
<LOQ
|
<LOQ
|
<LOQ
|
<LOQ
|
<LOQ
|
|
Min
|
<1
|
<1
|
<1
|
<1
|
<1
|
<1
|
<1
|
<1
|
|
Max
|
|
|
|
|
|
|
|
|
|
Samples >LOQ
|
0
|
0
|
0
|
0
|
0
|
0
|
0
|
0
|
Table 8. Chlorine pesticides
Mean and range (min-max) of chlorinated pesticide levels (µg/kg wet weight) in fish feed and plant meals analysed in 2024. Mean and sums are given using «upper-bound LOQ» and molecular weighted [Gjennomsnitt og konsentrasjonsområde (min-maks) av klorerte pesticider (µg/kg våtvekt) i fullfôr og plantemel undersøkt i 2024. Snitt og summer er gitt som «upper-bound LOQ» og molekylvektet].
| |
alfa-HCH
|
beta-HCH
|
gamma-HCH
|
cis-Nonaklor
|
Trans-Nonachlor
|
HCB
|
Isodrin
|
Mirex
|
Sum Toxaphene
|
Sum Dieldrin
|
Sum Endosulfan
|
Sum Heptachlor
|
Sum Chlordane
|
|
Starter feed
|
|
|
|
|
|
|
|
|
|
|
|
|
|
|
n = 15
|
|
|
|
|
|
|
|
|
|
|
|
|
|
|
Mean (UB)
|
<LOQ
|
<LOQ
|
<LOQ
|
<LOQ
|
1.0
|
1.4
|
<LOQ
|
<LOQ
|
4.6
|
2.3
|
5.4
|
2.9
|
1.5
|
|
Min
|
<0.09
|
<0.09
|
<0.09
|
<0.9
|
0.37
|
0.76
|
<2.3
|
<0.09
|
4.3
|
1.9
|
5.1
|
2.7
|
1.2
|
|
Max
|
|
0.11
|
|
|
2.0
|
2.4
|
|
0.14
|
6.1
|
3.2
|
5.5
|
3.0
|
2.2
|
|
Samples >LOQ
|
0
|
1 (7%)
|
0
|
0
|
15 (100%)
|
15 (100%)
|
0
|
1 (7%)
|
15 (100%)
|
15 (100%)
|
15 (100%)
|
15 (100%)
|
15 (100%)
|
|
Smolt feed
|
|
|
|
|
|
|
|
|
|
|
|
|
|
|
n = 13
|
|
|
|
|
|
|
|
|
|
|
|
|
|
|
Mean (UB)
|
<LOQ
|
0.12
|
<LOQ
|
<LOQ
|
0.81
|
1.1
|
<LOQ
|
<LOQ
|
4.6
|
2.2
|
5.5
|
3.0
|
1.4
|
|
Min
|
<0.095
|
<0.095
|
<0.095
|
<0.95
|
<0.25
|
<0.5
|
<2.4
|
<0.095
|
4.3
|
2.0
|
5.3
|
2.9
|
1.2
|
|
Max
|
|
0.17
|
|
|
1.7
|
2.1
|
|
|
5.4
|
2.9
|
5.7
|
3.1
|
1.9
|
|
Samples >LOQ
|
0
|
5 (38%)
|
0
|
0
|
11 (85%)
|
11 (85%)
|
0
|
0
|
13 (100%)
|
13 (100%)
|
13 (100%)
|
13 (100%)
|
13 (100%)
|
|
Growth feed
|
|
|
|
|
|
|
|
|
|
|
|
|
|
|
n = 20
|
|
|
|
|
|
|
|
|
|
|
|
|
|
|
Mean (UB)
|
<LOQ
|
0.11
|
<LOQ
|
<LOQ
|
0.62
|
0.90
|
<LOQ
|
<LOQ
|
4.5
|
2.2
|
5.3
|
2.9
|
1.3
|
|
Min
|
<0.09
|
<0.09
|
<0.09
|
<0.9
|
<0.24
|
<0.48
|
<2.3
|
<0.09
|
4.1
|
1.9
|
5.0
|
2.7
|
1.1
|
|
Max
|
0.12
|
0.18
|
|
|
1.6
|
2.3
|
|
0.10
|
5.4
|
3.7
|
5.5
|
3.0
|
1.8
|
|
Samples >LOQ
|
1 (5%)
|
5 (25%)
|
0
|
0
|
18 (90%)
|
16 (80%)
|
0
|
1 (5%)
|
20 (100%)
|
20 (100%)
|
20 (100%)
|
20 (100%)
|
20 (100%)
|
|
Max limit µg/kg
|
|
|
|
|
|
10
|
|
|
20
|
20
|
50
|
10
|
20
|
|
Plant meals
|
|
|
|
|
|
|
|
|
|
|
|
|
|
|
n = 19
|
|
|
|
|
|
|
|
|
|
|
|
|
|
|
Mean (UB)
|
<LOQ
|
<LOQ
|
<LOQ
|
<LOQ
|
<LOQ
|
<LOQ
|
<LOQ
|
4.4
|
2.0
|
5.4
|
2.9
|
1.1
|
<LOQ
|
|
Min
|
<0.09
|
<0.09
|
<0.09
|
<0.9
|
<0.46
|
<2.3
|
<0.09
|
4.1
|
1.9
|
5.0
|
2.7
|
1.1
|
<0.23
|
|
Max
|
|
|
0.14
|
|
|
|
|
4.5
|
2.0
|
5.5
|
3.0
|
1.2
|
|
|
Samples >LOQ
|
0
|
0
|
1 (5%)
|
0
|
0
|
0
|
0
|
0
|
19 (100%)
|
19 (100%)
|
19 (100%)
|
19 (100%)
|
19 (100%)
|
Table 9. DDT
Mean and and range (min-max) of DDT isomer levels (µg/kg wet weight) in fish feed and plant meal analysed in 2024 (when 20% or more of the results are over LOQ). Mean and sum are given using «upper-bound LOQ» and molecular weighted. [Gjennomsnitt og konsentrasjonsområde (min-maks) av DDT-isomerer (µg/kg våtvekt) i fullfôr og plantemel i 2024. Snittverdier er gitt der 20% eller mer av prøvesvarene er over LOQ. Snitt og summer er gitt som «upper-bound LOQ» og molekylvektet. Øvre grenseverdi er gitt for sum DDT (µg/kg)].
| |
o,p'-DDD
|
o,p'-DDE
|
o,p'-DDT
|
p,p'-DDD
|
p,p'-DDE
|
p,p'-DDT
|
Sum DDT
|
|
Starter feed
|
|
|
|
|
|
|
|
|
n = 15
|
|
|
|
|
|
|
|
|
Mean (UB)
|
0.207
|
<LOQ
|
<LOQ
|
0.97
|
3.3
|
0.56
|
6.1
|
|
Min
|
<0.10
|
0.09
|
<0.47
|
0.56
|
1.5
|
<0.48
|
3.4
|
|
Max
|
0.39
|
0.14
|
0.51
|
1.6
|
5.1
|
0.97
|
9.5
|
|
Samples >LOQ
|
13 (87%)
|
2 (13%)
|
1 (7%)
|
15 (100%)
|
15 (100%)
|
6 (40%)
|
15 (100%)
|
|
Smolt feed
|
|
|
|
|
|
|
|
|
n = 13
|
|
|
|
|
|
|
|
|
Mean (UB)
|
0.163
|
<LOQ
|
<LOQ
|
0.85
|
3.0
|
<LOQ
|
5.6
|
|
Min
|
<0.10
|
<0.10
|
<0.48
|
0.17
|
0.64
|
<0.48
|
2.1
|
|
Max
|
0.31
|
0.12
|
|
1.6
|
5.2
|
0.73
|
9.1
|
|
Samples >LOQ
|
9 (69%)
|
1 (8%)
|
0
|
13 (100%)
|
13 (100%)
|
2 (15%)
|
13 (100%)
|
|
Growth feed
|
|
|
|
|
|
|
|
|
n = 20
|
|
|
|
|
|
|
|
|
Mean (UB)
|
0.15
|
<LOQ
|
<LOQ
|
0.95
|
2.6
|
0.51
|
5.2
|
|
Min
|
<0.09
|
<0.09
|
<0.46
|
0.14
|
0.68
|
<0.46
|
2.1
|
|
Max
|
0.3
|
|
|
2.1
|
6.7
|
0.65
|
11
|
|
Samples >LOQ
|
14 (70%)
|
0
|
0
|
20 (100%)
|
20 (100%)
|
5 (25%)
|
20 (100%)
|
|
Plant meals
|
|
|
|
|
|
|
|
|
n = 19
|
|
|
|
|
|
|
|
|
Mean (UB)
|
<LOQ
|
<LOQ
|
<LOQ
|
<LOQ
|
<LOQ
|
<LOQ
|
1.9
|
|
Min
|
<0.09
|
<0.09
|
<0.46
|
<0.09
|
<0.46
|
<0.46
|
1.7
|
|
Max
|
|
0.15
|
|
|
0.83
|
1.1
|
2.9
|
|
Samples >LOQ
|
0
|
1 (5%)
|
0
|
0
|
1 (5%)
|
1 (5%)
|
19 (100%)
|
Table 10. Insecticides
Mean and range (min-max) of insecticide levels (µg/kg wet weight) in fish feed and plant meals analysed in 2024. Mean is given when 20% or more of the results are over LOQ, using «upper-bound LOQ») [Gjennomsnitt og konsentrasjonsområde (min-maks) av insekticider (µg/kg våtvekt) i fullfôr og plantemel i 2024. Snittverdier er gitt der 20% eller mer av prøvesvarene er over LOQ. Snitt og summer er gitt som «upper-bound LOQ»].
| |
Bifentrin
|
Cyfluthrin
|
Cypermethrin
|
Deltamethrin
|
Fenvalerate
|
Chlorpyrifos
|
Chlorpyrifos-methyl
|
lambda-Cyhalothrin
|
Permethrin
|
Pirimifos-methyl
|
PeCB*
|
|
Starter feed
|
|
|
|
|
|
|
|
|
|
|
|
|
n = 15
|
|
|
|
|
|
|
|
|
|
|
|
|
Mean (UB)
|
<LOQ
|
<LOQ
|
4.1
|
8.0
|
<LOQ
|
1.8
|
<LOQ
|
<LOQ
|
<LOQ
|
9.0
|
<LOQ
|
|
Min
|
<2.3
|
<2.3
|
<2.3
|
<2.5
|
<2.3
|
0.25
|
<0.47
|
<2.3
|
<4.7
|
3.4
|
<2.3
|
|
Max
|
|
|
23
|
27
|
|
9.7
|
|
|
|
17
|
|
|
Samples >LOQ
|
0
|
0
|
3 (20%)
|
12 (80%)
|
0
|
15 (100%)
|
0
|
0
|
0
|
15 (100%)
|
0
|
|
Smolt feed
|
|
|
|
|
|
|
|
|
|
|
|
|
n =13
|
|
|
|
|
|
|
|
|
|
|
|
|
Mean (UB)
|
<LOQ
|
<LOQ
|
3.9
|
20.9
|
<LOQ
|
1.8
|
<LOQ
|
<LOQ
|
<LOQ
|
8.9
|
<LOQ
|
|
Min
|
<2.4
|
<2.4
|
<2.4
|
<2.5
|
<2.4
|
0.81
|
<0.48
|
<2.4
|
<4.8
|
3.4
|
<2.4
|
|
Max
|
|
|
9
|
82
|
|
4.2
|
|
|
14
|
28
|
|
|
Samples >LOQ
|
0
|
0
|
6 (46%)
|
10 (77%)
|
0
|
13 (100%)
|
0
|
0
|
1 (8%)
|
13 (100%)
|
0
|
|
Growth feed
|
|
|
|
|
|
|
|
|
|
|
|
|
n = 20
|
|
|
|
|
|
|
|
|
|
|
|
|
Mean (UB)
|
<LOQ
|
<LOQ
|
5.4
|
6.7
|
<LOQ
|
1,98
|
<LOQ
|
<LOQ
|
<LOQ
|
9.1
|
<LOQ
|
|
Min
|
<2.3
|
<2.3
|
<2.3
|
2.3
|
<2.3
|
0.19
|
<0.46
|
<2.3
|
<4.6
|
1.2
|
<2.3
|
|
Max
|
|
|
17
|
21
|
|
4.5
|
|
|
|
20
|
|
|
Samples >LOQ
|
0
|
0
|
9 (45%)
|
17 (85%)
|
0
|
20 (100%)
|
0
|
0
|
0
|
20 (100%)
|
0
|
|
Plant meals
|
|
|
|
|
|
|
|
|
|
|
|
|
n = 19
|
|
|
|
|
|
|
|
|
|
|
|
|
Mean (UB)
|
<LOQ
|
<LOQ
|
72.8
|
<LOQ
|
<LOQ
|
0.95
|
<LOQ
|
<LOQ
|
<LOQ
|
7.6
|
<LOQ
|
|
Min
|
<2.3
|
<2.3
|
<2.3
|
<2.3
|
<2.3
|
<0.1
|
<0.46
|
<2.3
|
<4.6
|
<0.46
|
<2.3
|
|
Max
|
|
|
754
|
214
|
3.1
|
9.9
|
|
|
|
66
|
|
|
Samples >LOQ
|
0
|
0
|
4 (21%)
|
3 (16%)
|
1 (5%)
|
5 (26%)
|
0
|
0
|
0
|
9 (47%)
|
0
|
Table 11. Herbicides
Mean and range (min-max) levels of the herbicides aminomethylphosphonic acid (AMPA), glufosinate and glyphosate (mg/kg wet weight) in fish feed, plant oil, plant meals and insect meal analysed in 2024. Mean is given when 20% or more of the results are over LOQ, using «upper-bound LOQ») [Gjennomsnitt og konsentrasjonsområde (min-maks) av aminometylfosfonsyre (AMPA), glufosinat and glyfosat (mg/kg våtvekt) i fullfôr, planteoljer, plantemel og insektmel i 2024. Snittverdier er gitt der 20% eller mer av prøvesvarene er over LOQ. Snitt og summer er gitt som «upper-bound LOQ»].
| |
AMPA
|
Glufosinate
|
Glyphosate
|
|
Starter feed
|
|
|
|
|
n = 15
|
|
|
|
|
Mean (UB)
|
0.03
|
<LOQ
|
0.10
|
|
Min
|
<0.01
|
<0.01
|
<0.01
|
|
Max
|
0.10
|
|
0.34
|
|
Samples >LOQ
|
7 (47%)
|
0
|
13 (87%)
|
|
Smolt feed
|
|
|
|
|
n = 13
|
|
|
|
|
Mean (UB)
|
0.04
|
<LOQ
|
0.15
|
|
Min
|
0.01
|
<0.01
|
0.,07
|
|
Max
|
0.10
|
|
0.32
|
|
Samples >LOQ
|
9 (69%)
|
0
|
12 (92%)
|
|
Growth feed
|
|
|
|
|
n = 15
|
|
|
|
|
Mean (UB)
|
0.02
|
<LOQ
|
0.09
|
|
Min
|
<0.01
|
<0.01
|
<0.01
|
|
Max
|
0.03
|
|
0.24
|
|
Samples >LOQ
|
12 (80%)
|
0
|
14 (93%)
|
|
Plant oils
|
|
|
|
|
n = 10
|
|
|
|
|
Mean (UB)
|
<LOQ
|
<LOQ
|
<LOQ
|
|
Min
|
<0.01
|
<0.01
|
<0.01
|
|
Max
|
|
|
0.14
|
|
Samples >LOQ
|
0
|
0
|
1 (10%)
|
|
Plant meals
|
|
|
|
|
n = 19
|
|
|
|
|
Mean (UB)
|
0.03
|
<LOQ
|
0.18
|
|
Min
|
<0.01
|
<0.01
|
<0.01
|
|
Max
|
0.14
|
|
0.90
|
|
Samples >LOQ
|
6 (32%)
|
0
|
11 (58%)
|
|
Insect meals
|
|
|
|
|
n = 4
|
|
|
|
|
Mean (UB)
|
0.02
|
<LOQ
|
<LOQ
|
|
Min
|
<0.01
|
<0.01
|
<0.01
|
|
Max
|
0.02
|
|
|
|
Samples >LOQ
|
3 (75%)
|
0
|
0
|
Table 12. PBDE
Mean and range (min-max) PBDE levels (µg/kg wet weight) in fish feed, plant meal and other feed ingredients in 2024. Mean is given when 20% or more of the results are above the LOQ. Mean and sum of PBDE7 are given as «upper-bound LOQ». [Gjennomsnitt og konsentrasjonsområde (min-maks) av polybromerte flammehemmere, PBDE kongenere (µg/kg våtvekt) i fullfôr, plantemel og andre fôrmidler i 2024. Snittverdier er gitt der 20% eller mer av prøvesvarene er over LOQ. Snitt og sum PBDE7 er gitt som «upper-bound LOQ»].
| |
BDE 28
|
BDE 47
|
BDE 66
|
BDE 99
|
BDE 100
|
BDE 153
|
BDE 154
|
BDE 183
|
BDE 209
|
BDE 49
|
BDE 75
|
Sum PBDE7*
|
|
Starter feed
|
|
|
|
|
|
|
|
|
|
|
|
|
|
n = 15
|
|
|
|
|
|
|
|
|
|
|
|
|
|
Mean (UB)
|
0.010
|
0.18
|
0.010
|
0.037
|
0.050
|
0.009
|
0.053
|
<LOQ
|
0.17
|
0.075
|
0.003
|
0.34
|
|
Min
|
0.005
|
0.085
|
0.003
|
0.015
|
0.026
|
0.004
|
0.025
|
<0.002
|
<0.10
|
0.034
|
<0.002
|
0.18
|
|
Max
|
0.019
|
0.34
|
0.019
|
0.064
|
0.10
|
0.019
|
0.12
|
0.003
|
0.42
|
0.13
|
0.012
|
0.66
|
|
Samples >LOQ
|
15 (100%)
|
15 (100%)
|
15 (100%)
|
15 (100%)
|
15 (100%)
|
15 (100%)
|
15 (100%)
|
2 (13%)
|
7 (47%)
|
15 (100%)
|
3 (20%)
|
15 (100%)
|
|
Smolt feed
|
|
|
|
|
|
|
|
|
|
|
|
|
|
n = 13
|
|
|
|
|
|
|
|
|
|
|
|
|
|
Mean (UB)
|
0.010
|
0.18
|
0.009
|
0.031
|
0.045
|
0.007
|
0.043
|
<LOQ
|
0.22
|
0.070
|
<LOQ
|
0.32
|
|
Min
|
0.004
|
0.053
|
0.003
|
0.012
|
0.012
|
<0.003
|
0.011
|
<0.002
|
<0.12
|
0.032
|
<0.002
|
0.097
|
|
Max
|
0.022
|
0.36
|
0.017
|
0.061
|
0.093
|
0.015
|
0.071
|
|
0.44
|
0.12
|
0.013
|
0.60
|
|
Samples >LOQ
|
13 (100%)
|
13 (100%)
|
13 (100%)
|
13 (100%)
|
13 (100%)
|
12 (92%)
|
13 (100%)
|
0
|
9 (69%)
|
13 (100%)
|
1 (8%)
|
13 (100%)
|
|
Growth feed
|
|
|
|
|
|
|
|
|
|
|
|
|
|
n = 20
|
|
|
|
|
|
|
|
|
|
|
|
|
|
Mean (UB)
|
0.010
|
0.18
|
0.012
|
0.030
|
0.045
|
0.007
|
0.035
|
<LOQ
|
0.15
|
0.10
|
<LOQ
|
0.31
|
|
Min
|
0.003
|
0.048
|
0.005
|
0.012
|
0.012
|
0.003
|
0.008
|
<0.002
|
<0.09
|
0.032
|
<0.002
|
0.093
|
|
Max
|
0.022
|
0.37
|
0.041
|
0.075
|
0.091
|
0.017
|
0.094
|
0.009
|
0.27
|
0.32
|
|
0.62
|
|
Samples >LOQ
|
20 (100%)
|
20 (100%)
|
20 (100%)
|
20 (100%)
|
20 (100%)
|
20 (100%)
|
20 (100%)
|
1 (5%)
|
6 (30%)
|
20 (100%)
|
0
|
20 (100%)
|
|
Plant meals
|
|
|
|
|
|
|
|
|
|
|
|
|
|
n = 19
|
|
|
|
|
|
|
|
|
|
|
|
|
|
Mean (UB)
|
<LOQ
|
<LOQ
|
<LOQ
|
<LOQ
|
<LOQ
|
<LOQ
|
<LOQ
|
<LOQ
|
0.50
|
<LOQ
|
<LOQ
|
0.019
|
|
Min
|
<0.001
|
<0.004
|
<0.001
|
<0.003
|
<0.001
|
<0.001
|
<0.001
|
<0.001
|
<0.05
|
<0.001
|
<0.001
|
0.013
|
|
Max
|
|
0.011
|
|
0.007
|
|
|
|
|
2.6
|
|
|
0.025
|
|
Samples >LOQ
|
0
|
1 (5%)
|
0
|
2 (11%)
|
0
|
0
|
0
|
0
|
6 (32%)
|
0
|
0
|
19 (100%)
|
|
Other feed materials
|
|
|
|
|
|
|
|
|
|
|
|
|
|
n = 12
|
|
|
|
|
|
|
|
|
|
|
|
|
|
Mean (UB)
|
<LOQ
|
<LOQ
|
<LOQ
|
0.019
|
<LOQ
|
0.006
|
<LOQ
|
0.007
|
0.28
|
<LOQ
|
<LOQ
|
0.081
|
|
Min
|
<0.002
|
<0.007
|
<0.002
|
<0.005
|
<0.002
|
<0.002
|
<0.002
|
<0.002
|
<0.08
|
<0.002
|
<0.002
|
0.020
|
|
Max
|
0.012
|
0.17
|
0.014
|
0.059
|
0.030
|
0.013
|
0.027
|
0.026
|
0.73
|
0.059
|
|
0.31
|
|
Samples >LOQ
|
1 (8%)
|
2 (17%)
|
1 (8%)
|
4 (33%)
|
2 (17%)
|
4 (33%)
|
1 (8%)
|
5 (42%)
|
4 (33%)
|
2 (17%)
|
0
|
12 (100%)
|
*PBDE7 is the sum of congeners BDE 28, 47, 99, 100, 153, 154 and 183. ** Other feed materials include: insect meal, insect oil, algaeoil, krillmeal and prebiotic yeast.
Table 13. HBCD and TBBP-A
Mean concentration and the range (min-max) of HBCD congeners (α, β and γ) and TBBP-A (µg/kg wet weight) in fish feed. plant oils. plant meals and insect meals in 2024. The average and sums are “upper bound”. [Gjennomsnittskonsentrasjoner og konsentrasjonsområde (min-maks verdier) av HBCD kongenerne α. β og γ og TBBP-A (µg/kg våtvekt) i fiskfôr, planteoljer, plantemel og insektmel i 2024. Snittverdier er gitt der 20% eller mer av prøvesvarene er over kvantifiseringsgrensen (LOQ). Snittverdier og summen er «upper bound LOQ»]
| |
alfa-HBCD
|
beta-HBCD
|
gamma-HBCD
|
Sum HBCD
|
TBBP-A
|
|
Growth feed
|
|
|
|
|
|
|
n = 20
|
|
|
|
|
|
|
Mean (UB)
|
0.044
|
<LOQ
|
0.012
|
0.062
|
0.19
|
|
Min
|
0.011
|
<0.006
|
<0.006
|
0.023
|
<0.04
|
|
Max
|
0.11
|
|
0.042
|
0.13
|
0.75
|
|
Samples >LOQ
|
20 (100%)
|
0
|
5 (25%)
|
20 (100%)
|
5 (25%)
|
|
Plant oils
|
|
|
|
|
|
|
n = 10
|
|
|
|
|
|
|
Mean (UB)
|
<LOQ
|
<LOQ
|
<LOQ
|
<LOQ
|
<LOQ
|
|
Min
|
<0.03
|
<0.03
|
<0.03
|
<0.09
|
<0.19
|
|
Max
|
|
|
|
|
0.49
|
|
Samples >LOQ
|
0
|
0
|
0
|
0
|
1 (10%)
|
|
Plant meals
|
|
|
|
|
|
|
n =
|
19
|
19
|
19
|
19
|
19
|
|
Mean (UB)
|
<LOQ
|
<LOQ
|
<LOQ
|
<LOQ
|
<LOQ
|
|
Min
|
<0.006
|
<0.006
|
<0.006
|
<0.02
|
<0.04
|
|
Max
|
|
|
|
|
14.4
|
|
Samples >LOQ
|
0
|
0
|
0
|
0
|
4 (14%)
|
|
Insect meals
|
|
|
|
|
|
|
n = 4
|
|
|
|
|
|
|
Mean (UB)
|
<LOQ
|
<LOQ
|
<LOQ
|
<LOQ
|
0.14
|
|
Min
|
<0.006
|
<0.006
|
<0.006
|
<0.02
|
<0.09
|
|
Max
|
|
|
|
|
0.22
|
|
Samples >LOQ
|
0
|
0
|
0
|
0
|
3 (75%)
|
Table 14. Novel brominated flame retardants
Mean and range (min-max) of brominated flame retardants (BFRs) levels (ng/kg wet weight) in growth feeds in 2024. Mean is given as "upper-bound LOQ". [Gjennomsnitt og konsentrasjonsområde (min-maks) av bromerte flammehemmere (ng/kg våtvekt) i vekstfôr i 2024. Snitt gitt som "upper-bound LOQ"].
|
|
DPTE
|
TBA
|
ATE
|
BATE
|
TBB
|
TBPH
|
BTBPE
|
DecaBDE
|
HBB
|
PBEB
|
PBT
|
|
Growth feed
|
|
|
|
|
|
|
|
|
|
|
|
|
n = 10
|
|
|
|
|
|
|
|
|
|
|
|
|
Mean (UB)
|
<LOQ
|
794
|
<LOQ
|
<LOQ
|
<LOQ
|
<LOQ
|
<LOQ
|
<LOQ
|
<LOQ
|
<LOQ
|
<LOQ
|
|
Min
|
<1320
|
<515
|
<44
|
<44
|
<132
|
<877
|
<877
|
<6140
|
<18
|
<8.8
|
<132
|
|
Max
|
|
1180
|
|
|
|
|
|
|
|
|
|
|
Samples above LOQ
|
0
|
9 (90%)
|
0
|
0
|
0
|
0
|
0
|
0
|
0
|
0
|
0
|
DPTE: 2,3-Dibromopropyl-2,4,6-tribromophenylether; TBA: 2,4,6-Tribromoanisole; ATE: 2,4,6-Tribromophenyl allyl ether; BATE: 2-Bromoallyl-2,4,6-tribromophenyl ether; TBB: 2-Ethylhexyl-2,3,4,5-tetrabromobenzoate; TBPH: Bis(2-ethylhexyl) tetrabromophalate; BTBPE: 1,2-Bis(2,4,6-tribromophenoxy)ethane; decaBDE: Decabromodiphenyl ether; HBB: Hexabromobenzene; PBEB: Pentabromoethylbenzene; PBT: 2,3,4,5,6-Penta Bromotoluene
Table 15A. PFAS
Mean and range (min-max) of PFAS (µg/kg wet weight) in fish feed, fishmeals, fish oils, plant meals and other feed ingredients in 2024. Mean is given when 20% or more of the results are over LOQ. Mean and sum of 4PFAS (sum of PFOS, PFOA, PFOSA and PFHxS) are given using «lower-bound (LB) LOQ» as specified in the regulation. [Gjennomsnitt og konsentrasjonsområde (min-maks) av per-og polyfluorerte forbindelser (PFAS, µg/kg våtvekt) i fullfôr, fiskemel, fiskeolje, plantemel og andre fôrmidler i 2024. Snittverdier er gitt der 20% eller mer av prøvesvarene er over LOQ. Snitt og sum of 4PFAS (PFOS, PFOA, PFOSA og PFHxS) er gitt som «lower-bound LOQ som gitt i regelverket»].
| |
PFPeS
|
PFTeDA
|
PFUnDA
|
PFUnDS
|
PFBA
|
PFOS
|
PFOA
|
PFNA
|
PFHxS
|
SUM PFAS4 LB
|
|
Starter feed
|
|
|
|
|
|
|
|
|
|
|
|
n =
|
14
|
15
|
15
|
15
|
4
|
15
|
15
|
15
|
15
|
15
|
|
Mean (LB)
|
<LOQ
|
<LOQ
|
<LOQ
|
<LOQ
|
<LOQ
|
<LOQ
|
<LOQ
|
0.0407
|
<LOQ
|
0.138
|
|
Min
|
<0.1
|
<0.1
|
<0.5
|
<1
|
<5
|
<0.5
|
<0.1
|
<0.1
|
<0.1
|
0
|
|
Max
|
|
|
|
|
|
0.7
|
0.14
|
0.33
|
|
1.2
|
|
Samples >LOQ
|
0
|
0
|
0
|
0
|
0
|
2 (13%)
|
1 (7%)
|
3 (20%)
|
0
|
4 (27%)
|
|
Smolt feed
|
|
|
|
|
|
|
|
|
|
|
|
n =
|
13
|
13
|
13
|
13
|
1
|
13
|
13
|
13
|
13
|
13
|
|
Mean (LB)
|
<LOQ
|
<LOQ
|
<LOQ
|
<LOQ
|
<LOQ
|
<LOQ
|
<LOQ
|
<LOQ
|
<LOQ
|
<LOQ
|
|
Min
|
<0.1
|
<0.1
|
<0.5
|
<1
|
<5
|
<0.5
|
<0.1
|
<0.1
|
<0.1
|
0
|
|
Max
|
|
|
|
|
|
|
|
0.11
|
|
0.11
|
|
Samples >LOQ
|
0
|
0
|
0
|
0
|
0
|
0
|
0
|
1 (8%)
|
0
|
1 (8%)
|
|
Growth feed
|
|
|
|
|
|
|
|
|
|
|
|
n =
|
71
|
71
|
71
|
71
|
2
|
71
|
71
|
71
|
71
|
71
|
|
Mean (LB)
|
<LOQ
|
<LOQ
|
<LOQ
|
<LOQ
|
<LOQ
|
<LOQ
|
<LOQ
|
<LOQ
|
<LOQ
|
<LOQ
|
|
Min
|
<0.1
|
<0.1
|
<0.5
|
<1
|
<5
|
<0.5
|
<0.1
|
<0.1
|
<0.1
|
0
|
|
Max
|
|
|
|
|
|
0.82
|
|
0.23
|
|
1.1
|
|
Samples >LOQ
|
0
|
0
|
0
|
0
|
0
|
3 (4%)
|
0
|
4 (6%)
|
0
|
4 (6%)
|
|
Fishmeals
|
|
|
|
|
|
|
|
|
|
|
|
n =
|
8
|
9
|
9
|
9
|
6
|
9
|
9
|
9
|
9
|
9
|
|
Mean (LB)
|
<LOQ
|
<LOQ
|
<LOQ
|
<LOQ
|
<LOQ
|
1.08
|
0.16
|
0.31
|
0.041
|
1.59
|
|
Min
|
<0.1
|
<0.1
|
<0.5
|
<1
|
<5
|
<0.5
|
<0.1
|
<0.1
|
<0.1
|
0
|
|
Max
|
0.12
|
0.12
|
0.71
|
|
|
7.2
|
1.1
|
2.5
|
0.24
|
11
|
|
Samples >LOQ
|
1 (12%)
|
1 (11%)
|
1 (11%)
|
0
|
0
|
2 (22%)
|
2 (22%)
|
2 (22%)
|
2 (22%)
|
2 (22%)
|
|
Fish oils
|
|
|
|
|
|
|
|
|
|
|
|
n =
|
8
|
9
|
9
|
0
|
0
|
9
|
9
|
9
|
9
|
9
|
|
Mean (LB)
|
<LOQ
|
<LOQ
|
<LOQ
|
<LOQ
|
<LOQ
|
0.84
|
0.08
|
0.24
|
<LOQ
|
1.2
|
|
Min
|
<0.1
|
<5
|
<5
|
|
|
<0.5
|
<0.1
|
<0.1
|
<0.1
|
0
|
|
Max
|
|
|
|
|
|
5.9
|
0.59
|
1.7
|
0.13
|
8.3
|
|
Samples >LOQ
|
0
|
0
|
0
|
0
|
0
|
2 (22%)
|
2 (22%)
|
2 (22%)
|
1 (11%)
|
2 (22%)
|
|
Plant meals
|
|
|
|
|
|
|
|
|
|
|
|
n =
|
17
|
18
|
18
|
18
|
1
|
18
|
18
|
17
|
18
|
17
|
|
Mean (LB)
|
<LOQ
|
<LOQ
|
<LOQ
|
<LOQ
|
<LOQ
|
<LOQ
|
<LOQ
|
<LOQ
|
<LOQ
|
<LOQ
|
|
Min
|
<0.1
|
<0.1
|
<0.5
|
<1
|
<5
|
<0.5
|
<0.1
|
<0.1
|
<0.1
|
0
|
|
Max
|
|
|
|
|
|
|
|
|
|
|
|
Samples >LOQ
|
0
|
0
|
0
|
0
|
0
|
0
|
0
|
0
|
0
|
0
|
|
Other feed materials
|
|
|
|
|
|
|
|
|
|
|
|
n =
|
8
|
7
|
8
|
5
|
2
|
8
|
8
|
7
|
8
|
7
|
|
Mean (LB)
|
<LOQ
|
<LOQ
|
<LOQ
|
<LOQ
|
<LOQ
|
<LOQ
|
<LOQ
|
<LOQ
|
<LOQ
|
<LOQ
|
|
Min
|
<0.1
|
<0.1
|
<0.5
|
<1
|
<5
|
<0.5
|
<0.1
|
<0.1
|
<0.1
|
0
|
|
Max
|
0.19
|
|
5
|
|
|
|
|
|
|
|
|
Samples >LOQ
|
1 (12%)
|
0
|
1 (12%)
|
0
|
0
|
0
|
0
|
0
|
0
|
0
|
PFPeS: perfluoropentane sulfonic acid; PFTeDA: perfluorotetradecanoic acid; PFUnDA: perfluoroundecanoic acid;PFUnDS: perfluoro(n-undecyl) sulfonic acid; PFBA: Perfluorobutanoic acid; PFOS: perfluorooctane sulfonic acid; PFOA: perfluorooctanoic acid; PFOSA: perfluorooctanesulfonamide and PFHxS: Perfluorohexanesulfonic acid
Table 15B. PFAS continued.
Mean and range (min-max) of PFAS (µg/kg wet weight) in fish feed, fishmeals, fish oils, plant meals and other feed ingredients in 2024. Mean is given when 20% or more of the results are over LOQ. [Gjennomsnitt og konsentrasjonsområde (min-maks) av per-og polyfluorerte forbindelser (PFAS, µg/kg våtvekt) i fullfôr, fiskemel, fiskeolje, plantemel og andre fôrmidler i 2024. Snittverdier er gitt der 20% eller mer av prøvesvarene er over LOQ].
| |
FOSA
|
PFBS
|
PFDA
|
PFDoDA
|
PFDS
|
PFHpA
|
PFHpS
|
PFHxA
|
PFHxDA
|
PFNS
|
|
Starter feed
|
|
|
|
|
|
|
|
|
|
|
|
n =
|
15
|
7
|
15
|
15
|
15
|
15
|
15
|
15
|
14
|
15
|
|
Mean (LB)
|
0.1
|
<LOQ
|
<LOQ
|
<LOQ
|
<LOQ
|
<LOQ
|
<LOQ
|
<LOQ
|
<LOQ
|
<LOQ
|
|
Min
|
<0.1
|
<0.2
|
<0.1
|
<0.1
|
<0.1
|
<0.1
|
<5
|
<0.5
|
<0.2
|
<0.1
|
|
Max
|
0.25
|
|
|
|
|
|
|
|
|
|
|
Samples >LOQ
|
11 (73%)
|
0
|
0
|
0
|
0
|
0
|
0
|
0
|
0
|
0
|
|
Smolt feed
|
|
|
|
|
|
|
|
|
|
|
|
n =
|
13
|
11
|
13
|
13
|
13
|
13
|
13
|
13
|
13
|
13
|
|
Mean (LB)
|
0.076
|
<LOQ
|
<LOQ
|
<LOQ
|
<LOQ
|
<LOQ
|
<LOQ
|
<LOQ
|
<LOQ
|
<LOQ
|
|
Min
|
<0.1
|
<0.2
|
<0.1
|
<0.1
|
<0.1
|
<0.1
|
<5
|
<0.5
|
<0.2
|
<0.1
|
|
Max
|
0.19
|
0.25
|
|
|
0.18
|
|
|
|
|
|
|
Samples >LOQ
|
7 (54%)
|
1 (9%)
|
0
|
0
|
1 (8%)
|
0
|
0
|
0
|
0
|
0
|
|
Growth feed
|
|
|
|
|
|
|
|
|
|
|
|
n =
|
71
|
56
|
71
|
71
|
71
|
71
|
71
|
71
|
71
|
71
|
|
Mean (LB)
|
0.038
|
<LOQ
|
<LOQ
|
<LOQ
|
<LOQ
|
<LOQ
|
<LOQ
|
<LOQ
|
<LOQ
|
<LOQ
|
|
Min
|
<0.1
|
<0.2
|
<0.1
|
<0.1
|
<0.1
|
<0.1
|
<5
|
<0.5
|
<0.2
|
<0.1
|
|
Max
|
0.26
|
|
|
|
|
|
|
|
|
|
|
Samples >LOQ
|
19 (27%)
|
0
|
0
|
0
|
0
|
0
|
0
|
0
|
0
|
0
|
|
Fishmeals
|
|
|
|
|
|
|
|
|
|
|
|
n =
|
8
|
1
|
9
|
9
|
9
|
9
|
9
|
9
|
9
|
9
|
|
Mean (LB)
|
0.27
|
-
|
<LOQ
|
0.032
|
<LOQ
|
<LOQ
|
<LOQ
|
<LOQ
|
<LOQ
|
<LOQ
|
|
Min
|
<0.1
|
-
|
<0.3
|
<0.1
|
<0.1
|
<0.1
|
<5
|
<0.5
|
<0.2
|
<0.1
|
|
Max
|
0.69
|
1.0
|
0.60
|
0.17
|
|
0.14
|
|
|
|
|
|
Samples >LOQ
|
7 (88%)
|
1 (100%)
|
1 (11%)
|
2 (22%)
|
0
|
1 (11%)
|
0
|
0
|
0
|
0
|
|
Fish oils
|
|
|
|
|
|
|
|
|
|
|
|
n =
|
8
|
9
|
9
|
0
|
0
|
9
|
9
|
0
|
9
|
0
|
|
Mean (LB)
|
<LOQ
|
<LOQ
|
0.062
|
<LOQ
|
<LOQ
|
<LOQ
|
<LOQ
|
<LOQ
|
<LOQ
|
<LOQ
|
|
Min
|
<5
|
<0.1
|
<0.1
|
|
|
<1
|
<0.1
|
|
<5
|
|
|
Max
|
|
|
0.41
|
|
|
|
|
|
|
|
|
Samples >LOQ
|
0
|
0
|
2 (22%)
|
0
|
0
|
0
|
0
|
0
|
0
|
0
|
|
Plant meals
|
|
|
|
|
|
|
|
|
|
|
|
n =
|
18
|
17
|
18
|
18
|
18
|
18
|
18
|
18
|
15
|
18
|
|
Mean (LB)
|
<LOQ
|
<LOQ
|
<LOQ
|
<LOQ
|
<LOQ
|
<LOQ
|
<LOQ
|
<LOQ
|
<LOQ
|
<LOQ
|
|
Min
|
<0.1
|
<0.2
|
<0.3
|
<0.1
|
<0.1
|
<0.1
|
<5
|
<0.5
|
<0.2
|
<0.1
|
|
Max
|
|
|
|
|
|
|
|
0.84
|
|
|
|
Samples >LOQ
|
0
|
0
|
0
|
0
|
0
|
0
|
0
|
1 (6%)
|
0
|
0
|
|
Other feed materials
|
|
|
|
|
|
|
|
|
|
|
|
n =
|
8
|
7
|
8
|
5
|
5
|
8
|
8
|
5
|
7
|
5
|
|
Mean (LB)
|
<LOQ
|
<LOQ
|
<LOQ
|
<LOQ
|
<LOQ
|
<LOQ
|
<LOQ
|
<LOQ
|
<LOQ
|
<LOQ
|
|
Min
|
<0.1
|
<0.1
|
<0.1
|
<0.1
|
<0.1
|
<0.1
|
<0.1
|
<0.5
|
<0.2
|
<0.1
|
|
Max
|
|
|
|
|
|
1.8
|
|
|
|
|
|
Samples >LOQ
|
0
|
0
|
0
|
0
|
0
|
1 (12%)
|
0
|
0
|
0
|
0
|
FOSA: perfluorooctane sulfonamide; PFBS: perfluorobutane sulfonic acid; PFDA: perfluorodecanoic acid; PFDoDA: perfluorododecanoic acid; PFDS: perfluorodecane sulfonic acid; PFHpA: perfluoroheptanoic acid; PFHpS: perfluoroheptane sulfonic acid; PFHxA: perfluorohexanoic acid; PFHxDA: perfluorohexadecanoic acid; PFNS: perfluorononane sulfonic acid
Table 16. PAHs
Mean and range (min-max) of PAH levels (µg/kg wet weight) in plant meals and insect meals in 2024. Mean is given when 20% or more of the results are over the LOQ. Mean and sum of PAH4 are given using «upper-bound LOQ»]. [Gjennomsnitt og konsentrasjonsområde (min-maks) av polysykliske aromatiske hydrokarboner (PAH, µg/kg våtvekt) i plantemel og insektmel i 2024. Snittverdier er gitt der 20% eller mer av prøvesvarene er over LOQ. Snitt og sum of PAH4 er gitt som «upper-bound LOQ»].
| |
5-MeC
|
B[a]A
|
B[a]P
|
B[b]F
|
B[c]F
|
B[ghi]P
|
B[j]F
|
B[k]F
|
CHRY
|
C[c,d]P
|
D[ah]A
|
D[a,e)P
|
D[a,h]P
|
D[a,i]P
|
D[a,l]P
|
IND
|
Sum PAH4
|
|
Plant meals
|
|
|
|
|
|
|
|
|
|
|
|
|
|
|
|
|
n = 19
|
|
|
|
|
|
|
|
|
|
|
|
|
|
|
|
|
Mean (UB)
|
<LOQ
|
0.22
|
0.17
|
0.18
|
<LOQ
|
0.16
|
<LOQ
|
<LOQ
|
0.29
|
<LOQ
|
<LOQ
|
<LOQ
|
<LOQ
|
<LOQ
|
<LOQ
|
<LOQ
|
0.81
|
|
Min
|
<0.07
|
<0.07
|
<0.07
|
<0.07
|
<0.07
|
<0.07
|
<0.07
|
<0.07
|
<0.07
|
<0.07
|
<0.07
|
<0.3
|
<0.3
|
<0.3
|
<0.3
|
<0.07
|
0.3
|
|
Max
|
|
1.2
|
0.8
|
1.2
|
0.1
|
1
|
0.6
|
0.6
|
1.9
|
0.5
|
0.2
|
|
|
|
|
1
|
4
|
|
Samples >LOQ
|
0
|
4 (21%)
|
4 (21%)
|
4 (21%)
|
2 (11%)
|
4 (21%)
|
3 (16%)
|
3 (16%)
|
5 (26%)
|
3 (16%)
|
1 (5%)
|
0
|
0
|
0
|
0
|
3 (16%)
|
19 (100%)
|
|
Insect meals
|
|
|
|
|
|
|
|
|
|
|
|
|
|
|
|
|
|
|
n = 4
|
|
|
|
|
|
|
|
|
|
|
|
|
|
|
|
|
|
|
Mean (UB)
|
<LOQ
|
<LOQ
|
<LOQ
|
<LOQ
|
<LOQ
|
<LOQ
|
0.08
|
<LOQ
|
<LOQ
|
<LOQ
|
<LOQ
|
<LOQ
|
<LOQ
|
<LOQ
|
<LOQ
|
<LOQ
|
0.33
|
|
Min
|
<0.08
|
<0.08
|
<0.08
|
<0.08
|
<0.08
|
<0.08
|
<0.08
|
<0.08
|
<0.08
|
<0.08
|
<0.08
|
<0.4
|
<0.4
|
<0.4
|
<0.4
|
<0.08
|
0.3
|
|
Max
|
|
|
|
|
|
|
0.09
|
|
|
|
|
|
|
|
|
|
0.4
|
|
Samples >LOQ
|
0
|
0
|
0
|
0
|
0
|
0
|
1 (25%)
|
0
|
0
|
0
|
0
|
0
|
0
|
0
|
0
|
0
|
4 (100%)
|
5-MeC; 5-methylchrysene; B[a]A: benzo[a]anthracene; B[a]P: Benzo[a]pyrene ; B[b]F: benzo[b]fluoranthene; B[c]F: Benzo(c)fluorene; B[ghi]P: Benzo[g,h,i]perylene; B[j]F: Benzo(j)fluoranthene; B[k]F: Benzo[k]fluoranthene; CHRY: Chrysene; C[c,d]P: Cyclopenta[c,d] pyrene; D[ah]A: Dibenz[ah]anthracene; D[a,e]P: Dibenzo[a,e]pyrene; D[a,h]P: Dibenzo[a,h]pyrene; D[a,i]P: Dibenzo[a,i]pyrene; D[a,l]P: Dibenzo[a,l]pyrene; IND: Indeno[1,2,3,-cd]pyrene; Sum PAH4: sum of B[a]A, B[a]P, CHRY and B[b]F
Table 17. Synthetic antioxidants
Mean and range (min-max) of propyl gallate, butylated hydroxyanisole (BHA), butylated hydroxytoluene (BHT), ethoxyquin (EQ) and ethoxyquin dimer (EQDM) (mg/kg wet weight) in fish feed (start feed, smolt feed and growing feed), fishmeal, fish oil, plant meal and insect meal in 2024. Mean values (“upper-bound”) are given with minimum and maximum values. The maximum limit for BHA + BHT in feed, alone or combined is 150 mg/kg. [Gjennomsnittskonsentrasjoner og konsentrasjonsområde (min-maks verdier) av butylhydroksyanisol (BHA), butylhydroksytoluen (BHT) og propylgallat (mg/kg våtvekt) i fiskefôr, fiskemel, vegetabilsk fôrmidler, fiskeolje og insektmel i 2024. Det høyeste tillatte innhold av BHA og BHT i fôr, alene eller for sum antioksidanter er 150 mg/kg. Snitt og sum er gitt som «upper bound» LOQ].
| |
Propyl gallate
|
BHA
|
BHT
|
EQ
|
EQDM
|
|
Starter feed
|
|
|
|
|
|
|
n =
|
15
|
15
|
15
|
0
|
0
|
|
Mean (UB)
|
<LOQ
|
4.0
|
14
|
|
|
|
Min
|
<10
|
<0.2
|
<0.2
|
|
|
|
Max
|
|
12
|
70
|
|
|
|
Samples >LOQ
|
0
|
13 (87%)
|
14 (93%)
|
|
|
|
Smolt feed
|
|
|
|
|
|
|
n =
|
13
|
13
|
13
|
0
|
0
|
|
Mean (UB)
|
<LOQ
|
7.0
|
18.9
|
|
|
|
Min
|
<10
|
<0.2
|
<0.2
|
|
|
|
Max
|
|
19
|
41
|
|
|
|
Samples >LOQ
|
0
|
12 (92%)
|
12 (92%)
|
|
|
|
Growth feed
|
|
|
|
|
|
|
n =
|
15
|
15
|
15
|
15
|
15
|
|
Mean (UB)
|
<LOQ
|
3.9
|
18.5
|
<LOQ
|
<LOQ
|
|
Min
|
<10
|
<0.2
|
8.6
|
<0.009
|
<0.07
|
|
Max
|
|
12
|
30
|
|
|
|
Samples >LOQ
|
0
|
14 (93%)
|
15 (100%)
|
0
|
0
|
|
Fishmeals
|
|
|
|
|
|
|
n =
|
9
|
9
|
9
|
9
|
9
|
|
Mean (UB)
|
<LOQ
|
1.6
|
35
|
<LOQ
|
<LOQ
|
|
Min
|
<10
|
<0.2
|
<0.2
|
<0.009
|
<0.07
|
|
Max
|
|
8.2
|
310
|
|
|
|
Samples >LOQ
|
0
|
3 (33%)
|
2 (22%)
|
0
|
0
|
|
Fish oils
|
|
|
|
|
|
|
n =
|
0
|
9
|
9
|
0
|
0
|
|
Mean (UB)
|
<LOQ
|
57
|
137
|
|
|
|
Min
|
|
<0.2
|
<0.2
|
|
|
|
Max
|
|
220
|
270
|
|
|
|
Samples >LOQ
|
0
|
8 (89%)
|
7 (78%)
|
|
|
|
Plant meals
|
|
|
|
|
|
|
n =
|
19
|
19
|
19
|
0
|
0
|
|
Mean (UB)
|
<LOQ
|
<LOQ
|
<LOQ
|
|
|
|
Min
|
<10
|
<0.2
|
<0.2
|
|
|
|
Max
|
19.8
|
|
|
|
|
|
Samples >LOQ
|
1 (5%)
|
0
|
0
|
|
|
|
Insect meals
|
|
|
|
|
|
|
n =
|
4
|
4
|
4
|
0
|
0
|
|
Mean (UB)
|
<LOQ
|
<LOQ
|
<LOQ
|
<LOQ
|
<LOQ
|
|
Min
|
<10
|
<0.2
|
<0.2
|
|
|
|
Max
|
|
|
|
|
|
|
Samples > LOQ
|
0
|
0
|
0
|
0
|
0
|
Table 18. Macrominerals
Mean and range (min-max) of calcium (Ca), potassium (K), magnesium (Mg), sodium (Na) and phosphorous (P) levels (g/kg wet weight) in start feed, smolt feed, growth feed and insect meal analysed in 2024. Mean is given using «upper-bound LOQ». [Gjennomsnitt og konsentrasjonsområde (min-maks) av kalsium (Ca), kalium (K), magnesium (Mg), natrium (Na) og fosfor (P) i fullfôr og insektmel i 2024 (oppgitt i g/kg våtvekt). Snittverdien er gitt som «upper-bound LOQ»].
| |
Ca
|
K
|
Mg
|
Na
|
P
|
|
Starter feed
|
|
|
|
|
|
|
n = 15
|
|
|
|
|
|
|
Mean (UB)
|
16.7
|
10.4
|
2.5
|
10.6
|
14.9
|
|
Min
|
8.7
|
8.4
|
2
|
3.5
|
11
|
|
Max
|
37
|
12
|
3
|
30
|
21
|
|
Smolt feed
|
|
|
|
|
|
|
n = 13
|
|
|
|
|
|
|
Mean (UB)
|
11
|
9.8
|
2.3
|
4.8
|
13
|
|
Min
|
5.0
|
8.6
|
1.9
|
1.2
|
11
|
|
Max
|
15
|
12
|
3.0
|
7.3
|
15
|
|
Growth feed
|
|
|
|
|
|
|
n = 20
|
|
|
|
|
|
|
Mean (UB)
|
7.6
|
9.1
|
2.0
|
3.2
|
10
|
|
Min
|
3.7
|
6.4
|
1.4
|
1.2
|
8.4
|
|
Max
|
18
|
11
|
2.6
|
8.5
|
14
|
|
Insect meals
|
|
|
|
|
|
|
n = 4
|
|
|
|
|
|
|
Mean (UB)
|
12
|
15
|
5.1
|
2.3
|
13
|
|
Min
|
11
|
9.3
|
4.9
|
1.2
|
12
|
|
Max
|
12
|
18
|
5.2
|
3.4
|
14
|
Table 19. Microminerals
Mean and range (min-max) of microminerals (mg/kg wet weight) in fish feed, fishmeal, insect meal and other feed ingredients analysed in 2024. Mean is given using «upper-bound LOQ». The maximum content in EC 1831/2003 for each element is given below the analyzed values in mg/kg. [Gjennomsnitt og konsentrasjonsområde (min-maks) av mikromineraler i fullfôr, fiskemel, insektmel og andre fôrmidler i 2024 (oppgitt i mg/kg våtvekt). Snittverdien er gitt som «upper-bound LOQ». Det høyeste tillate innhold spesifisert i EU regelverket for tilsetningsstoffer) er gitt under de analyserte verdiene, i mg/kg].
| |
Co (mg/kg)
|
Cr (mg/kg)
|
Cu (mg/kg)
|
Fe (mg/kg)
|
Mn (mg/kg)
|
Mo (mg/kg)
|
Se (mg/kg)
|
V (mg/kg)
|
Zn (mg/kg)
|
I (mg/kg)
|
|
Starter feed
|
|
|
|
|
|
|
|
|
|
|
|
n =
|
15
|
15
|
15
|
15
|
15
|
15
|
15
|
15
|
15
|
0
|
|
Mean (UB)
|
0.18
|
1.1
|
12
|
221
|
45
|
2.1
|
1.0
|
0.93
|
172
|
|
|
Min
|
0.09
|
0.28
|
3.6
|
110
|
12
|
0.15
|
0.66
|
0.33
|
130
|
|
|
Max
|
0.41
|
5.8
|
16
|
340
|
80
|
3.1
|
1.5
|
2.7
|
200
|
|
|
Smolt feed
|
|
|
|
|
|
|
|
|
|
|
|
n =
|
13
|
13
|
13
|
13
|
13
|
13
|
13
|
13
|
13
|
0
|
|
Mean (UB)
|
0.19
|
1.0
|
11
|
252
|
50
|
2.7
|
0.87
|
0.78
|
175
|
|
|
Min
|
0.11
|
0.19
|
6.4
|
130
|
22
|
0.60
|
0.55
|
0.32
|
130
|
|
|
Max
|
0.27
|
5.7
|
14
|
600
|
72
|
3.8
|
1.4
|
2.7
|
220
|
|
|
Growth feed
|
|
|
|
|
|
|
|
|
|
|
|
n =
|
71
|
71
|
71
|
71
|
71
|
71
|
71
|
71
|
71
|
20
|
|
Mean (UB)
|
0.21
|
0.45
|
10.9
|
188
|
45
|
2.2
|
0.68
|
0.46
|
170
|
2.7
|
|
Min
|
0.09
|
0.13
|
5.7
|
100
|
19
|
0.48
|
0.37
|
0.19
|
120
|
0.88
|
|
Max
|
0.88
|
3
|
17
|
470
|
68
|
3.9
|
1.3
|
2.8
|
220
|
4.3
|
|
Maximum content for salmonid feeds
|
1
|
-
|
25
|
750
|
100
|
2.5
|
0.5
|
-
|
180
|
20
|
|
Fishmeals
|
|
|
|
|
|
|
|
|
|
|
|
n =
|
9
|
9
|
9
|
9
|
9
|
9
|
9
|
9
|
9
|
0
|
|
Mean (UB)
|
0.07
|
0.46
|
3.1
|
136
|
6.4
|
0.22
|
2.5
|
0.85
|
67.8
|
|
|
Min
|
0.03
|
0.12
|
2.5
|
85
|
3.1
|
<0.09
|
1.9
|
0.18
|
50
|
|
|
Max
|
0.20
|
0.81
|
4.4
|
250
|
13
|
1.0
|
3.3
|
1.5
|
100
|
|
|
Samples >LOQ
|
8 (89%)
|
9 (100%)
|
9 (100%)
|
9 (100%)
|
9 (100%)
|
3 (33%)
|
9 (100%)
|
9 (100%)
|
9 (100%)
|
|
|
Insect meals
|
|
|
|
|
|
|
|
|
|
|
|
n =
|
4
|
4
|
4
|
4
|
4
|
4
|
4
|
4
|
4
|
0
|
|
Mean (UB)
|
<LOQ
|
0.38
|
12.5
|
165
|
432
|
0.75
|
0.14
|
0.03
|
185
|
|
|
Min
|
<0.02
|
0.14
|
11
|
150
|
410
|
0.53
|
0.12
|
0.02
|
160
|
|
|
Max
|
|
0.80
|
15
|
190
|
470
|
1
|
0.17
|
0.05
|
220
|
|
|
Samples >LOQ
|
0
|
4 (100%)
|
4 (100%)
|
4 (100%)
|
4 (100%)
|
3 (75%)
|
4 (100%)
|
3 (75%)
|
4 (100%)
|
|
|
Other feed materials*
|
|
|
|
|
|
|
|
|
|
|
|
n = 8
|
8
|
8
|
8
|
8
|
8
|
8
|
8
|
8
|
8
|
0
|
|
Mean (UB)
|
0.09
|
0.09
|
7.1
|
19
|
6.4
|
1.3
|
0.60
|
0.03
|
18
|
|
|
Min
|
<0.01
|
<0.01
|
<0.05
|
0.87
|
0.17
|
<0.05
|
<0.005
|
<0.002
|
<0.3
|
|
|
Max
|
0.44
|
0.23
|
25
|
56
|
20
|
9.6
|
4.7
|
0.15
|
51
|
|
|
Samples >LOQ
|
4 (50%)
|
5 (62%)
|
4 (50%)
|
8 (100%)
|
8 (100%)
|
4 (50%)
|
2 (25%)
|
4 (50%)
|
6 (75%)
|
|
Cobalt (Co); chromium (Cr); copper (Cu); iron (Fe); manganese (Mn); molybdum (Mo); selenium (Se); vanadium (V); zinc (Zn); iodine (I). * Other feed materials include: insect oil, algae oil, krill meal and prebiotic yeast
Table 20. Vitamin E
Mean and range (min-max) of vitamin E (alpha-, beta-, gamma- and delta-tocopherol, and sum tocopherols, and alpha-, beta-, gamma- and delta- tocotrienol, and sum tocotrienols) levels (mg/kg wet weight) in plant meals. fishmeals and insect meals in 2024. Means and sums are given as "upper boud LOQ". [Gjennomsnitt og konsentrasjonsområde (min-maks) av vitamin E (i form av alfa-, beta-, gamma- og delta-tokoferol, og sum tokoferoler, og alfa, beta, gamma og delta-tokotrienol, og sum tokotrienoler) i plantemel, fiskemel og insektmel i 2024 (oppgitt i mg/kg våtvekt). Snittverdier og sum er gitt som "upper bound LOQ"].
|
|
alpha-tocopherol
|
beta-tocopherol
|
gamma-tocopherol
|
delta-tocopherol
|
Sum Tocopherols
|
alpha-tocotrienol
|
beta-tocotrienol
|
gamma-tocotrienol
|
delta-tocotrienol
|
Sum Tocotrienols
|
|
Plant meals
|
|
|
|
|
|
|
|
|
|
|
|
n = 19
|
|
|
|
|
|
|
|
|
|
|
|
Mean (UB)
|
7.4
|
2.4
|
22
|
2.3
|
34
|
3.6
|
5.5
|
5.7
|
<LOQ
|
15.4
|
|
Min
|
0.32
|
<0.04
|
<0.04
|
<0.04
|
2.4
|
<0.08
|
<0.08
|
<0.08
|
<0.04
|
0.28
|
|
Max
|
41
|
11.4
|
86
|
15.6
|
137
|
46
|
53
|
59
|
6
|
110
|
|
Samples >LOQ
|
19 (100%)
|
18 (95%)
|
18 (95%)
|
16 (84%)
|
19 (100%)
|
6 (32%)
|
15 (79%)
|
6 (32%)
|
3 (16%)
|
17 (89%)
|
|
Fishmeals
|
|
|
|
|
|
|
|
|
|
|
|
n = 9
|
|
|
|
|
|
|
|
|
|
|
|
Mean (UB)
|
20
|
2.2
|
36
|
14.8
|
73
|
0.15
|
0.46
|
2.3
|
<LOQ
|
3.0
|
|
Min
|
8.6
|
<0.04
|
0.68
|
<0.04
|
9.4
|
<0.08
|
<0.08
|
<0.08
|
<0.04
|
0.28
|
|
Max
|
40
|
8.2
|
116
|
40
|
204
|
0.6
|
1.8
|
20
|
|
20
|
|
Samples above >LOQ
|
9 (100%)
|
8 (89%)
|
9 (100%)
|
8 (89%)
|
9 (100%)
|
2 (22%)
|
3 (33%)
|
3 (33%)
|
0
|
5 (56%)
|
|
Insect meals
|
|
|
|
|
|
|
|
|
|
|
|
n = 4
|
|
|
|
|
|
|
|
|
|
|
|
Mean (UB)
|
60
|
13.3
|
182
|
64
|
320
|
1.4
|
7.7
|
3.5
|
0.16
|
12.7
|
|
Min
|
32
|
11.9
|
91
|
33
|
168
|
0.33
|
2.8
|
<0.08
|
<0.04
|
3.5
|
|
Max
|
91
|
16.7
|
300
|
105
|
512
|
3
|
22
|
9.1
|
0.5
|
28.2
|
|
Samples >LOQ
|
4 (100%)
|
4 (100%)
|
4 (100%)
|
4 (100%)
|
4 (100%)
|
4 (100%)
|
4 (100%)
|
3 (75%)
|
1 (25%)
|
4 (100%)
|
5. Figures
Figure 1. Profile of pesticide residues in fish feed samples collected in 2024. Selected pesticides are shown that were detected most frequently (vertical axis) against their measured concentrations (horizontal axis). The following four pesticides were detected in all analyzed samples: p,p’-DDE, and p,p’-DDD (Table 9), pirimiphos-methyl and chlorpyrifos (Table 10). The highest measured pesticide concentration in any sample in 2024 was glyphosate (340 µg/kg, Table 11). [Profil av pesticid rester i fôrprøver fra 2024. Et utvalg av pesticider som ble detektert mest hyppig (Y-aksen) er plottet mot konsentrasjon (X-aksen). Alle fôr inneholdt pesticidene p,p’-DDE og p,p’-DDD (Tabell 9), pirimifos-metyl og klorpyrifos (Tabell 10). Høyeste persticid konsentrasjon malt i 2024 prøver var glyfosat (340 µg/kg, Tabell 11)].
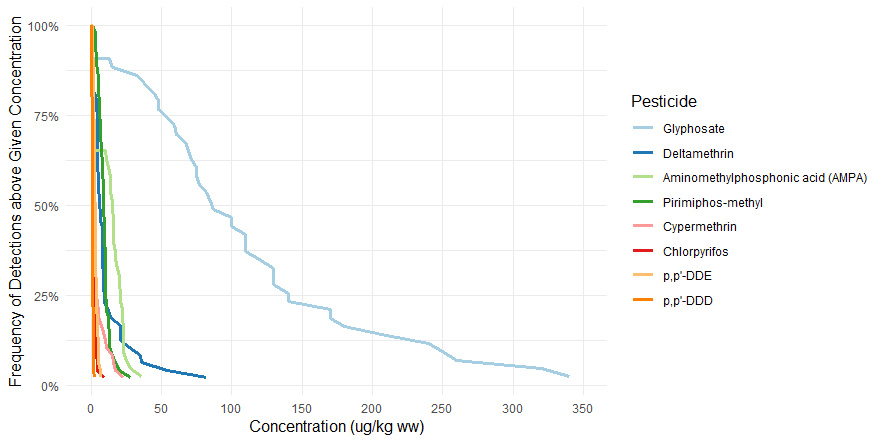
6. References
1. EC. Guidance document on the estimation of LOD and LOQ for measurements in the field of contaminants in feed and food; European Commission, Joint Research Centre, 2016. https://op.europa.eu/en/publication-detail/-/publication/200cf09a-9ad1-11e6-868c-01aa75ed71a1.
2. Codex Alimentarius. Code of practice for the prevention and reduction of dioxins, dioxin-like PCBs and non-dioxin-like PCBs in food and feed. International food standards; 2006. https://www.fao.org/fao-who-codexalimentarius/sh-proxy/en/?lnk=1&url=https%253A%252F%252Fworkspace.fao.org%252Fsites%252Fcodex%252FStandards%252FCXC%2B62-2006%252FCXC_062e.pdf.
3. Soderstrom, S.; Softeland, L.; Sele, V.; Lundebye, A. K.; Berntssen, M. H.; Lie, K. K. Enniatin B and beauvericin affect intestinal cell function and hematological processes in Atlantic salmon (Salmo salar) after acute exposure. Food Chem Toxicol 2023, 172, 113557. DOI: 10.1016/j.fct.2022.113557
4. Berntssen, M. H. G.; Fjeldal, P. G.; Gavaia, P. J.; Laize, V.; Hamre, K.; Donald, C. E.; Jakobsen, J. V.; Omdal, A.; Soderstrom, S.; Lie, K. K. Dietary beauvericin and enniatin B exposure cause different adverse health effects in farmed Atlantic salmon. Food Chem Toxicol 2023, 174. DOI: 10.1016/j.fct.2023.113648
5. Sele, V.; Lundebye, A.-K.; Storesund, J.; Berntssen, M. H. G.; Lie, K. K.; Prabhu, A.; Nøstbakken, O. J.; Waagbø, R.; Ørnsrud, R. Monitoring program for fish feed: Annual report for samples collected in 2021; Havforskningsinsituttet, Mattilsynet, Bergen, 2022. https://www.hi.no/hi/nettrapporter/rapport-fra-havforskningen-2022-22.
6. Efsa Panel on Contaminants in the Food Chain; Knutsen, H. K.; Alexander, J.; Barregard, L.; Bignami, M.; Bruschweiler, B.; Ceccatelli, S.; Cottrill, B.; Dinovi, M.; Edler, L.; et al. Risk for animal and human health related to the presence of dioxins and dioxin-like PCBs in feed and food. EFSA J 2018, 16 (11), e05333. DOI: 10.2903/j.efsa.2018.5333
7. Shiogiri, N. S.; Paulino, M. G.; Carraschi, S. P.; Baraldi, F. G.; da Cruz, C.; Fernandes, M. N. Acute exposure of a glyphosate-based herbicide affects the gills and liver of the Neotropical fish, Piaractus mesopotamicus. Environ Toxicol Pharmacol 2012, 34 (2), 388-396. DOI: 10.1016/j.etap.2012.05.007
8. Softeland, L.; Olsvik, P. A. In vitro toxicity of glyphosate in Atlantic salmon evaluated with a 3D hepatocyte-kidney co-culture model. Food Chem Toxicol 2022, 164. DOI: 10.1016/j.fct.2022.113012
9. EFSA. Scientific Opinion on Polybrominated Diphenyl Ethers (PBDEs) in Food. EFSA Panel on Contaminants in the Food Chain (CONTAM). EFSA Journal 2011, 9 (5), 2156. DOI: 10.2903/j.efsa.2011.2156
10. Efsa Panel on Contaminants in the Food Chain; Schrenk, D.; Bignami, M.; Bodin, L.; Chipman, J. K.; Del Mazo, J.; Grasl-Kraupp, B.; Hogstrand, C.; Hoogenboom, L. R.; Leblanc, J. C.; et al. Update of the risk assessment of hexabromocyclododecanes (HBCDDs) in food. EFSA J 2021, 19 (3), e06421. DOI: 10.2903/j.efsa.2021.6421
11. Efsa Panel on Contaminants in the Food Chain; Schrenk, D.; Bignami, M.; Bodin, L.; Chipman, J. K.; Del Mazo, J.; Grasl-Kraupp, B.; Hogstrand, C.; Hoogenboom, L. R.; Leblanc, J. C.; et al. Update of the scientific opinion on tetrabromobisphenol A (TBBPA) and its derivatives in food. EFSA J 2024, 22 (7), e8859. DOI: 10.2903/j.efsa.2024.8859
12. Efsa Panel on Contaminants in the Food Chain; Knutsen, H. K.; Akesson, A.; Bampidis, V.; Bignami, M.; Bodin, L.; Chipman, J. K.; Degen, G.; Hernandez-Jerez, A.; Hofer, T.; et al. Update of the risk assessment of brominated phenols and their derivatives in food. EFSA J 2024, 22 (10), e9034. DOI: 10.2903/j.efsa.2024.9034
13. Efsa Panel on Contaminants in the Food Chain; Schrenk, D.; Bignami, M.; Bodin, L.; Chipman, J. K.; Del Mazo, J.; Grasl-Kraupp, B.; Hogstrand, C.; Hoogenboom, L. R.; Leblanc, J. C.; et al. Risks for animal and human health related to the presence of polychlorinated naphthalenes (PCNs) in feed and food. EFSA J 2024, 22 (3), e8640. DOI: 10.2903/j.efsa.2024.8640
14. Suominen, K.; Hallikainen, A.; Ruokojarvi, P.; Airaksinen, R.; Koponen, J.; Rannikko, R.; Kiviranta, H. Occurrence of PCDD/F, PCB, PBDE, PFAS, and organotin compounds in fish meal, fish oil and fish feed. Chemosphere 2011, 85 (3), 300-306. DOI: 10.1016/j.chemosphere.2011.06.010
15. Li, X.; Dong, S.; Zhang, W.; Fan, X.; Wang, R.; Wang, P.; Su, X. The occurrence of perfluoroalkyl acids in an important feed material (fishmeal) and its potential risk through the farm-to-fork pathway to humans. J Hazard Mater 2019, 367, 559-567. DOI: 10.1016/j.jhazmat.2018.12.103
16. Koloka, O.; Boti, V.; Hela, D.; Albanis, T.; Konstantinou, I. PFAS residue analysis in fish and fish feed by applying a modified QuEChERS method in combination with LC-HRMS detection. Emerging Contaminants 2025, 11 (2). DOI: 10.1016/j.emcon.2025.100467
17. Lundebye, A.-K.; Lie, K. K.; Storesund, J.; Sele, V. Monitoring program for fish feed: Annual report for samples collected in 2023; Havforskningsinsituttet, Mattilsynet, Bergen, 2024.
18. Granby, K.; Sørensen, S. Study on PFAS levels in Danish organic eggs. In Workshop European Fishmeal health and safety in relation to PFAS contamination, Copenhagen, 22nd March, 2023; European fishmeal and fish oil producers.
19. Zafeiraki, E.; Gebbink, W. A.; Hoogenboom, R.; Kotterman, M.; Kwadijk, C.; Dassenakis, E.; van Leeuwen, S. P. J. Occurrence of perfluoroalkyl substances (PFASs) in a large number of wild and farmed aquatic animals collected in the Netherlands. Chemosphere 2019, 232, 415-423. DOI: 10.1016/j.chemosphere.2019.05.200
20. El‐Sayed, A. F. M.; Izquierdo, M. The importance of vitamin E for farmed fish—A review. Reviews in Aquaculture 2021, 14 (2), 688-703. DOI: 10.1111/raq.12619